General features of the retinal connectome determine the computation of motion anticipation
- University of Sussex, United Kingdom
Figures
Figure 1
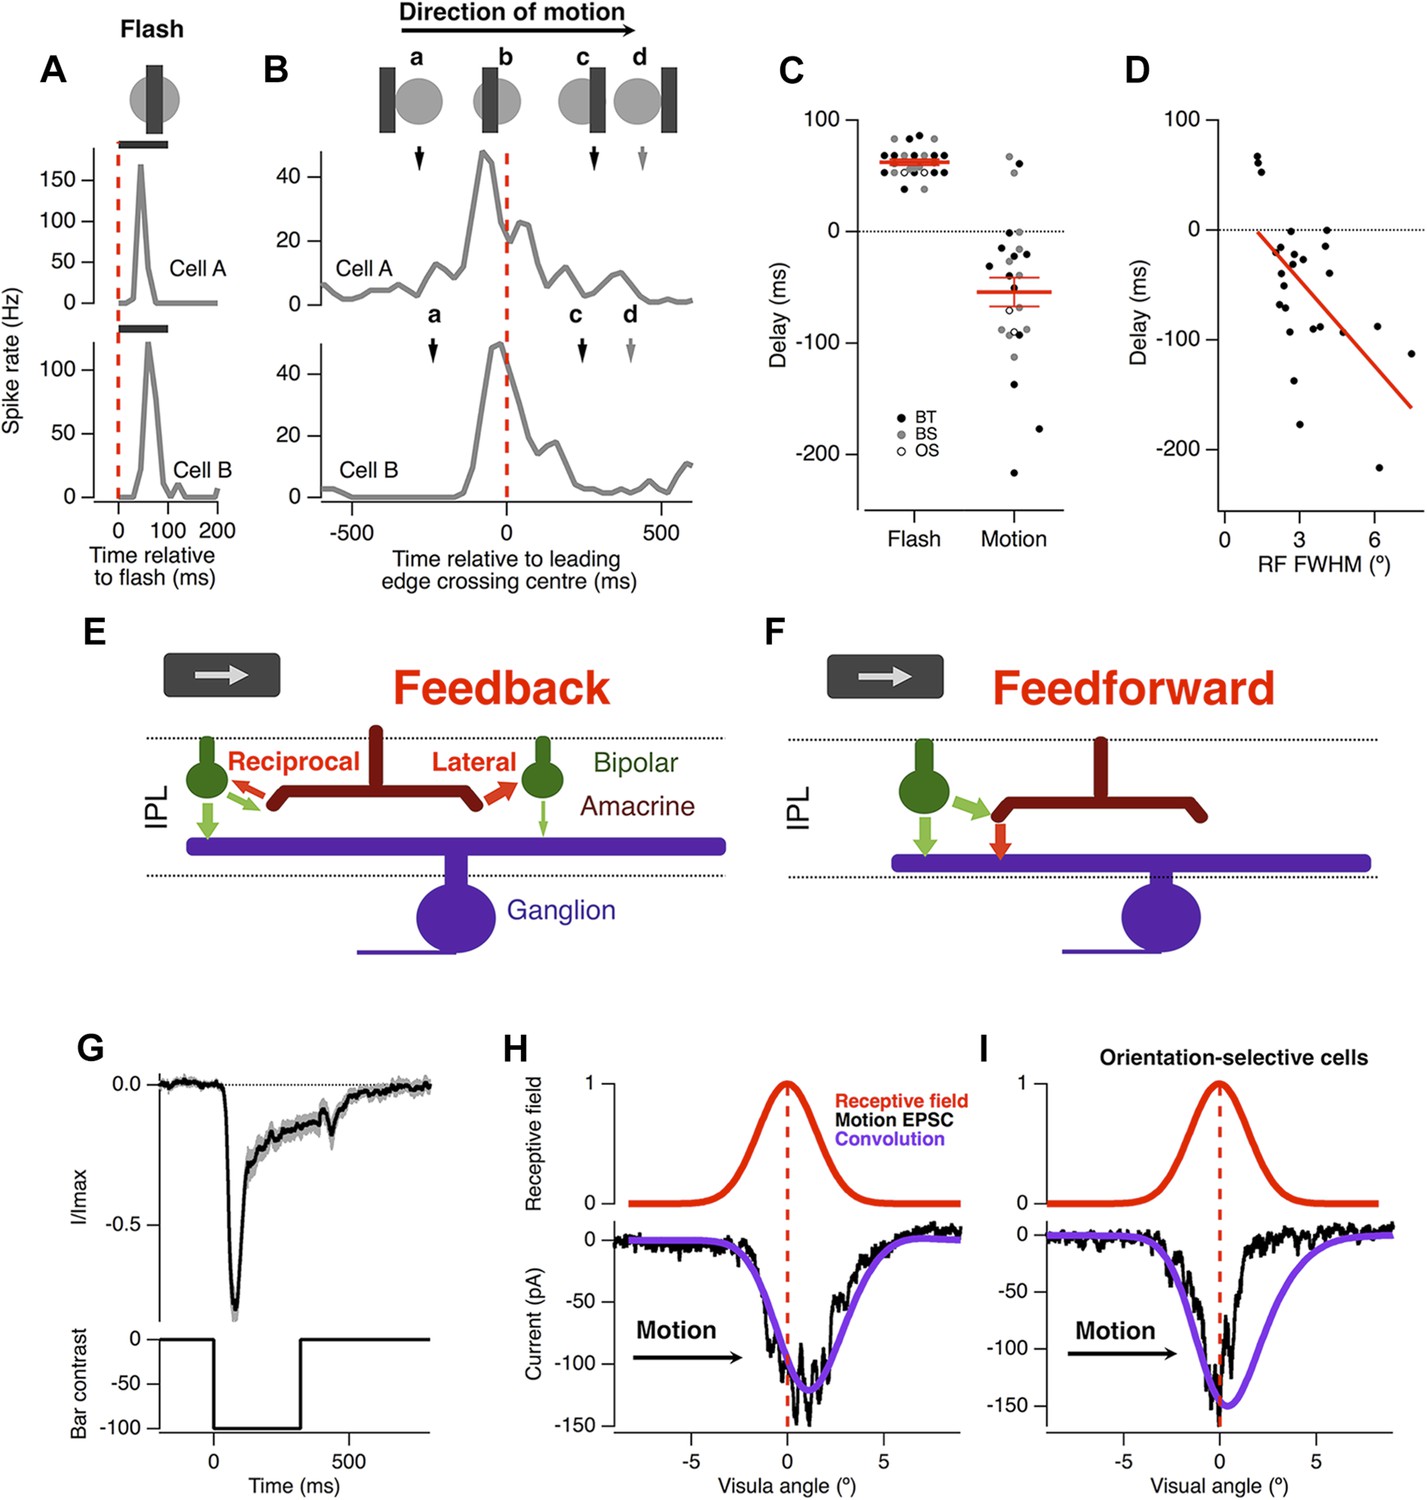
Motion anticipation in the retina is not due to a gain change in bipolar cells.
(A) An example of two ganglion cells responding to a bar flashed on their receptive field centres for 100 ms (−100% contrast). (B) The response of the same cells to a bar of width 160 µm (2.4º) moving at 500 µm s−1 (7.5º s−1). The position of the bar relative to a cell's receptive field is shown above for the different time points indicated by the lettered arrows. (C) A comparison of the delay for the maximal response to a flashed stimulus (62 ± 2.6 ms) and the time of maximal spiking to a moving stimulus relative to the time at which the stimulus reached the centre of the RF (−46 ± 12.6 ms; n = 25 ganglion cells; p < 0.0001). BT = Brisk-transient, BS = Brisk Sustained, OS = Orientation-selective, see ‘Materials and methods’ for cell classification. (D) The degree of motion anticipation was correlated with the RF size (Pearson's r = −0.593, n = 25). (E) Schematic of retinal feedback circuits in the inner plexiform layer (IPL), excitation and inhibition are represented by green and red arrows respectively. (F) Schematic of feed-forward inhibition in the IPL. (G) The dynamics of the EPSC evoked by a −100% contrast bar flashed over the RGCs RF centre for 320 ms. Individual cells were normalised before averaging (n = 12, SEM in grey). (H) Example of the EPSC recorded as a bar moves across the receptive field of an OFF ganglion cell (average of six presentations). The peak EPSC lags behind the receptive field centre by 79 ± 17 μm (1.2 ± 0.3º, n = 7). The purple line indicates the expected linear response obtained from convolution of the receptive field with the EPSC in F. The motion evoked EPSC was not significantly different from the expected linear response, indicating that lateral inhibition is not present (using the Kolmogorov–Smirnov test, n = 7). (I) Orientation selective cells did show a clear indication of lateral inhibition (n = 2).
Figure 2
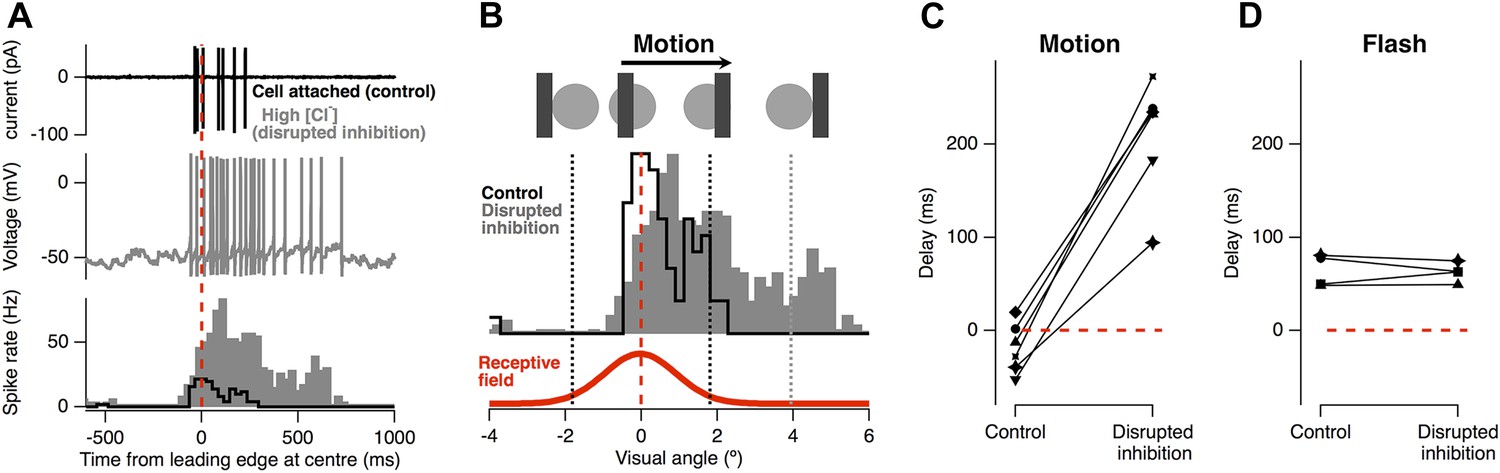
Feed-forward inhibition is necessary for motion anticipation.
(A) Top: cell-attached recording from a single RGC as a 160 µm bar moves across the retina at 500 µm s−1 (7.5° s−1). Middle: whole-cell recording in the same cell 15 min after going whole-cell with 120 mM Cl− in the pipette. Bottom: spike-time histograms calculated from 20 repetitions of the stimulus for each condition. (B) The normalised spike rates from a plotted as a function of the distance of the bars leading edge from the RF centre, which is shown below in red. (C) When inhibition was disrupted by introduction of high Cl−, the peak spike rate shifted from −18 ± 11 ms before the leading edge reached the centre to 209 ± 26 ms after the centre was traversed (n = 6; p = 0.0002). (D) The delay in response to a flash was not affected by disruption of inhibition (64.4 ± 8.7 ms vs 62.7 ± 5.2 ms, n = 4).
Figure 3 with 1 supplement

Motion anticipation in model ganglion cells depends on feedforward inhibition.
(A) The time course of the synaptic inputs used in the model were constructed with piecewise functions fit to the synaptic conductance evoked from a 320 ms −100% contrast step over the RF centre, equivalent to the stimulus that the moving bar generates at any one point on the retina (average data shown in black and fits in colour; see ‘Materials and methods’). (B) The inhibitory-to-excitatory conductance ratio measured over the RF centre in response to −100% contrast bar was 2.1 ± 0.23 (n = 10). (C) Line drawings of the 3 RGCs used for modeling, with Sholl plots to their right indicating the number of dendritic crossings for spheres of increasing distance from the soma. Excitatory synapses were placed randomly across the dendritic trees to give an average inter-synapse distance of 4.7 µm. Inhibitory synapses were also distributed randomly giving inhibitory to excitatory synapse ratios of 2.36:1, 2.04:1 and 2.41:1 for the three RGCs shown. All synapses had identical weights. (D) The output of each model RGC in response to a 160 µm bar moving across its dendritic field at 500 µm s−1, with (black) and without inhibition (grey), the corresponding RF is shown below in red. (E) Motion anticipation was robust to changes in the membrane resistance (Rm) and axial resistance (Ri).
Figure 3—figure supplement 1
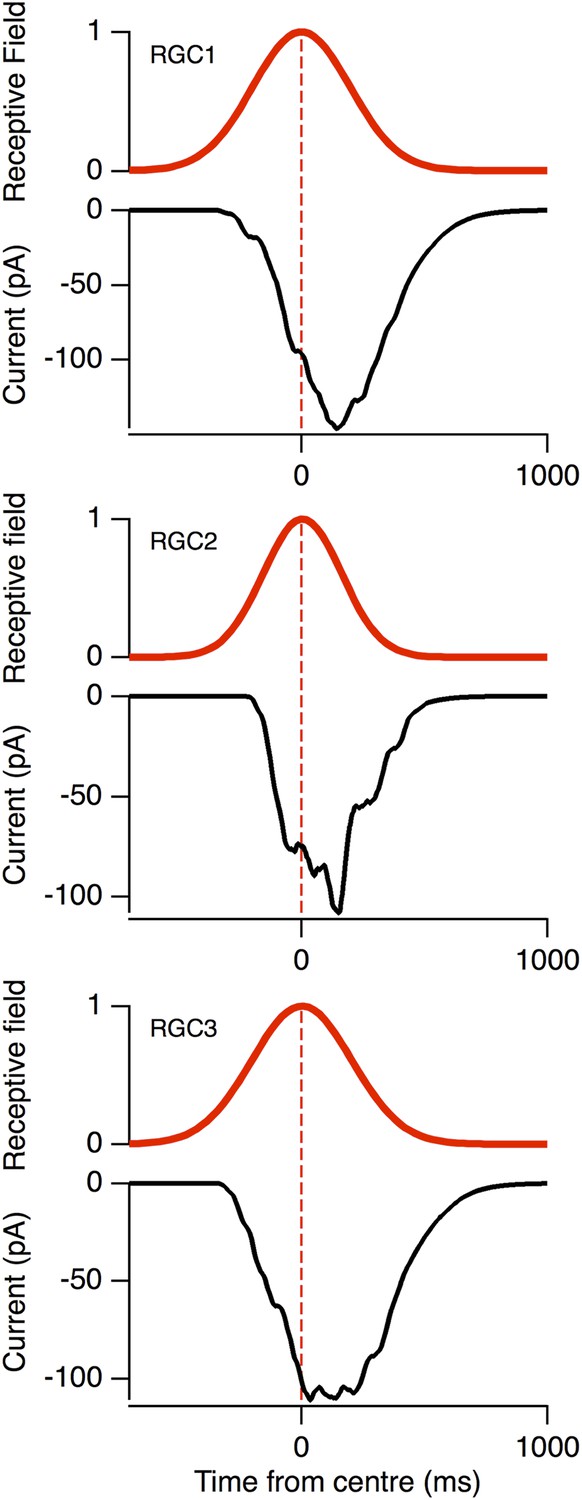
The voltage-clamped EPSCs (black) in response to the same moving stimuli as Figure 3D, plotted relative to the RF (red).
Note the peak EPSC occurred with a delay for the three model RGCs, similar to the data in Figure 1H.
Figure 4
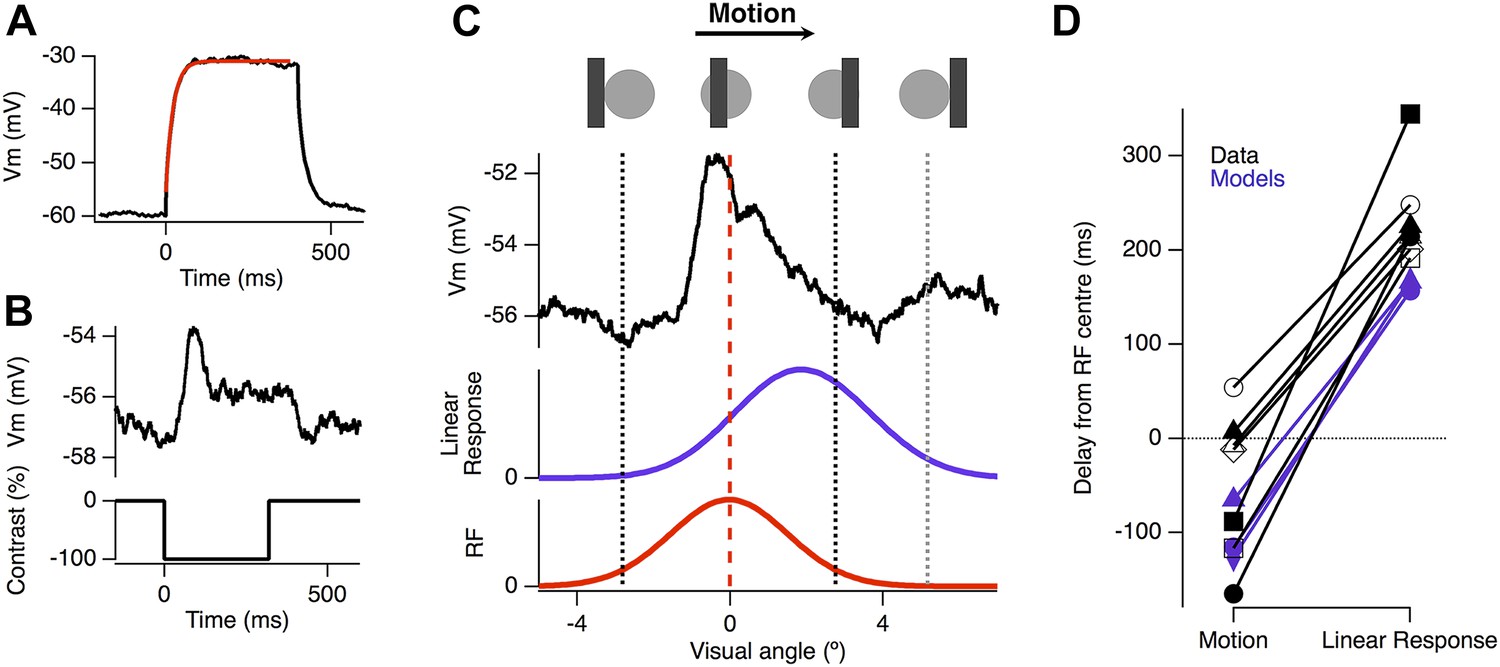
Motion anticipation is evident in the EPSPs of ganglion cells with passive dendrites.
(A) Ganglion cells were dialyzed with 2 mM MK801 and 10 mM QX-314-Bromide. The efficacy of these drugs was assessed by attempting to fit a large step depolarization with a single exponential; the depolarization was well fit after 10 min of dialysis. (B) The EPSP evoked by a 160 µm (2.4º) bar flashed for 320 ms over the RF centre of the same ganglion cell in a with passive dendrites. (C) Example of the EPSP recorded as a bar moves across the receptive field of an OFF ganglion cell (average of 10 presentations). The EPSP is plotted as a function of the bar's location within the RF and the purple trace below, shows the expected linear response obtained by convolution of the EPSP from B with the RF. (D) The average delay for EPSPs in RGCs with passive dendrites was −47.2 ± 29.4 ms, whereas the expected linear response was always delayed with an average of 233.84 ± 19.6 ms (n = 7, p = 0.0002). The delays for the three models are shown in purple, with the linear response representing the model with only excitation.
Figure 5
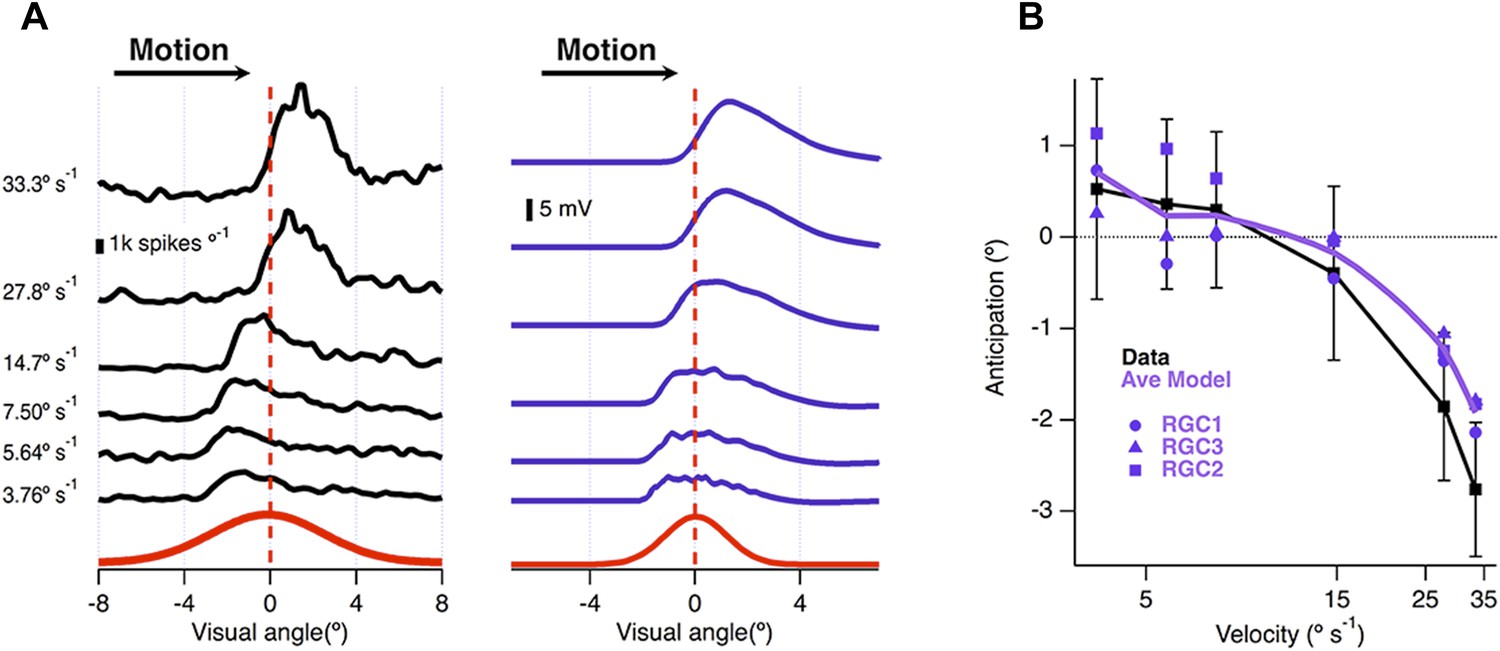
Velocity-dependence of motion anticipation.
(A) Black traces show the spike histograms from a single cell for a 160 µm bar moving at different velocities plotted against the position of the leading edge relative to the RF centre (average of 30 presentations). Purple traces show the average response of the model (RGC2) to the same stimulus parameters, with an I/E ratio of 2.04:1. Note that the peak EPSP starts to lag behind the receptive field centre at higher velocities. (B) The average amount of anticipation plotted against velocity for 26 OFF ganglion cells (black, ±SD). Motion anticipation operated until a velocity of about 1 mm s−1 , as also predicted by the three models (purple).
Figure 6

A biophysical explanation of motion anticipation.
(A) Heat plots of the voltage across the dendritic tree of a simplified model RGC as a function of time in response to a moving bar. The voltage at the soma is plotted below. Left: with only excitation present the somatic voltage follows the voltage seen in the dendrites. Right: with inhibition present, the somatic voltage only followed dendritic excitation in the first half of the RF, then hyperpolarized as the bar moved across the remainder. Note: the arrow marked a represents the stimulus entering the RF; b is time zero, when the leading edge reaches the RF centre, and c marks the leading edge reaching the distal edge of the dendritic field. (B) The positions of inhibitory synapses (red) relative to excitatory synapses (green) strongly affects the depolarisation observed at the soma. Left: For a stimulus moving across the initial half of the RF, distal inhibition is activated first attenuating depolarisation of the soma only modestly. The red voltage trace is the somatic response with inhibition present and the green trace is with only excitation. Middle: Proximal inhibition in the initial half of the receptive field has little effect on spiking as these synapses are activated later than the distal excitation. Right: For a stimulus moving across the distal half of the RF, proximal inhibition is activated before distal excitation and is very effective at reducing depolarisation of the soma by more distal excitatory synapses.
Figure 7
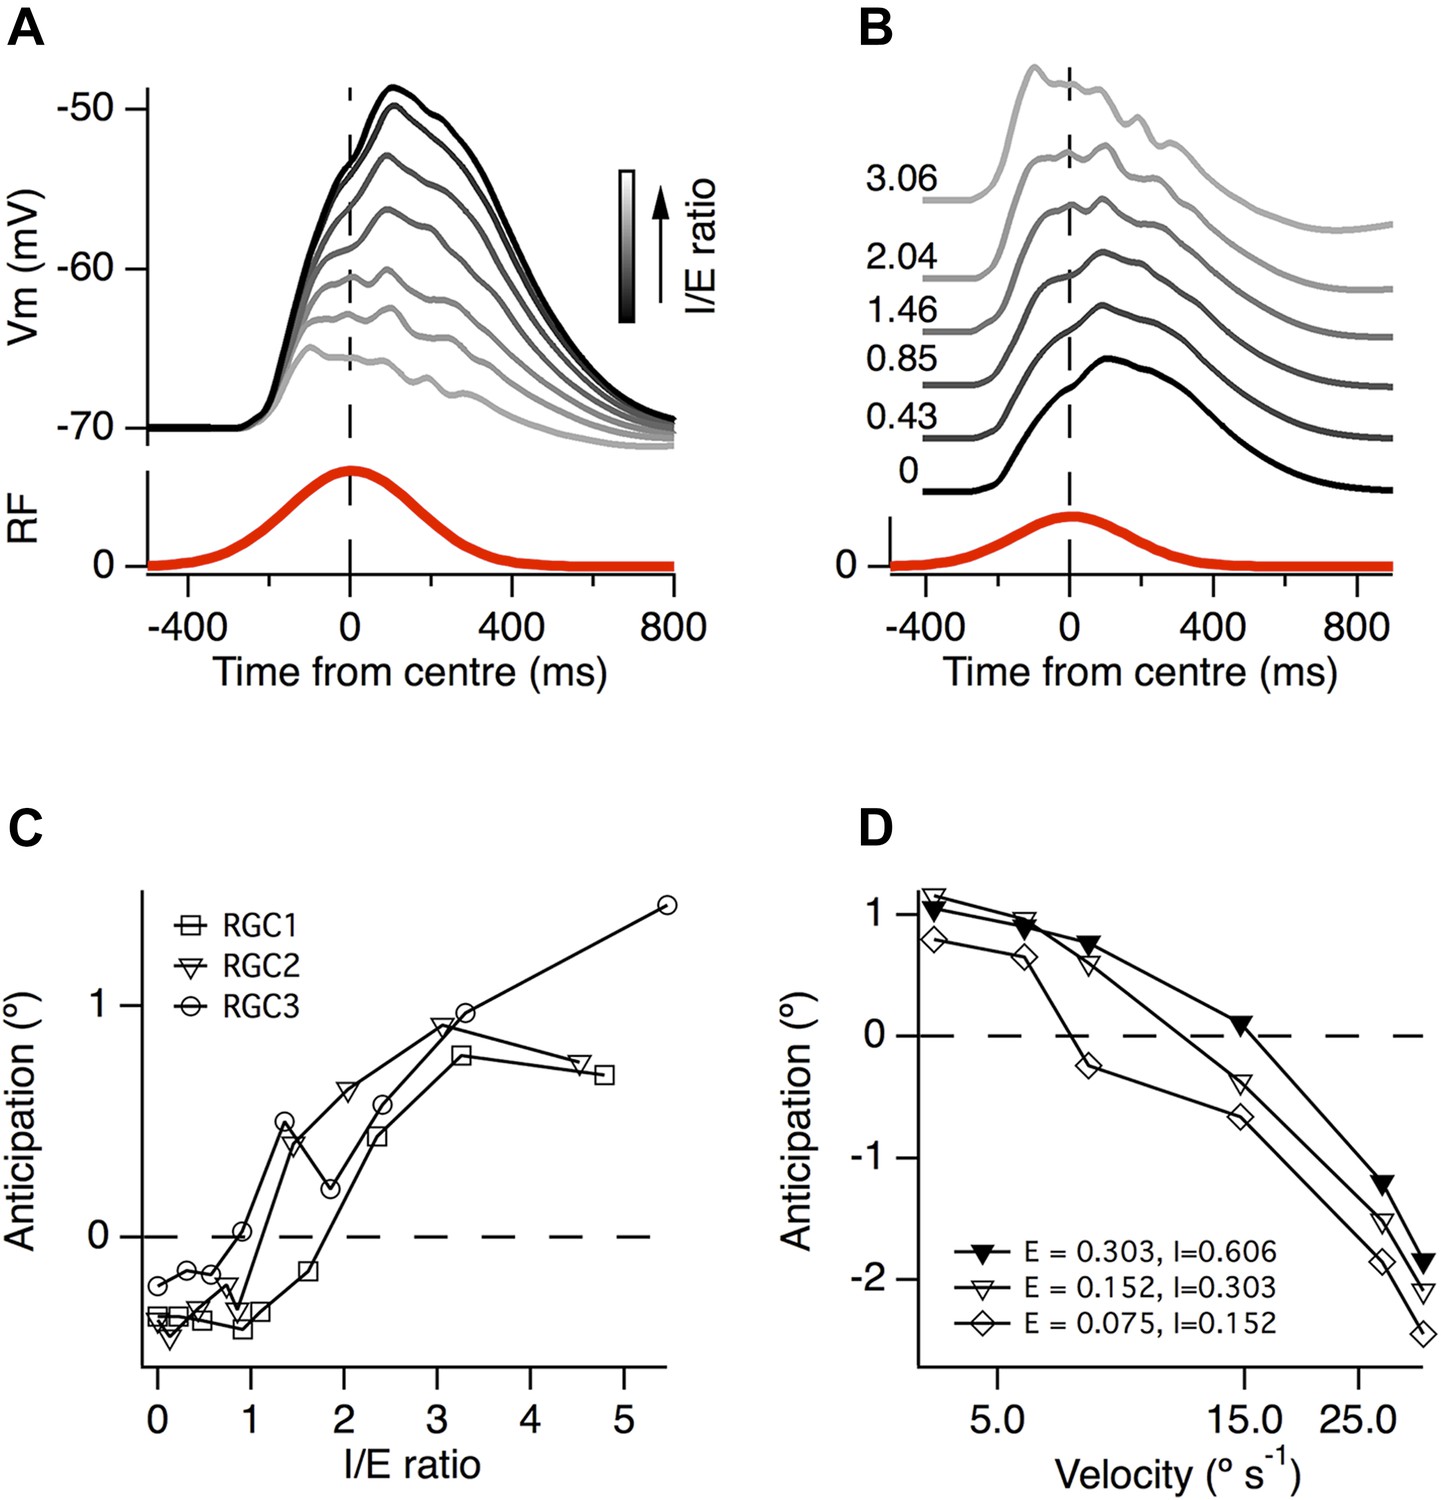
A greater ratio of inhibition to excitation is important for motion anticipation.
(A) The output of a model RGC in response to the standard moving stimulus for various ratios of inhibitory to excitatory synapses. The number of excitatory synapses was fixed and the darkest trace represents 0 inhibitory synapses. As expected the amplitude of the response becomes smaller with increased inhibition. (B) The amplitudes of the EPSPs in a, normalised to compare the time course of the EPSPs. Note that as inhibition increases the peak of the EPSP moves forward in time, no longer occurring with a delay. (C) The amount of motion anticipation plotted as a function of the inhibition to excitation ratio (I/E). Note that motion anticipation emerges as the inhibitory synapses start to outnumber the excitatory. (D) The velocity dependence of motion anticipation was influenced by the synaptic density. The density of synapses was varied for RGC2 while keeping the I/E ratio fixed. Densities shown for excitatory (E) and inhibitory (I) as synapses µm−1.
Download links
A two-part list of links to download the article, or parts of the article, in various formats.
Downloads (link to download the article as PDF)
Open citations (links to open the citations from this article in various online reference manager services)
Cite this article (links to download the citations from this article in formats compatible with various reference manager tools)
General features of the retinal connectome determine the computation of motion anticipation
eLife 4:e06250.
https://doi.org/10.7554/eLife.06250


