Serotonergic neurons signal reward and punishment on multiple timescales
- Harvard University, United States
- The Johns Hopkins University School of Medicine, United States
Figures
Figure 1 with 2 supplements
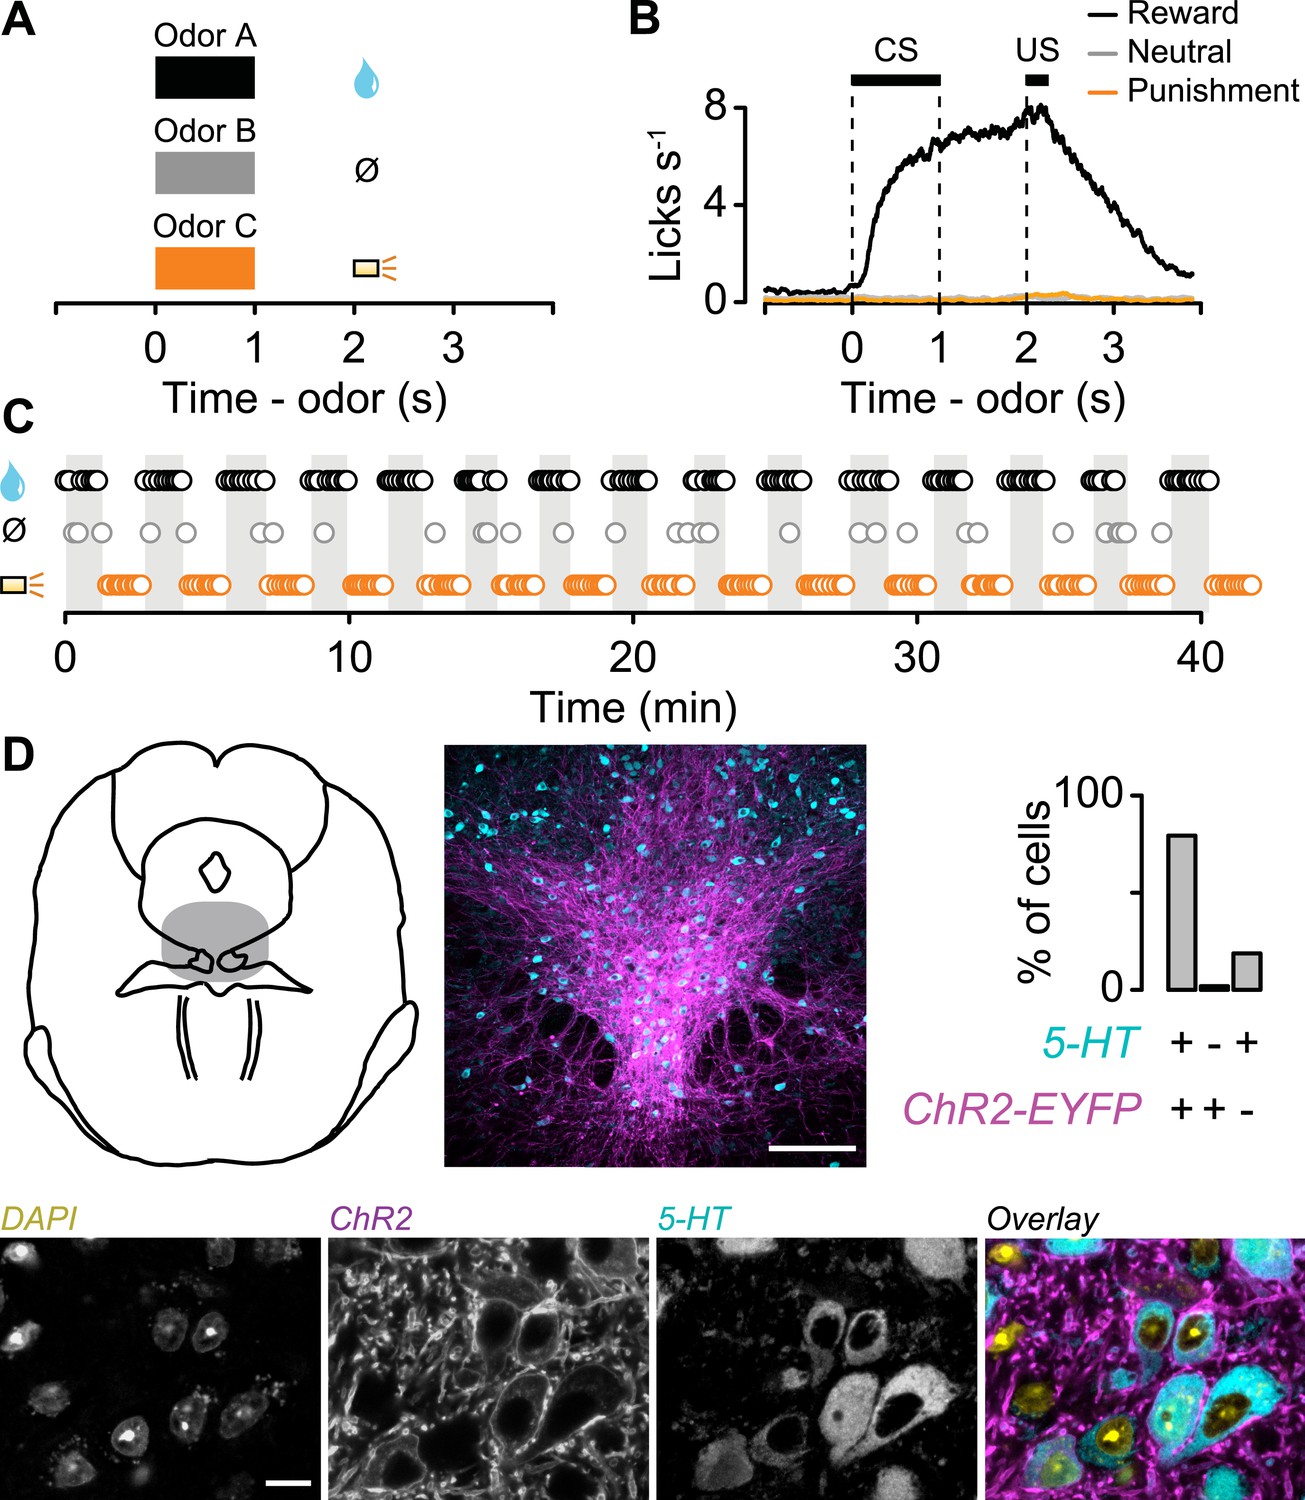
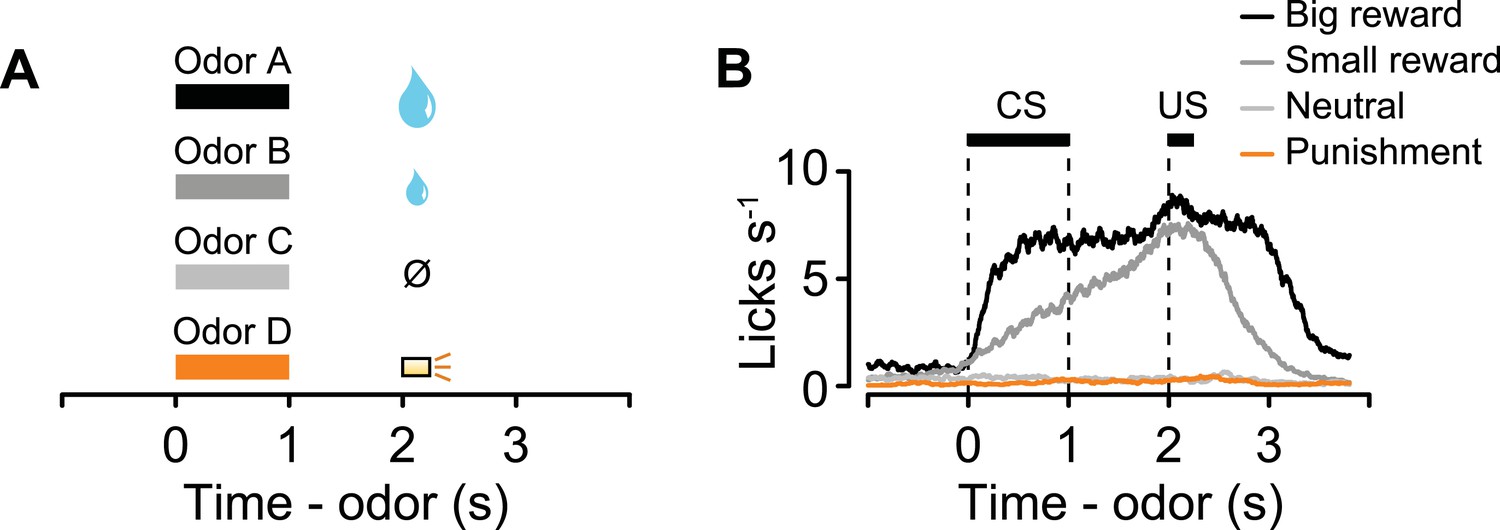
Behavioral task.
(A) Structure of individual trials. (B) Average lick rate for all animals during each trial type. (C) Representative sequence of trials from one experiment. Each point represents an odor cue. Shaded regions indicate reward blocks. (D) Schematic of midbrain indicating recording sites (shaded), with low and high magnification of 5-HT labeling (cyan), ChR2-EYFP (magenta), nuclei (DAPI), and their overlay. Scale bars are 100 µm and 10 µm for low and high magnification, respectively.
Figure 1—figure supplement 1
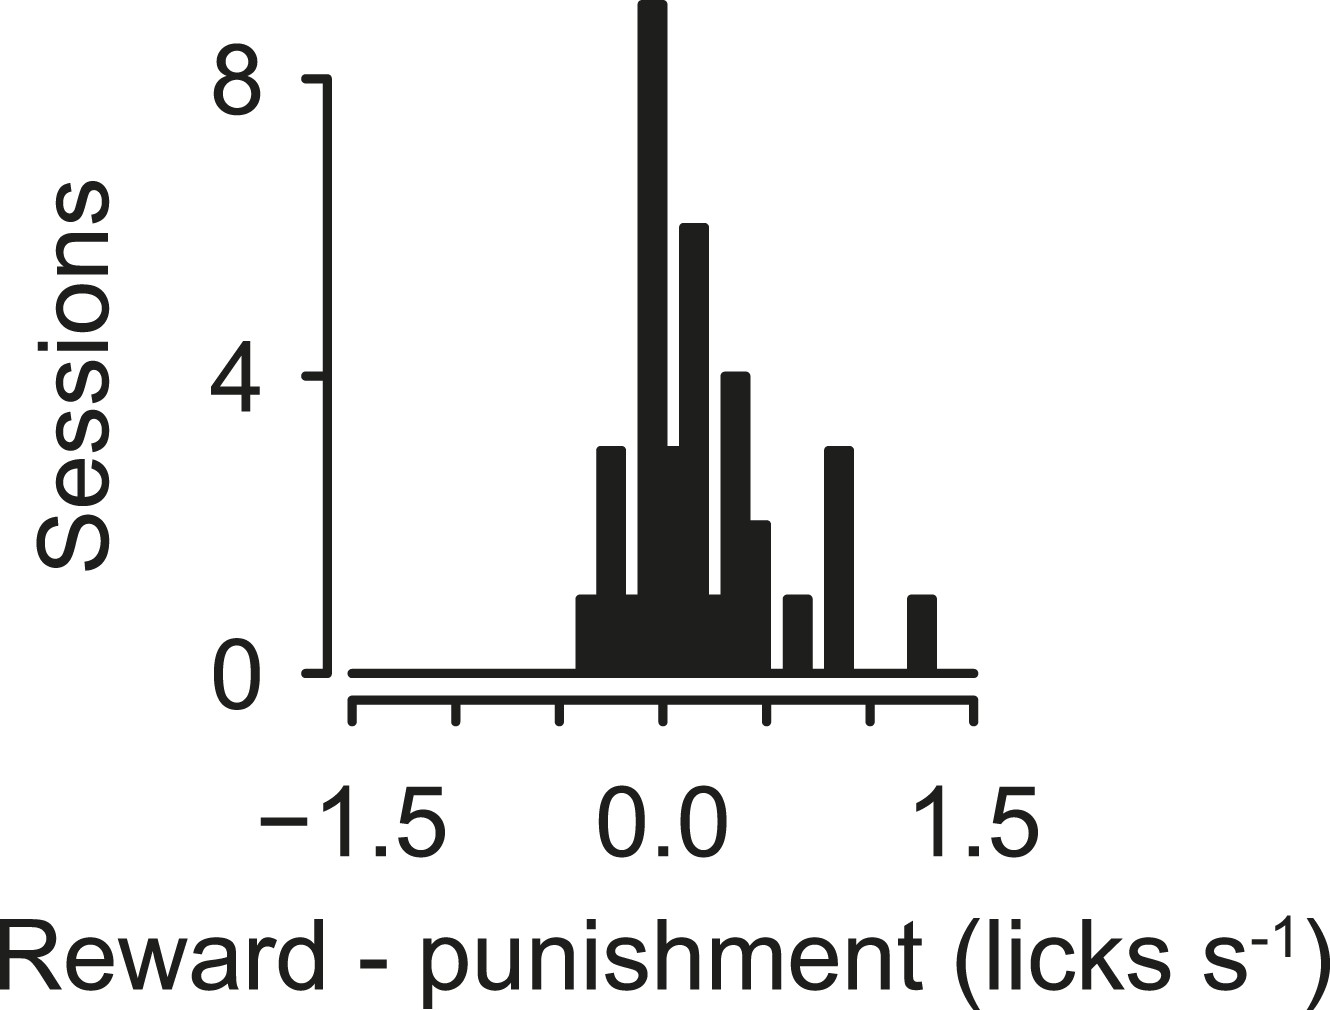
Histogram of lick rate during tones indicating block transitions, for experiments in which reward blocks alternated with punishment blocks.
https://doi.org/10.7554/eLife.06346.004
Figure 1—figure supplement 2
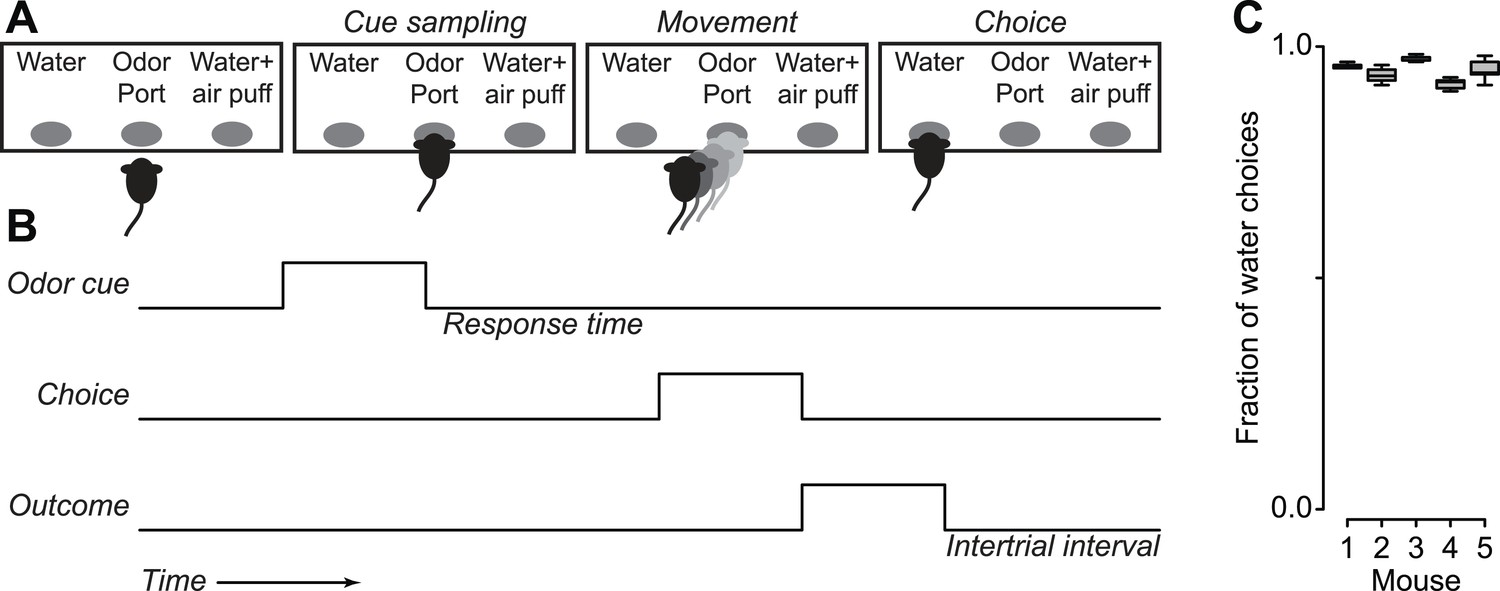
Mice treat air puffs as punishments.
(A) Mice performed a two-alternative forced choice task, in which they chose between a water reward and a water reward together with an air puff, indicating their response by moving to the associated response port. (B) Task timing, in which an odor cue in a central port signals a choice, followed by an outcome. (C) Median (horizontal line), interquartile range (box), and 1.5 times interquartile range (whiskers) of proportion of water choices for each mouse, across five experiments of 300 trials each. Each mouse chose water over water together with air puffs significantly more than chance (Tukey's Honest Significant Difference tests, p < 0.001).
Figure 2
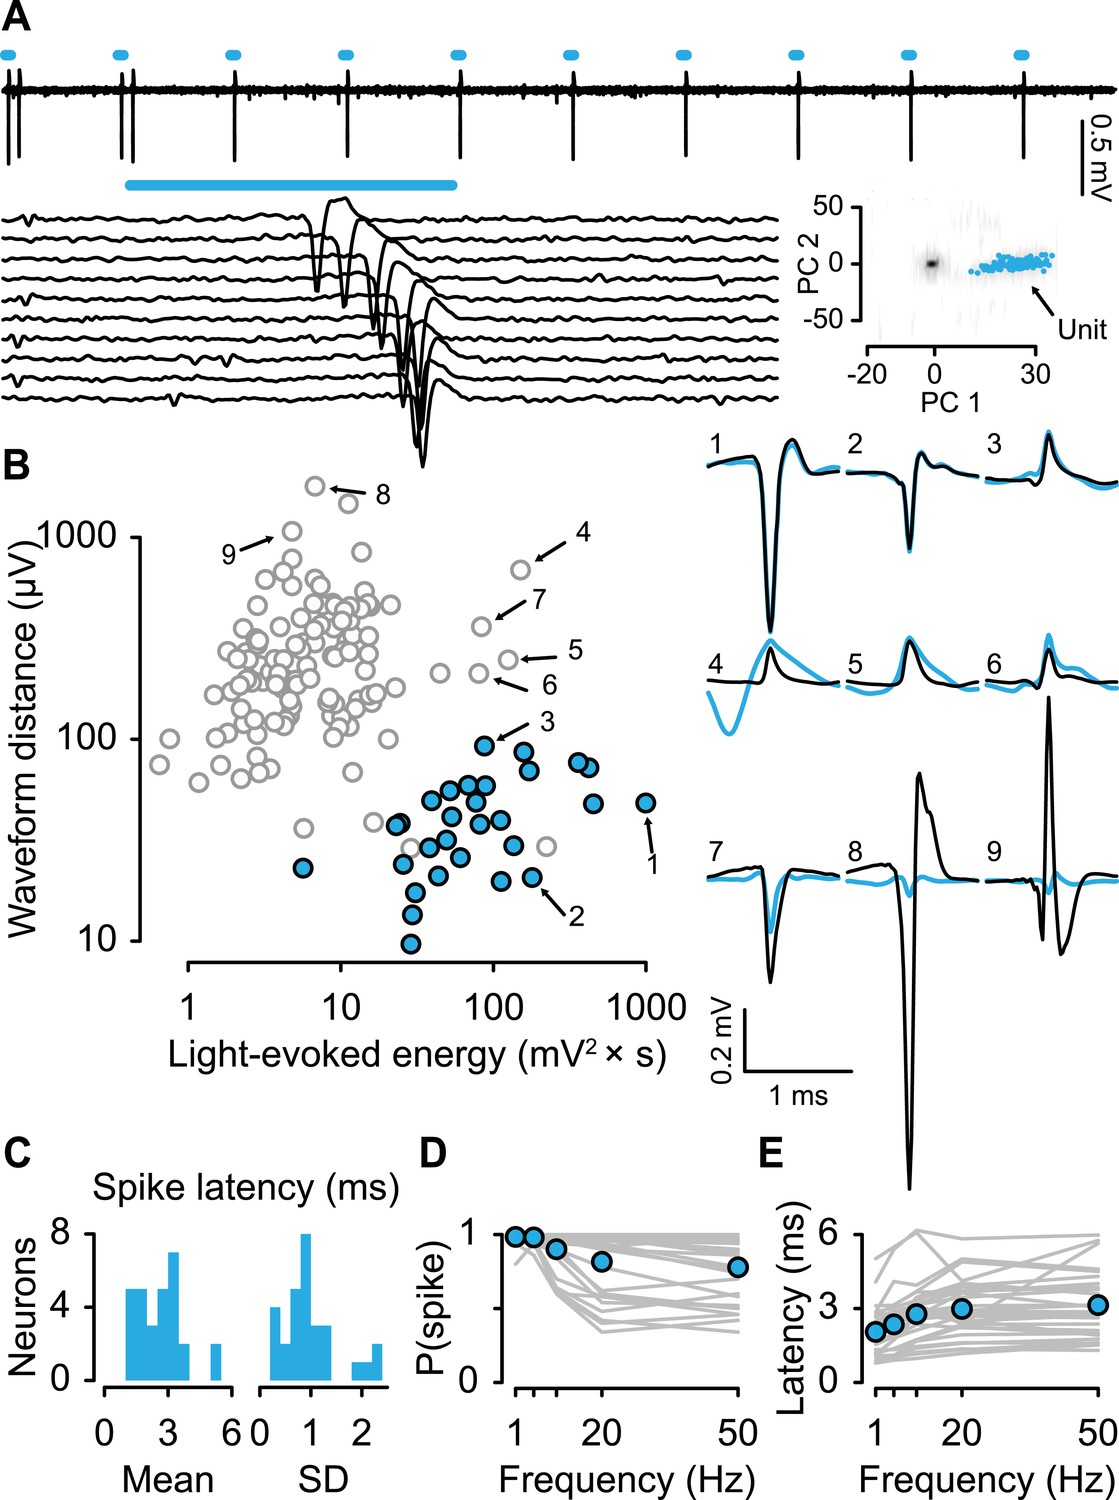
Identifying serotonergic neurons.
(A) Example voltage trace from 10 pulses of 10-Hz light stimulation (cyan bars; light duration, 5 ms). Each light-triggered spike is shown below. The lower right is the first two principal components of all waveforms from one tetrode wire, showing the neuron's (‘unit’) isolation quality, with 100 randomly-chosen light-evoked spikes in cyan. (B) Quantification of light-evoked responses to identify serotonergic neurons (filled points). Abscissa: energy (integral of the squared voltage values) of the light-evoked response from each neuron. Ordinate: Euclidean distance between the mean spontaneous spike and the light-evoked response. Example neurons are shown to the right (black, spontaneous spikes; cyan, light-evoked voltages; SD of spike waveforms are smaller than line thicknesses). Note that three unfilled points in the lower-right cluster are not considered identified serotonergic neurons because of low probability of firing in response to light stimulation. (C) Mean and SD of the light-evoked spike latency for identified serotonergic neurons. Probability (D) and latency (E) of light-evoked spikes from serotonergic neurons as a function of stimulation frequency (filled points are means across neurons).
Figure 3 with 4 supplements
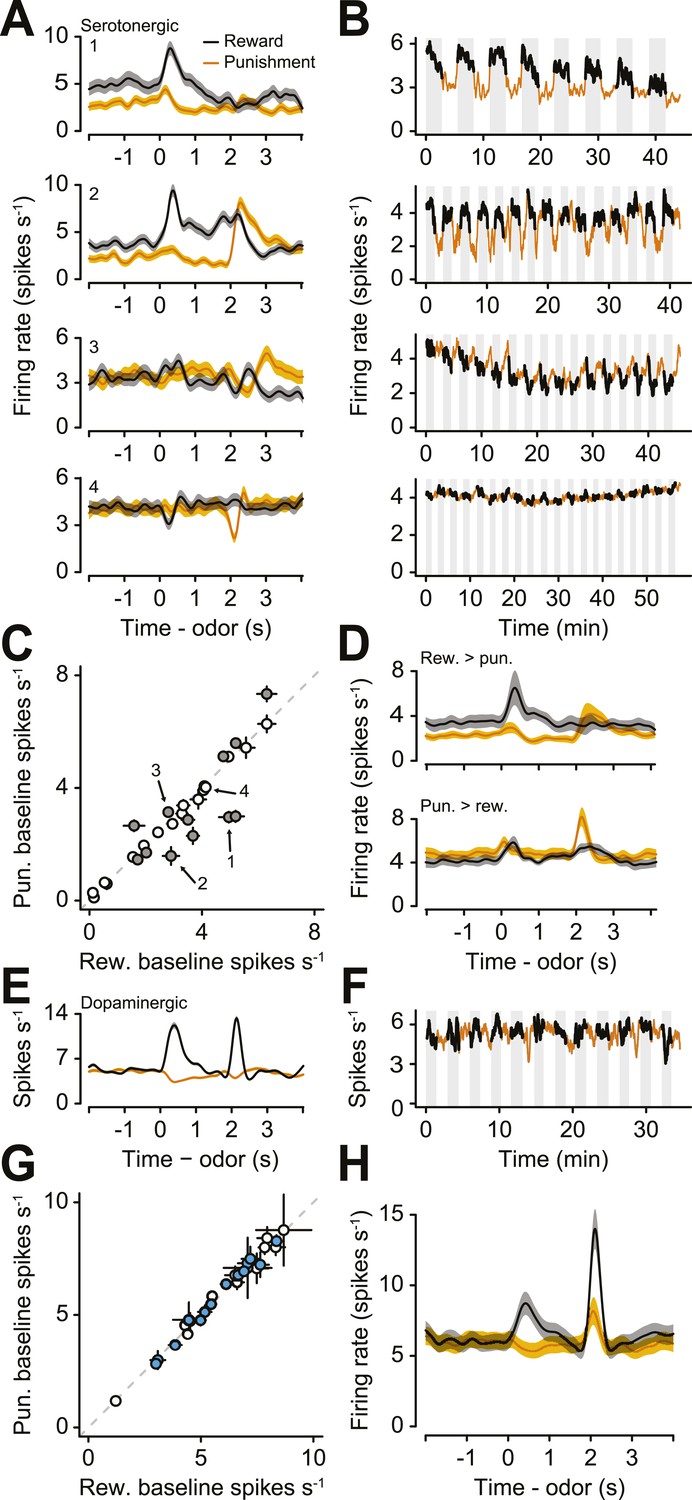
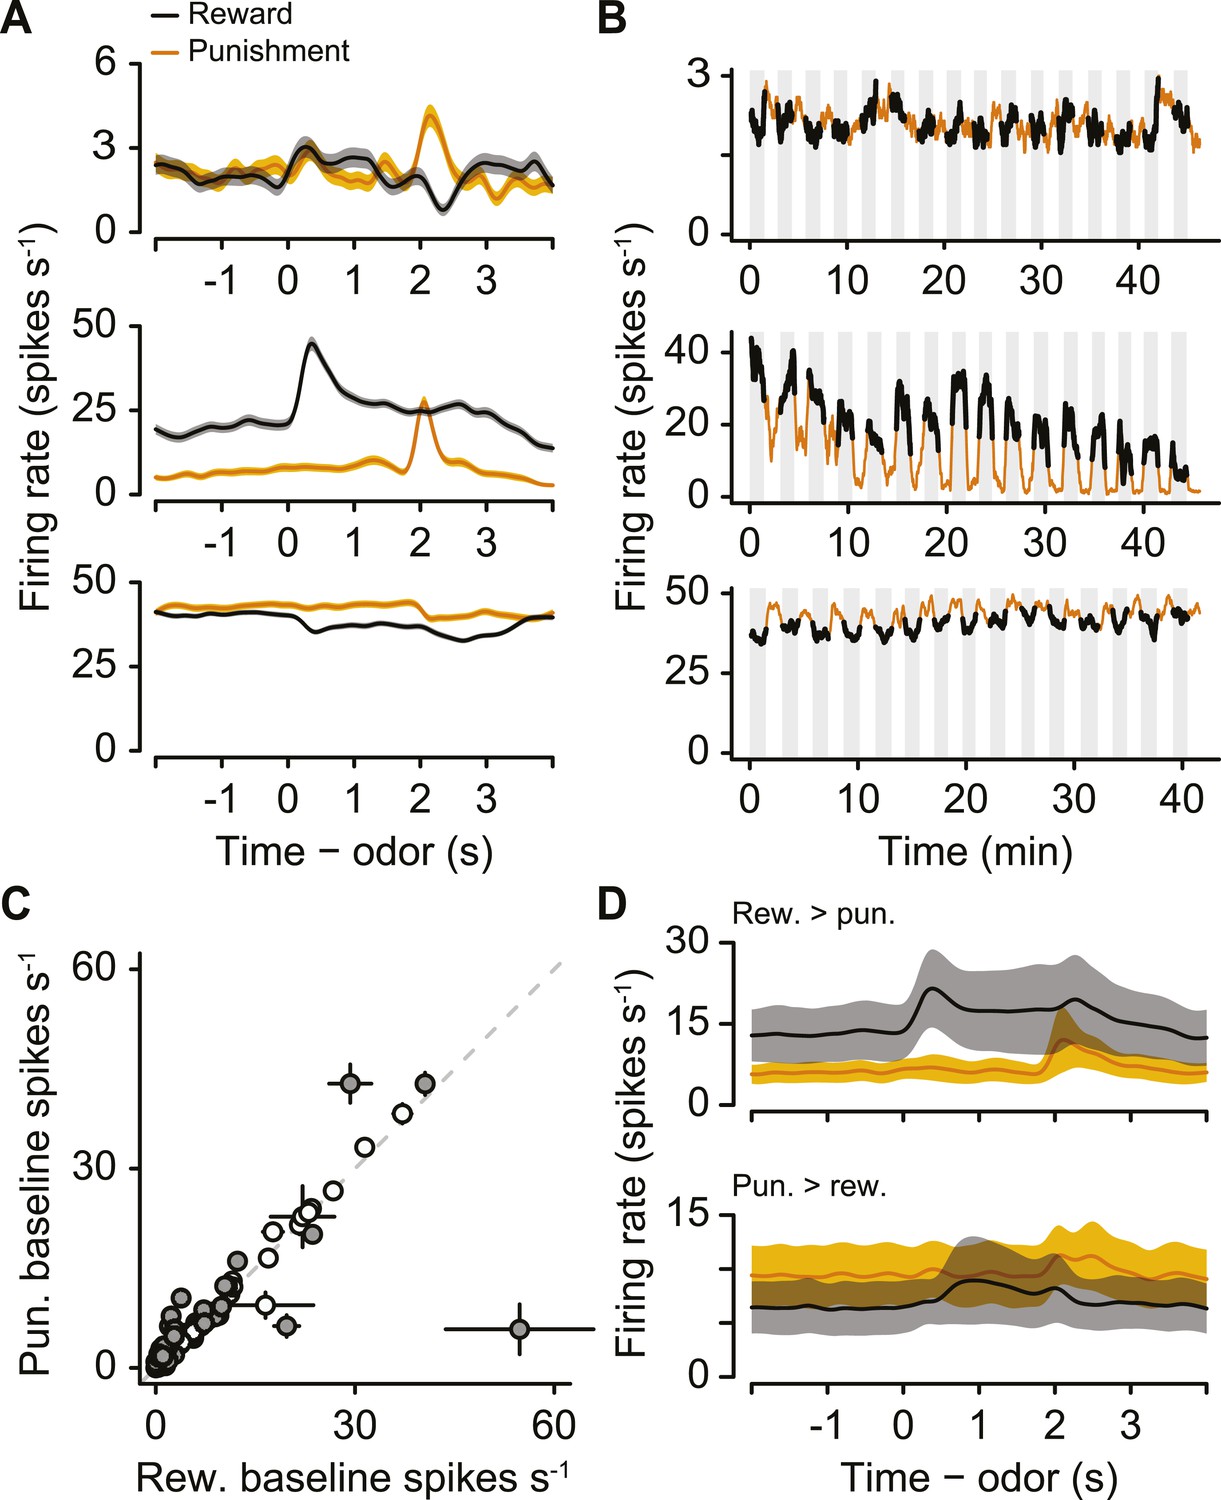
A population of serotonergic neurons is more or less active during blocks of reward trials than punishment trials.
(A) Average firing rates of four example serotonergic neurons during reward trials (black) and punishment trials (orange). Shaded regions denote S.E.M. Note the higher pre-trial firing rate during reward trials than punishment trials in the top two neurons and the higher firing rate during punishment vs reward blocks in the third neuron. (B) Firing rate of the same four neurons across the timecourse of the experiment. Note the slow (across minutes) fluctuations in firing rate in the top three neurons that correlated with block type (reward: black, shaded regions; punishment: orange). (C) Mean ±95% confidence intervals around firing rates during the baseline epoch for punishment vs reward blocks for each serotonergic neuron (significant data points are filled). Examples from (A) are labeled. (D) Average firing rates of serotonergic neurons with significantly higher baseline firing rates during reward (top) or punishment (bottom) blocks. (E) Average firing rate of an example identified dopaminergic neuron during reward and punishment trials. (F) Firing rate across the timecourse of the experiment for the dopaminergic neuron in (E). (G) Mean ±95% confidence intervals around firing rates during the baseline epoch for punishment vs reward blocks for each dopaminergic neuron (identified in cyan, putative in white). (H) Average firing rate of dopaminergic (identified and putative) neurons during reward and punishment trials.
Figure 3—figure supplement 1
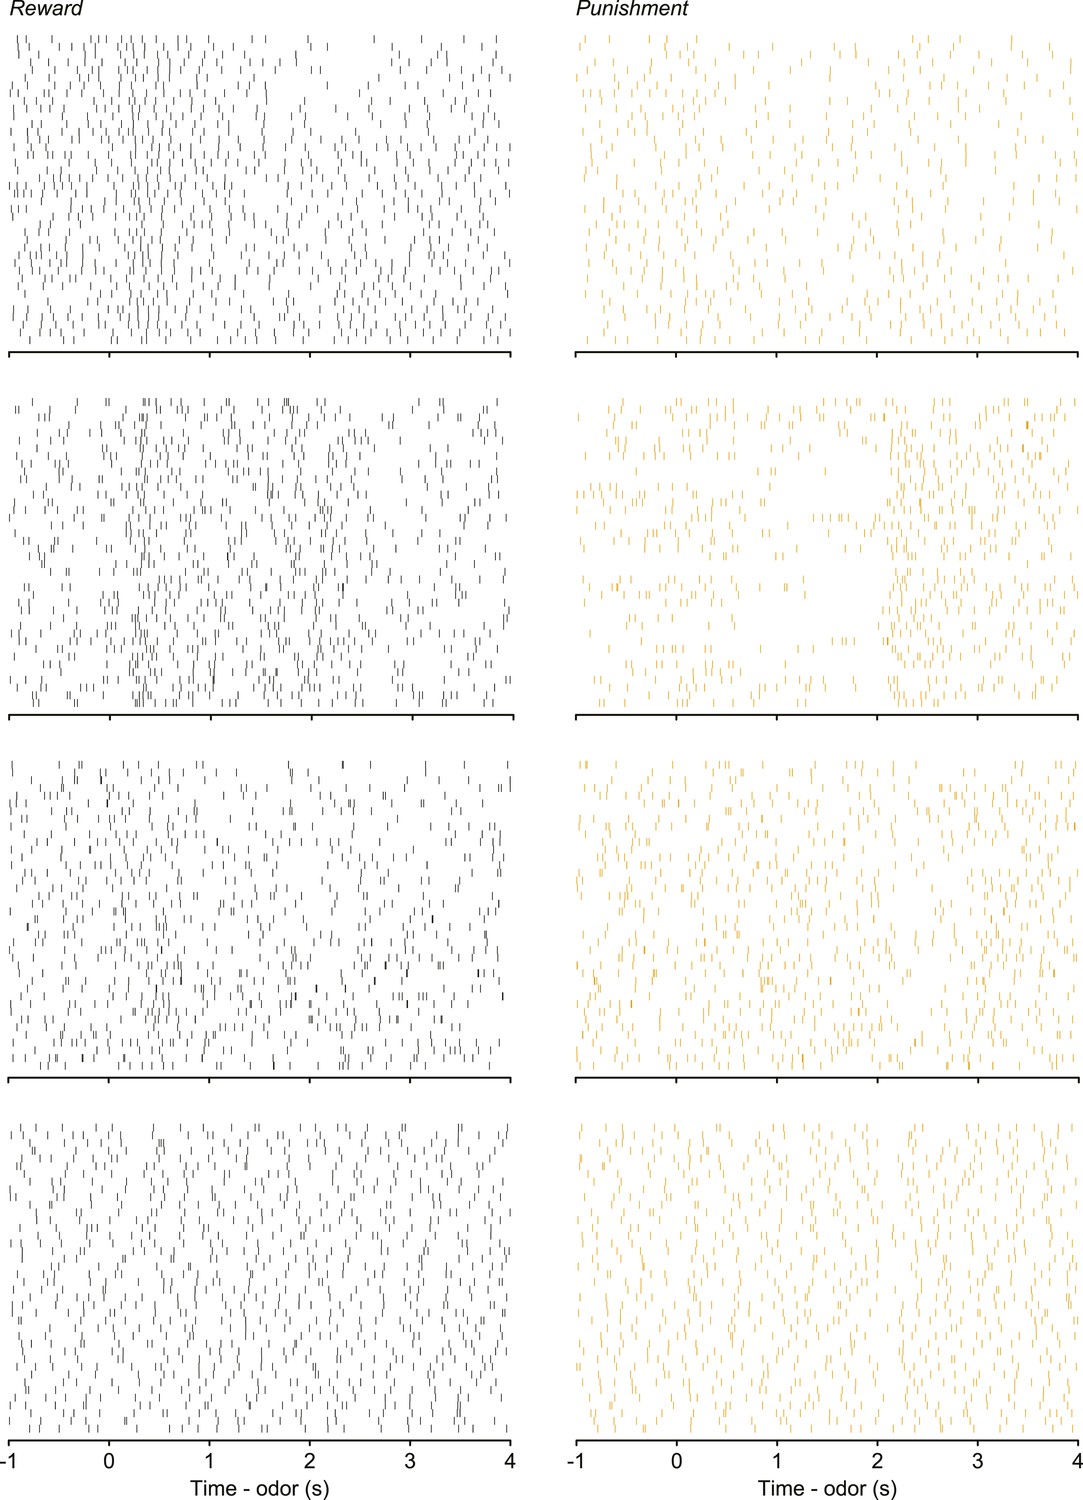
Raster plots showing spike times during 40 trials for the four example neurons in Figure 3A.
https://doi.org/10.7554/eLife.06346.008
Figure 3—figure supplement 2
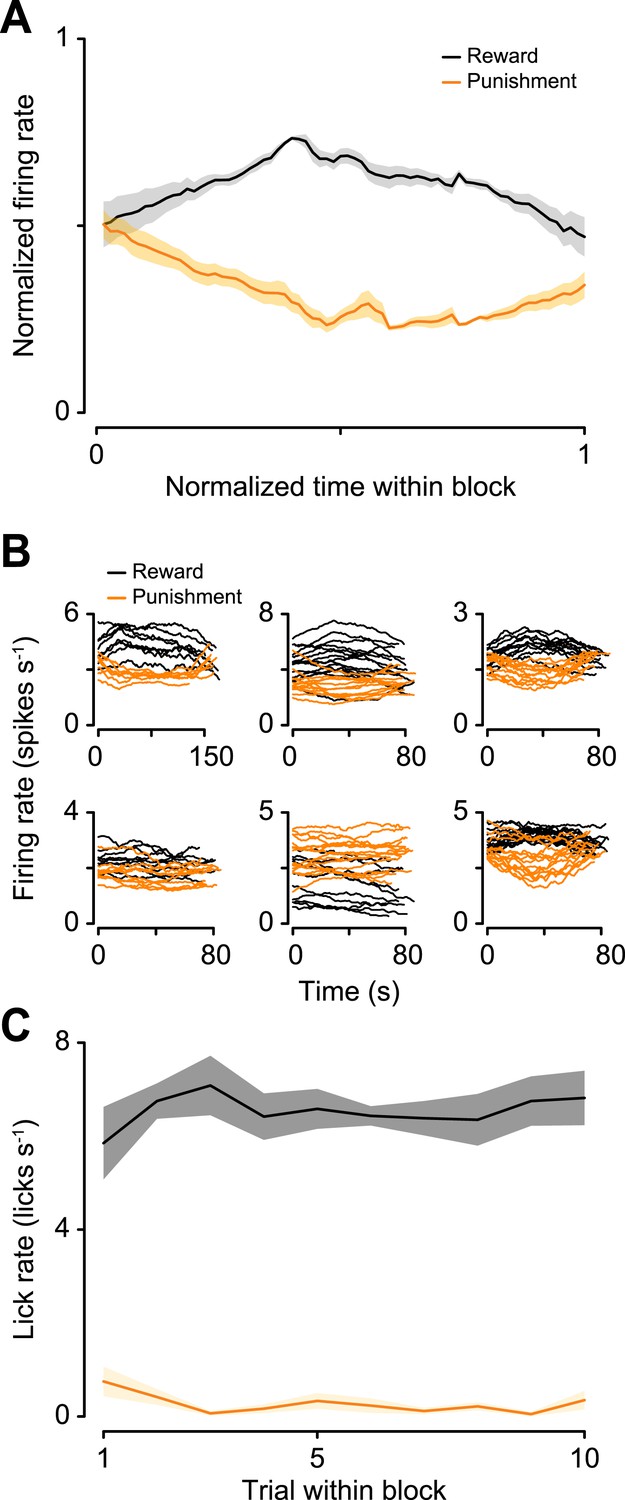
(A) Normalized mean ± S.E.M. firing rate within reward and punishment blocks for the positive-coding serotonergic neurons.
Note the build-up and build-down activity within blocks. (B) Raw firing rates for reward and punishment blocks for six example serotonergic neurons with tonic firing rate differences across blocks. (C) Mean ± S.E.M. lick rate during the delay between CS and US as a function of trial within block. Note the lack of resemblance to the firing rates in (A).
Figure 3—figure supplement 3
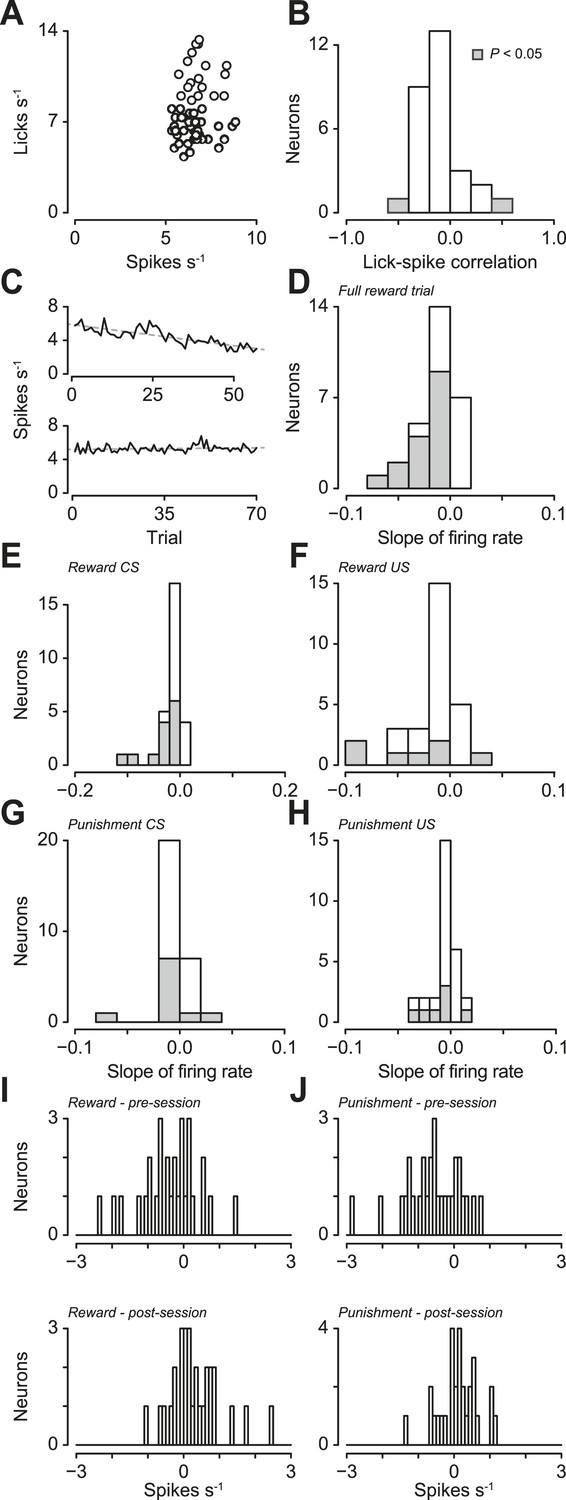
(A) Trial-by-trial scatter plot of lick rate against spike rate for an example serotonergic neuron.
(B) Pearson correlation coefficient of trial-by-trial lick rate and spike rate across serotonergic neurons. The two neurons with significant correlations are indicated in gray. (C) Firing rate across reward trials for two example serotonergic neurons, with linear fits in dashed gray. The top neuron had a significantly decreasing firing rate across trials, whereas the bottom neuron did not. (D) Slope of firing rate across reward trials for all serotonergic neurons, with slopes significantly different from zero indicated in gray. (E–H) Slope of firing rate across reward (E and F) and punishment (G and H) trials for all serotonergic neurons, during CS (odor onset to odor offset; E and G) and US (US onset to 500 ms after US onset; F and H), with slopes significantly different from zero indicated in gray. (I) Difference between background firing rates during reward blocks and pre- (top panel) or post-session (top panel) activity, for serotonergic neurons. (J) Difference between background firing rates during punishment blocks and pre- (top panel) or post-session (top panel) activity, for serotonergic neurons.
Figure 3—figure supplement 4
Example activity of a dopaminergic neuron with a smaller response to predicted reward than unpredicted reward-predicting cue.
https://doi.org/10.7554/eLife.06346.011
Figure 4 with 1 supplement
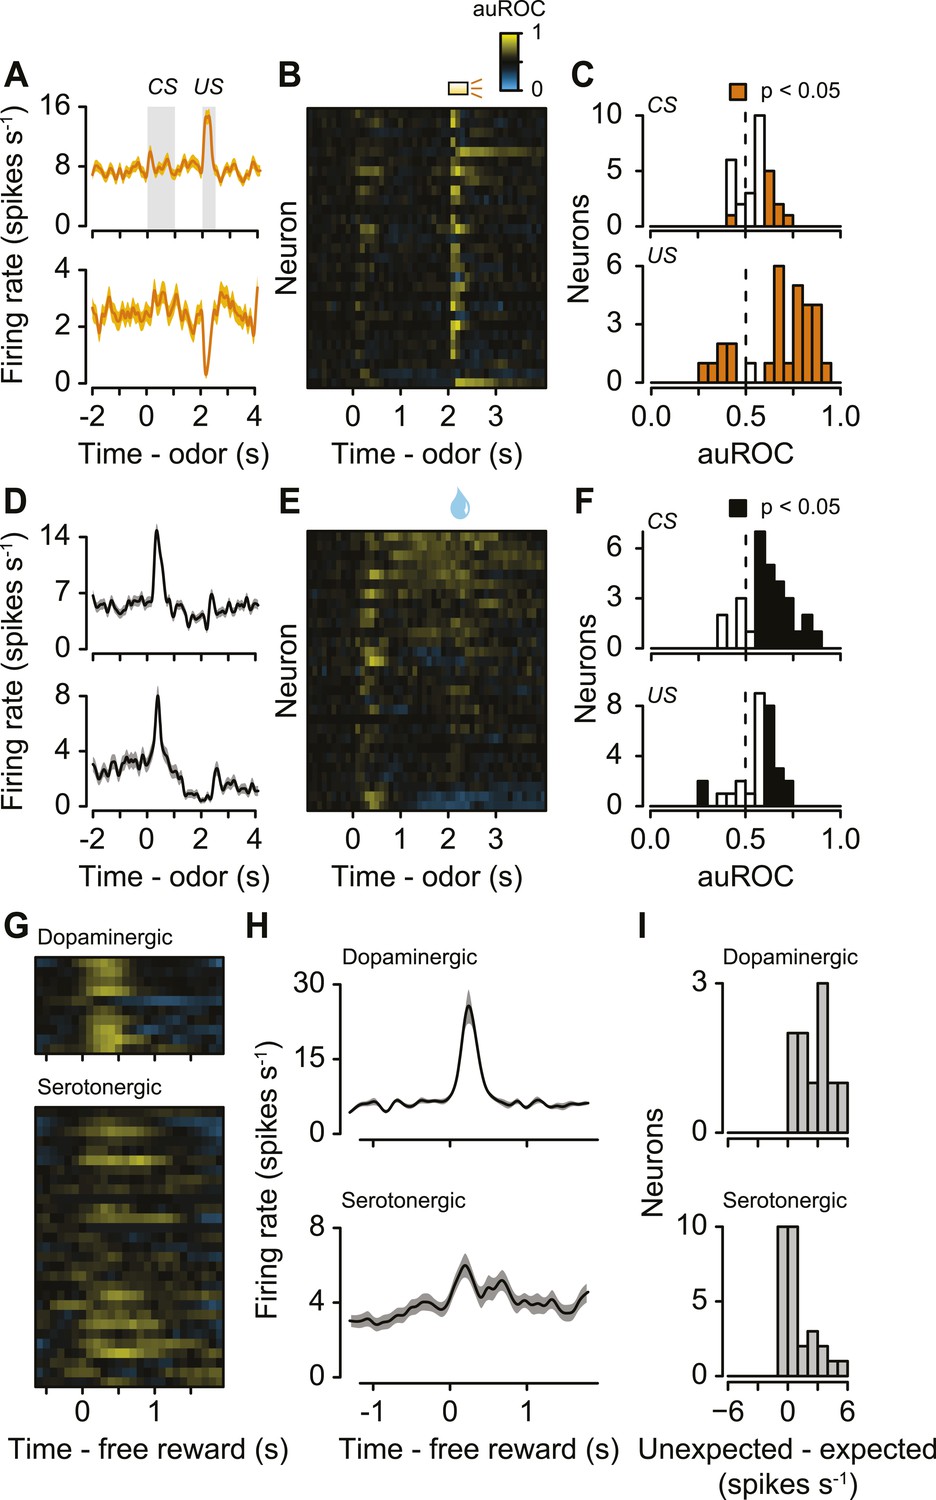
Serotonergic neurons are briefly excited or inhibited by punishments or reward-predicting cues.
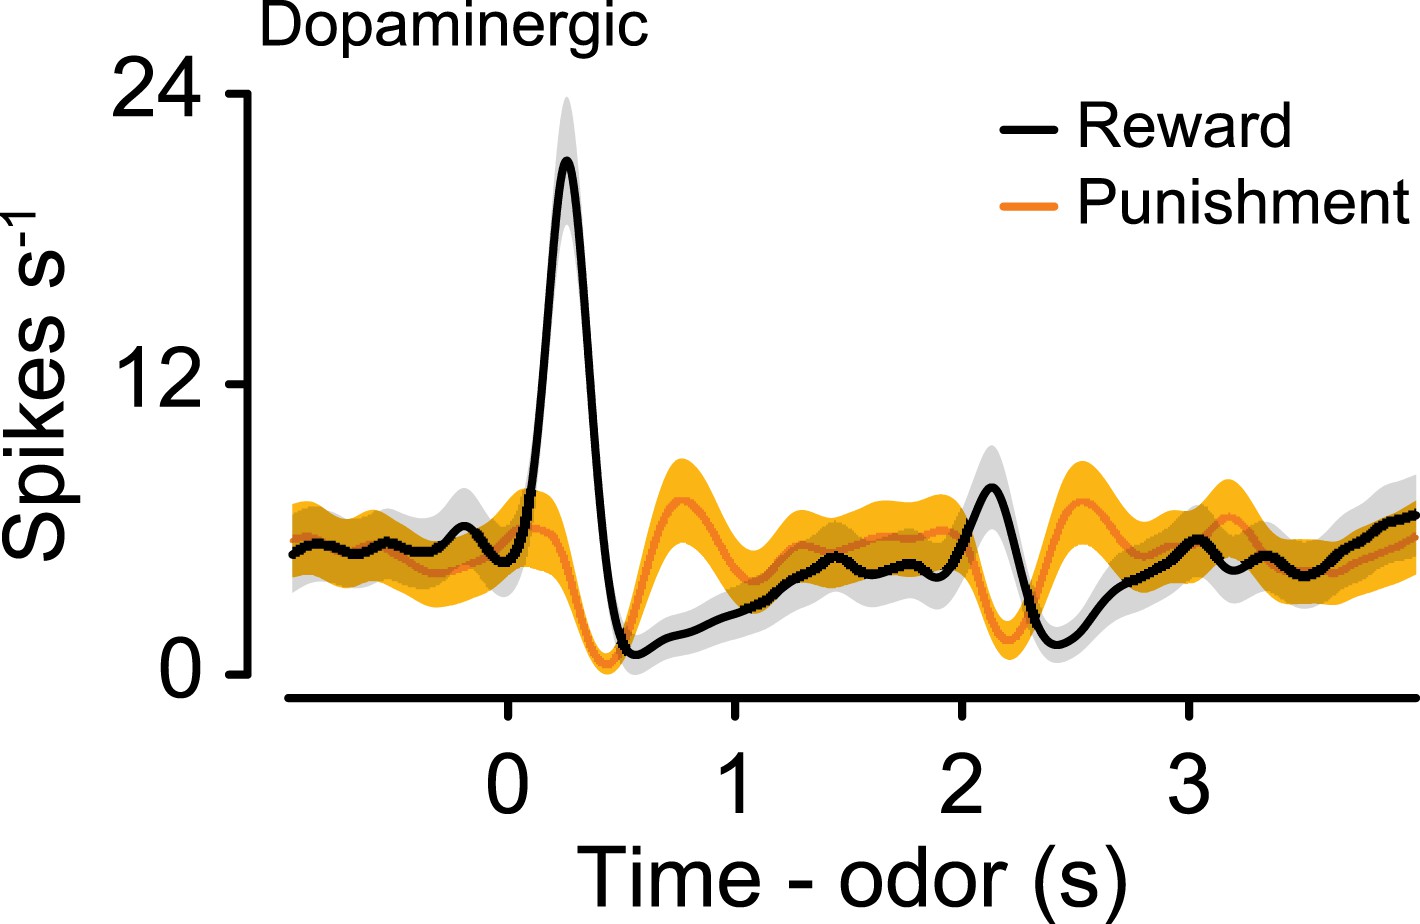
(A) Average firing rates of two example serotonergic neurons during punishment trials. CS and US analysis windows are shaded in gray. (B) Area under the ROC curve for punishment trials for all serotonergic neurons, sorted by the sum of the auROC for reward trials in (E). Yellow indicates excitation, blue indicates inhibition, and black indicates no change relative to baseline. (C) Histogram of changes in firing rate relative to baseline during the CS and US epochs of punishment trials. (D) Average firing rates of two example serotonergic neurons during reward trials. (E) Area under the ROC curve for reward trials for all serotonergic neurons, sorted by their sum. (F) Histogram of changes in firing rate relative to baseline during the CS and US epochs of reward trials. (G) Area under the ROC curve for free reward for dopaminergic and serotonergic neurons. (H) Average firing rate of dopaminergic and serotonergic neurons around free reward (shaded curves show S.E.M.). (I) Histograms of average differences between mean firing rates during expected vs unexpected rewards for serotonergic and dopaminergic neurons.
Figure 4—figure supplement 1
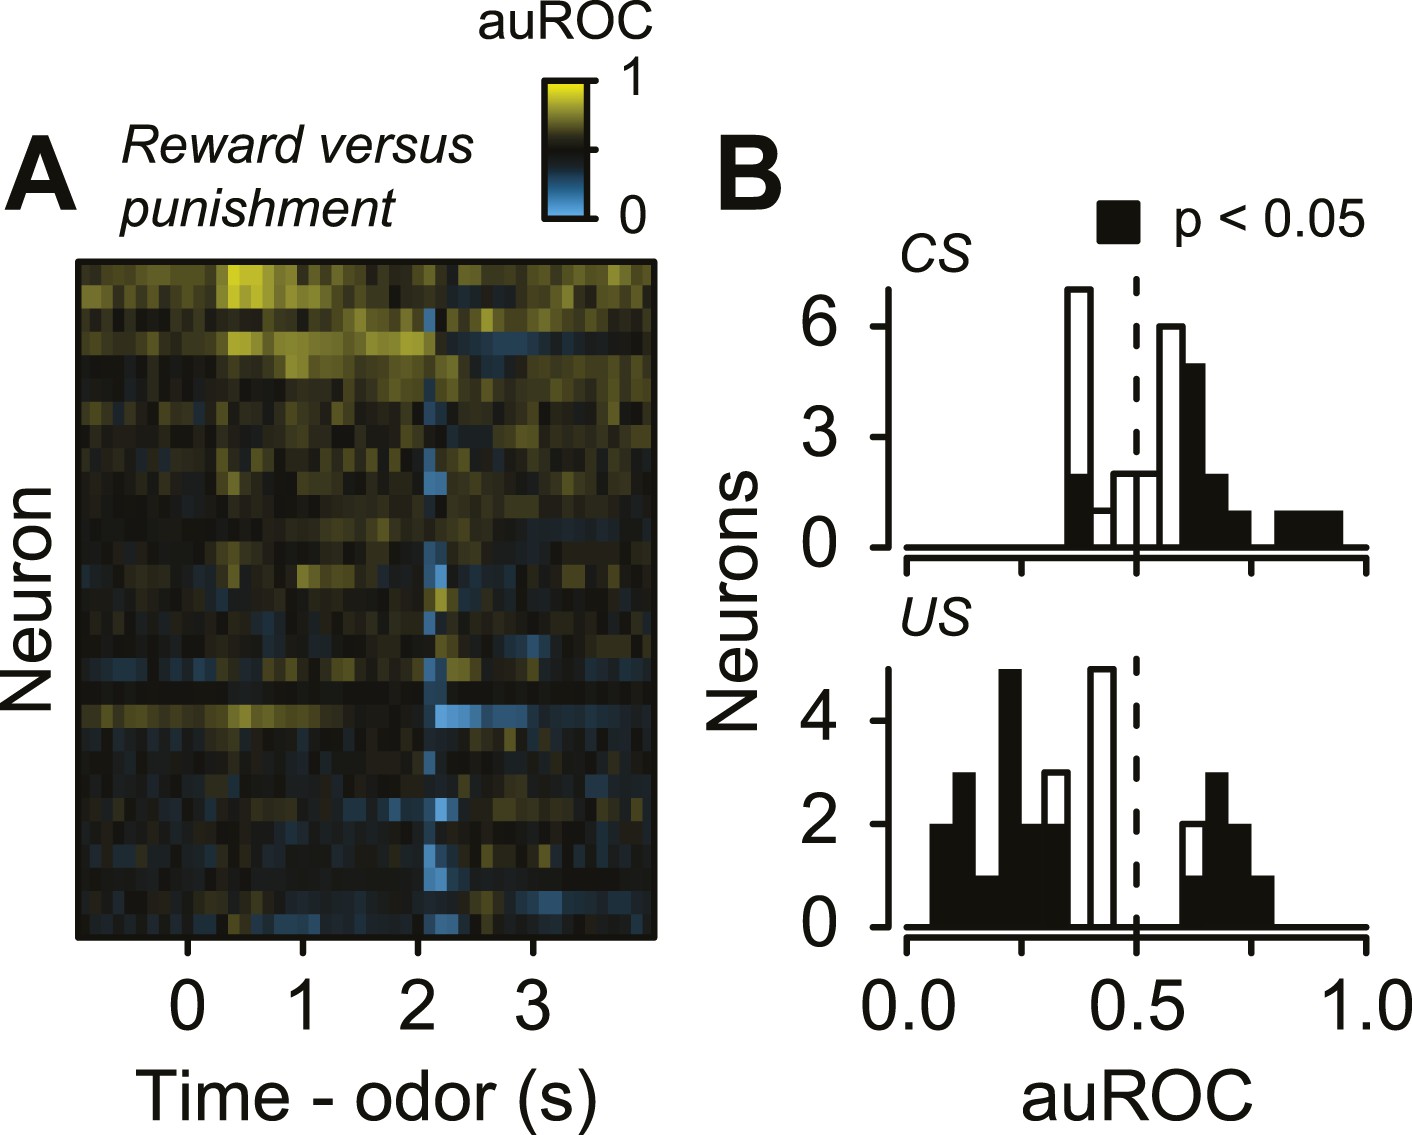
(A) Area under the ROC curve for reward (water) vs punishment (air puff) trials for serotonergic neurons, sorted by the sum of the auROC.
Yellow indicates excitation, blue indicates inhibition, and black indicates no change relative to baseline. (B) Histogram of changes in firing rate during the CS and US epochs of reward vs punishment trials.
Figure 5
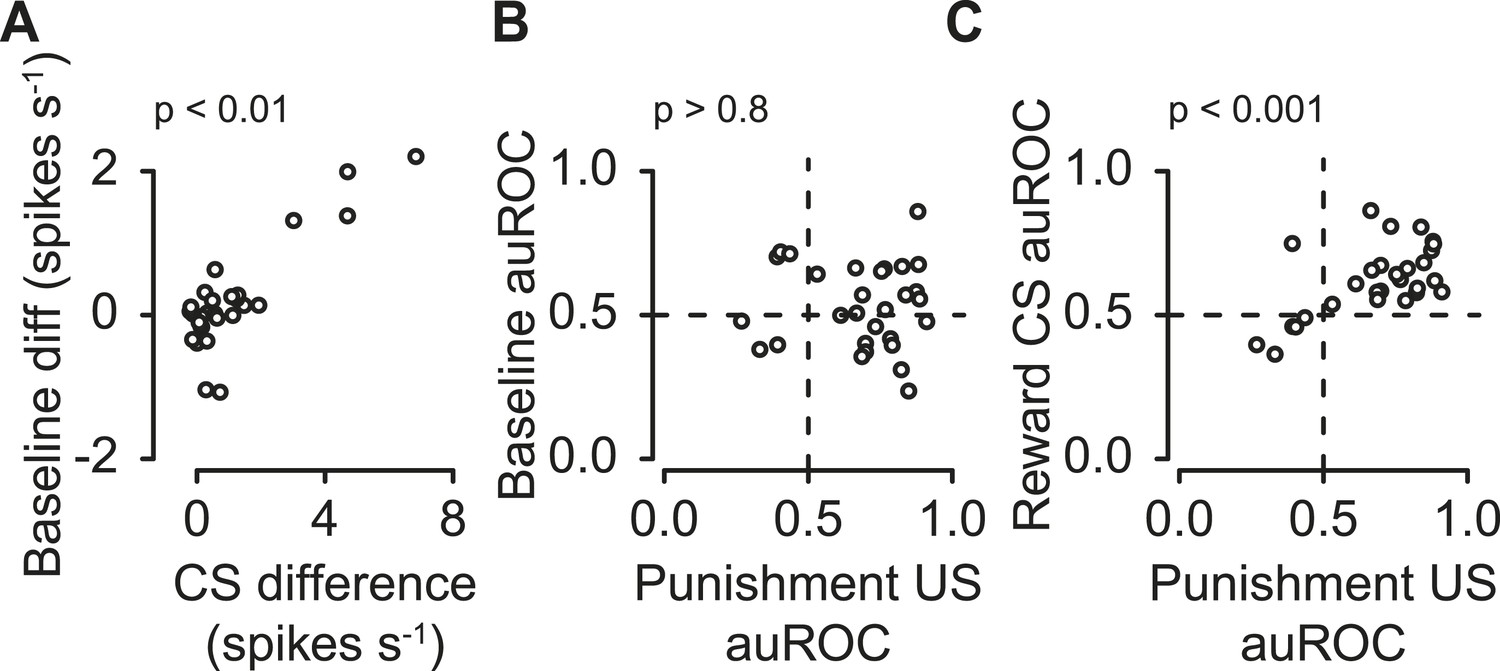
Correlations between serotonergic neuron response features.
(A) Difference in firing rate during the 2-s pre-trial epoch vs the difference in firing rate during the CS (reward − punishment), corrected for baseline differences. (B) Area under the ROC curve for the 2-s pre-trial epoch during reward vs punishment trials plotted against area under the ROC curve during the punishment US epoch. (C) Area under the ROC curve for during the reward CS vs punishment US epochs.
Figure 6 with 2 supplements
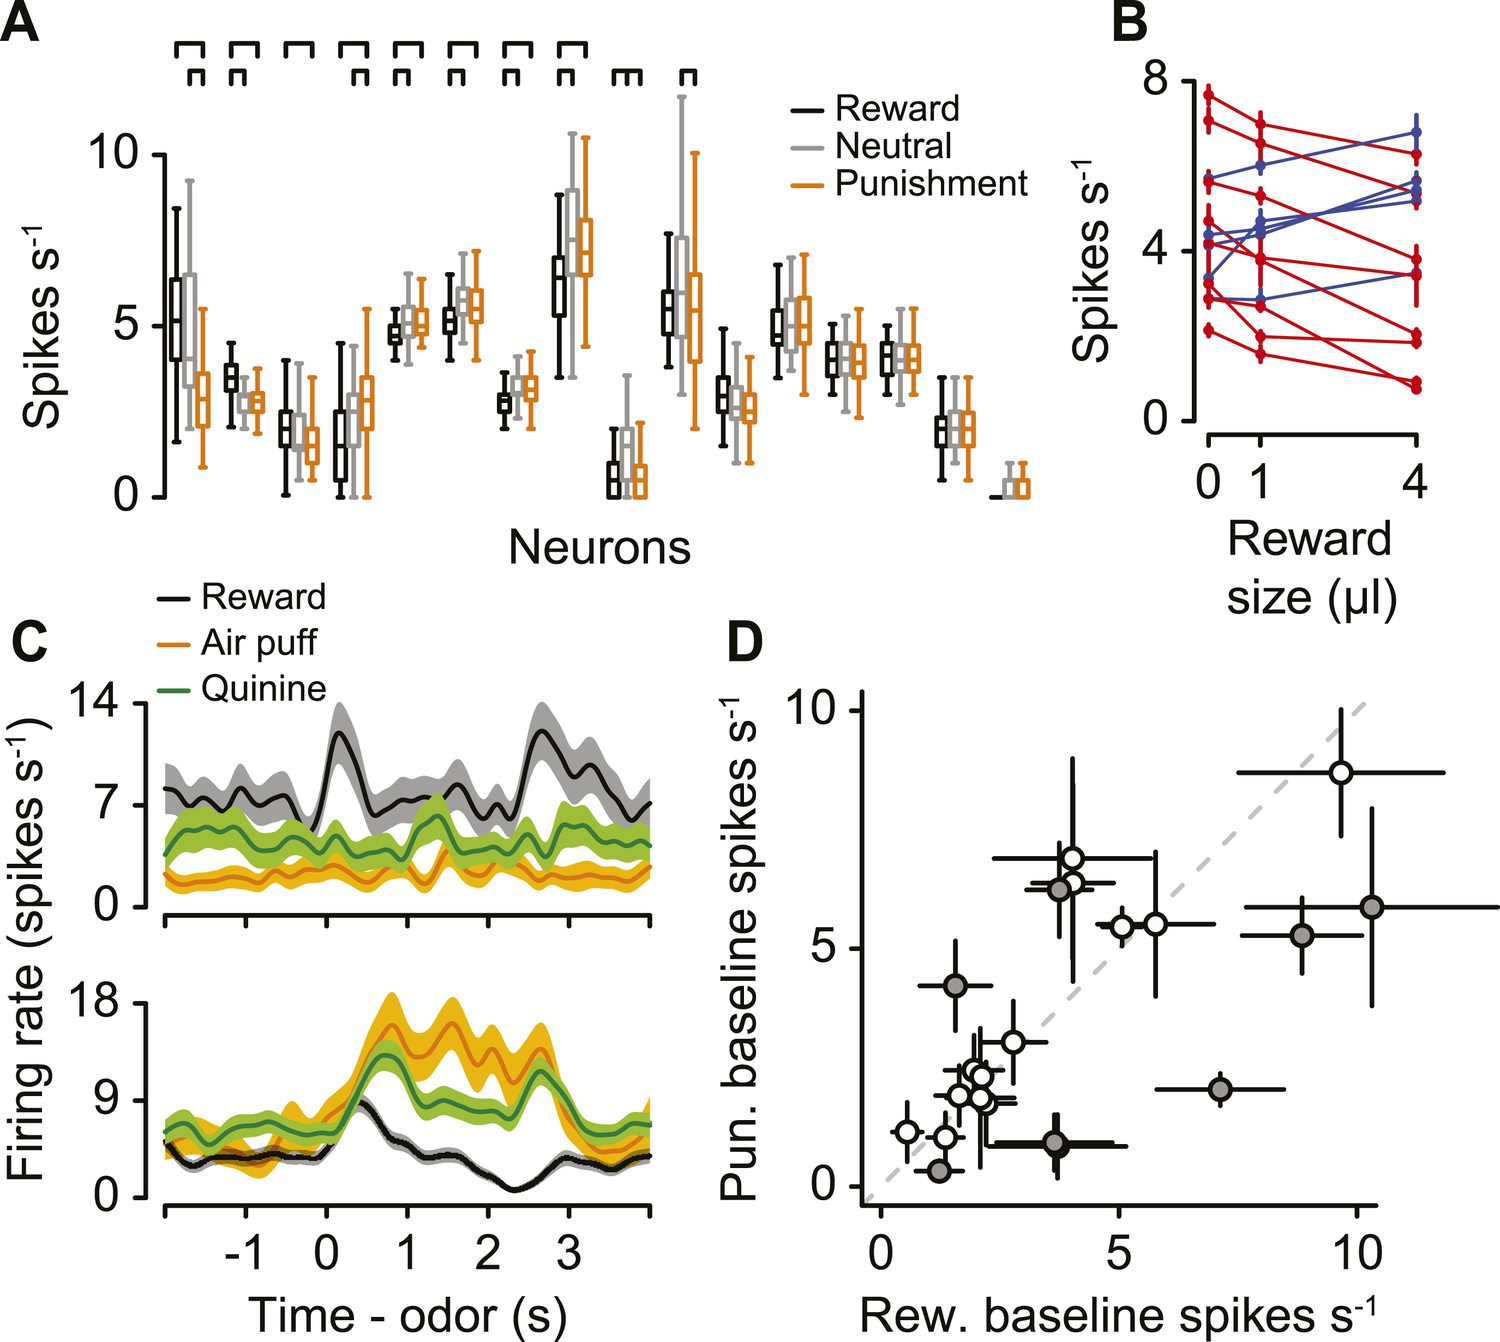
Serotonergic neuron background firing rates signal graded value.
(A) Median (horizontal line), interquartile range (box), and 1.5 times interquartile range (whiskers) of pre-trial firing rates during reward (black), neutral (gray), and punishment (orange) blocks. Brackets indicate significant differences. (B) Mean ±95% confidence intervals pre-trial response during blocks of three reward sizes for 13 serotonergic neurons with strictly increasing (blue) or decreasing (red) firing rates as a function of reward size. (C) Mean ± S.E.M. firing rate of two example serotonergic neurons during reward (water or chocolate milk) and punishment (air puff, orange; quinine, green) trials. (D) Mean ±95% confidence intervals around firing rates during the baseline epoch for punishment (quinine) vs reward (water or chocolate milk) blocks for each serotonergic neuron (significant data points are filled).
Figure 6—figure supplement 1
Behavioral task.
(A) Structure of individual trials. (B) Average lick rate for all animals during each trial type.
Figure 6—figure supplement 2
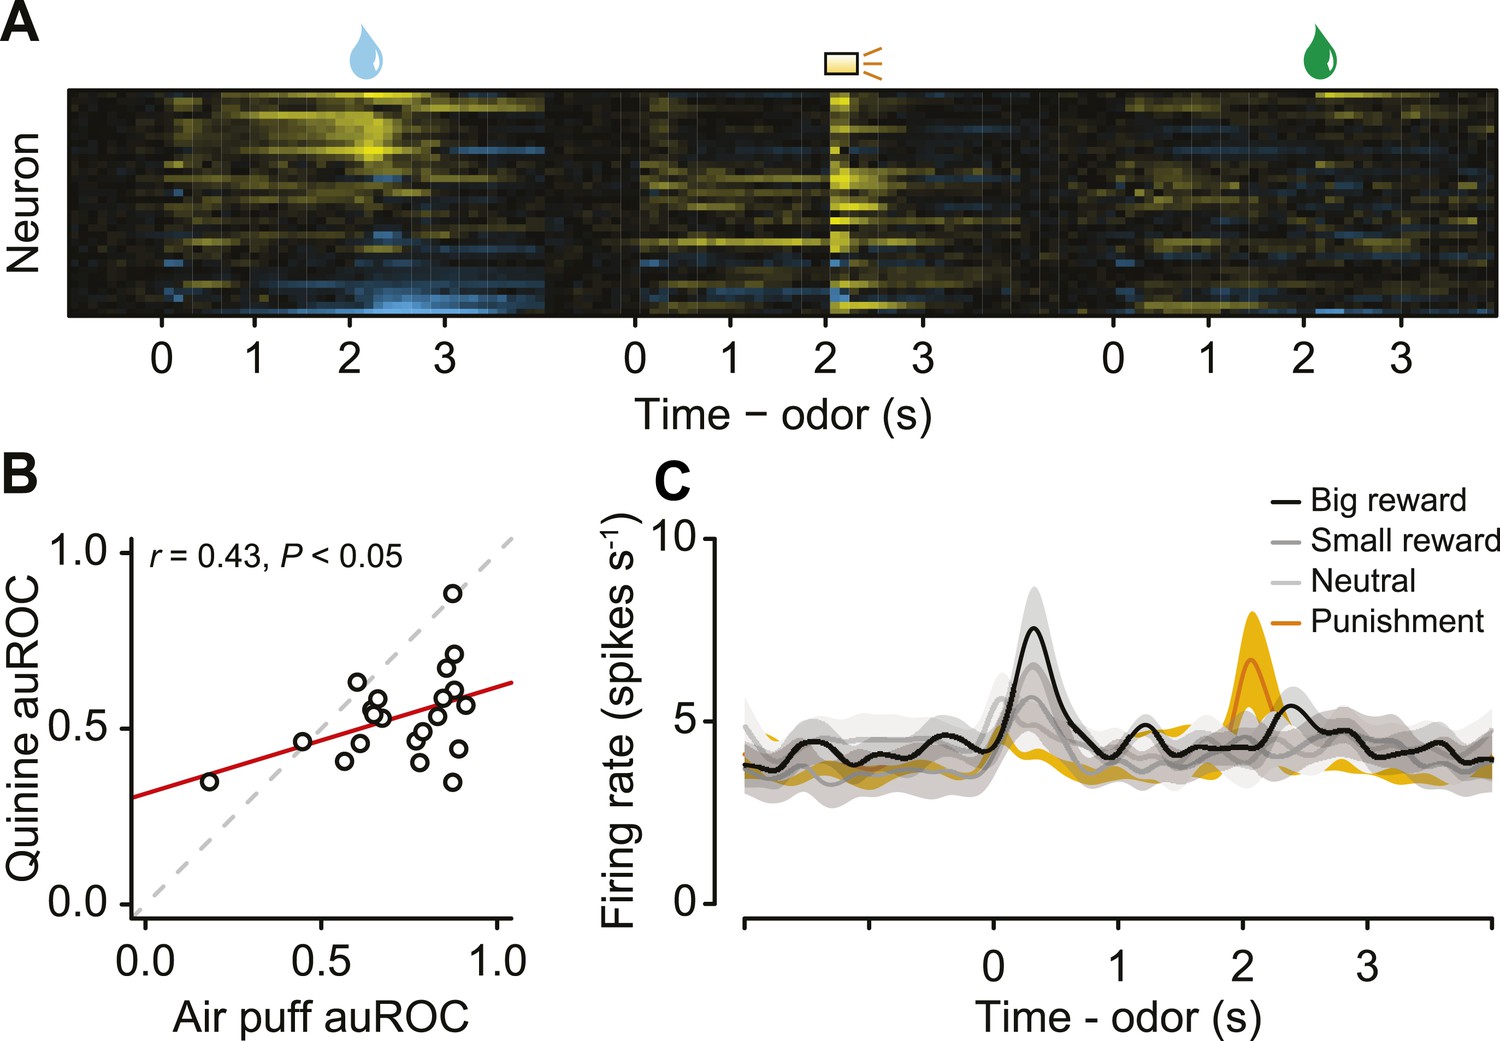
(A) Area under the ROC curve for reward, air-puff punishment, and quinine punishment trials for 21 serotonergic neurons.
(B) Area under the ROC curve for the punishment period for quinine vs air-puff punishments. Pearson correlation with significance test is shown. (C) Mean ± S.E.M. firing rate of serotonergic neurons in the task that included different reward sizes.
Figure 7
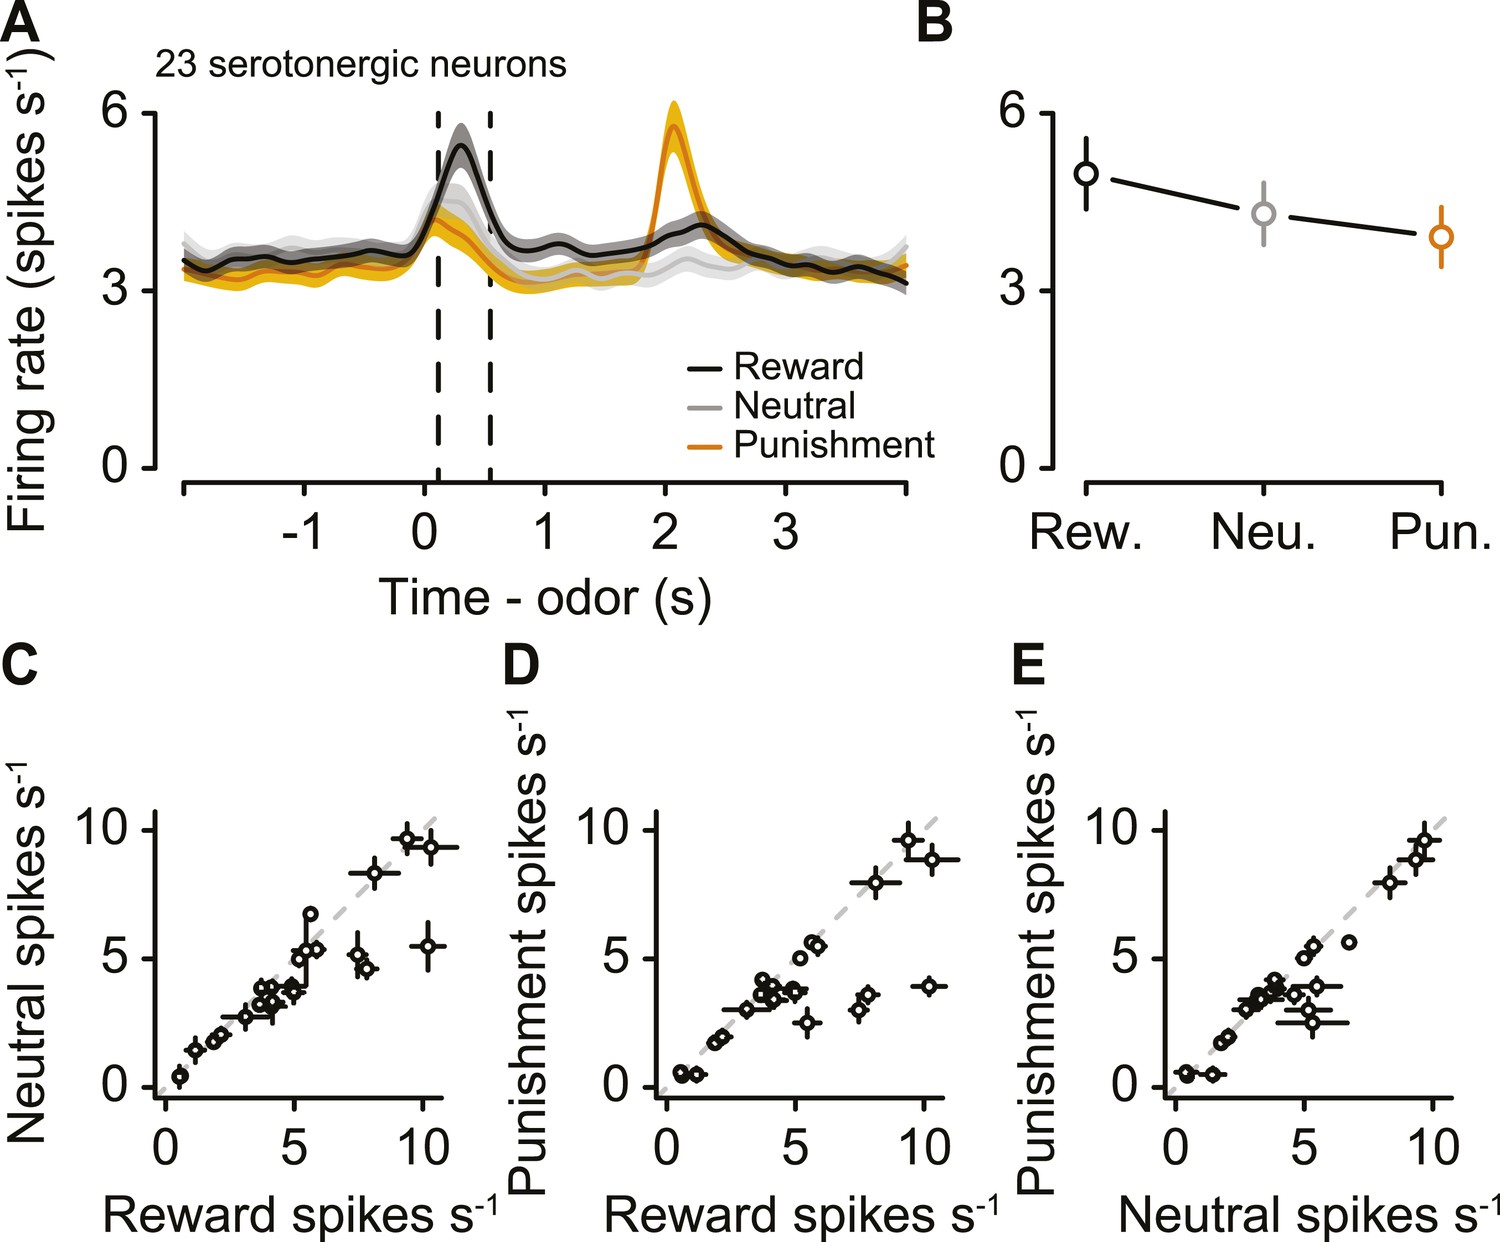
Serotonergic neurons signal value, not salience, in response to the CS.
(A) Mean ± S.E.M. firing rate of serotonergic neurons during all three trial conditions. (B) Mean ± S.E.M. firing rate during the CS epoch (region bounded by dashed lines in A) for each trial condition. (C–E) Mean ±95% confidence intervals around firing rates during the CS epoch for neutral vs reward (C), punishment vs reward (D), and punishment vs neutral (E).
Figure 8 with 2 supplements
A population of unidentified neurons is more or less active during blocks of reward trials than punishment trials.
(A) Mean ± S.E.M. firing rates of three example neurons during reward trials (black) and punishment trials (orange). Note the higher pre-trial firing rate during reward trials than punishment trials in the bottom two neurons. (B) Firing rate of the same three neurons across the timecourse of the experiment. Note the slow (across minutes) fluctuations in firing rate in the bottom two neurons that correlated with block type (reward: black, shaded regions; punishment: orange). (C) Mean ±95% confidence intervals around firing rates during the baseline epoch for punishment vs reward blocks for each unidentified neuron (significant data points are filled). (D) Mean ± S.E.M. firing rates of unidentified neurons with significantly higher baseline firing rates during reward (top) or punishment (bottom) blocks.
Figure 8—figure supplement 1
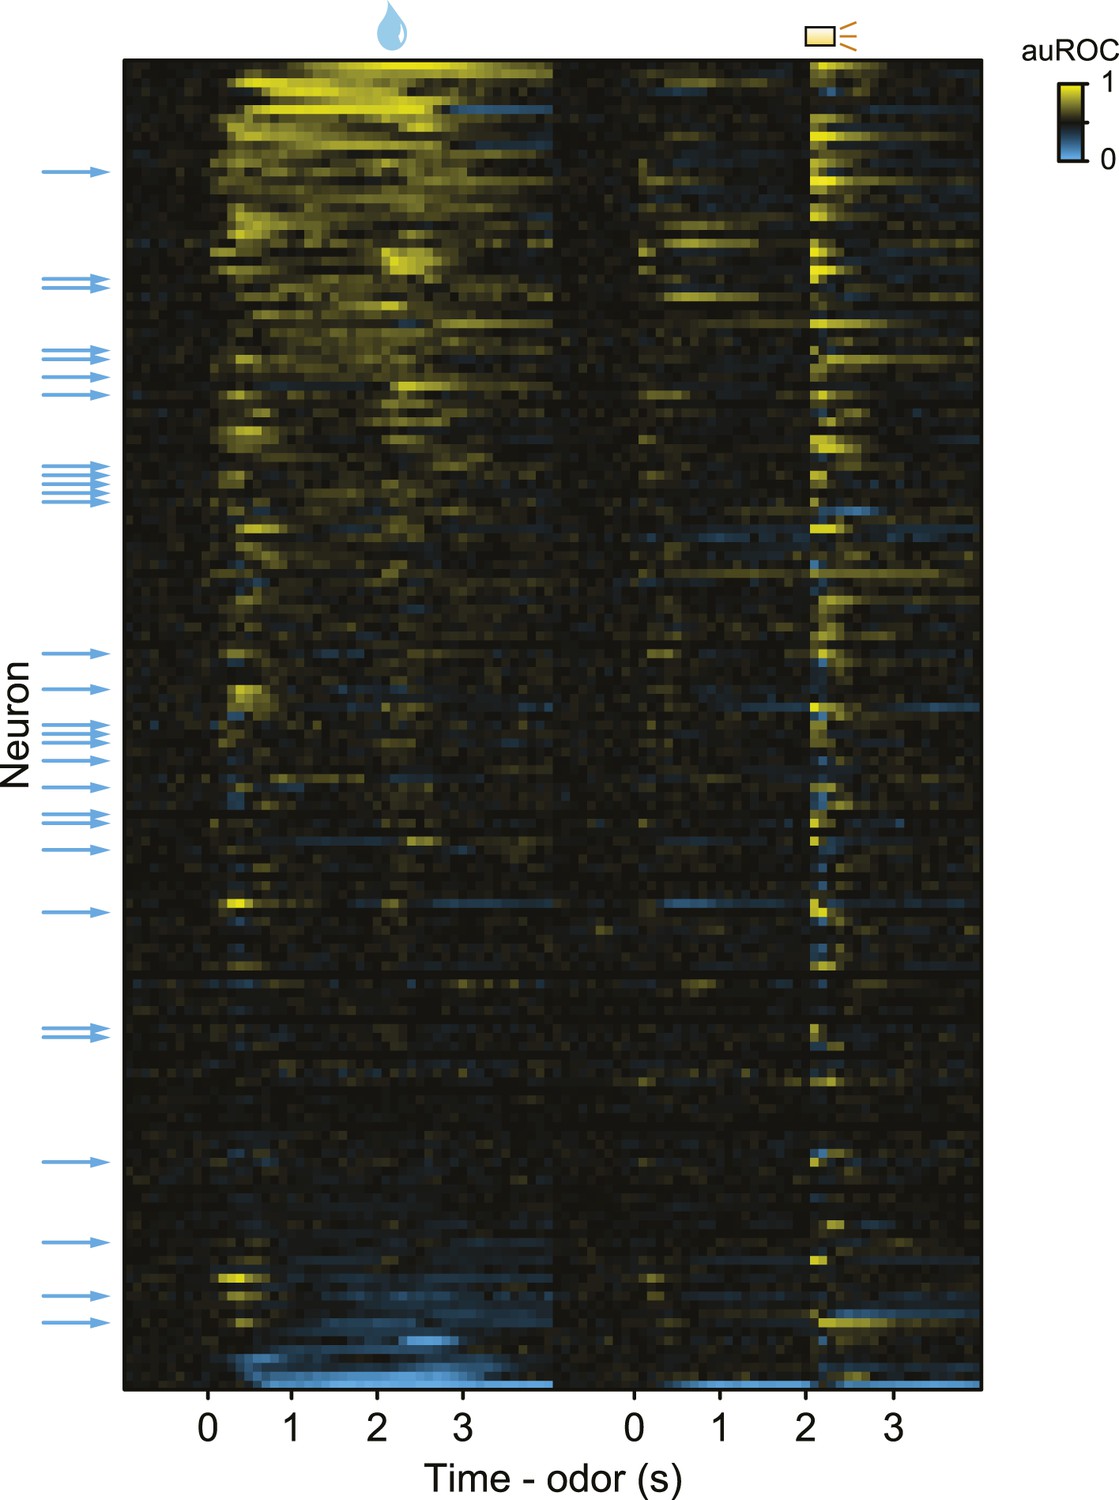
Response profiles across all neurons and all trial types.
The figure shows the heterogeneity of unidentified neuron responses relative to serotonergic neurons. Area under the ROC curve for reward (left) and punishment trials (right) for each neuron. Neurons are sorted by the sum of the auROC values from reward trials. Serotonergic neurons are marked with arrows to the left of the plot.
Figure 8—figure supplement 2
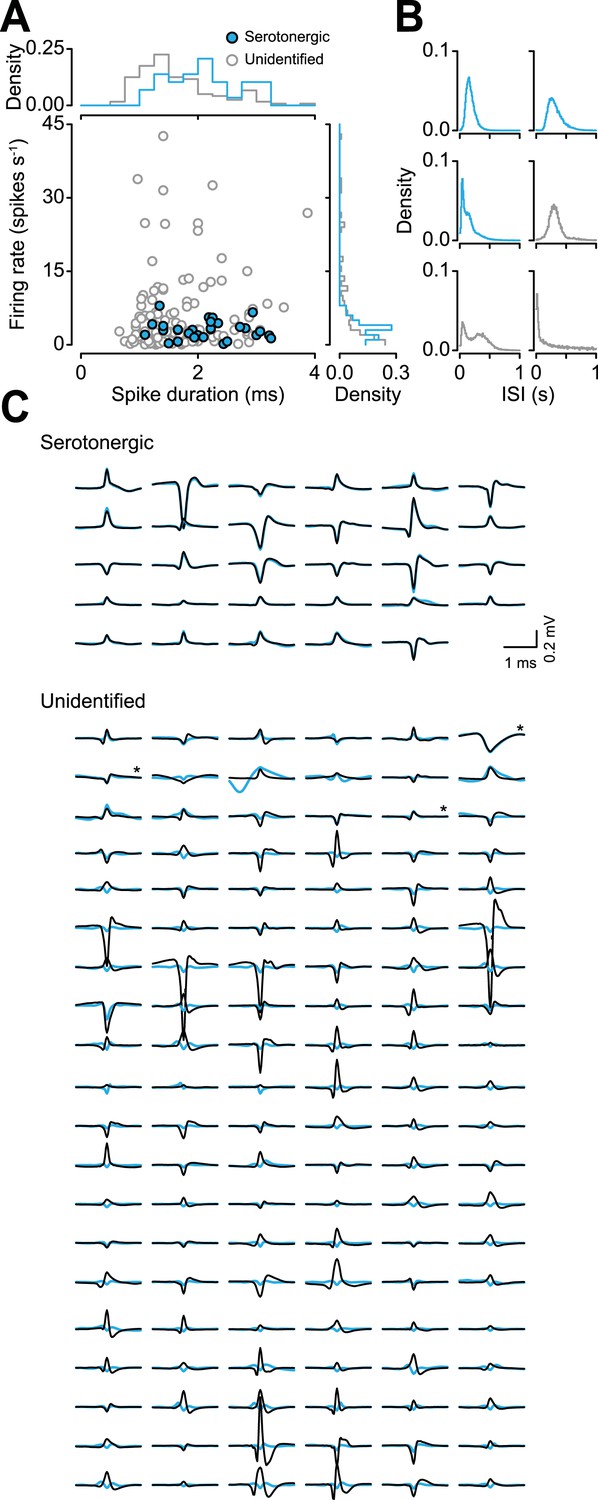
Serotonergic neurons cannot be identified based on firing properties in this data set.
(A) Firing rate vs spike duration with marginal density histograms. Serotonergic neurons had significantly longer spike duration than unidentified neurons (Wilcoxon rank sum test, p < 0.05). (B) Example inter-spike interval (ISI) density histograms for three serotonergic neurons and three unidentified neurons. (C) Mean spontaneous spikes (black) and light-evoked voltages (cyan) from all serotonergic and unidentified neurons. Asterisks indicate the three unidentified neurons from the lower-right cluster in Figure 2B.
Download links
A two-part list of links to download the article, or parts of the article, in various formats.
Downloads (link to download the article as PDF)
Open citations (links to open the citations from this article in various online reference manager services)
Cite this article (links to download the citations from this article in formats compatible with various reference manager tools)
Serotonergic neurons signal reward and punishment on multiple timescales
eLife 4:e06346.
https://doi.org/10.7554/eLife.06346


