Mass enhances speed but diminishes turn capacity in terrestrial pursuit predators
- Swansea University, Wales
- The Lewis Foundation, South Africa
- University of Oxford, United Kingdom
- Zoological Society of London, United Kingdom
- University of Pretoria, South Africa
- Queen's University Belfast, United Kingdom
Figures
Figure 1

Two sequential prey turns during predator-prey pursuits showing the trajectories (left-hand figures) adopted by both prey (blue lines) and predator (red lines) during instances of turns that are (A) too early or (B) correctly timed by the prey, leading to corner-cutting or overshooting, respectively, by the predator.
(C) shows the scenario where the predator and prey adopt identical trajectories. The right hand figures show how the distance between the predator and prey varies with time for the shown trajectories.
Figure 2

Predator-prey distance during pursuit as a function of time during an execution of an unexpected 90° turn by the prey followed by straight-line travel, for; (A) different predator-prey distances at the moment of the execution of the turn by the prey (indicated by the dashed vertical line) [reaction time of the predator = 0.3 s, predator and prey speeds 20 and 15 m/s, respectively], (B) different predator speeds (black line shows a speed of 18 m/s and increasingly pale lines show speeds of 19 and 20 m/s respectively) [reaction time of predator = 0.3 s ] (C) different reaction times by the predator (black line shows a reaction time of 0.5 s and increasingly pale lines show reactions times of 1.0, 1.5 and 2.0 s, respectively) [predator and prey speeds = 20 and 15 m/s, respectively].
https://doi.org/10.7554/eLife.06487.004
Figure 3

Predicted difference in distance travelled during a 90° turn by two different predators, one of mass 30 kg (e.g., a cheetah or wolf—continuous grey lines) and one of mass 250 kg (e.g., a lion or tiger—black dashed lines) compared to that travelled by prey of various masses (indicated by different symbols) as a function of running speed.
Prey masses might correspond to for example, 3 kg—a hare, 10 kg—a steenbok, 40 kg—a springbok, 100 kg—a white-tailed deer, 200 kg—a hartebeest. Positive values show a greater distance run by the predator, negative values show greater distance run by the prey. Note that not all speeds reach 15 m/s due to the smallest prey not being predicted to reach this maximum (see text).
Figure 4
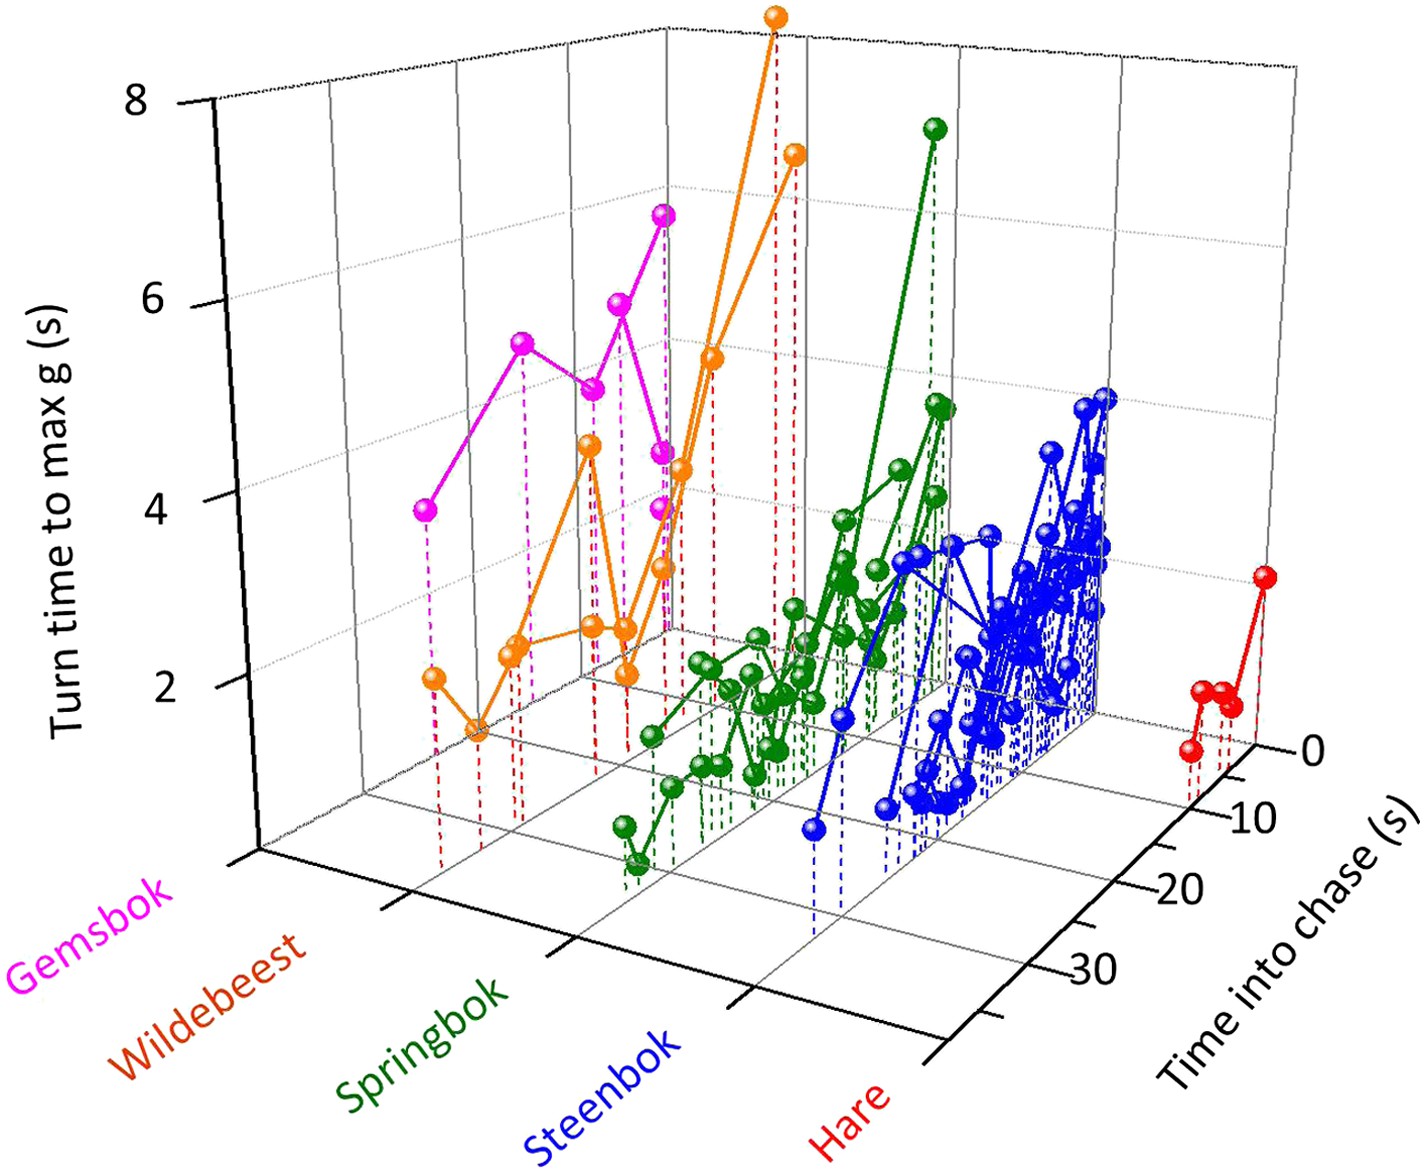
The duration of turns (expressed as the length of time between the onset of the turn and the point at which maximum g was reached within the turn) made by cheetahs pursuing different prey with time into the chase.
Joined points show chases referring to individual prey. Longer turns will tend to have larger turn radii so while, overall, pursuit of larger prey is characterized by larger turn radii, turn radii diminish as the chase progresses.
Figure 5
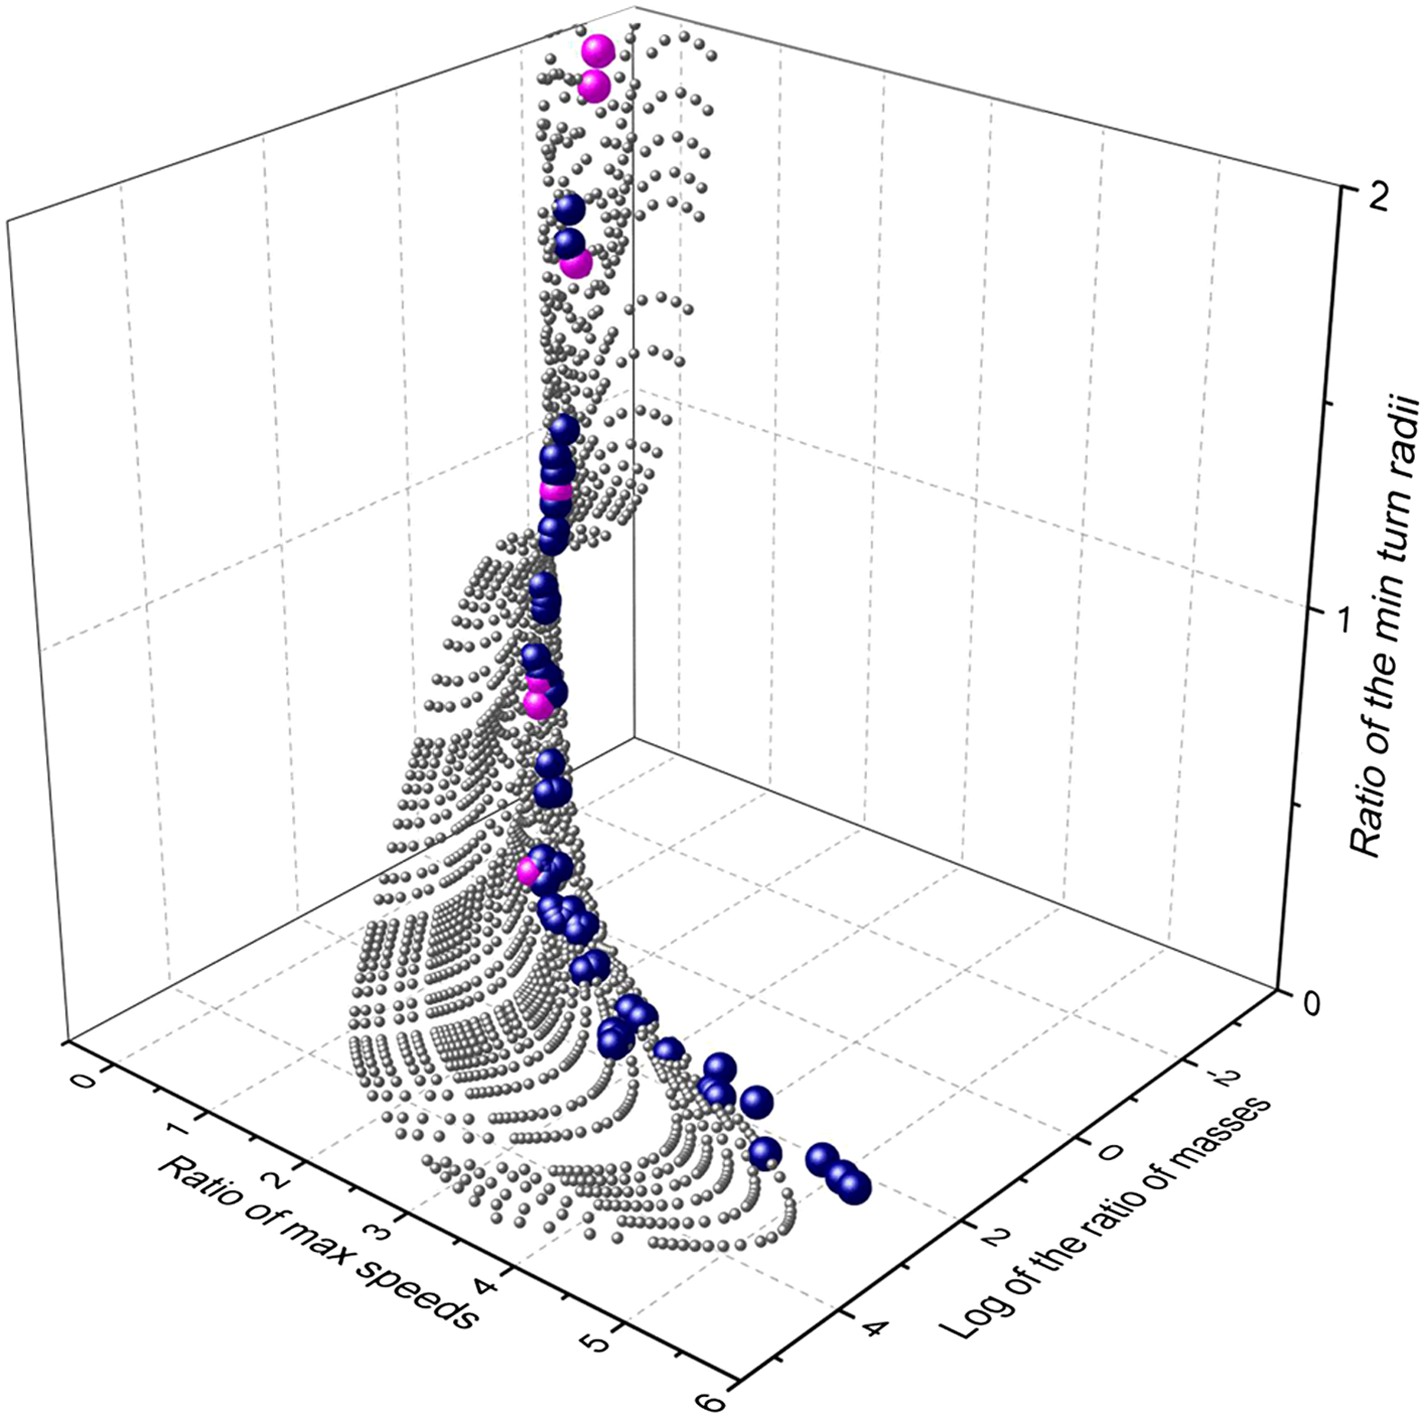
Relationship between mass and performance for predators and prey derived from the model.
Performance is expressed as maximum speed ratio (Vmax pred/Vmax prey; higher values indicate relatively faster predators) and minimum turn radius (Tmin prey/Tmin pred; higher values indicate relatively tighter turning predators). The grey spheres indicate the range of possible options computed systematically, the blue spheres represent single predator species computed against their mean prey masses, while the cyan spheres indicate the specific case of the cheetah, taking variously sized prey items across the size range.
Figure 6

Schematic figure to show how power use is expected to vary during the course of a predator-prey chase consisting of four straight-line trajectories interspaced with three turns (turns made by the prey are shown between arrows) by both parties.
The prey (dashed line) has lower energy expenditure than the predator during straight-line sections because it is travelling slower. However, because extra power is required for a turn (Wilson et al., 2013c), a predator that consistently cuts the corner (dark grey line—‘predator with undershoot’—cf. Figure 1) spends less time cornering, expending less energy for the corner, and may maintain energy expenditure at levels similar to those of the prey despite travelling faster: Here both parties may reach limits to endurance performance at a similar time. However, a predator that consistently overshoots the corner (light grey line—‘predator with overshoot’—cf. Figure 1) spends longer turning, expending markedly more energy than the prey at all times, reaching endurance limits earlier. (In this depiction, predators and prey are assumed to have the same geometry, performances and masses).
Figure 7
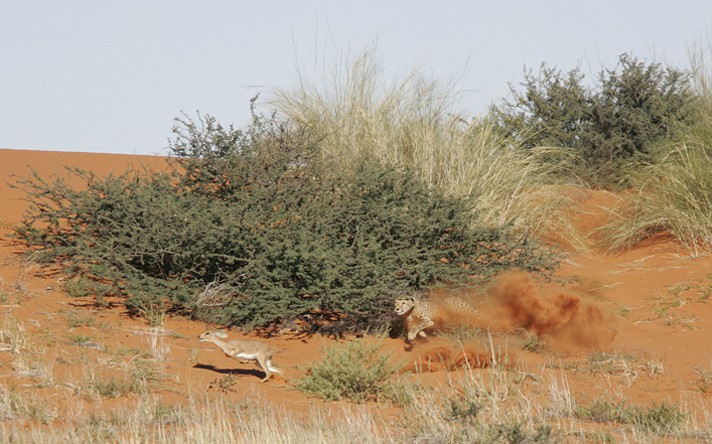
Pursuit of a steenbok which has turned as it ran past a bush, constraining the cheetah to follow almost the same trajectory.
The use of environmental features such as this makes the timing of the turn less critical since the cheetah cannot cut the corner substantially, even if the prey turns too early.
Figure 8
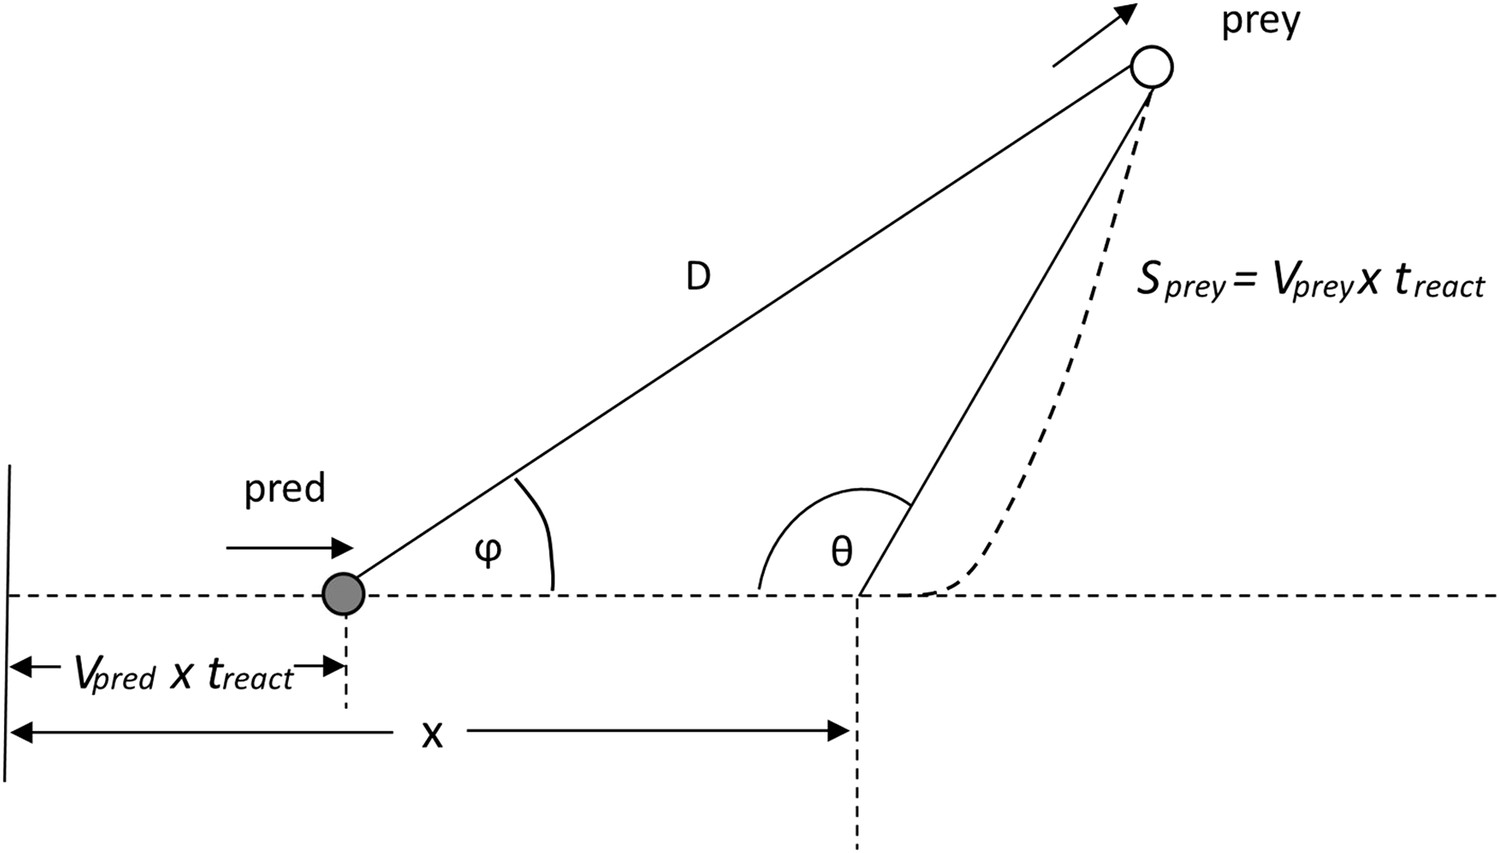
Illustration of the heading Φ of a prey to a predator at a time treact after the prey begins to move.
D is the distance between the predator and prey after the predator's reaction time.
Figure 9
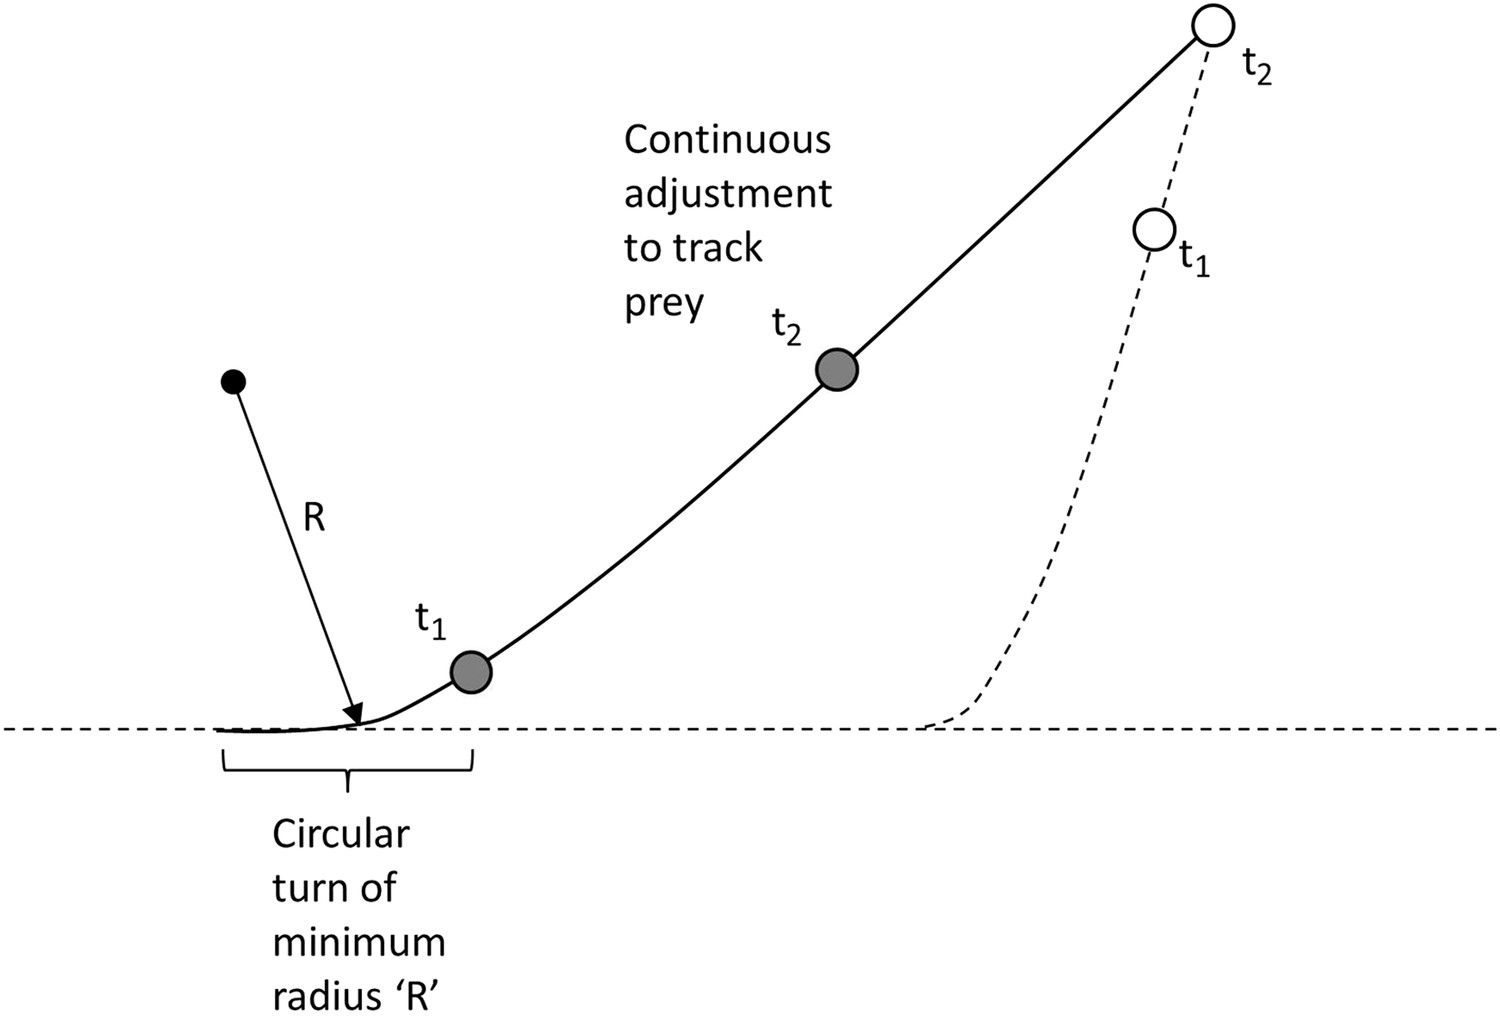
Modelling the predator's movement as an initial turn of minimum radius followed by continuous alteration of direction to track moving prey.
https://doi.org/10.7554/eLife.06487.012
Figure 10
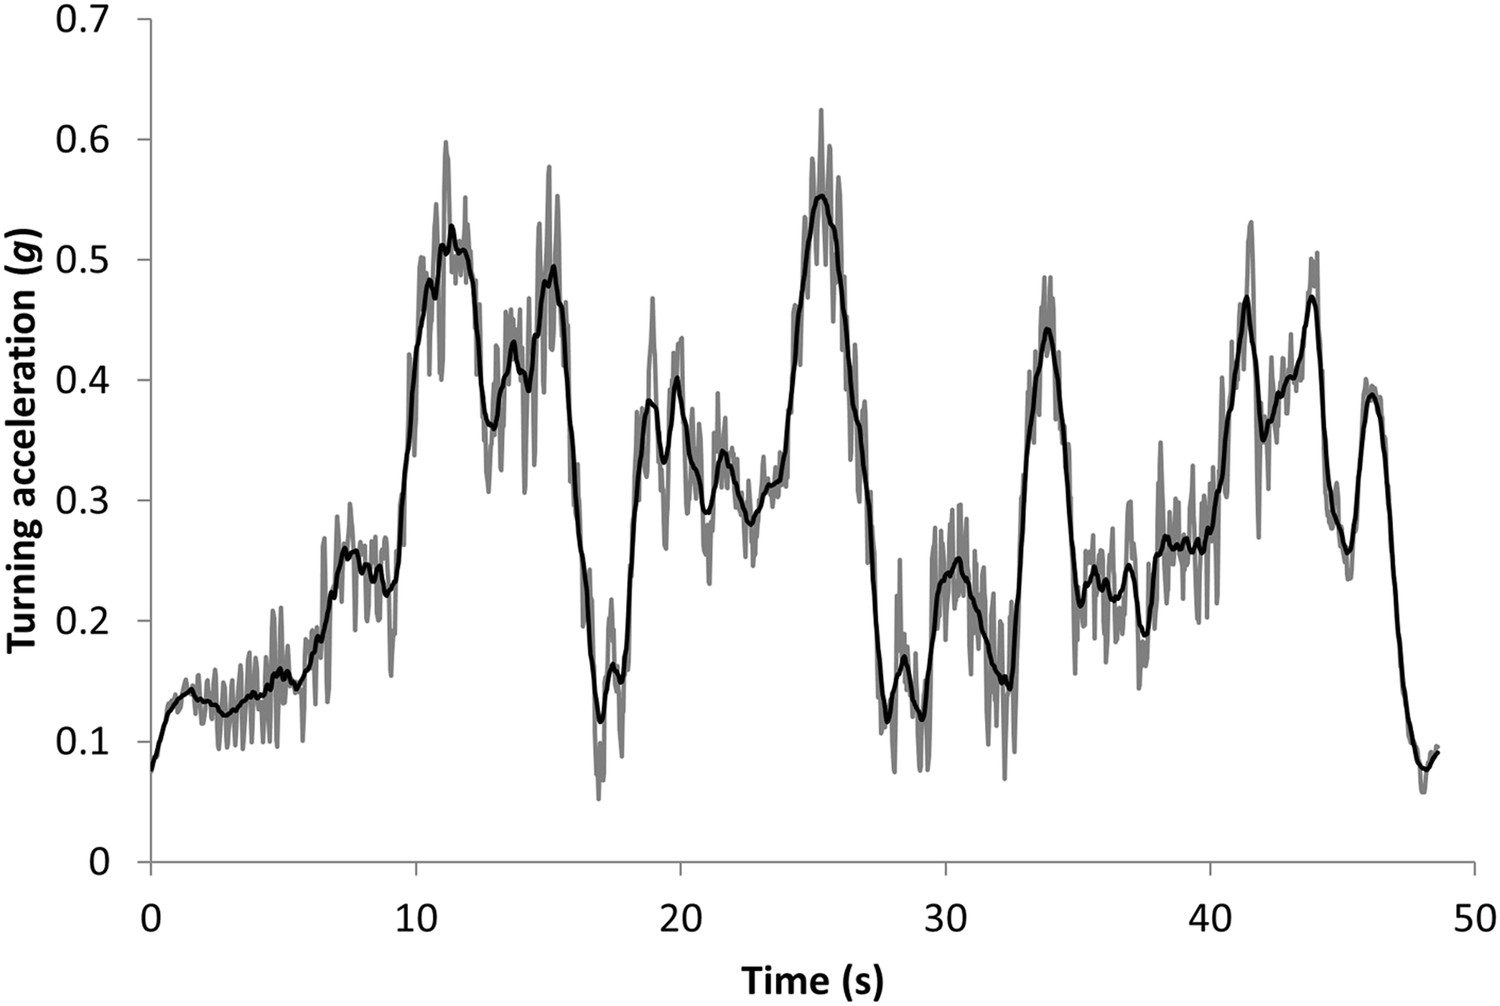
Data showing the vectorial sum of the static heave and sway acceleration axes (expressed as a departure from 1) during the pursuit phase of a cheetah hunting a steenbok.
The grey lines show the values using a running mean window of 2 s, which still shows appreciable signal noise due to the bounding movement of the animal. These values have been further smoothed over 0.5 s to give the black line which shows the main features of the lateral acceleration during turns with maximum g-forces developed during turns displayed as peaks.
Author response image 1
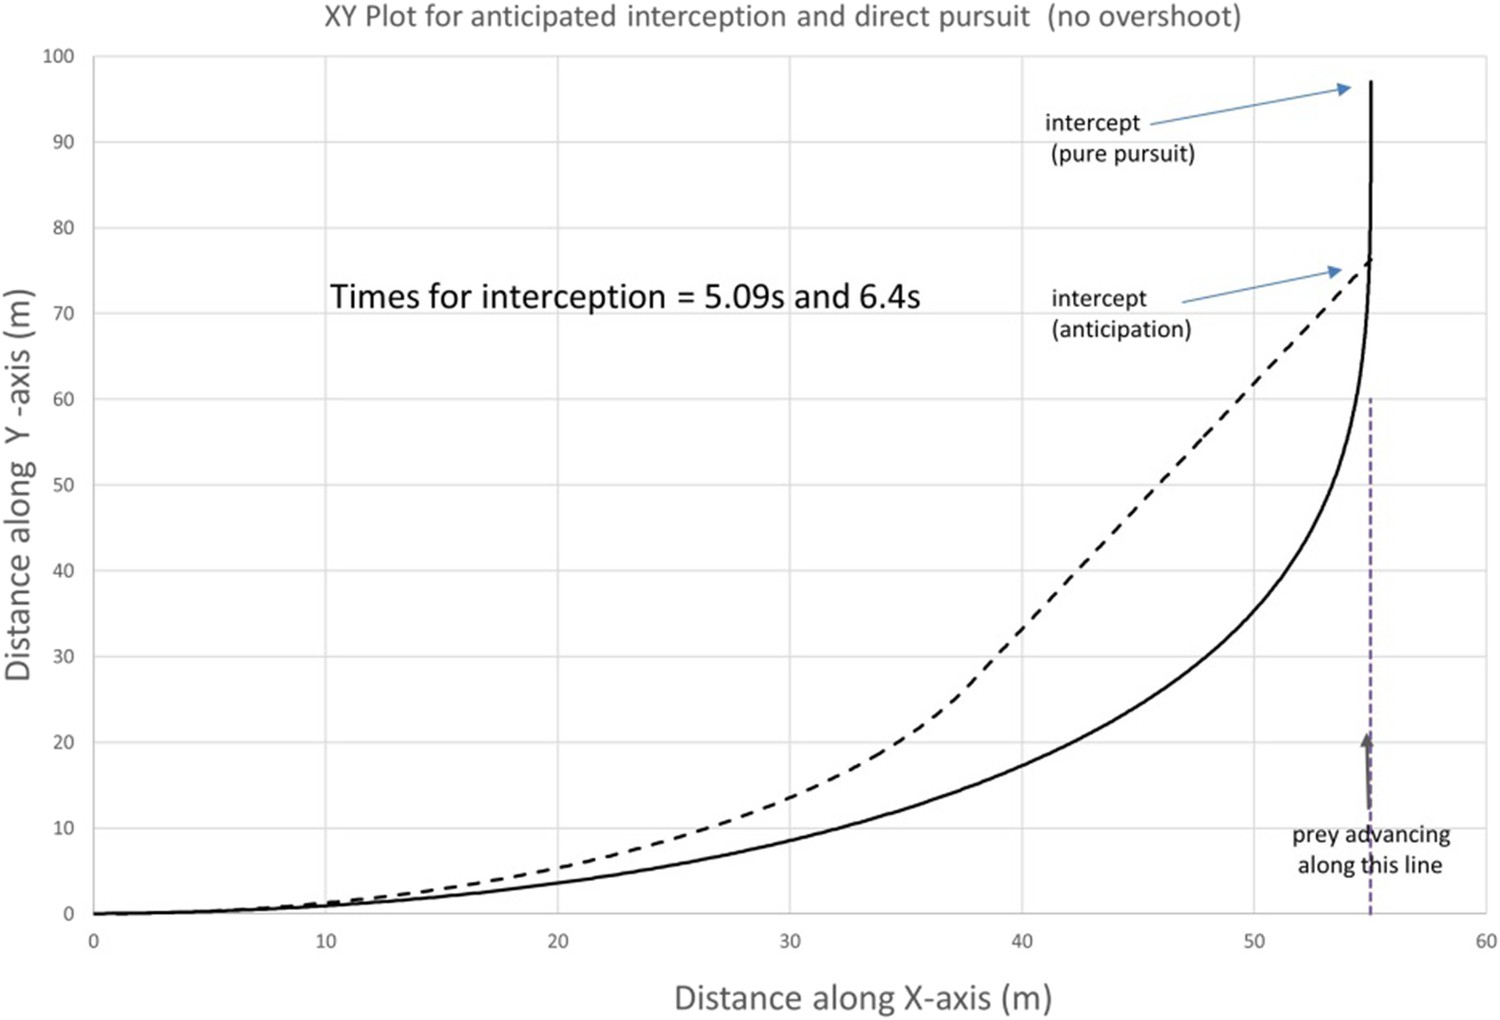
Trajectories for a predator starting a chase at 55 m from prey (greater than the predator’s minimum radius of turn, 40 m) showing (by the continuous line) the predator turning to follow the prey with its minimum turn radius until the prey is directly ahead and then adjusts its direction continuously to keep the prey dead ahead and (by the dashed line) the predator turning with its minimum turn radius of 40 m until it is in a direction that corresponds to the anticipated point of interception with the prey whereupon it continues in a straight line (constant bearing) to that point. Predator and prey speeds are 20 and 15 m/s, respectively. Times until interception are shown within the plot.
Author response image 2
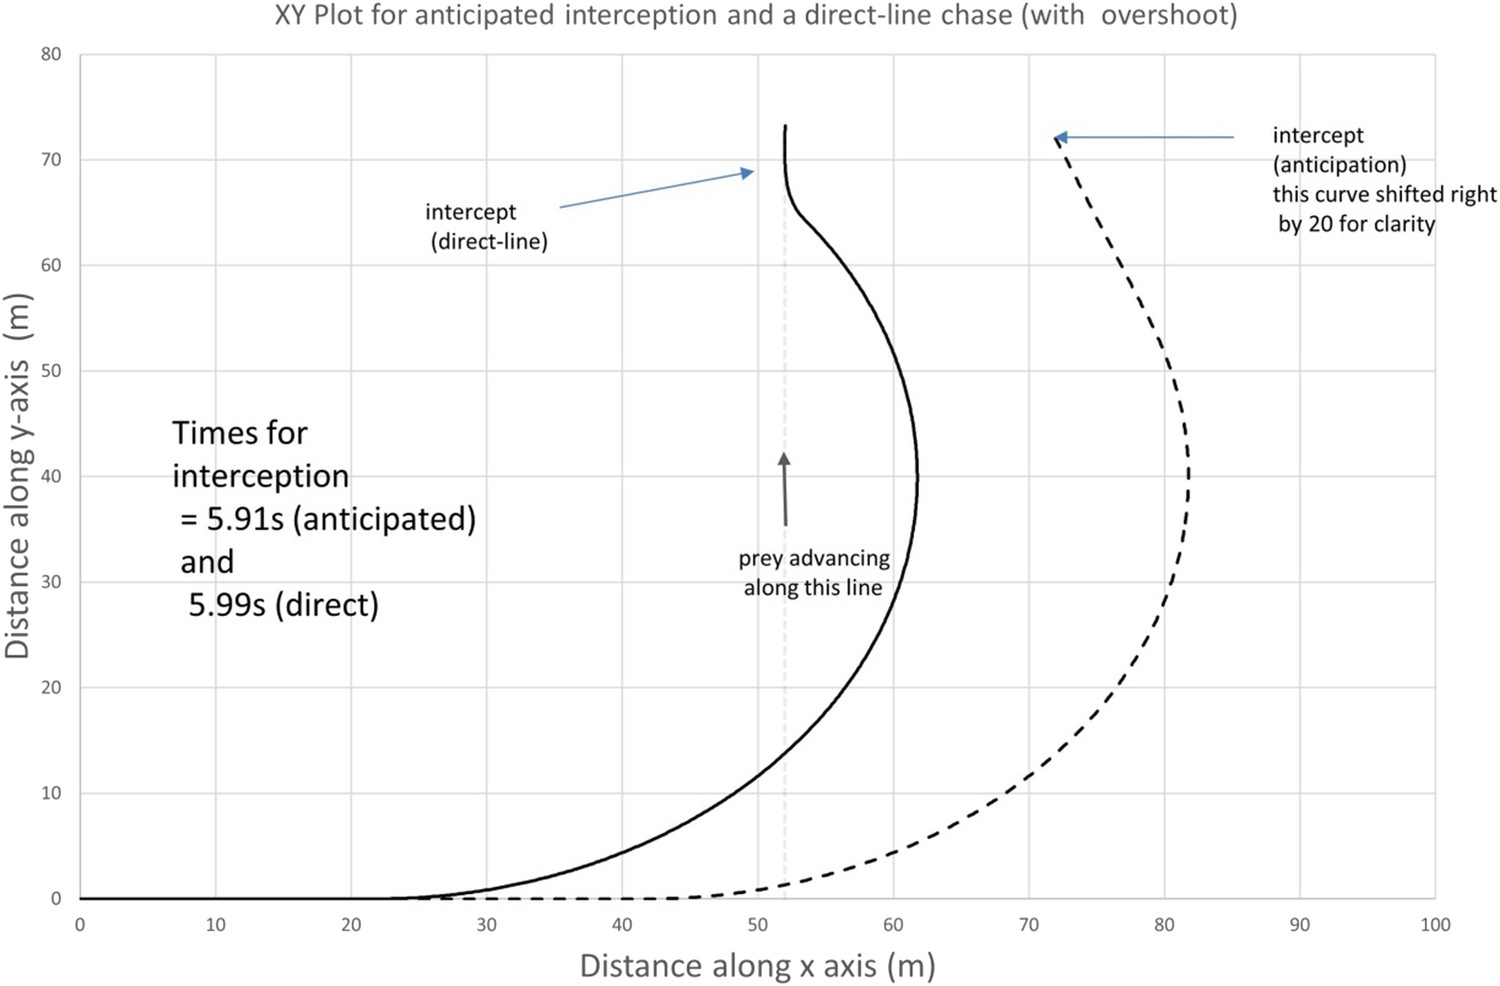
Conditions as in Author response image 1, except that the predator starts at 30 m from the prey, leading to an overshoot (note that the anticipatory chase has been shifted 20 m in the x-direction for clarity)
Author response image 3

Time vs distance between predator and prey plot for the overshoot scenario depicted in Author response image 2 for direct (blue dashed line) and anticipatory (red continuous line) pursuits. Note how, in all scenarios, although the two different pursuit strategies result in different values of the outputs, they do not change the fundamentals in the form of either the trajectories or the distance vs time plots (cf. Figure 2 in the manuscript) with either over-shoots or corner-cutting depending on turn radius.
Tables
Table 1
Summary of the characteristics of cheetah-prey pursuits with prey nominally ranked in order of mass (top smallest to bottom largest)
| Prey | Chase parameters | |||||||
|---|---|---|---|---|---|---|---|---|
| No. hunts | Success | Total duration (s) | No. of turns | Turn rate (Hz) | ||||
| N | % | Mean | SD | Mean | SD | Mean | SD | |
| Hare | 2 | 100 | 10.8 | – | 5 | 0.5 | 0.26 | |
| Steenbok | 19 | 53 | 28.7 | 11.9 | 5.47 | 2.97 | 0.32 | 0.19 |
| Duiker | 1 | 100 | – | – | – | – | – | – |
| Springbok | 7 | 57 | 28.3 | 7 | 6.17 | 3.06 | 0.32 | 0.17 |
| Ostrich | 1 | 100 | – | – | – | – | – | – |
| Wildebeest | 2 | 50 | 35 | 3.2 | 6.5 | 0.71 | 0.22 | 0.09 |
| Gemsbok | 4 | 75 | 18.6 | 10.6 | 2.33 | 1.53 | 0.15 | 0.05 |
-
Two species were pursued where no corresponding acceleration data were available.
Download links
A two-part list of links to download the article, or parts of the article, in various formats.
Downloads (link to download the article as PDF)
Open citations (links to open the citations from this article in various online reference manager services)
Cite this article (links to download the citations from this article in formats compatible with various reference manager tools)
Mass enhances speed but diminishes turn capacity in terrestrial pursuit predators
eLife 4:e06487.
https://doi.org/10.7554/eLife.06487


