Tip cell-specific requirement for an atypical Gpr124- and Reck-dependent Wnt/β-catenin pathway during brain angiogenesis
- University of California, San Francisco, United States
- Max Planck Institute for Heart and Lung Research, Germany
- Université Libre de Bruxelles, Belgium
- Johns Hopkins University School of Medicine, United States
- National Cerebral and Cardiovascular Center Research Institute, Japan
- Howard Hughes Medical Institute, Johns Hopkins University School of Medicine, United States
Figures
Figure 1 with 2 supplements

CNS vascular defects in gpr124 mutants.
(A) Schematic representation of Gpr124 structure and TALEN target site locations corresponding to gpr124s984 and gpr124s985 alleles. LRR: leucine-rich repeats; LRRCT: leucine-rich repeat C-terminal domain; Ig: Ig-like domain; HBD: hormone binding domain; GAIN: GPCR-autoproteolysis inducing domain; GPS: GPCR proteolysis site; PBD: PDZ binding domain. (B) Lateral views of wild-type, gpr124s984/s984 and gpr124s985/s985 larvae at 5 dpf. (C) Lateral views of wild-type, gpr124s984/s984 and gpr124s985/s985 Tg(kdrl:GFP) embryos at 36 hpf (hindbrain region, upper panels) and 24 hpf (trunk region, bottom panels). MCeV: middle cerebral vein. Scale bar, 50 µm. (D) Maximal intensity projection of a confocal z-stack of the cranial vasculature of Tg(kdrl:GFP) wild-type and gpr124s984/s984 embryos at 60 hpf in dorsal views (anterior to the left) and wire diagram of the brain vasculature in lateral (middle panels) and dorso-lateral (bottom panels) views. Red vessels in the 3D renderings represent the intra-cerebral central arteries (CtAs), blue vessels represent the extra-cerebral connections between the PHBC and BA lining the hindbrain ventrally, and gray vessels represent the perineural vessels (PHBC, PMBC, BA, and PCS) to which the central arteries connect in wild-type embryos. Scale bar, 100 μm. (E) Quantification of hindbrain CtAs upon Gpr124 depletion in 60 hpf embryos. (F) Quantification of hindbrain CtAs in control and gpr124 morphants at 60 hpf after injection at the one-cell stage of 100 pg RNA encoding the depicted receptors or Gpr124/Gpr125 hybrid receptors. (G) Vasculature of wild-type and gpr124 mutant adults. Single plane confocal image of the vascular network (upper panels: scale bar, 100 µm) and immunostaining for Slc2a1 and Pgp in sections through the optic tectum (middle panels: scale bars, 20 µm). Evaluation of the optic tectum and liver vessel permeability by fluorescent streptavidin labelling (red signal) 60 min after intracardial injection of sulfo-NHS-biotin in live animals (bottom panels; scale bar, 20 µm). In all panels, values represent means ± SD (*p < 0.05; **p < 0.01; Kruskal–Wallis test). Morpholino and RNA injections were performed as described in ‘Methods’.
Figure 1—figure supplement 1

Generation of gpr124 mutant zebrafish.
(A) A TALEN was designed to target sequences within exon 7 (upper panel) corresponding to the Ig-like domain (right panel). The left and right TAL repeats were linked to FokI DD and FokI RR, respectively. The spacer sequences are highlighted in yellow. The bottom panel shows the sequence alignment of the wild-type allele and the TALEN-generated gpr124s984 allele. The gpr124s984 allele contains an indel mutation (−5 +15 [red]) leading to a premature stop codon after a 10 amino acid-long missense segment (in bold). (B) A TALEN was designed to target sequences within exon 16 (upper panel) corresponding to the second transmembrane helix (right panel). The left and right TAL repeats were linked to FokI DD and FokI RR, respectively. The spacer sequences are highlighted in yellow. The bottom panel shows the sequence alignment of the wild-type allele and the TALEN-generated gpr124s985 allele. The gpr124s985 allele contains a two-nucleotide deletion (red) leading to a premature stop codon after a 39 amino acid-long missense segment (in bold).
Figure 1—figure supplement 2
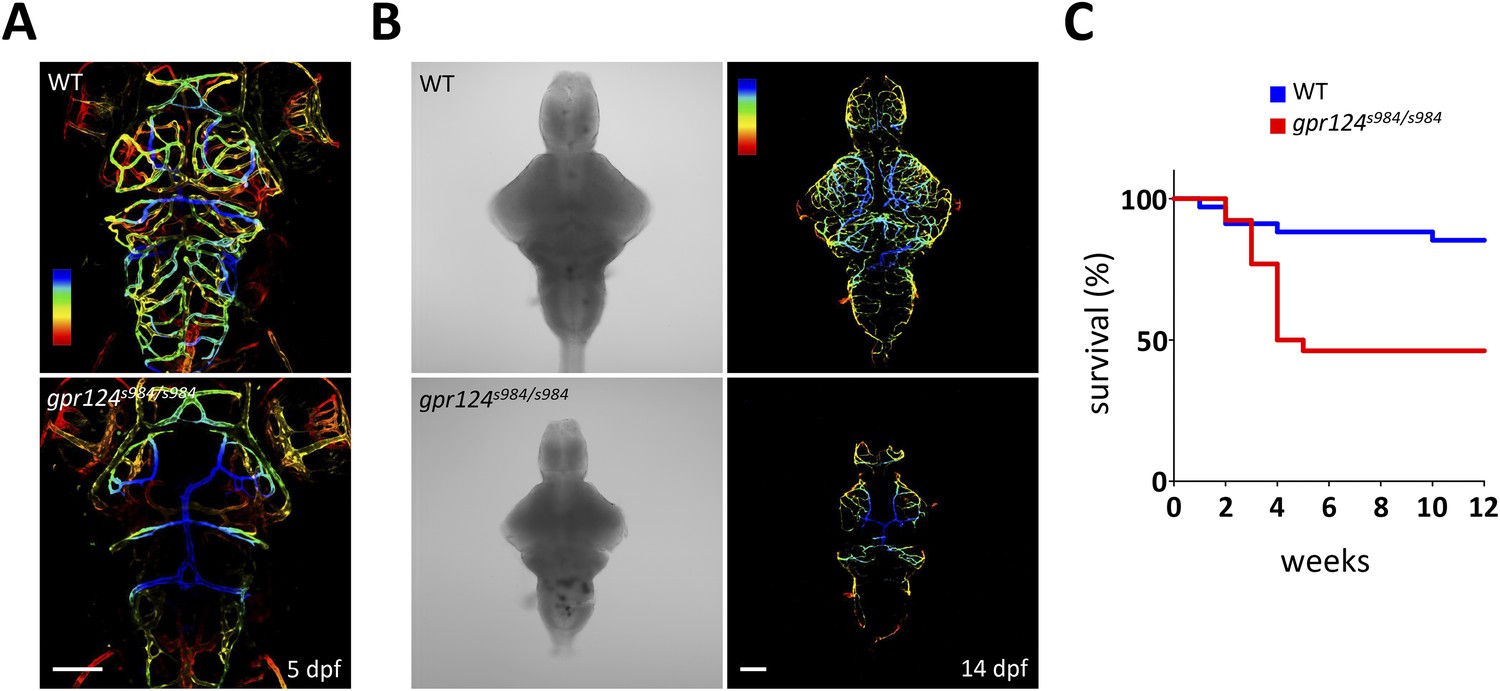
gpr124 mutant survival curve and vascular phenotypes at 5 and 14 dpf.
(A) Maximal intensity projection of a confocal z-stack of Tg(kdrl:GFP) wild-type and gpr124s984/s984 cranial vasculature at 5 dpf in dorsal views color-coded by depth. Dorsal most vessels are blue, ventral most vessels are red. Scale bar, 100 µm. (B) DIC images (left panel) and maximal intensity projection of a confocal z-stack of Tg(kdrl:GFP) wild-type and gpr124s984/s984 cranial vasculature at 14 dpf in dorsal views color-coded by depth (right panels). Dorsal most vessels are blue, ventral most vessels are red. Scale bar, 100 µm. (C) Survival curves of wild-type and gpr124s984/s984 mutants. The survival of respectively 34 and 26 animals was recorded.
Figure 2
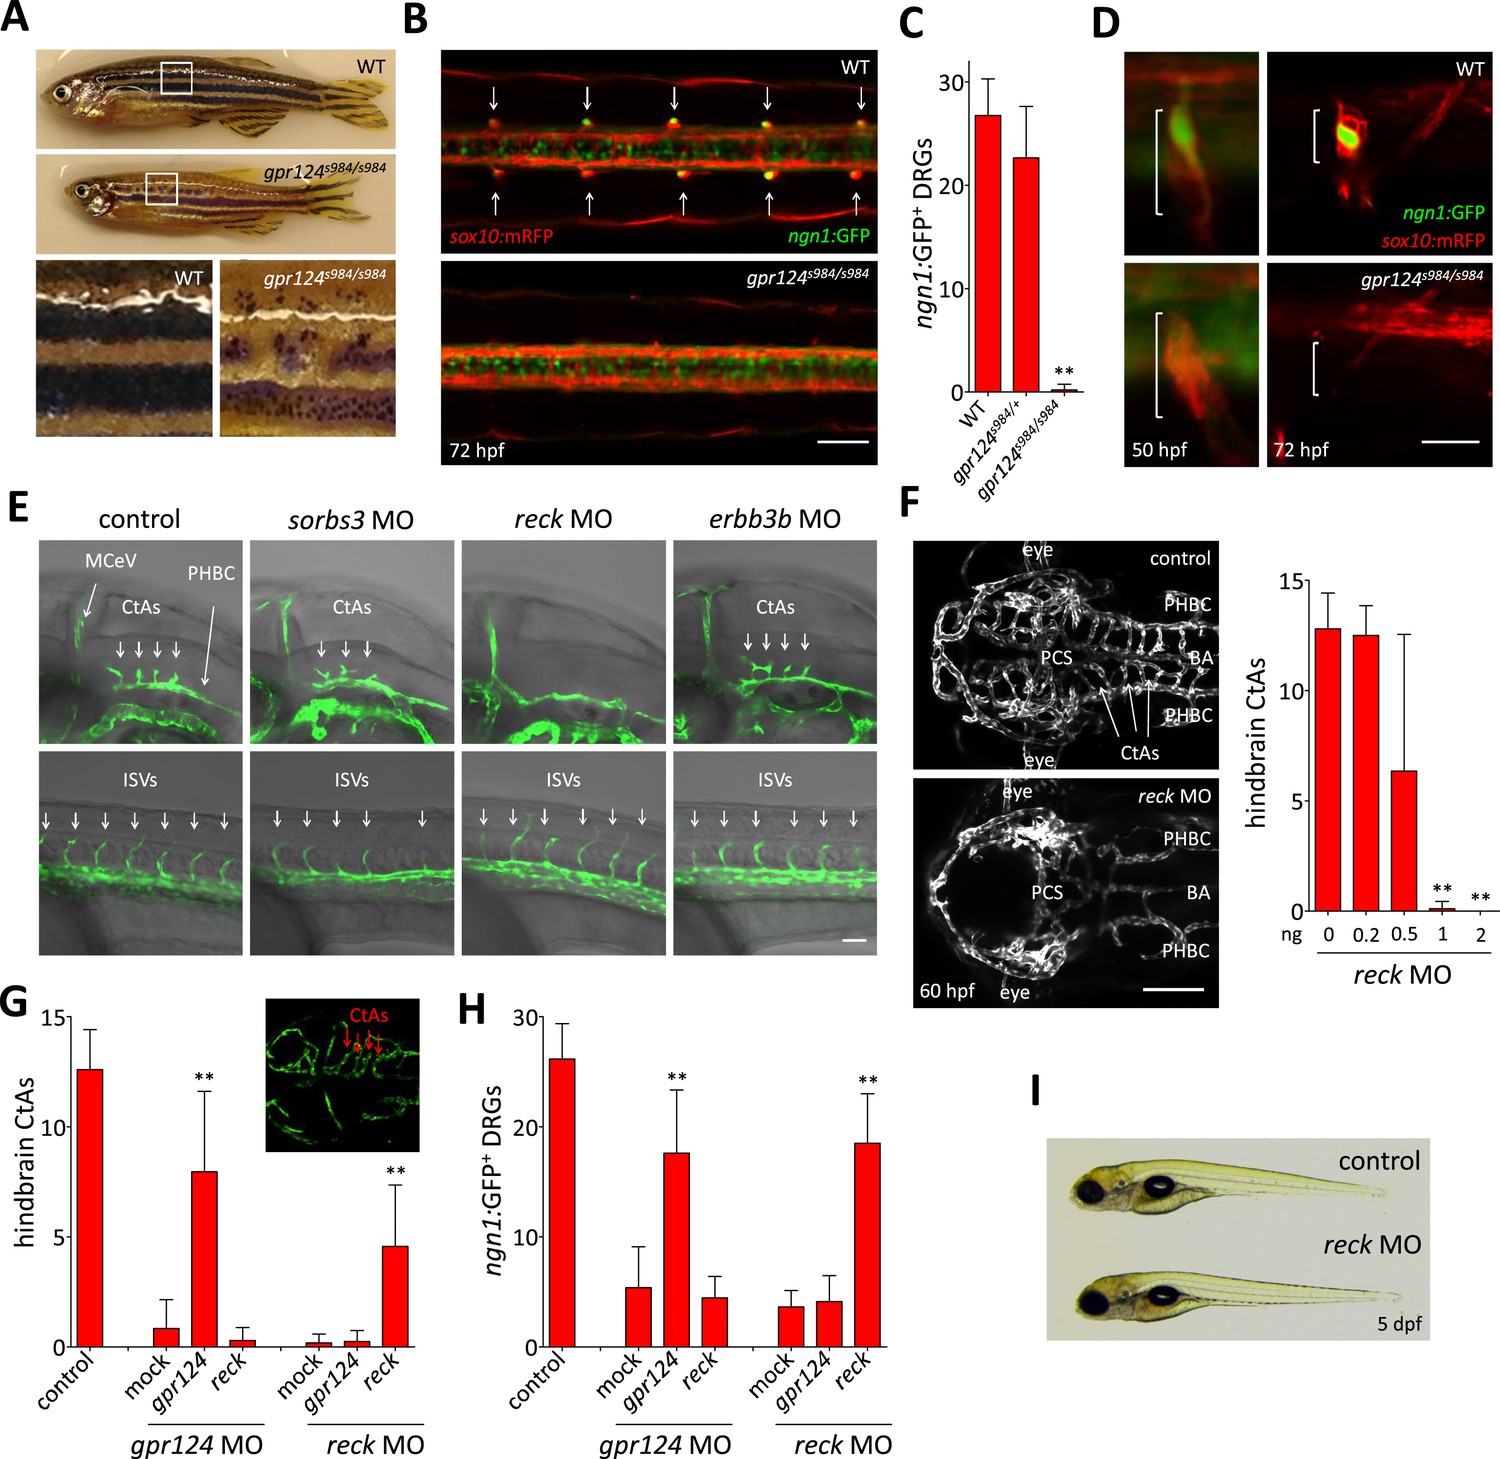
Essential regulation of CNS angiogenesis by Reck.
(A) Lateral views of skin pigmentation patterns of wild-type and gpr124s984/s984 adults. Bottom panels are high magnification images of the upper panel boxed areas. (B) Dorsal views of DRGs in the trunk region of wild-type and gpr124s984/s984 Tg(ngn1:GFP); Tg(sox10:mRPF) larvae at 72 hpf; arrows point to DRGs (anterior to the left). Scale bar, 50 µm. (C) Quantification of ngn1:GFP+ DRGs in 72 hpf wild-type, gpr124s984/+ and gpr124s984/s984 larvae. ngn1:GFP+ DRGs were counted on one side of the larvae. (D) Lateral views of DRG in Tg(ngn1:GFP);Tg(sox10:mRPF) wild-type and gpr124s984/s984 animals. Scale bar, 20 µm. (E) Lateral views (anterior to the left) of Tg(kdrl:GFP) control and morphant embryos at 36 hpf (hindbrain region, upper panels) and 24 hpf (trunk region, bottom panels). Arrows point to the forming CtAs (upper panels) and ISVs (lower panels). Scale bar, 50 µm. (F) Maximal intensity projection of a confocal z-stack of Tg(kdrl:GFP) wild-type and reck morphant cranial vasculature at 60 hpf in dorsal views (anterior to the left; scale bar, 100 µm) and quantification of hindbrain CtAs after Reck downregulation by anti-sense morpholino injections at various doses. (G) Quantification of hindbrain CtAs in control and gpr124 or reck morphants at 60 hpf after injection at the one-cell stage of 100 pg RNA encoding Gpr124 or Reck. The insert shows a typical rescue. (H) Quantification of ngn1:GFP+ DRGs in control and gpr124 or reck morphants at 72 hpf after injection at the one-cell stage of 200 pg RNA encoding Gpr124 or Reck. ngn1:GFP+ DRGs were counted on one side of the larvae. (I) Lateral view of wild-type and reck morphants at 5 dpf. In all panels, values represent means ± SD (*p < 0.05; **p < 0.01; Kruskal–Wallis test). Morpholino and RNA injections were performed as described in ‘Methods’.
Figure 3
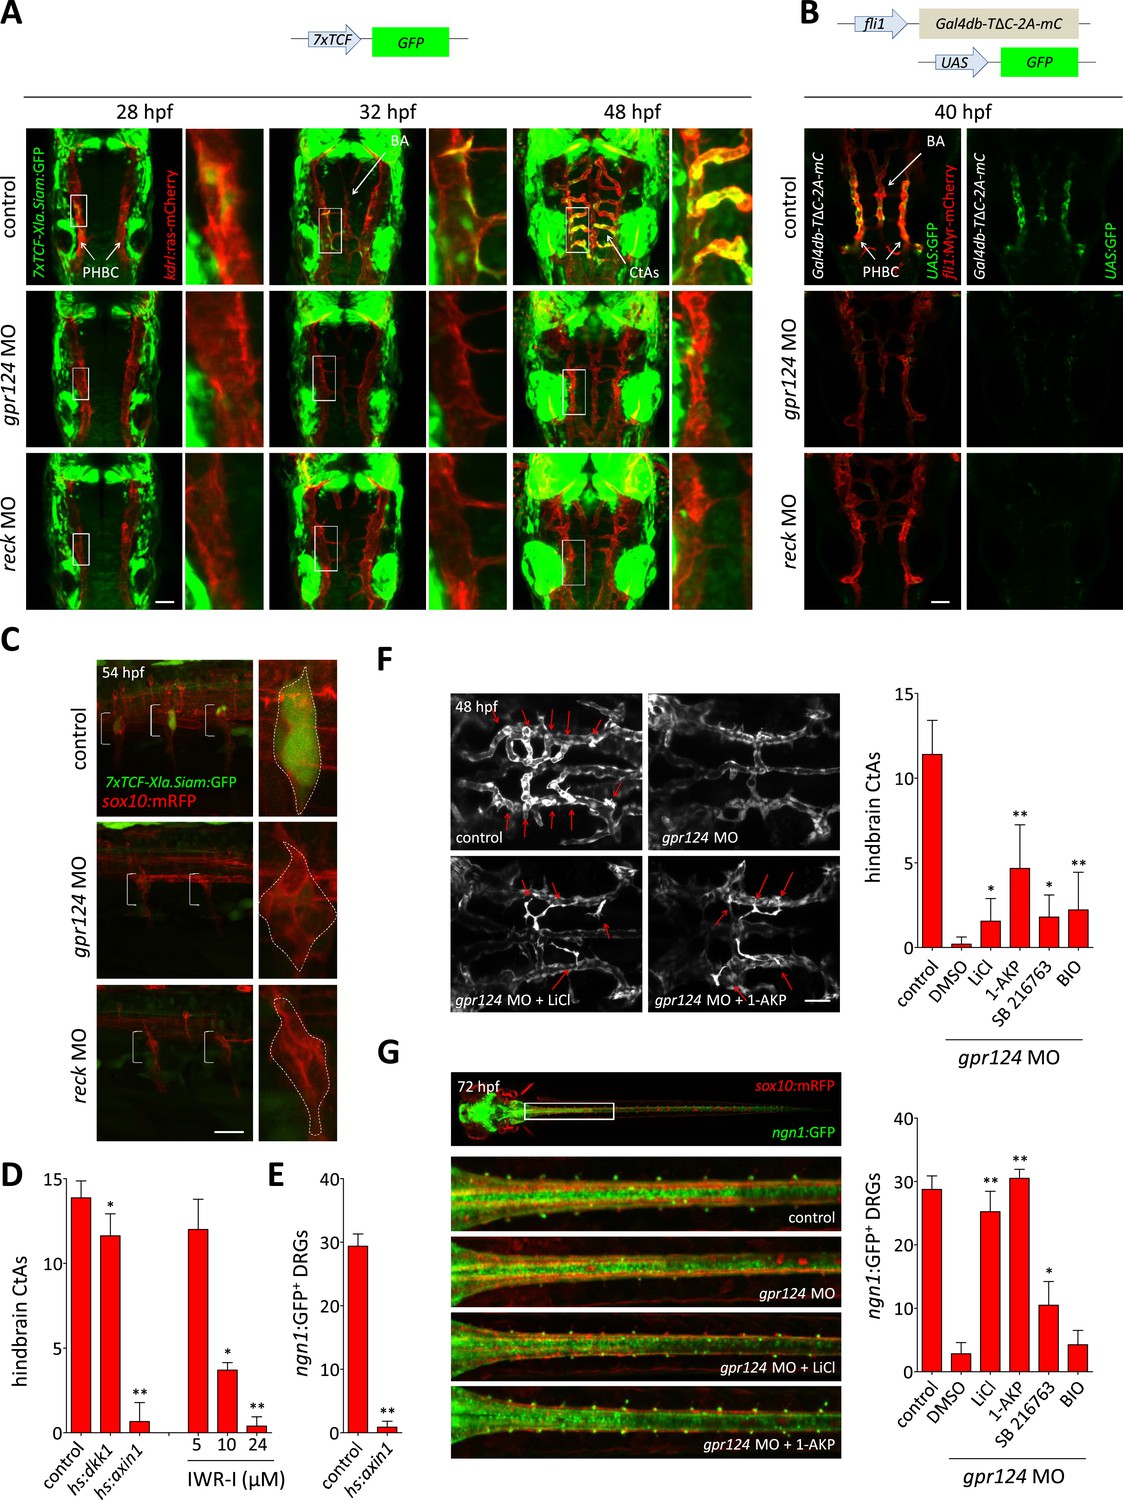
Wnt/β-catenin signaling is controlled by Gpr124 and Reck.
(A) Maximal intensity projection of a confocal z-stack of Tg(7xTCF-Xia.Siam:GFP) Wnt/β-catenin reporter expression during brain vascular development in wild-type, gpr124 or reck morphant Tg(kdrl:ras-mCherry) embryos. (B) Activity of the endothelial-specific Wnt/β-catenin reporter in the PHBC and BA in wild-type, gpr124 or reck morphant Tg(fli1:Myr-mcherry) embryos at 40 hpf. (C) Lateral view of Tg(7xTCF-Xia.Siam:GFP) Wnt/β-catenin reporter expression at 54 hpf in the trunk region of wild-type, gpr124 or reck morphant Tg(sox10:mRPF) embryos (anterior to the left). (D) Quantification of hindbrain CtAs at 60 hpf after genetic and pharmacological inhibition of Wnt/β-catenin signaling. Heat-shock and pharmacological inhibition were performed as described in ‘Methods’. (E) Quantification of ngn1:GFP+ DRGs at 72 hpf after genetic inhibition of Wnt/β-catenin signaling. ngn1:GFP+ DRGs were counted on one side of the larvae. (F) Maximal intensity projection of a confocal z-stack of the cranial vasculature and quantification of hindbrain CtAs in control or gpr124 morphant Tg(kdrl:EGFP) embryos after exposure to the indicated GSK-3β inhibitors from the 16-somite stage onwards. Red arrows point to CtAs. Pharmacological inhibitions were performed as described in ‘Methods’. (G) Dorsal views and quantification of DRGs in control or gpr124 morphant Tg(ngn1:GFP);Tg(sox10:mRPF) embryos after exposure to the indicated GSK-3β inhibitors from the 16-somite stage onwards. ngn1:GFP+ DRGs were counted on one side of the larvae. Pharmacological inhibitions were performed as described in ‘Methods’. Scale bars, 50 µm. In all panels, values represent means ± SD (*p < 0.05; **p < 0.01; Kruskal–Wallis test: (D), (F), and (G); Mann–Whitney test: (E)).
Figure 4 with 1 supplement
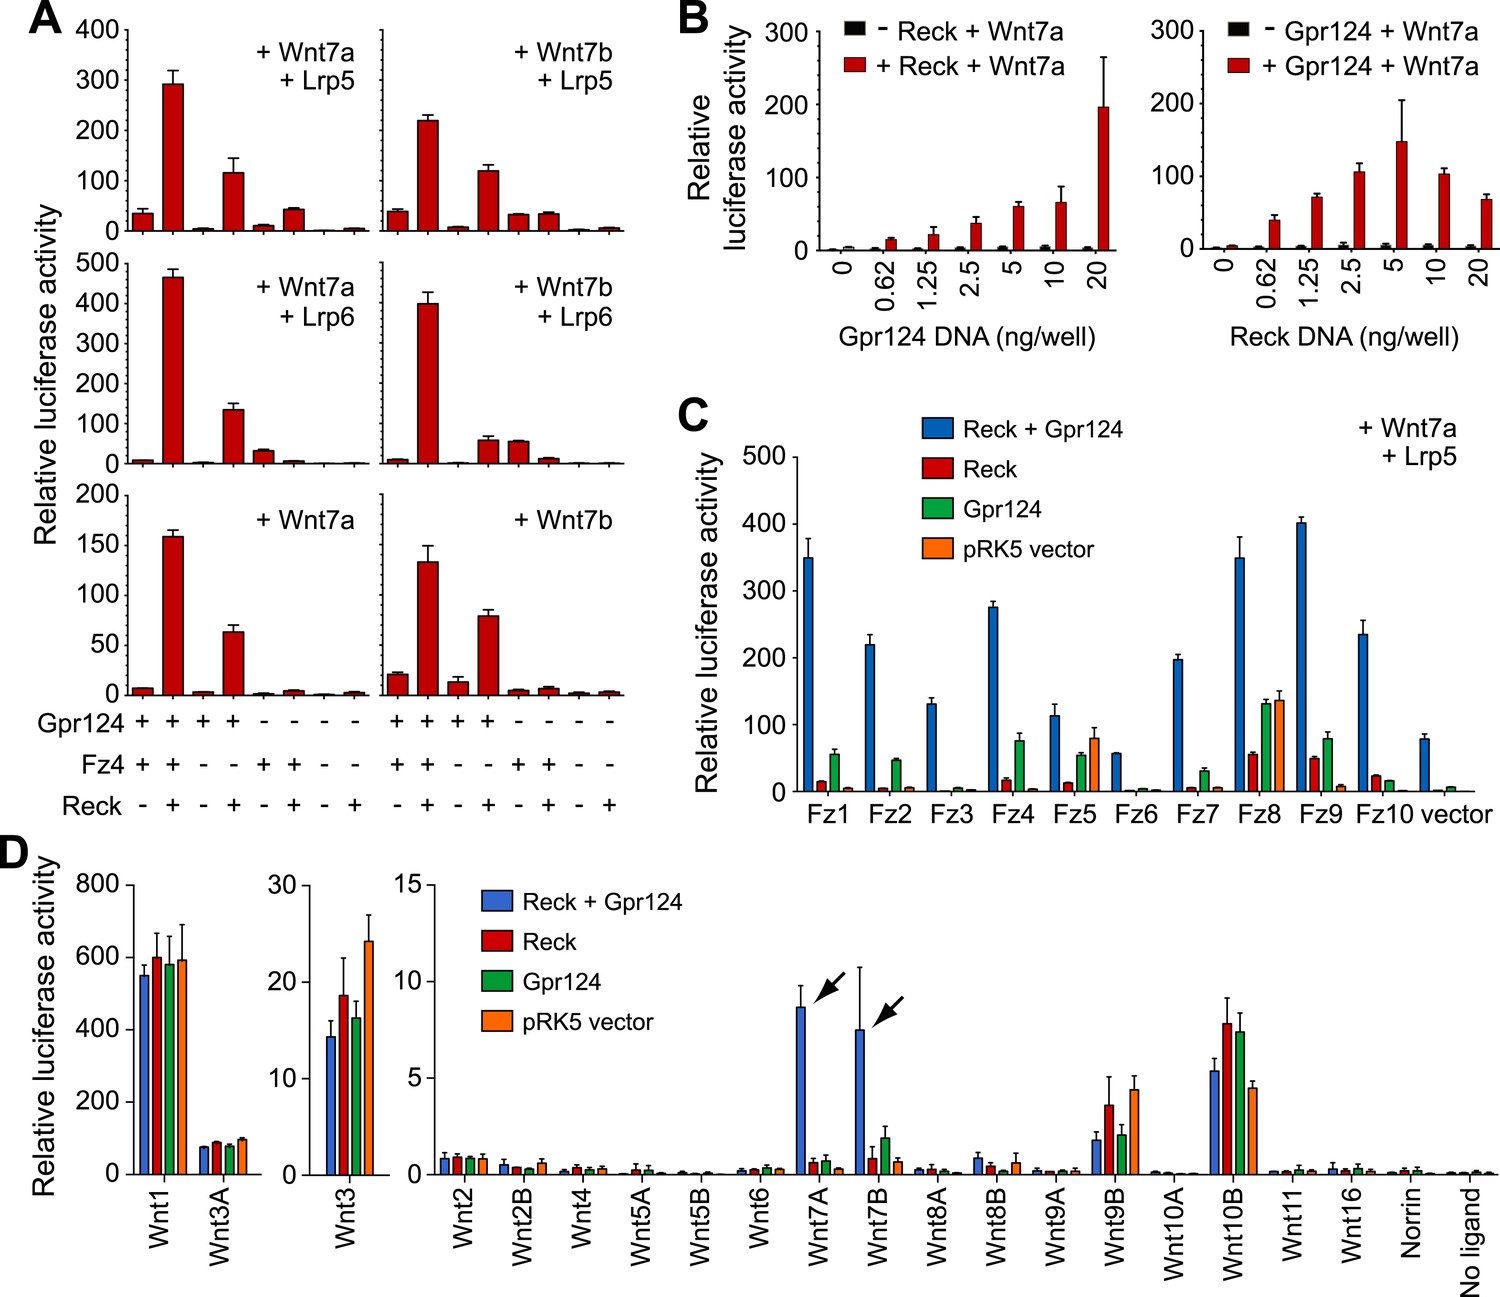
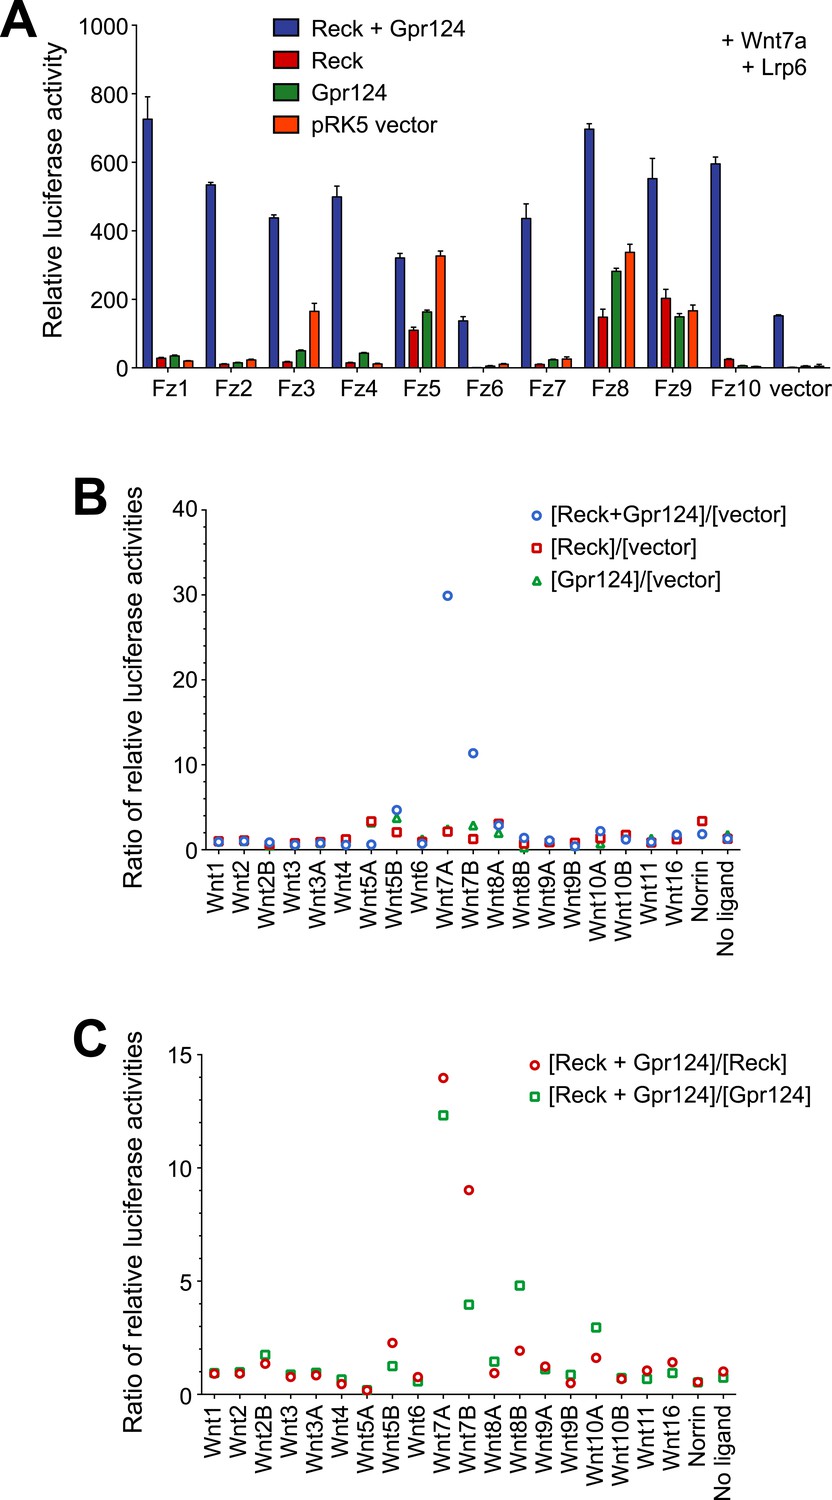
Synergy between Gpr124 and Reck in co-activating Wnt7a- and Wnt7b-dependent Wnt/β-catenin signaling in cell culture.
(A) Plasmids encoding Wnt7a (left) or Wnt7b (right), together with Lrp5 (top row), Lrp6 (center row), or no Lrp (bottom row) were transfected with Gpr124, Fz4, and/or Reck plasmids as indicated. (B) Titration of Gpr124 with or without Reck (left), and titration of Reck with or without Gpr124 (right). (C) Comparison of the ten mouse Frizzleds transfected with Lrp5 and Wnt7a, with or without Gpr124 and/or Reck. (D) Comparison of the nineteen mouse Wnts and Norrin, transfected with or without Gpr124 and/or Reck. Arrows point to Wnt7a and Wnt7b responses. Luciferase assays in transiently transfected STF cells were performed as described in ‘Methods’. Values represent means ± SD.
Figure 4—figure supplement 1
Synergy between Gpr124 and Reck in co-activating Wnt7a- and Wnt7b-dependent Wnt/β-catenin signaling in cell culture.
(A) Comparison of the ten mouse Frizzleds with Lrp6 and Wnt7a, with or without Gpr124 and/or Reck. Bars show mean ± SD from triplicate determinations. (B) Mean ratio of relative luciferase activity in wells with Gpr124 and/or Reck divided by the activity in wells with vector. For each set of transfections (Wnt, Norrin, or no ligand), the plot shows the mean ratio of relative luciferase activity in wells with Gpr124 and/or Reck divided by the activity in wells with vector. The largest ratio increases are observed for Wnt7a and Wnt7b. The relative luciferase activities used for this plot were obtained from Figure 4D. (C) Mean ratio of relative luciferase activity in wells with Gpr124 and Reck divided by the activity in wells with Gpr124 or Reck. For each set of transfections (Wnt, Norrin, or no ligand), the plot shows the mean ratio of relative luciferase activity in wells with Gpr124 and Reck divided by the activity in wells with Gpr124 or Reck. Large ratio elevations are observed for Wnt7a and Wnt7b. Modestly elevated ratios are also observed for Wnt5a, Wnt8a, and Wnt10a, but the relative luciferase activities for these Wnts were extremely low (Figure 4D) and the elevated ratios may simply reflect noise in the measurements. The relative luciferase activities used for this plot were obtained from Figure 4D. Luciferase assays in transiently transfected STF cells were performed as described in ‘Methods’.
Figure 5 with 1 supplement
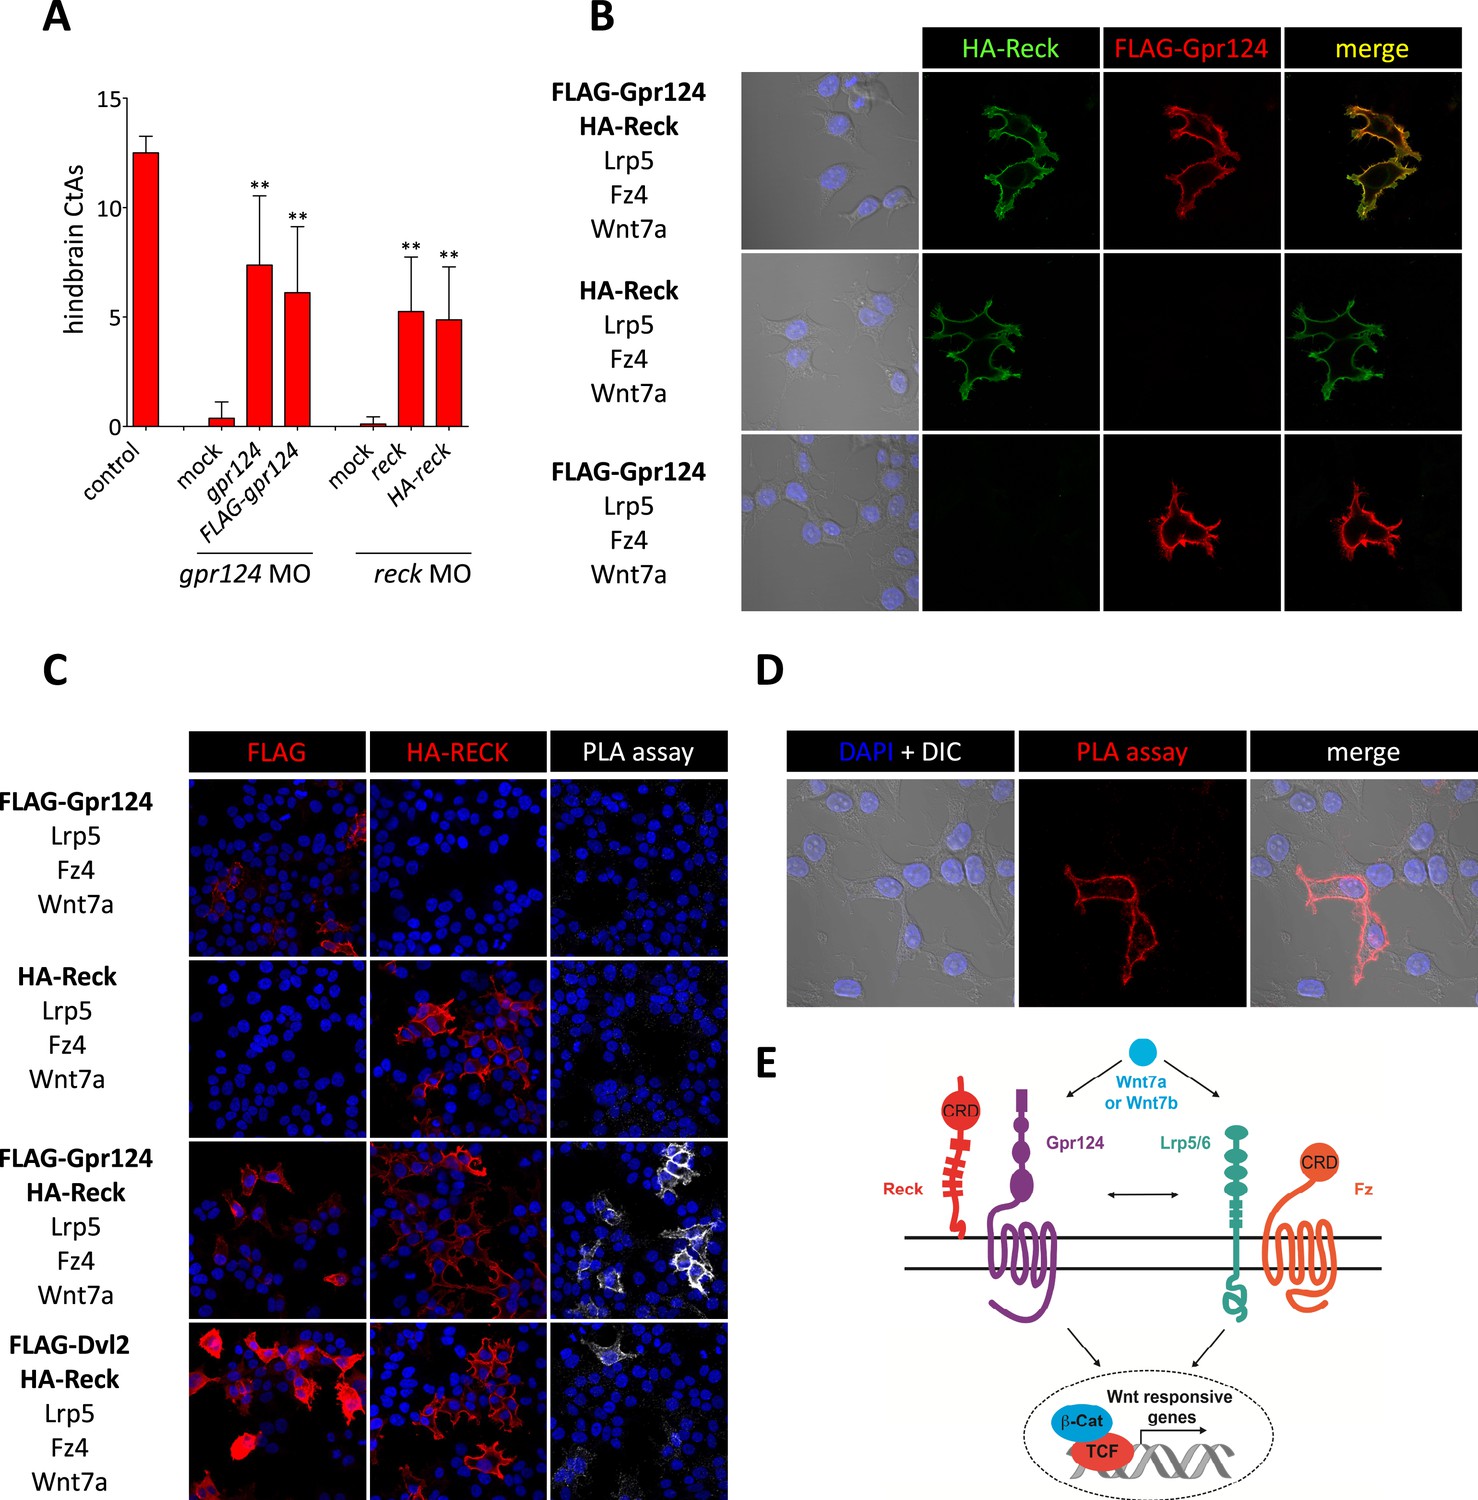
Interaction between Gpr124 and Reck in cultured cells.
(A) Quantification of hindbrain CtAs in control and gpr124 morphants at 60 hpf after injection at the one-cell stage of 100 pg RNA encoding Gpr124, Reck or their epitope-tagged versions, FLAG-Gpr124 and HA-Reck. (B) and (C) Plasmids encoding FLAG-Gpr124, HA-Reck, Lrp5, Fz4, and Wnt7a were transfected in 293 cells as indicated. 48 hours after transfection, epitope-tagged fusion proteins were detected by indirect immunofluorescence (B) or by proximity ligation assays as described in ‘Methods’. (D) High magnification views of PLA signals between FLAG-Gpr124 and HA-reck. (E) Illustration of the plasma membrane protein complexes that mediate Wnt7a or Wnt7b signaling during CNS angiogenesis. Values represent means ± SD (*p < 0.05; **p < 0.01; Kruskal–Wallis test).
Figure 5—figure supplement 1
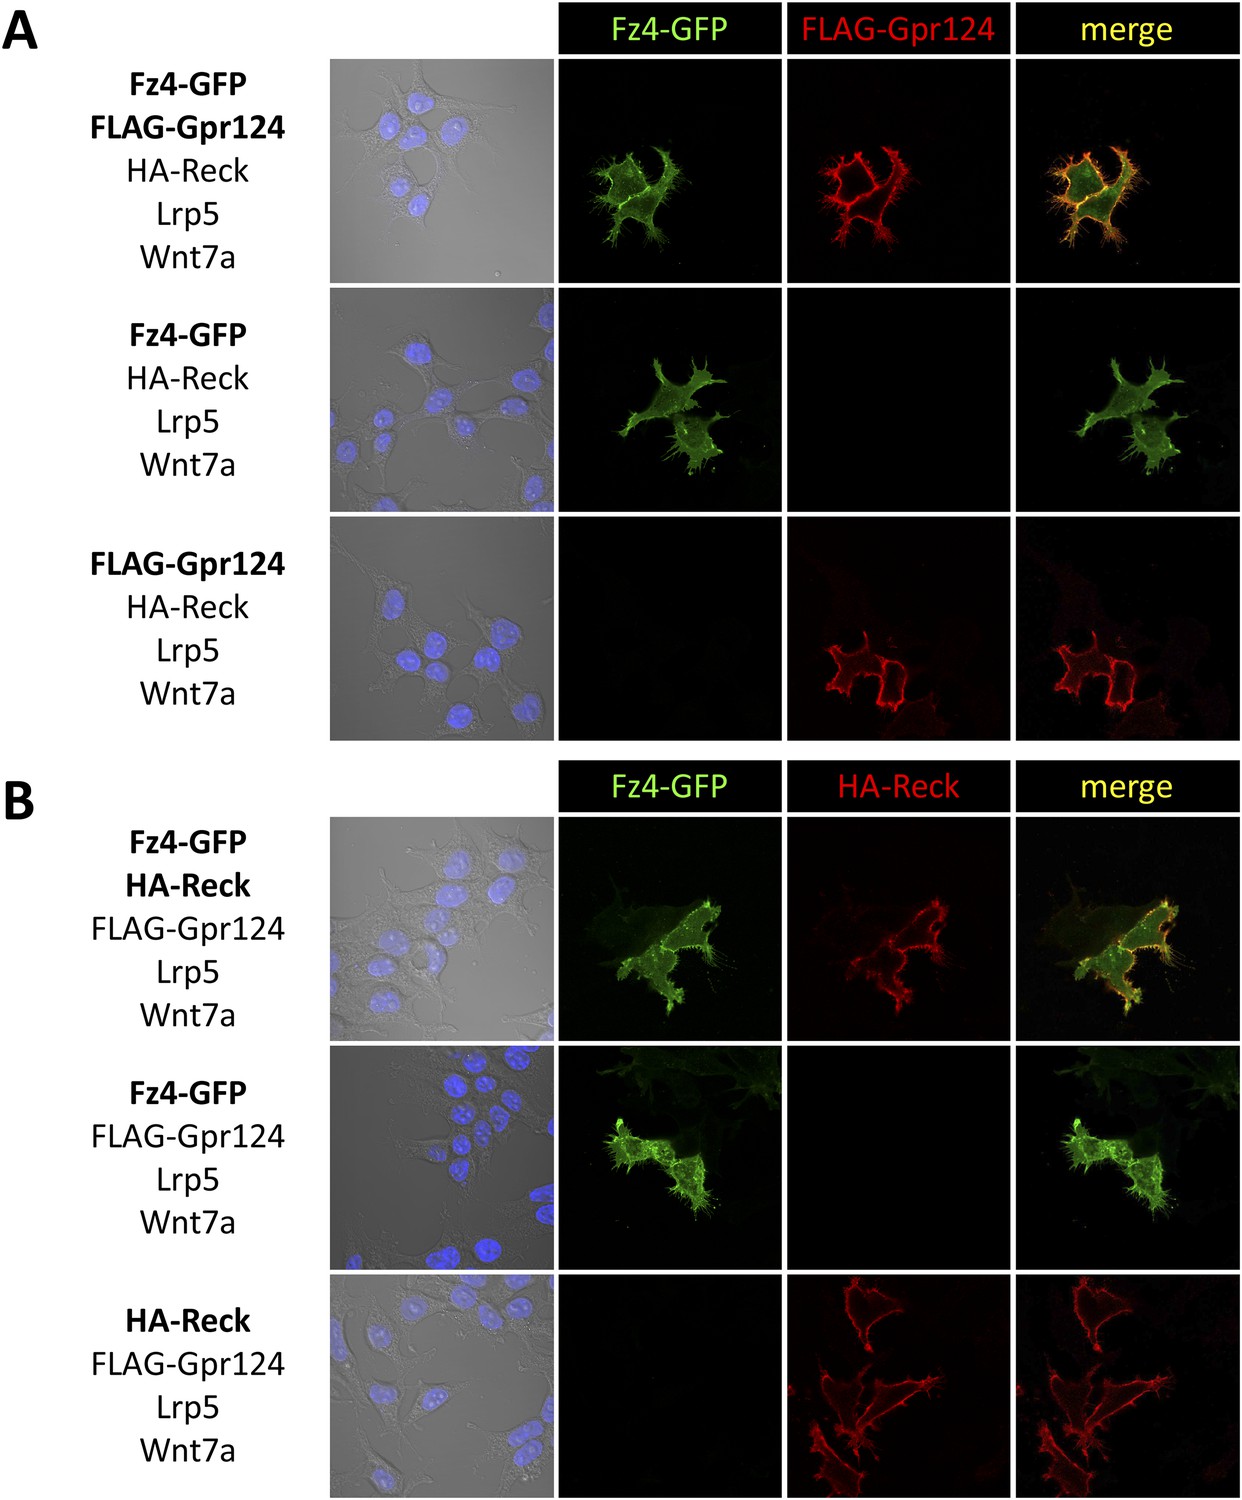
Gpr124, Reck, and Fz4 colocalize at the plasma membrane in cultured cells.
Plasmids encoding FLAG-Gpr124, HA-Reck, Lrp5, Fz4-GFP, and Wnt7a were transfected in 293 cells as indicated. 48 hours after transfection, FLAG-Gpr124 (A) and HA-Reck (B) fusion proteins were detected by indirect immunofluorescence and superposed with the endogenous GFP fluorescence of the Fz4-GFP fusion protein.
Figure 6 with 1 supplement
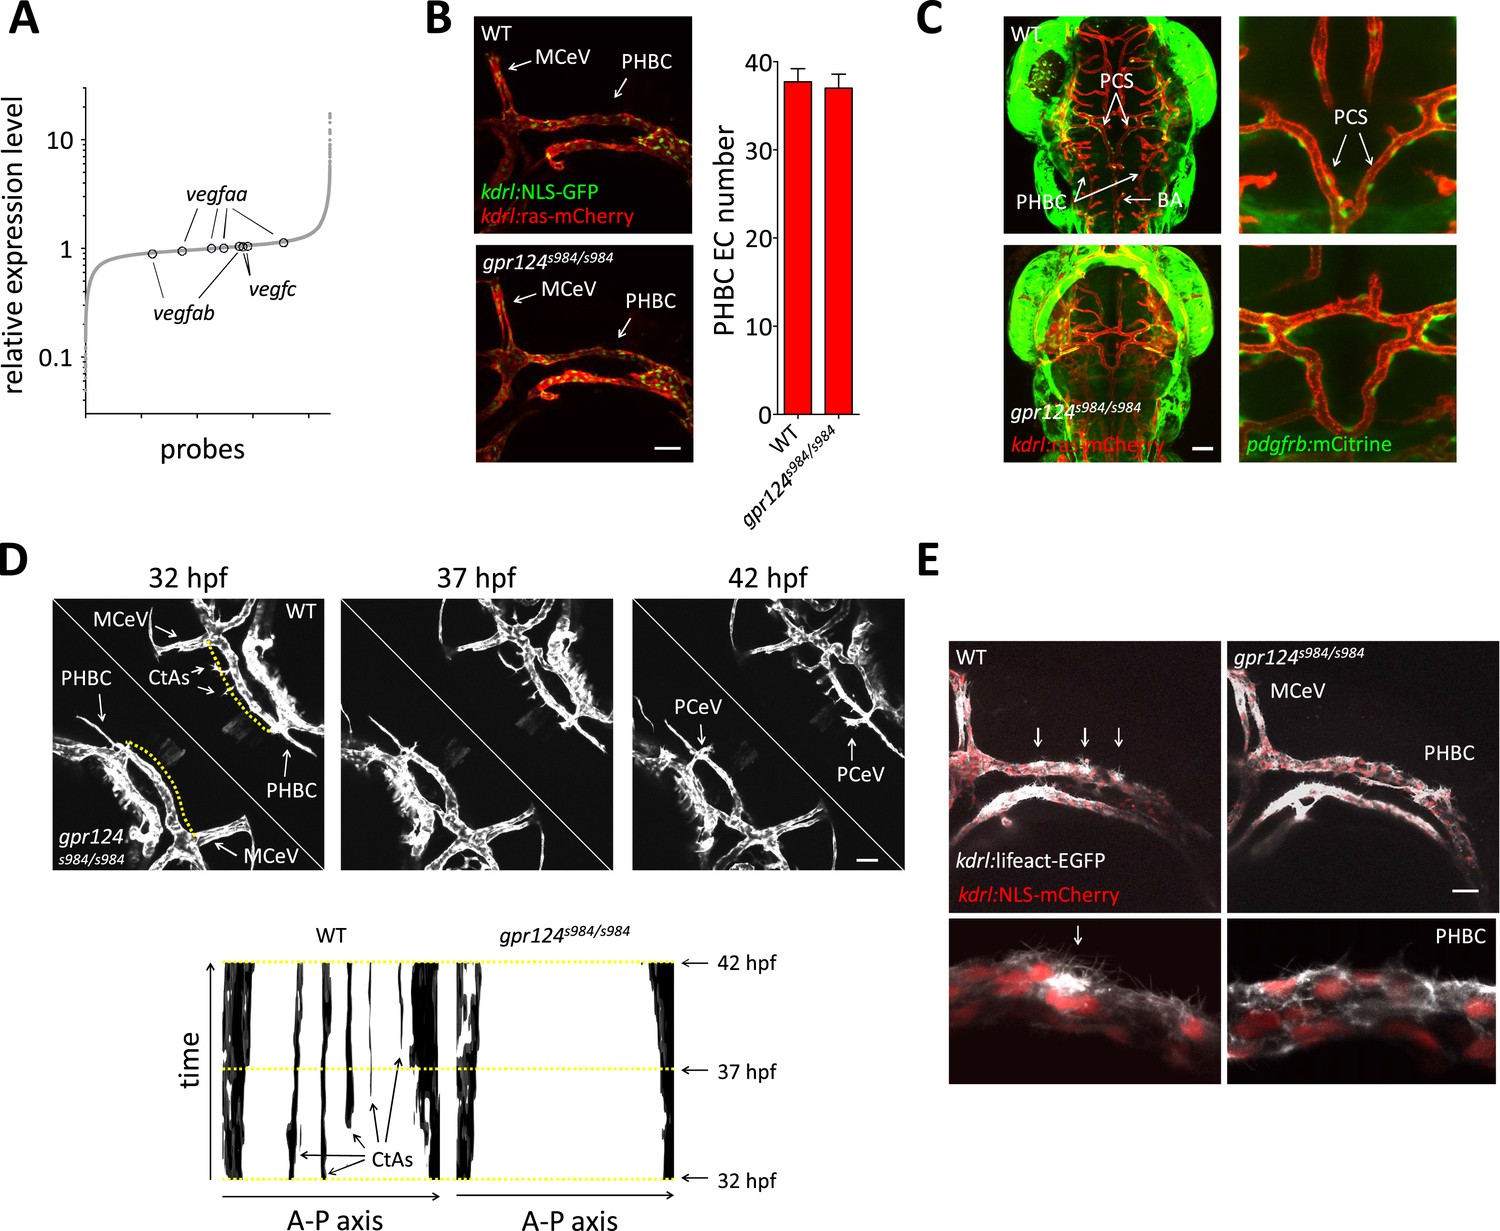
Tip cell defects in Wnt/β-catenin-deficient PHBCs.
(A) Scatterplot of a microarray comparison of wild-type and gpr124s984/s984 embryos at 48 hpf. Each dot refers to the relative signal intensity of a given probe in mutant vs wild-type embryos. Circles identify independent probes for vegfaa, vegfab, and vegfc. (B) Endothelial cell number in the PHBCs of wild-type and gpr124s984/s984 embryos at 30 hpf. kdrl:NLS-GFP+ nuclei were counted on one side of the embryos. (C) Dorsal views of Tg(pdgfrb:mCitrine);Tg(kdrl:ras-mCherry) wild-type and gpr124s984/s984 embryos at 40 hpf. (D) Stills from Video 3 recording sprouting angiogenesis in the hindbrain of Tg(kdrl:GFP) wild-type and gpr124s984/s984 embryos. Below are kymograph plots showing a time course of pixel intensity across the yellow virtual lines running 15 µm dorsal to the PHBC (from the anterior MCeV to the posterior PCeV [posterior cerebral vein]) and depicted in the upper left panel. (E) Lateral views of Tg(kdrl:lifeact-GFP);Tg(kdrl:NLS-mCherry) wild-type and gpr124s984/s984 hindbrains at 30 hpf. Arrows point to actin-dense structures forming in the PHBC vessel wall. Scale bars, 50 µm. Values represent means ± SD.
Figure 6—figure supplement 1
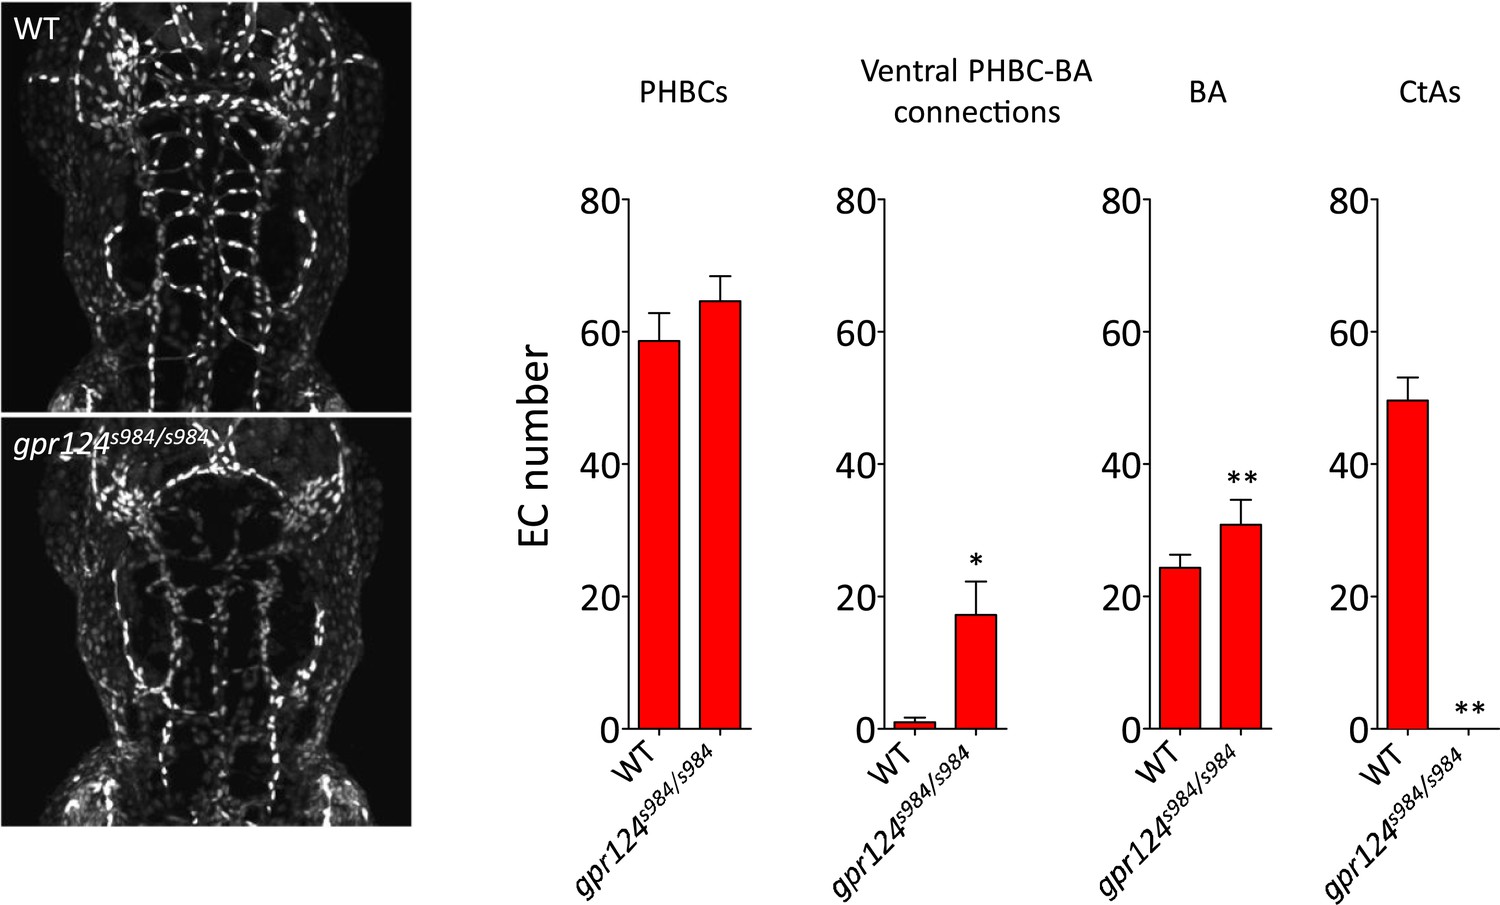
Endothelial cell number in wild-type and gpr124s984/s984 brain vessels at 54 hpf.
Maximal intensity projection of a confocal z-stack of the Tg(kdrl:NLS-GFP) wild-type and gpr124s984/s984 cranial vasculature at 54 hpf (left panels). kdrl:NLS-GFP+ EC nuclei were counted in the PHBCs, ventral PHBC-BA connections, BA and CtAs (right panels). In all panels, values represent means ± SD (*p < 0.05; **p < 0.01; Mann–Whitney test) of a minimal of five embryos.
Figure 7 with 1 supplement
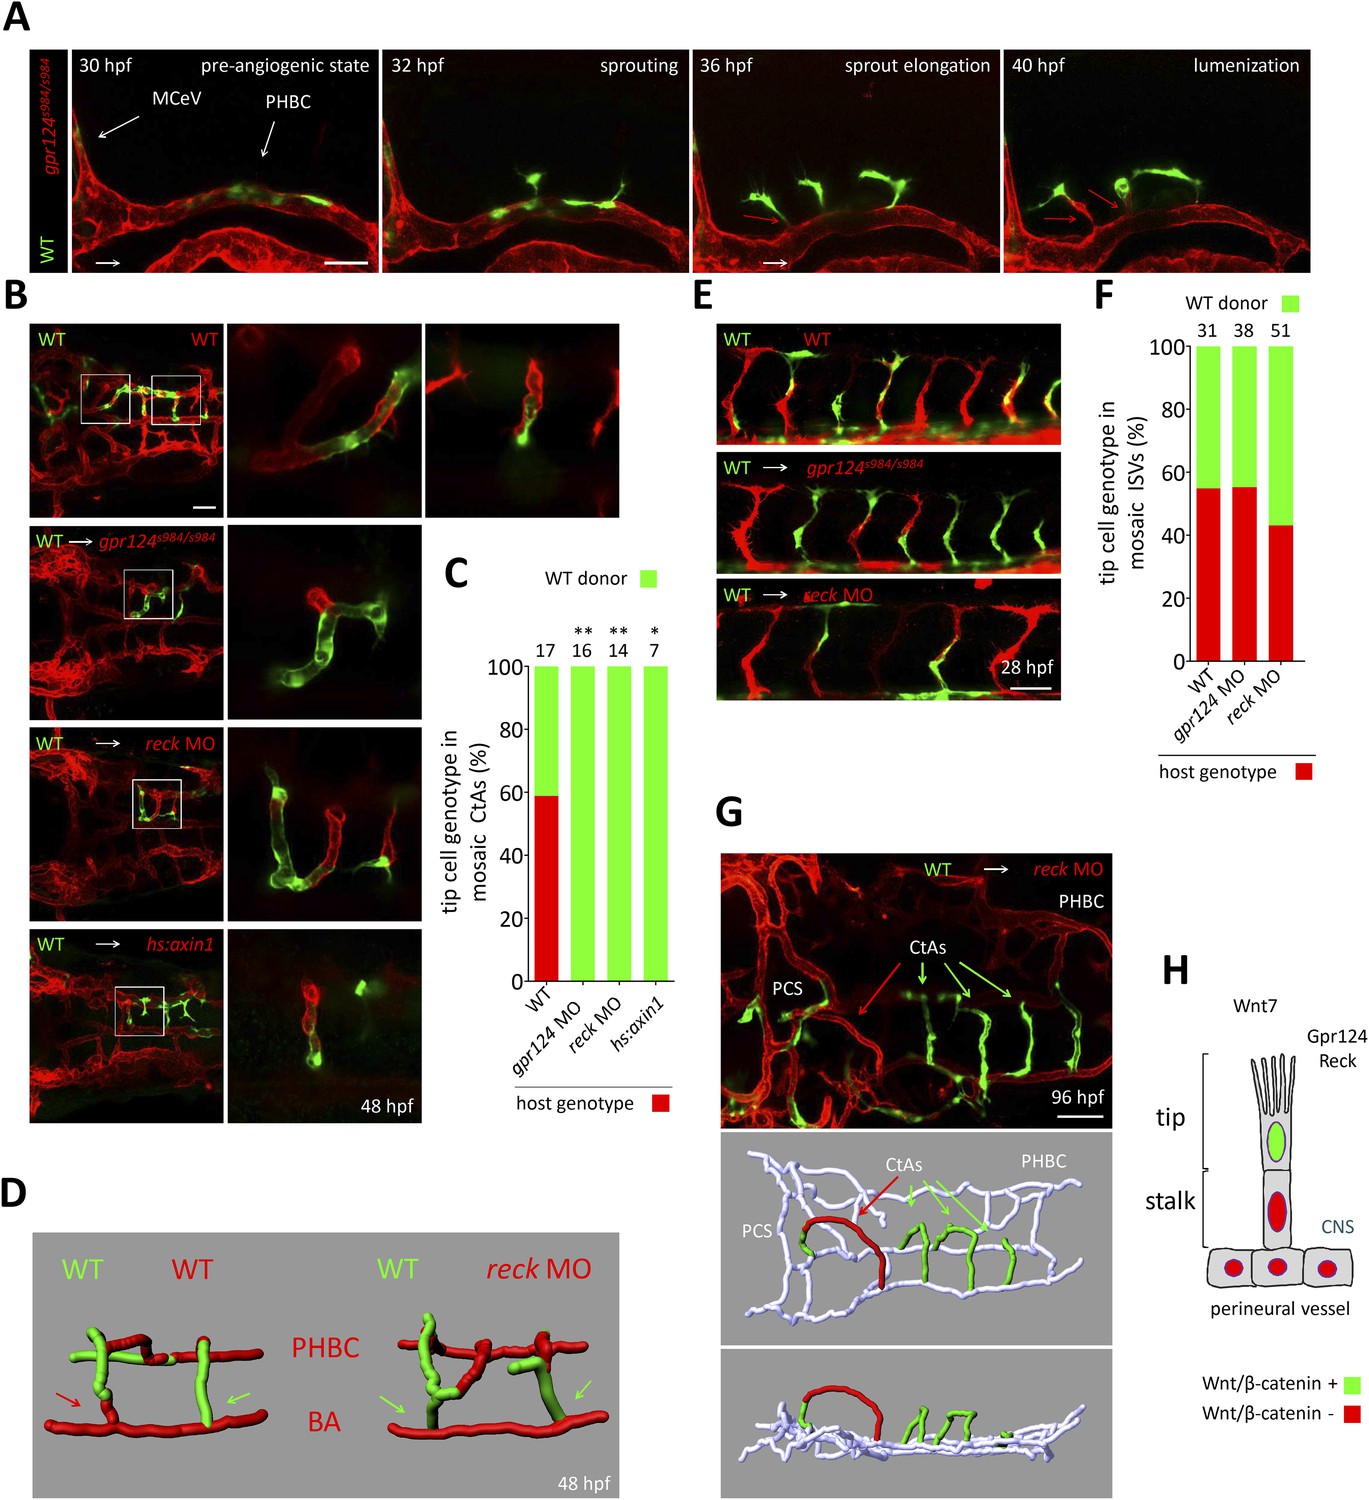
Tip cell-specific requirement for Gpr124 and Reck-controlled Wnt/β-catenin signaling.
(A) Stills from Video 8 recording sprouting angiogenesis from a mosaic PHBC obtained by blastula-stage transplantation. Green kdrl:GFP+ endothelial cells derive from a wild-type donor embryo, red kdrl:ras-mCherry+ endothelial cells are from the gpr124s984/s984 host. (B) Dorsal views of 48 hpf mosaic cranial vasculatures of the indicated genotypes. Right panels are high magnification views of a confocal z-stack of relevant depth illustrating intra-cerebral mosaic CtAs corresponding to the boxed areas in the left panels. (C) Contribution of cells of defined genotype to the tip cell position of mosaic CtAs after transplantation of wild-type Tg(kdrl:GFP) donor cells (green) into Tg(kdrl:ras-mCherry) host blastulae of the indicated genotype (red). Number of mosaic vessels analyzed is indicated above each bar. (D) 3D Imaris (Bitplane) reconstruction of representative hindbrain mosaic vascular networks. Arrows point to the cells connecting with the BA, after leading the CtA as tip cells. (E) Lateral views of the trunk region after transplantation of Tg(kdrl:GFP) wild-type donor cells into Tg(kdrl:ras-mCherry) host blastulae of the indicated genotype. (F) Contribution of cells of defined genotype to the tip cell position of mosaic ISVs after transplantation of wild-type Tg(kdrl:GFP) donor cells (green) into Tg(kdrl:ras-mCherry) host blastulae of the indicated genotype (red). Number of mosaic vessels analyzed is indicated above each bar. (G) Dorsal view of the cranial vasculature and 3D Imaris (Bitplane) reconstruction of the brain vessels of a 96 hpf mosaic larva after transplantation of wild-type Tg(kdrl:GFP) donor cells into reck morphant Tg(kdrl:ras-mCherry) host blastula. (H) Cellular requirement for Wnt/β-catenin, Gpr124, and Reck during sprouting angiogenesis in the zebrafish CNS (*p < 0.05; **p < 0.01; exact Fisher test).
Figure 7—figure supplement 1
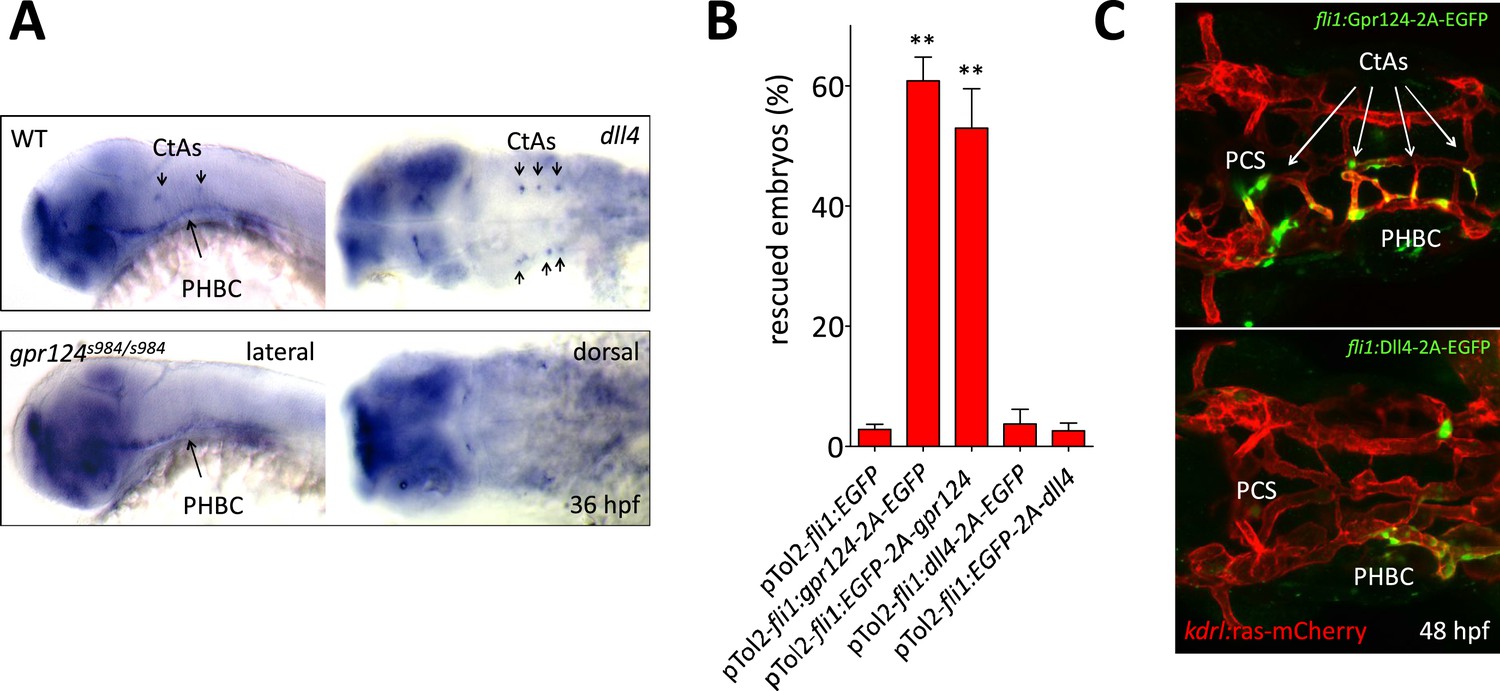
Transgenic endothelial dll4 expression is not sufficient to rescue the gpr124 mutant vascular defects.
(A) dll4 whole-mount in situ hybridization in wild-type and gpr124 mutant embryos at 36 hpf. (B) Quantification of the proportion of gpr124 morphant embryos with one or more central arteries at 60 hpf. Embryos were co-injected with gpr124 MO, tol2 transposase mRNA and pTol2-fli1:egfp, pTol2-fli1:gpr124-2A-EGFP, pTol2-fli1:EGFP-2A-gpr124, pTol2-fli1:dll4-2A-EGFP or pTol2-fli1:EGFP-2A-dll4 (C) Maximal intensity projection of a confocal z-stack of the cranial vasculature of Tg(kdrl:ras-mCherry) gpr124 morphant embryos at 60 hpf in dorsal views (anterior to the left) after transgenic endothelial overexpression (green fluorescence) of Gpr124-2A-EGFP (upper panel) or Dll4-2A-EGFP (bottom panel). Values represent means ± SD (*p < 0.05; **p < 0.01; one-way ANOVA test).
Videos
Video 1
Wild-type cerebral vasculature at 60 hpf.
Three-dimensional rotation of a wire diagram representation (Imaris; Bitplane) of the wild-type zebrafish cerebral vasculature at 60 hpf. Red vessels in the 3D renderings represent the intra-cerebral central arteries (CtAs), and gray vessels represent the perineural vessels (PHBC, PMBC, BA, and PCS) to which the central arteries connect. Scale bar, 100 µm.
Video 2
gpr124s984/s984 cerebral vasculature at 60 hpf.
Three-dimensional rotation of a wire diagram representation (Imaris; Bitplane) of the gpr124s984/s984 cerebral vasculature at 60 hpf. Blue vessels represent the extra-cerebral connections between the PHBC and BA lining the hindbrain ventrally, and gray vessels represent the perineural vessels (PHBC, PMBC, BA, and PCS). Scale bar, 100 µm.
Video 3
Brain angiogenesis in wild-type and gpr124s984/s984 embryos.
Time-lapse confocal video of Tg(kdrl:GFP) wild-type (upper right) and gpr124s984/s984 (bottom left) embryos, starting at 32 hpf and ending at approximately 42 hpf.
Video 4
Hindbrain angiogenesis in wild-type embryos.
High magnification view of the time-lapse confocal video presented in Video 3, focusing on the wild-type hindbrain (anterior to the left).
Video 5
Hindbrain angiogenesis in gpr124s984/s984 embryos.
High magnification view of the time-lapse confocal video presented in Video 3, focusing on the gpr124s984/s984 hindbrain (anterior to the left).
Video 6
Endothelial cell invasion into the wild-type hindbrain.
Time-lapse confocal video generated from maximum intensity confocal projections through one hindbrain hemisphere of a Tg(kdrl:NLS-GFP);Tg(kdrl:ras-mCherry) wild-type embryo. Endothelial cell nuclei are green (GFP); endothelial cells are red (mCherry). Video starts at 32 hpf and ends at approximately 42 hpf (anterior to the left).
Video 7
Lack of endothelial cell invasion into the gpr124 mutant hindbrain.
Time-lapse confocal video generated from maximum intensity confocal projections through one hindbrain hemisphere of a Tg(kdrl:NLS-GFP);Tg(kdrl:ras-mCherry) gpr124s984/s984 embryo. Endothelial cell nuclei are green (GFP); Endothelial cells are red (mCherry). Video starts at 32 hpf and ends at approximately 42 hpf (anterior to the left).
Video 8
Single-cell analysis of CtA formation in gpr124 mosaic animals. CtAs are led by wild-type tip cells and gpr124 mutant cells can incorporate into the sprouts as stalk cells.
Time-lapse confocal video generated from maximum intensity confocal projections through one hindbrain hemisphere of a mosaic embryo containing wild-type kdrl:GFP+ ECs (green) and gpr124s984/s984 kdrl:ras-mCherry+ ECs (red). Video starts at 30 hpf and ends at approximately 40 hpf (anterior to the left).
Video 9
Single-cell analysis of CtA formation in gpr124 mosaic animals. A single wild-type tip cell is sufficient to initiate the formation of an intra-cerebral CtA.
Time-lapse confocal video generated from maximum intensity confocal projections through one hindbrain hemisphere of a mosaic embryo containing wild-type kdrl:GFP+ ECs (green) and gpr124s984/s984 kdrl:ras-mCherry+ ECs (red). Video starts at 30 hpf and ends at approximately 40 hpf (anterior to the left).
Download links
A two-part list of links to download the article, or parts of the article, in various formats.
Downloads (link to download the article as PDF)
Open citations (links to open the citations from this article in various online reference manager services)
Cite this article (links to download the citations from this article in formats compatible with various reference manager tools)
Tip cell-specific requirement for an atypical Gpr124- and Reck-dependent Wnt/β-catenin pathway during brain angiogenesis
eLife 4:e06489.
https://doi.org/10.7554/eLife.06489


