Functional genome-wide siRNA screen identifies KIAA0586 as mutated in Joubert syndrome
- Howard Hughes Medical Institute, The Rockefeller University, United States
- University of California, San Diego, United States
- New York University School of Medicine, United States
- Mendel Institute, Italy
- National Research Center, Egypt
- University of Utah School of Medicine, United States
- University of New Mexico, United States
- Seattle Children's Hospital, United States
- Duke Institute for Brain Sciences, Duke University Medical Center, United States
- Cukurova University Medical Faculty, Turkey
- Wah Medical College, Pakistan
- Scientific Institute IRCCS Eugenio Medea, Italy
- American University of Beirut Medical Center, Lebanon
- Fondazione IRCCS Istituto Neurologico Carlo Besta, Italy
- Oslo University Hospital, Norway
- University of Oslo, Norway
- University Children's Hospital, Switzerland
- Regional Hospital of Bolzano, Italy
- Istituto G. Gaslini, Italy
- Bambino Gesù Children's Research Hospital, IRCCS, Italy
- Bambino Gesù Children's Hospital, IRCCS, Italy
- Howard Hughes Medical Institute, Harvard Medical School, United States
- University of Leeds, St. James's University Hospital, United Kingdom
- Medical University Vienna, Austria
- Broad Institute of Harvard and Massachusetts Institute of Technology, United States
- Sanford-Burnham Institute, United States
- Sungkyunkwan University, Republic of Korea
- University of Salerno, Italy
- School of Medical Science and Engineering, Republic of Korea
Figures
Figure 1 with 2 supplements
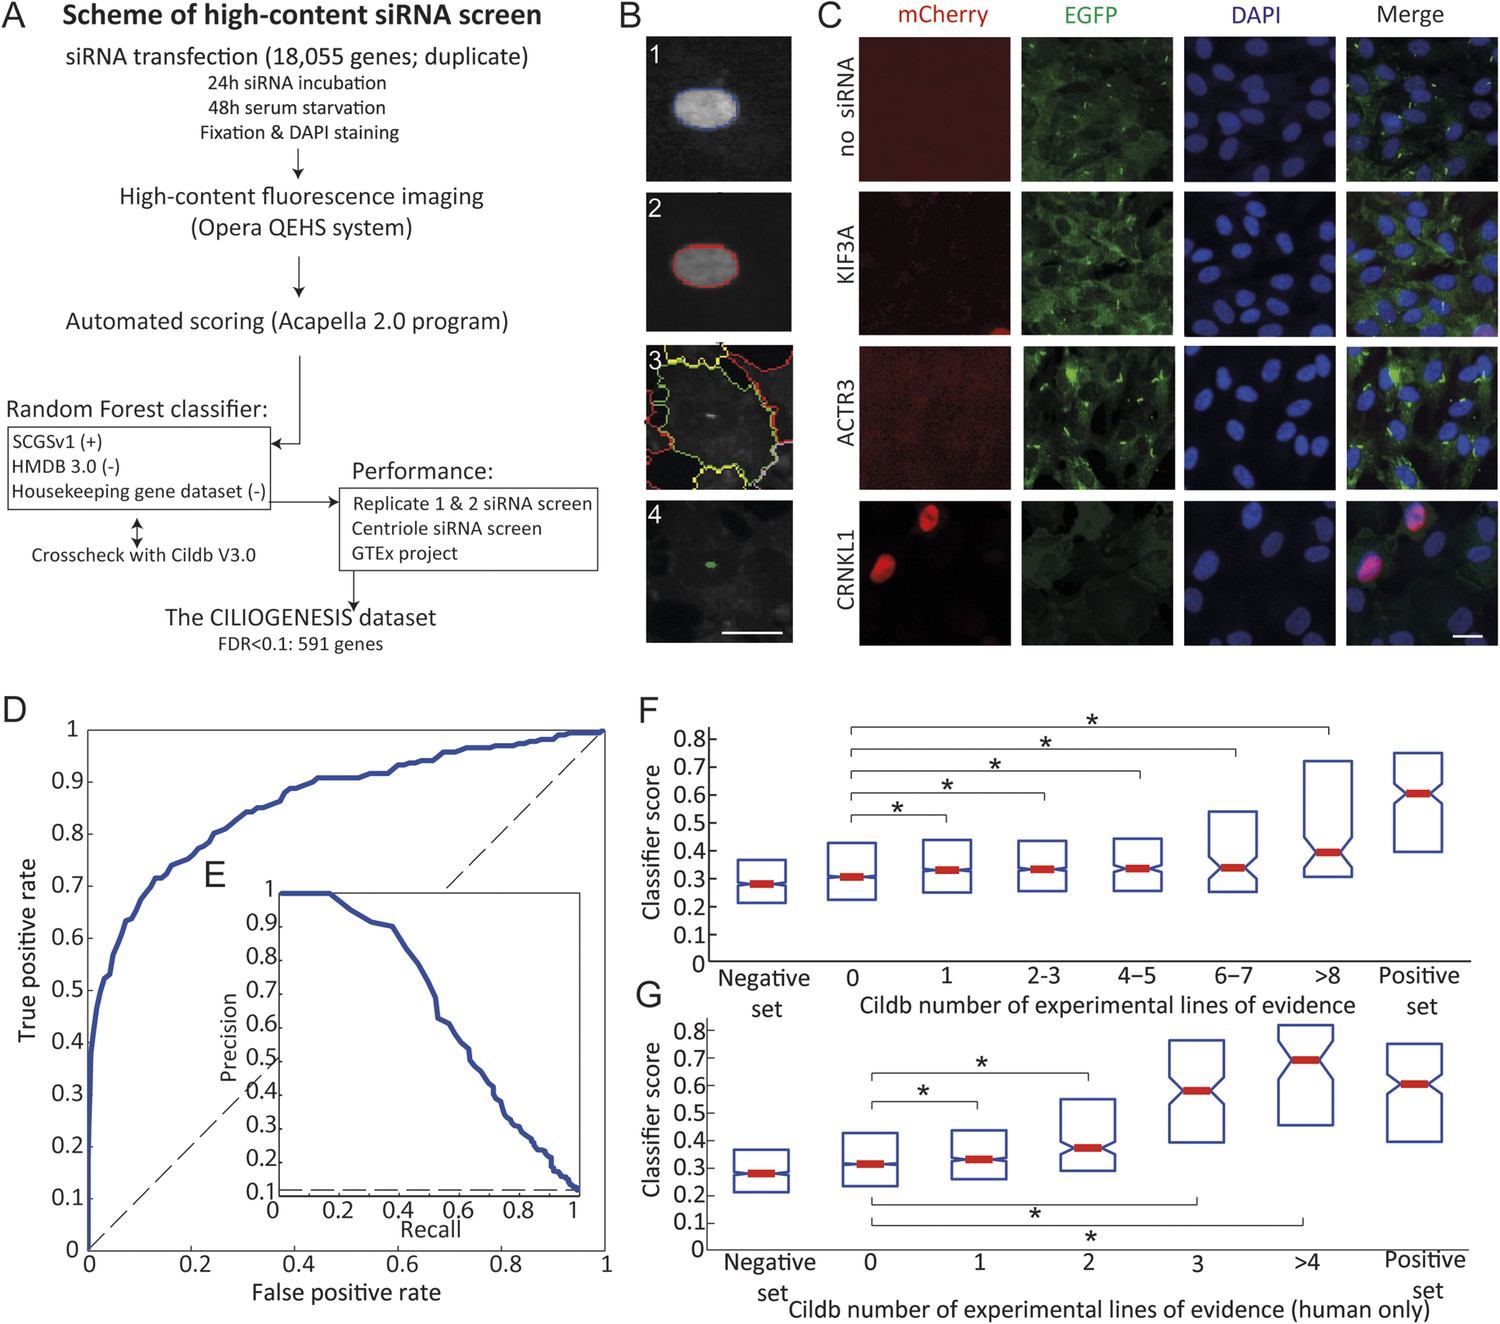
Schematic representation, validation and enrichment of genome-wide siRNA cell screen for machine learning approach.
(A) High-content small interfering RNA (siRNA) cell-based screen using reverse transfection of the library in media containing serum for 72 hr, followed by 24 hr serum starvation, fixation and DAPI staining. Subsequent fluorescent imaging and algorithmic analysis performed for all pooled siRNAs. To assess ciliary candidates for the positive training, we used SYSCILIA gold standard (SCGSv1) and for the negative training the human metabolome database (HMDB 3.0) as well as a manually curated housekeeping gene data set. FDR, false discovery rate. (B) Segmentation algorithm for cytoplasm and cilia detection: (1) detected nuclei from DAPI channel, (2) nuclear automated segmentation, (3) cell outline automated using cytoplasm_detection_D of the program Acapella, and (4) cilia automated detection and segmentation. Images have been modified for illustration purposes. Scale bar: 10 μm. (C) Representative images of serum-starved SEMG cells without siRNA showing basal ciliation (small green rods in EGFP channel). Red (mCherry) marks cells in S/G2/M phase of the cycle, green (EGFP) marks cilia, blue (DAPI) marks nuclei. siRNAs used as positive controls: KIF3A interferes with ciliation but not cell cycle. ACTR3 shows increased length of cilia (Kim et al., 2010). CRNKL1 implicated in cell cycle progression (Zhang et al., 1991) and showed increased mCherry nuclei and reduced ciliation. Scale bar: 10 μm. (D) Receiver operating characteristic (ROC) for the classifier, which used features from three data sources. Dashed line: theoretical random classifier. (E) Precision-recall curve for the final classifier. (F) Median value (red center bar) and interquartile ranges (blue box) box plot of the classifier scores for the corresponding number of supporting number of evidences (NOEs) in Cildb and the genes used as negative and positive training examples. The indicated contrasts were found significant(*) with a highest value of p < 1.03 × 10⁻⁴ (one-tailed Wilcoxon's Rank sum test). (G) Same as (F), limited to the NOEs from humans only. The indicated contrasts were found significant(*) with a highest value of p < 1.43 × 10⁻¹⁰ (one-tailed Wilcoxon's Rank sum test). See Figure 1—figure supplement 1, 2 for the prediction score on the gold standard and candidates as well as the visible improvement of the ROC curve and precision–recall curve.
Figure 1—figure supplement 1
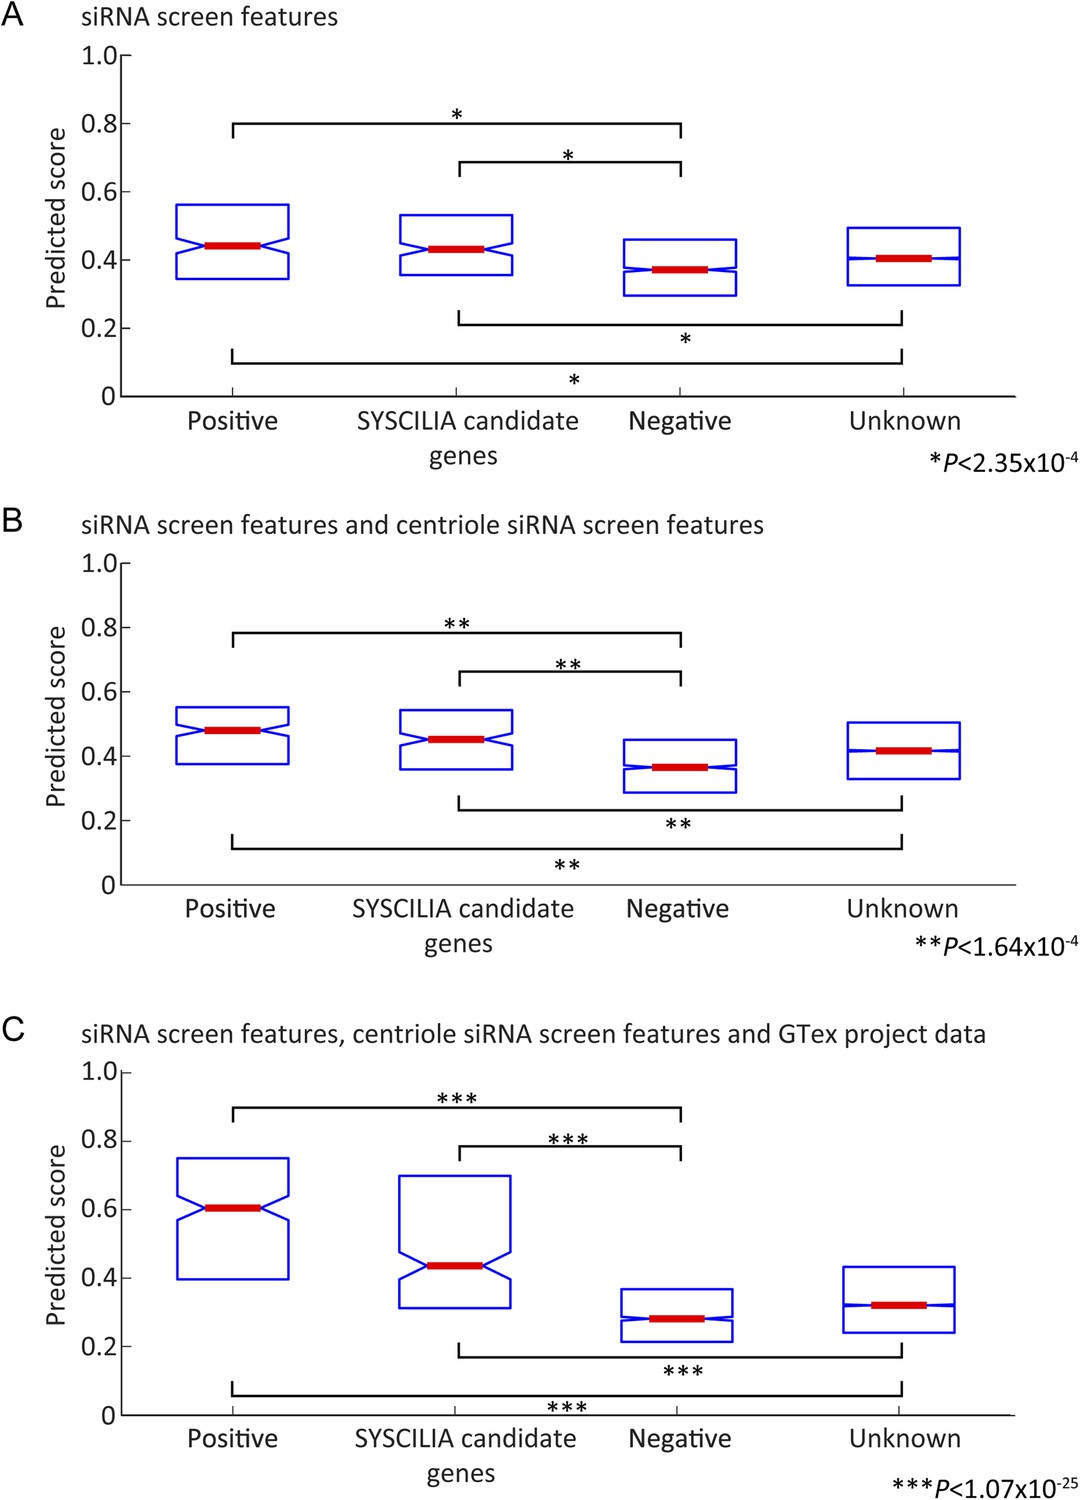
Prediction score on Gold standard and Gold standard candidates.
(A–C) Box plot reporting median value (red center bar) and interquartile ranges (blue box) of the classifier scores for gold standard positive and negative genes (out of bag performance, that is, for every gene the score excludes trees where the gene was used for training), also included are boxes for a set of ciliopathy candidate genes (SYSCILIA candidate genes) and genes not annotated to be ciliopathy related (Unknown), which were not used in the training. (A) Classifier based on cilia siRNA screen features only. (B) Classifier based on cilia siRNA screen and centriole siRNA screen features only. (C) Classifier including all siRNA and GTex project expression signature based features. In all cases, the median value for positive set or candidate genes differed significantly from the negative set or unknown set of genes (One-tailed Wilcoxon rank sum test).
Figure 1—figure supplement 2
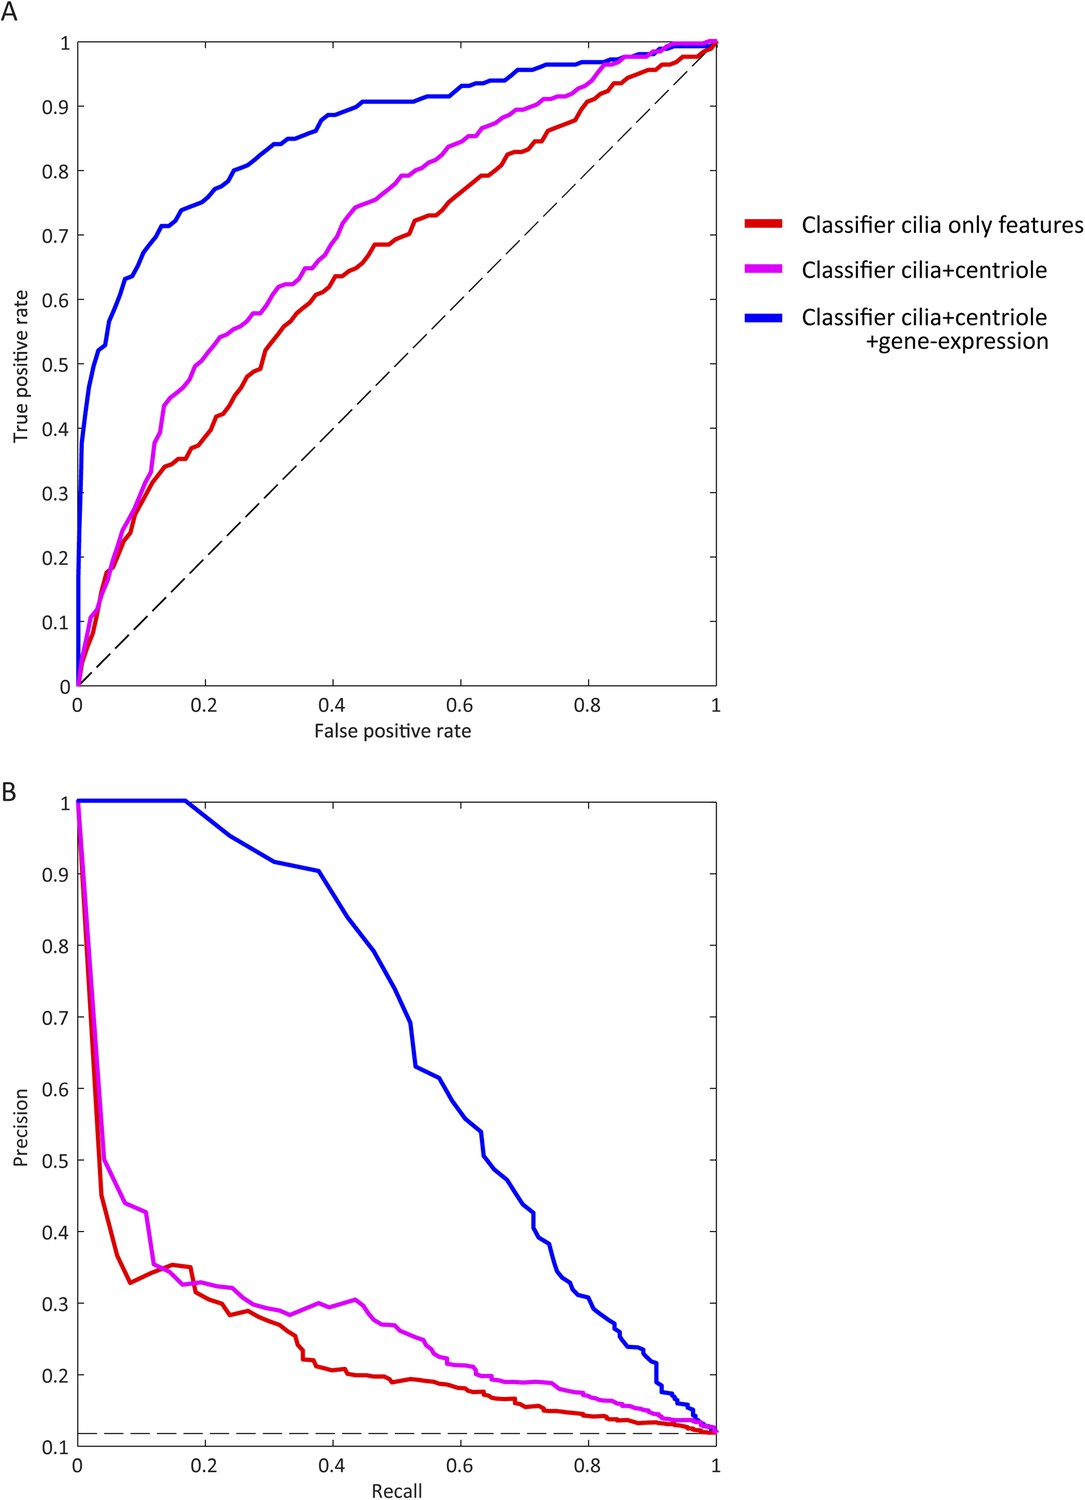
Visible improvement of ROC curve and precision-recall curve.
(A) ROC for classifiers trained on different partitions of the feature space (blue: final set, magenta: excluding centriole biogenesis siRNA based features, red: including only features from the whole genome siRNA screen performed in this study). The dashed black line corresponds to a theoretical random classifier. (B) As in A but showing precision-recall curve for each classifier.
Figure 2 with 2 supplements
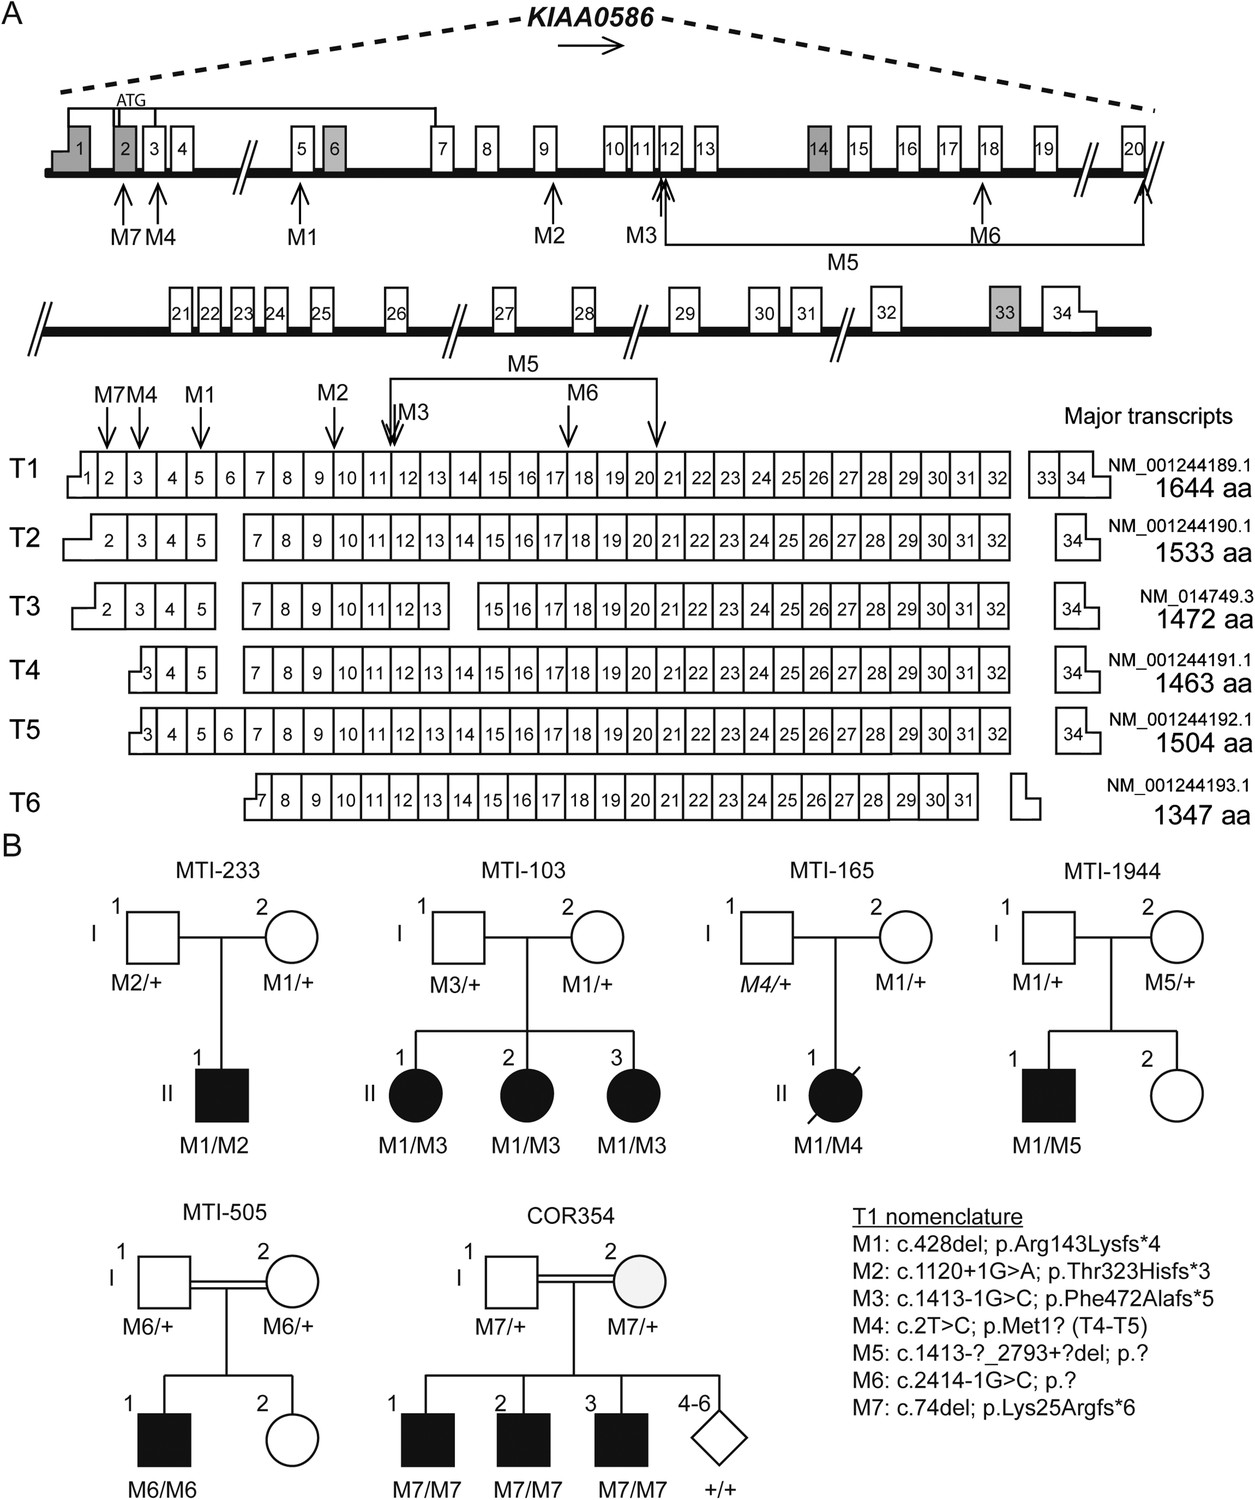
Pedigrees and schematic representation of KIAA0586.
(A) Genomic structure and mRNA transcripts of KIAA0586. Transcript 1 (T1): full-length isoform with 34 exons. T2–T4 have different initiation sites, lack exon 5, and T3 lacks exon 14. T5 starts at the same position as T4 and incorporates exon 6. The shortest transcript (T6) initiates in exon 7, lacks exon 32 and 33, and terminates using an alternative exon, which is not incorporated in the other transcripts. Gray boxes represent alternative exons. UTR's are represented by half-height boxes. The location of the mutations is indicated by M1–M7. (B) Pedigrees of the Joubert syndrome (JS) families with ancestries of USA (MTI-233 and MTI-103), Mexico (MTI-165), Turkey (MTI-1944 and COR354), and Syria (MTI-505), respectively, demonstrating the segregation of the compound heterozygous mutations in non-consanguineous families and homozygous mutations in consanguineous families. Inferred genotype is italicized. M, mutation; T, transcript. See Figure 2—figure supplement 1 for the chromatograms of the mutations in KIAA0586. Figure 2—figure supplement 2 shows the results of the quantitative PCR confirming the large heterozygous mutation in MTI-1944.
Figure 2—figure supplement 1
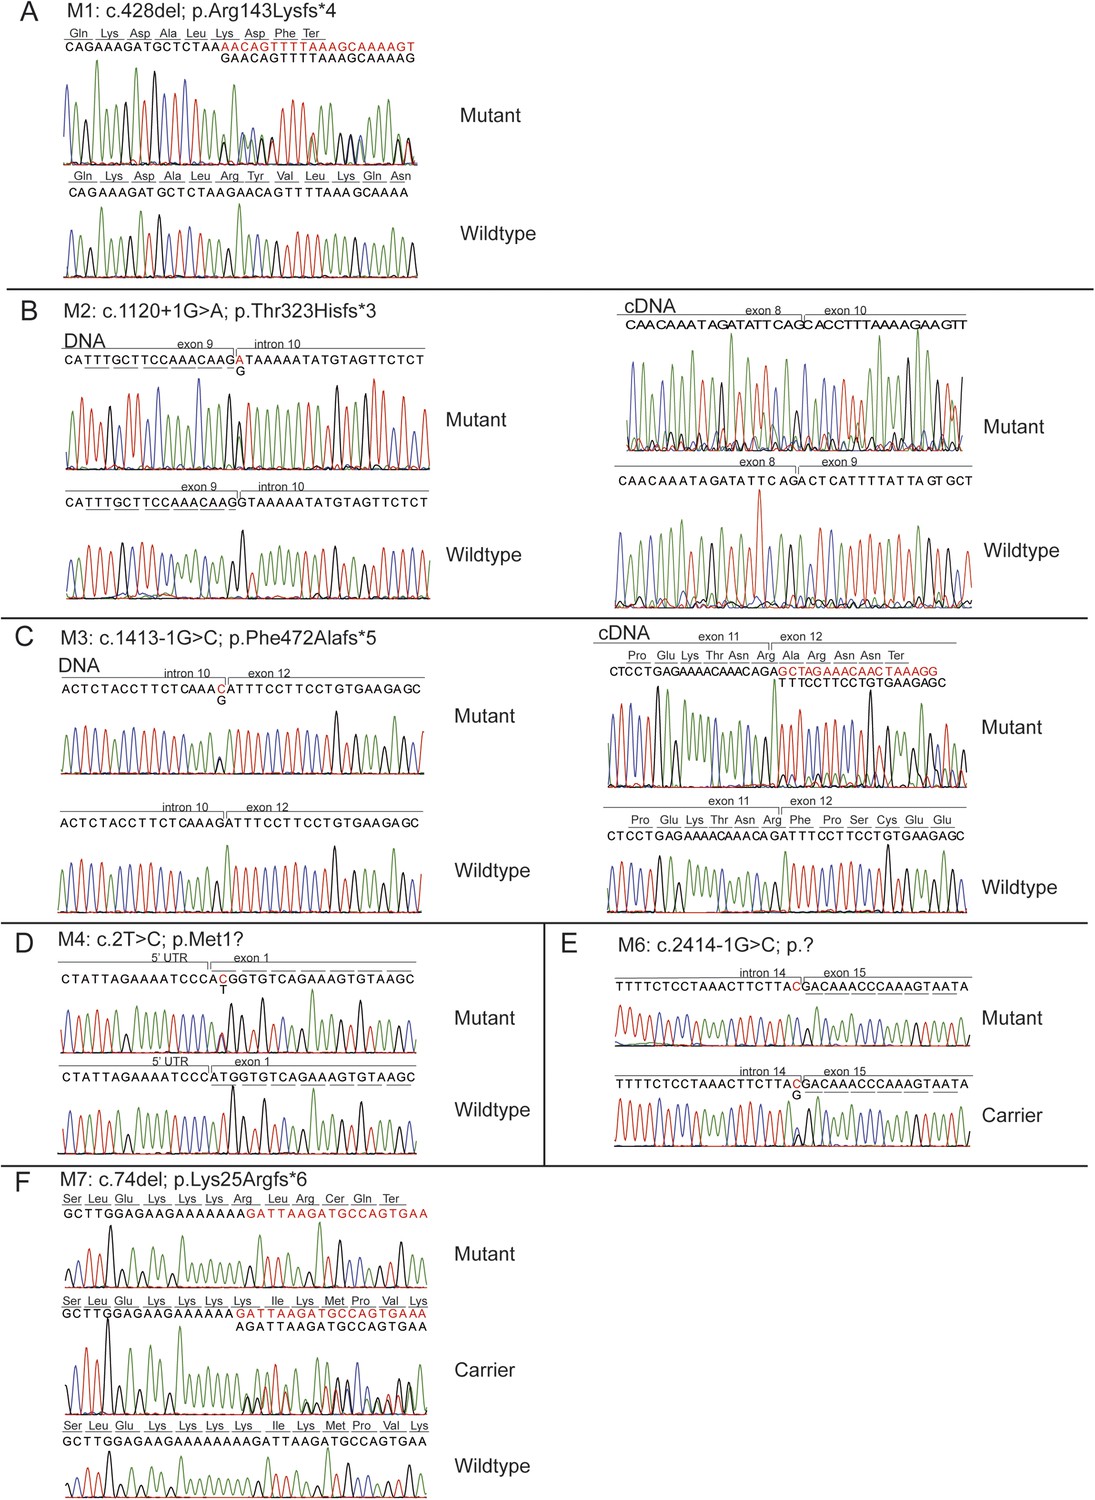
Chromatograms of mutations in the KIAA0586 gene.
The chromatograms of the mutations in identified in KIAA0586 of individuals with JS. A) M1, B) M2, C) M3, D) M4, E) M6, F) M7.
Figure 2—figure supplement 2
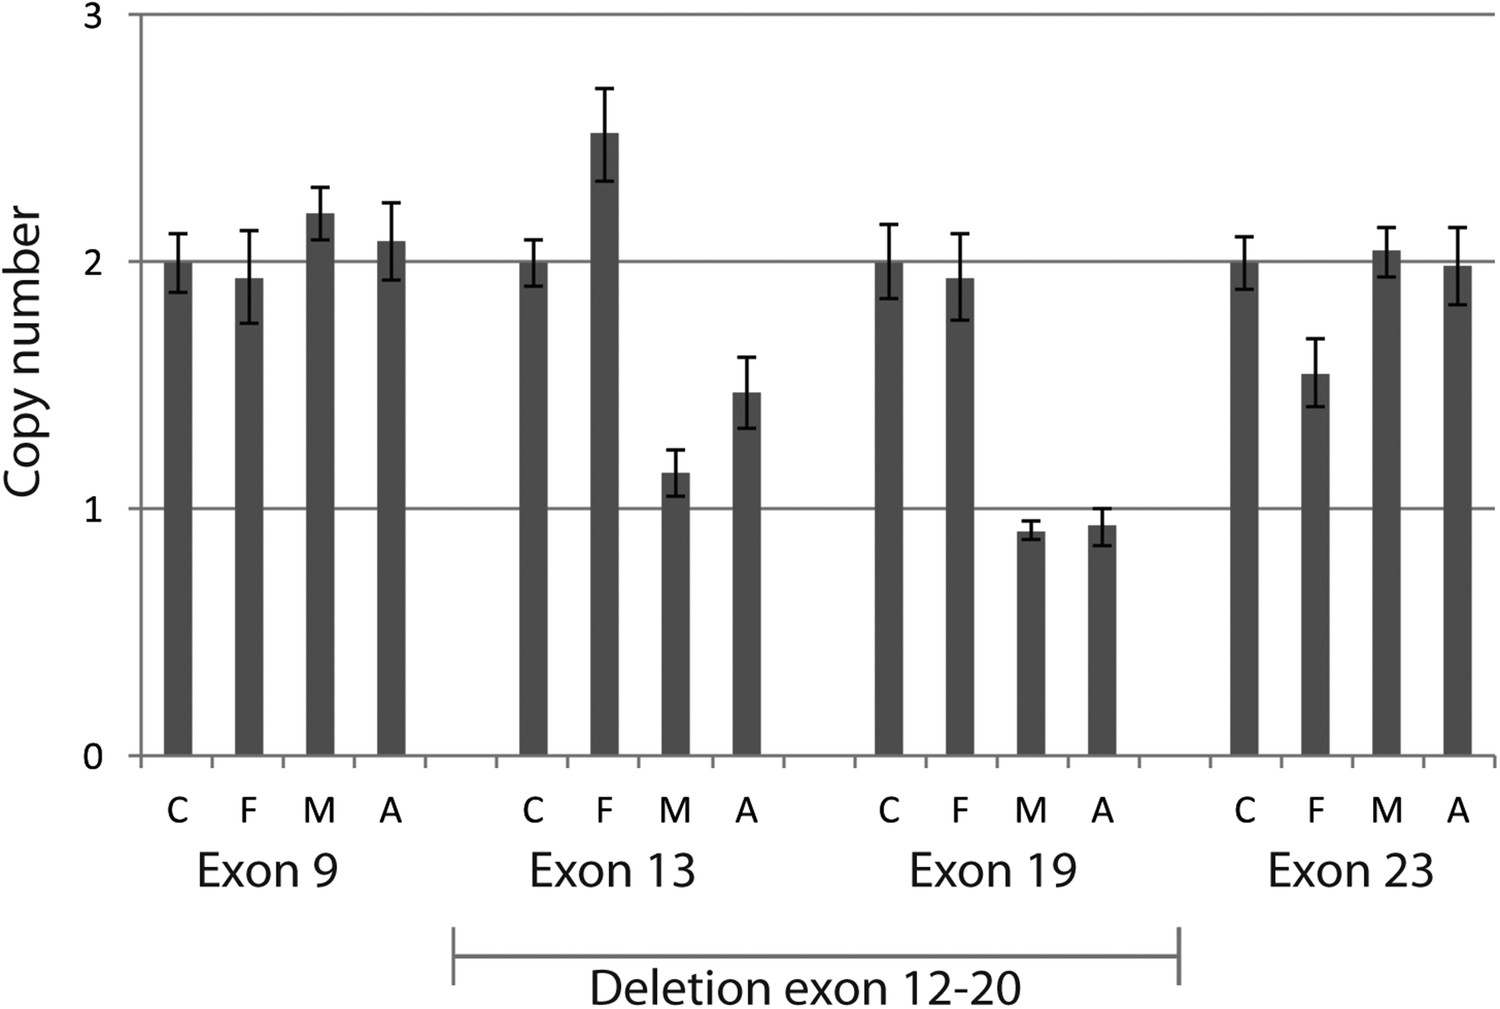
Quantitative PCR confirmed heterozygous mutation in MTI-1944.
Using quantitative PCR on genomic DNA of the large deletion with unknown specific boundaries was confirmed to segregate in MTI-1944. By analyzing two primer sets outside the presumed heterozygous deletions spanning exon 12 to 20 and two within the deletion absence of approximately half the product in the mother and affected child was shown. Input of genomic DNA was normalized against GAPDH. C, control; F, father; M, Mother; A, affected child.
Figure 3 with 1 supplement

MRI scans from patients with KIAA0586 mutations.
Magnetic resonance imaging (MRI) in a healthy individual and patients with KIAA0586 mutations showing thickened and mal-oriented superior cerebellar peduncle (upper, red ‘arrowheads’), deepened interpeduncular fossa and constituting the ‘molar tooth sign’ (red circle). In COR-354-2-3, the molar tooth sign was very mild, possibly due to suboptimal image averaging. Figure 3—figure supplement 1 shows the imaging phenotype of affected JS individual MTI-1944-2-1.
Figure 3—figure supplement 1
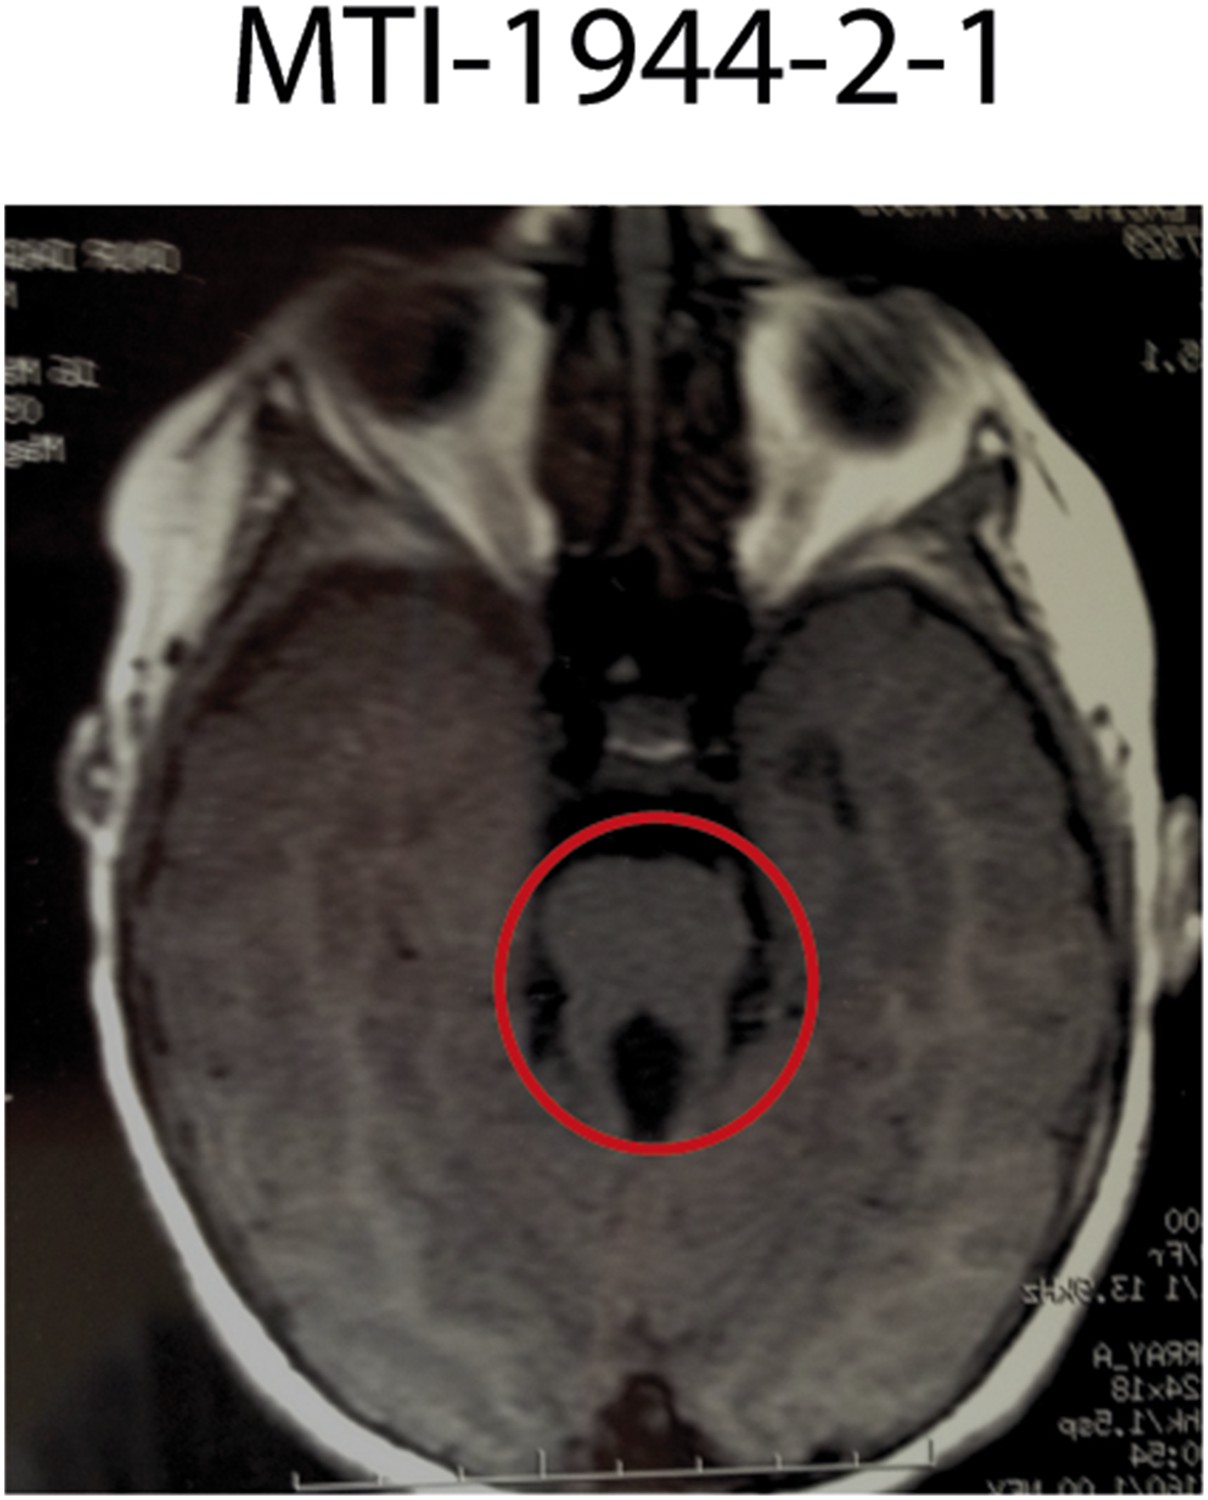
Imaging phenotype of affected JS individual MTI-1944-2-1 with KIAA0586 mutations.
MRI of individual MTI-1944 affected by KIAA0586 mutations causing JS. For the affected individuals, the diagnosis of JS was confirmed by the deepened interpeduncular fossa and abnormal superior cerebellar peduncles, showing the ‘molar tooth sign’ (red circle).
Figure 4 with 1 supplement
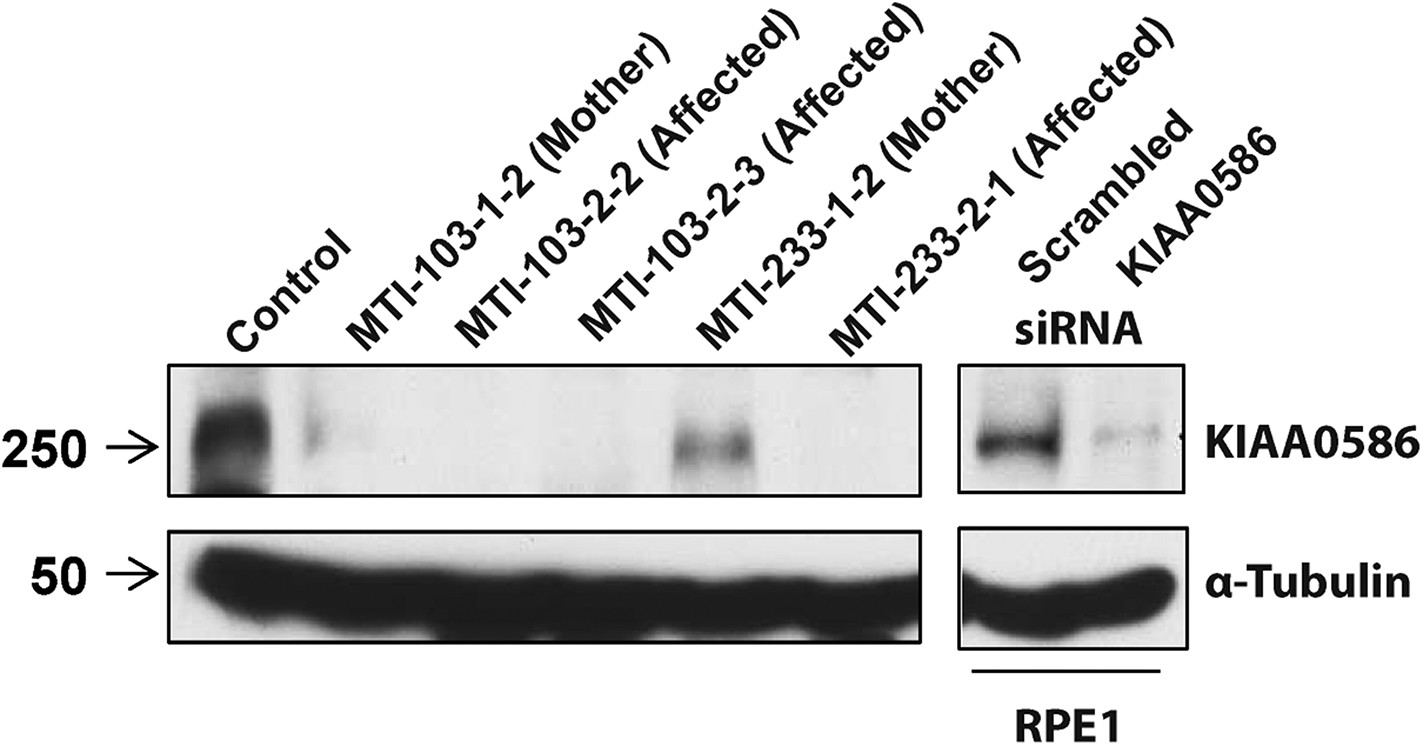
Absent KIAA0586 protein in patient fibroblasts.
Immunoblot analysis of KIAA0586 in fibroblasts from family MTI-103 and MTI-233. Lysates from RPE1 cells transfected with scrambled or KIAA0586 siRNA were used as control. M, unaffected carrier (mother); A, affected child. RPE1, retinal pigment epithelial-1 cell line. Figure 4—figure supplement 1A represents an expression analysis of the KIAA0586 gene.
Figure 4—figure supplement 1
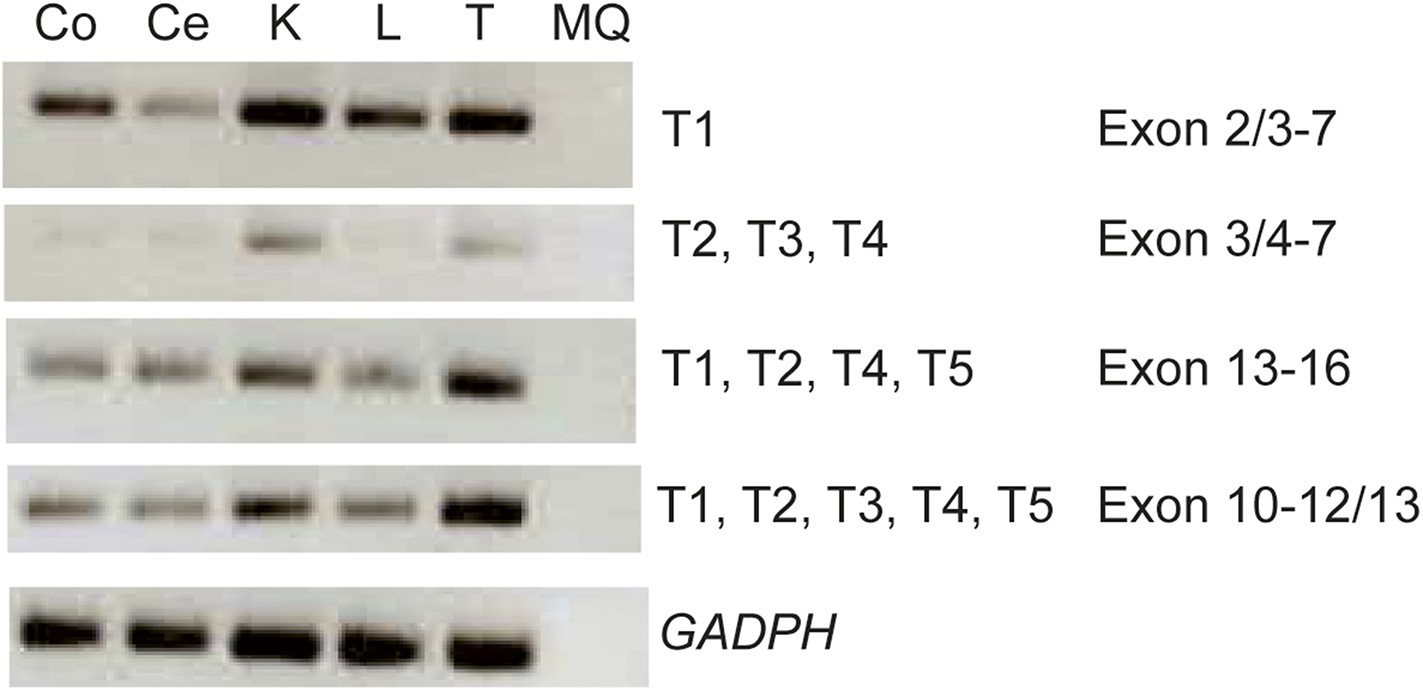
Expression analysis of the KIAA0586 gene.
RT-PCR analysis showing differential expression levels of the KIAA0586 transcripts amongst various ciliated and non-ciliated tissues was observed. Co, colon; Ce, cerebellum; K, kidney; L, liver; MQ, MilliQ; T, testis; T1-T5 transcript number corresponding to Figure 2A.
Tables
Table 1
All alleles identified in KIAA0586 causative for Joubert syndrome
| Allele 1 (based on T1) | Allele 2 (based on T1) | ||||||
|---|---|---|---|---|---|---|---|
| Patient ID | Genotype | Genomic | DNA | Protein | Genomic | DNA | Protein |
| MTI-233 | M1/M2 | g.58899157del | c.428del | p.Arg143Lysfs*4 | g.58915212G>A | c.1120+1G>A | p.Thr323Hisfs*3 |
| MTI-103 | M1/M3 | g.58899157del | c.428del | p.Arg143Lysfs*4 | g.58923419G>C | c.1413-1G>C | p.Arg472Serfs*2 |
| MTI-165 | M1/M4 | g.58899157del | c.428del | p.Arg143Lysfs*4 | g.58896138T>C | c.2T>C (based on T4-T5) | p.Met1? (based on T4-T5) |
| MTI-1944 | M1/M5 | g.58899157del | c.428del | p.Arg143Lysfs*4 | g.?_58923420_58938997_?del | c.1413-?_2793+?del | p.? |
| MTI-505 | M6/M6 | g.58934452G>C | c.2414-1G>C | p.? | g.58934452G>C | c.2414-1G>C | p.? |
| COR354 | M7/M7 | g.58895020del | c.74del | p.Lys25Argfs*6 | g.58895020del | c.74del | p.Lys25Argfs*6 |
| Mediterranean cohort analysis | |||||||
| NG2872 | M1/M1 | g.58899157del | c.428del | p.Arg143Lysfs*4 | g.58899157del | c.428del | p.Arg143Lysfs*4 |
| NG4158 | M1/M8 | g.58899157del | c.428del | p.Arg143Lysfs*4 | g.58909503C>T | c.649C>T | p.Gln217* |
| NG2326 | M1/M9 | g.58899157del | c.428del | p.Arg143Lysfs*4 | g.58910790_58910791del | c.863_864del | p.Gln288Argfs*7 |
| NG1776 | M1/M9 | g.58899157del | c.428del | p.Arg143Lysfs*4 | g.58910790_58910791del | c.863_864del | p.Gln288Argfs*7 |
| NG3928 | M1/M10 | g.58899157del | c.428del | p.Arg143Lysfs*4 | g.58915097C>T | c.1006C>T | p.Gln336* |
| NG2458 | M1/M11 | g.58899157del | c.428del | p.Arg143Lysfs*4 | g.58924613_58924616delinsAAA | c.1658_1661delinsAAA | p.Val553Glufs*79 |
| NG2286 | M1/M12 | g.58899157del | c.428del | p.Arg143Lysfs*4 | g.58925263G>A | c.1815G>A | p.= / p.? |
| NG1485 | M1/M13 | g.58899157del | c.428del | p.Arg143Lysfs*4 | g.58927869C>T | c.2209C>T | p.Arg737* |
| NG3758 | M1/M14 | g.58899157del | c.428del | p.Arg143Lysfs*4 | g.58953883del | c.3462del | p.Gly1155Glufs*40 |
-
M; mutation; T; transcript. Table 1—Source data 1 shows chromatograms belonging to the identified mutations in the Mediterranean cohort.
-
Table 1—source data 1
Chromatograms of mutations in the KIAA0586 gene identified in the additional cohort of Mediterranean individuals with Joubert syndrome.
- https://doi.org/10.7554/eLife.06602.012
Additional files
-
Supplementary file 1
Parameter output genome-wide siRNA analysis screen. Table listing all parameters used in the analysis of the genome wide siRNA screen.
- https://doi.org/10.7554/eLife.06602.015
-
Supplementary file 2
siRNA experimental output based on 31 parameters. Table listing all raw measurements based on the 31 parameters used in the analysis of the genome-wide siRNA screen in duplicate.
- https://doi.org/10.7554/eLife.06602.016
-
Supplementary file 3
The CILIOGENESIS data set. (A) Whole genome table listing the rank of predicted ciliary genes and non-ciliary genes. (B) The CILIOGENESIS data set containing the genes predicted by the classifier to be ciliary. (A–B) Genes predicted by the classifier to be ciliary are color coded. Green rows represents the genes with an FDR <0.01, yellow with FDR <0.1, orange with FDR <0.2, and the remainder (until FDR <0.267) is colored in dark orange. (C) Enrichment analysis by performing enrichment analysis with DAVID on the CILIOGENESIS database (excluding SCGCv1 genes). (D) Enrichment analysis with MsigDB (v4.0, gene sets from GO, KEGG and Reactome) on the CILIOGENESIS database (excluding SCGCv1 genes). (E) Enrichment analysis by performing enrichment analysis with MsigDB on the genes with FDR <0.01 within the CILIOGENESIS database (excluding SCGCv1 genes). (F) Enrichment analysis of hypergeometric gene set on MsigDB onto the true positive genes (SCGCv1 genes ranked within the CILIOGENESIS data set genes). (G) Gene set enrichment on MsigDB onto false negative genes (SCGCv1 genes ranked outside the CILIOGENESIS data set genes).
- https://doi.org/10.7554/eLife.06602.017
-
Supplementary file 4
Clinical features and KIAA0586 mutations. (A) Clinical features of individuals with KIAA0586 mutations. (B) Nomenclature per isoform of the identified KIAA0586 mutations.
- https://doi.org/10.7554/eLife.06602.018
-
Supplementary file 5
Primers. (A) Primers for KIAA0586 mutation confirmation and segregation analysis. (B) Primers for KIAA0586 mRNA and expression analysis.
- https://doi.org/10.7554/eLife.06602.019
Download links
A two-part list of links to download the article, or parts of the article, in various formats.
Downloads (link to download the article as PDF)
Open citations (links to open the citations from this article in various online reference manager services)
Cite this article (links to download the citations from this article in formats compatible with various reference manager tools)
Functional genome-wide siRNA screen identifies KIAA0586 as mutated in Joubert syndrome
eLife 4:e06602.
https://doi.org/10.7554/eLife.06602


