Low-noise encoding of active touch by layer 4 in the somatosensory cortex
- Janelia Research Campus, Howard Hughes Medical Institute, United States
Figures
Figure 1 with 2 supplements
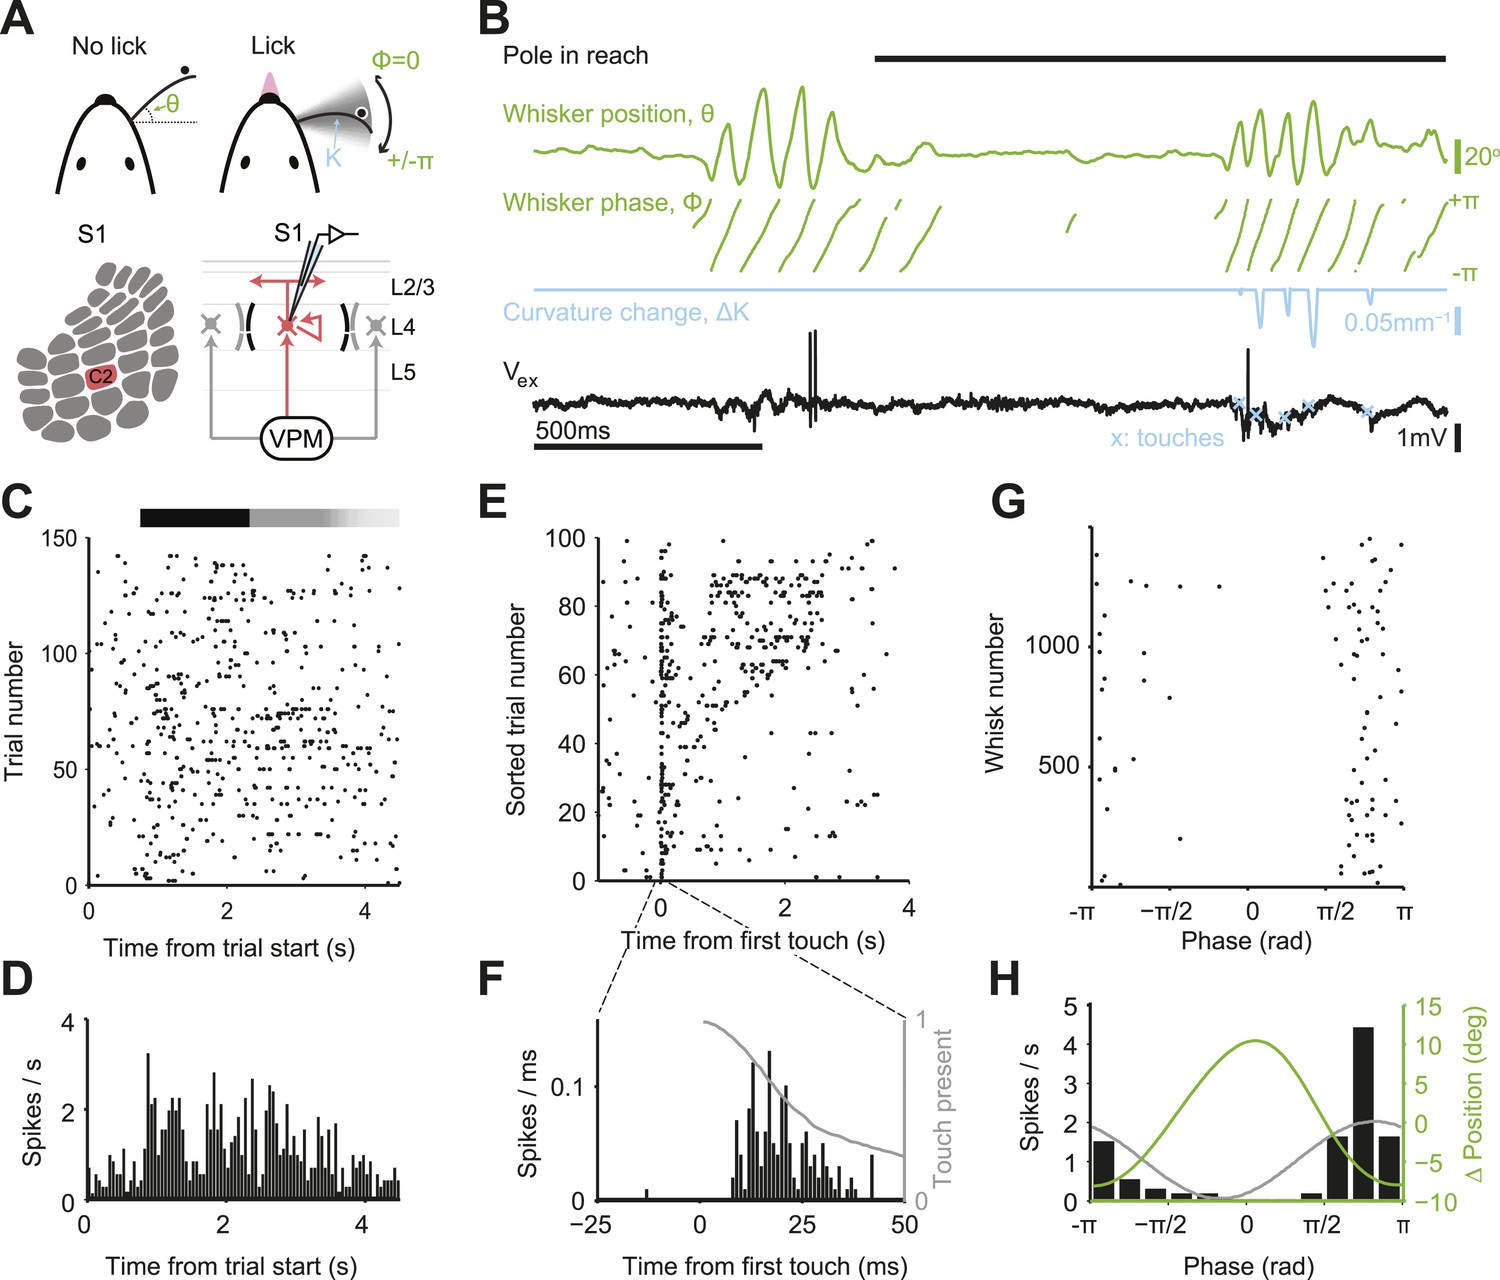
Activity during tactile behavior in a layer 4 excitatory cell.
(A) Top, mice judged object location with a single whisker. Whisker position (azimuthal angle, θ), whisking phase (ϕ), and whisker curvature (κ) were measured from video recordings. Bottom, recordings were made from excitatory cells in the principal barrel (red). L4 excitatory neurons receive excitatory input from VPM and excite each other within individual barrels. (B) Behavioral and electrophysiological data (single trial). θ, whisker position (green); ϕ, whisking phase (green); Δκ, change in whisker curvature (blue), which is proportional to pressure on mechanoreceptors at the base of the whisker; Vex, extracellular spike waveform (black) recorded in loose-seal mode (blue crosses, touch onsets). The black horizontal bar indicates the time when the object was in reach. (C) Spike raster for one example neuron. Same data as in D–H. Pole in reach for all trials (black bar) with variable exit time (grey bar). (D) Peri-stimulus time histogram aligned to the trial onset (bin size, 50 ms). (E) Spike raster aligned to first touch, and sorted according to last touch in the sample period (late on top). Trials without touch are not shown. (F) Peri-stimulus time histogram aligned to first touch (bin size, 1 ms). The grey line represents the proportion of touches with durations >= than time (max of 1). (G) Spikes aligned by whisking phase in a whisking bout (whisking amplitude >2.5° peak-to-peak). Only exploration periods excluding touch were used. (H) Spike histogram aligned to whisking phase (bin size, 30°) Best-fit spike modulation (grey). Average change in whisker position/bout (green).
Figure 1—figure supplement 1
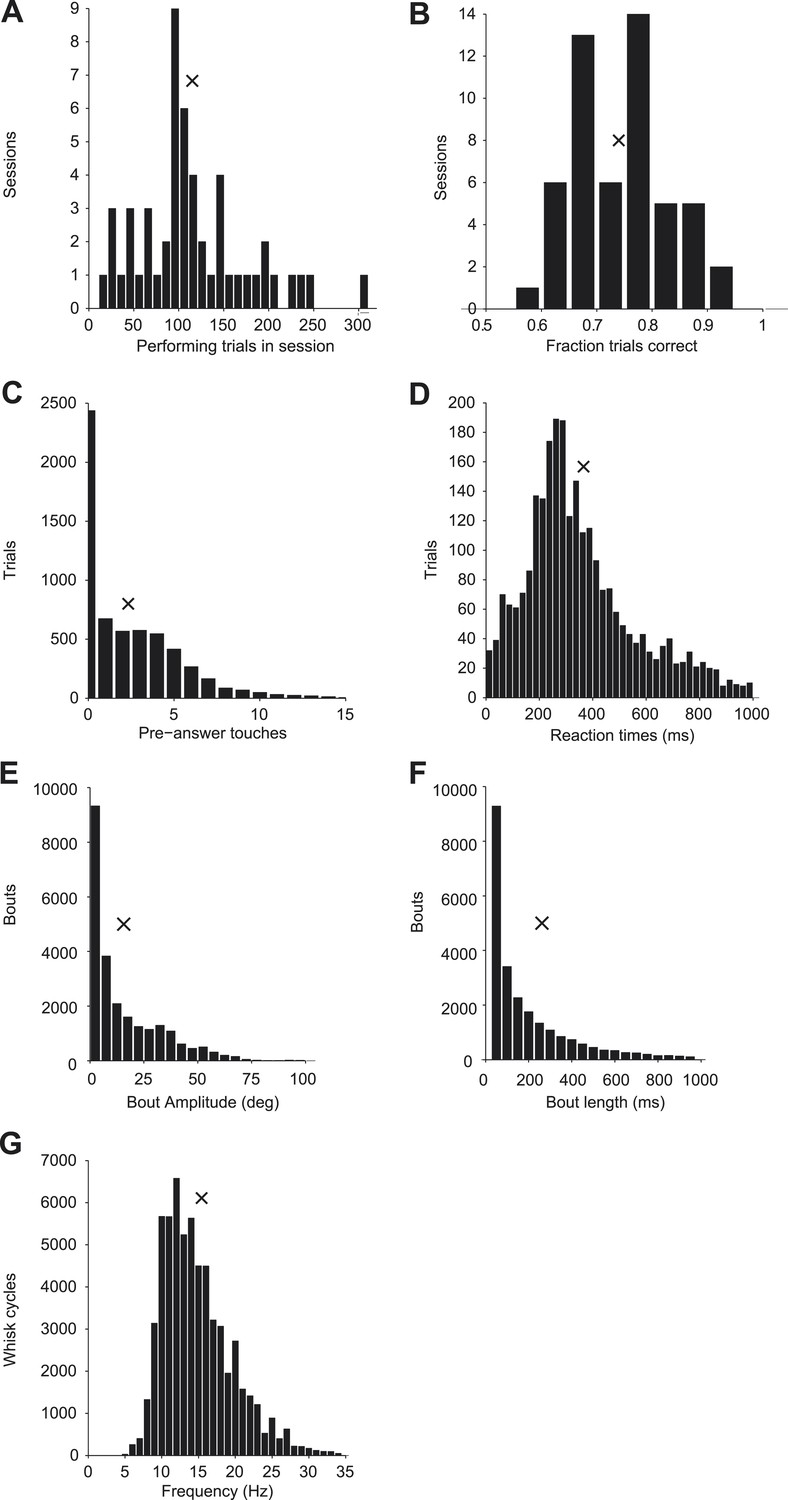
Behavior during cell-attached recordings.
(A) Histogram of performing trials analyzed per session; x indicates mean value in all plots. (B) Histogram of behavioral performance for each session. (C) Histogram of the number of touches before the response time across all sessions. (D) Histogram of time between onset of first touch to first lick across all sessions. (E) Histogram of the maximum amplitude of each whisking bout across all sessions. (F) Histogram of the duration of each whisking bout across all sessions. (G) Histogram of the frequency of whisking (1/cycle length) for each whisk cycle across all sessions.
Figure 1—figure supplement 2
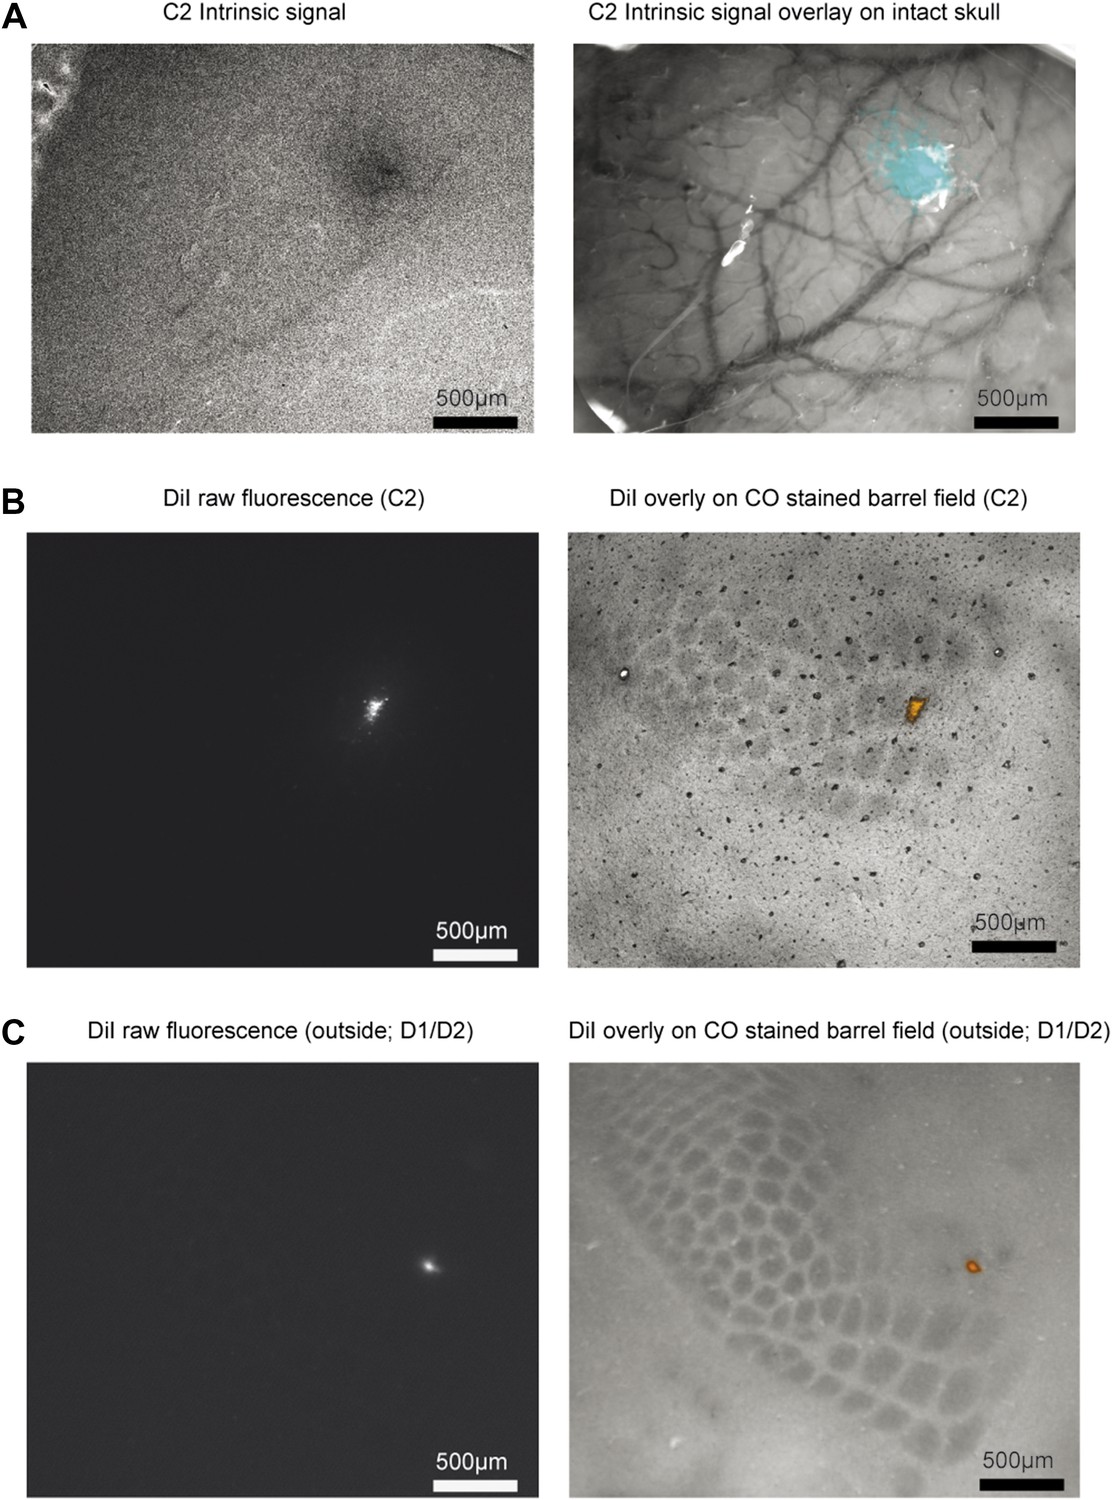
Targeting recordings.
(A) Left, Intrinsic signal showing response to stimulated C2 whisker (630 nm illumination). Right, overlay of intrinsic signal (cyan) on skull image (530 nm illumination). (B) Left, example DiI marking of recording site. Right, cytochrome oxidase stain and DiI overlay for a recording in C2. (C) Same as B, for a recording on the D1/D2 border.
Figure 2 with 1 supplement

Neural responses to behavioral variables across three populations.
(A) Grand mean peri-stimulus time histogram. Top, L4 in the C2 barrel (31 neurons); middle, L4 outside of C2 (10 neurons); bottom, in L5 near C2 (11 neurons). Pole in reach for all trials (black bar) and some trials (grey bar). (B) Peri-stimulus time histograms aligned to first touch. Top, neurons in L4 C2 sorted by time of peak touch response; middle, L4 neurons outside of C2; bottom, neurons in L5 near C2. Arrow head points to the same neuron as Figure 1B–H. (C) Peak spike rate after touch (1 ms bin) vs spike rate in the absence of whisking, individual cells (o), population means (x). Red, L4 inside C2; grey, L4 outside C2; yellow L5 near C2. (D) Spike rate during whisking compared to spike rate in the absence of whisking. Symbols as in C.
Figure 2—figure supplement 1
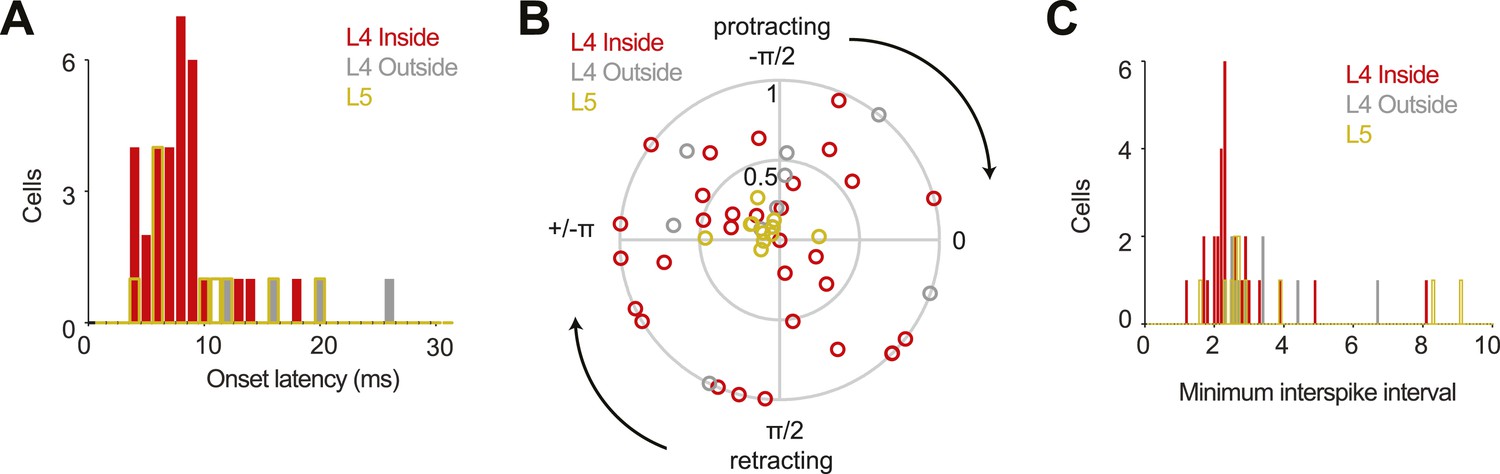
Some population characteristics of all recordings.
(A) Latency from touch onset to onset of spiking response for 31 L4 cells in C2 (red), four L4 outside C2 (grey) and eleven L5 near C2 (yellow). Latencies could not be determined for six L4 outside cells and one L5 cell due to lack of touch response. Same colors in B, C. (B) Modulation of spike rate by whisking phase. Angle of the peak phase response is plotted vs modulation depth. (C) Histogram of the minimum interspike interval measured for each neuron.
Figure 3 with 2 supplements
The majority of spikes in L4 excitatory neurons encode tactile information.
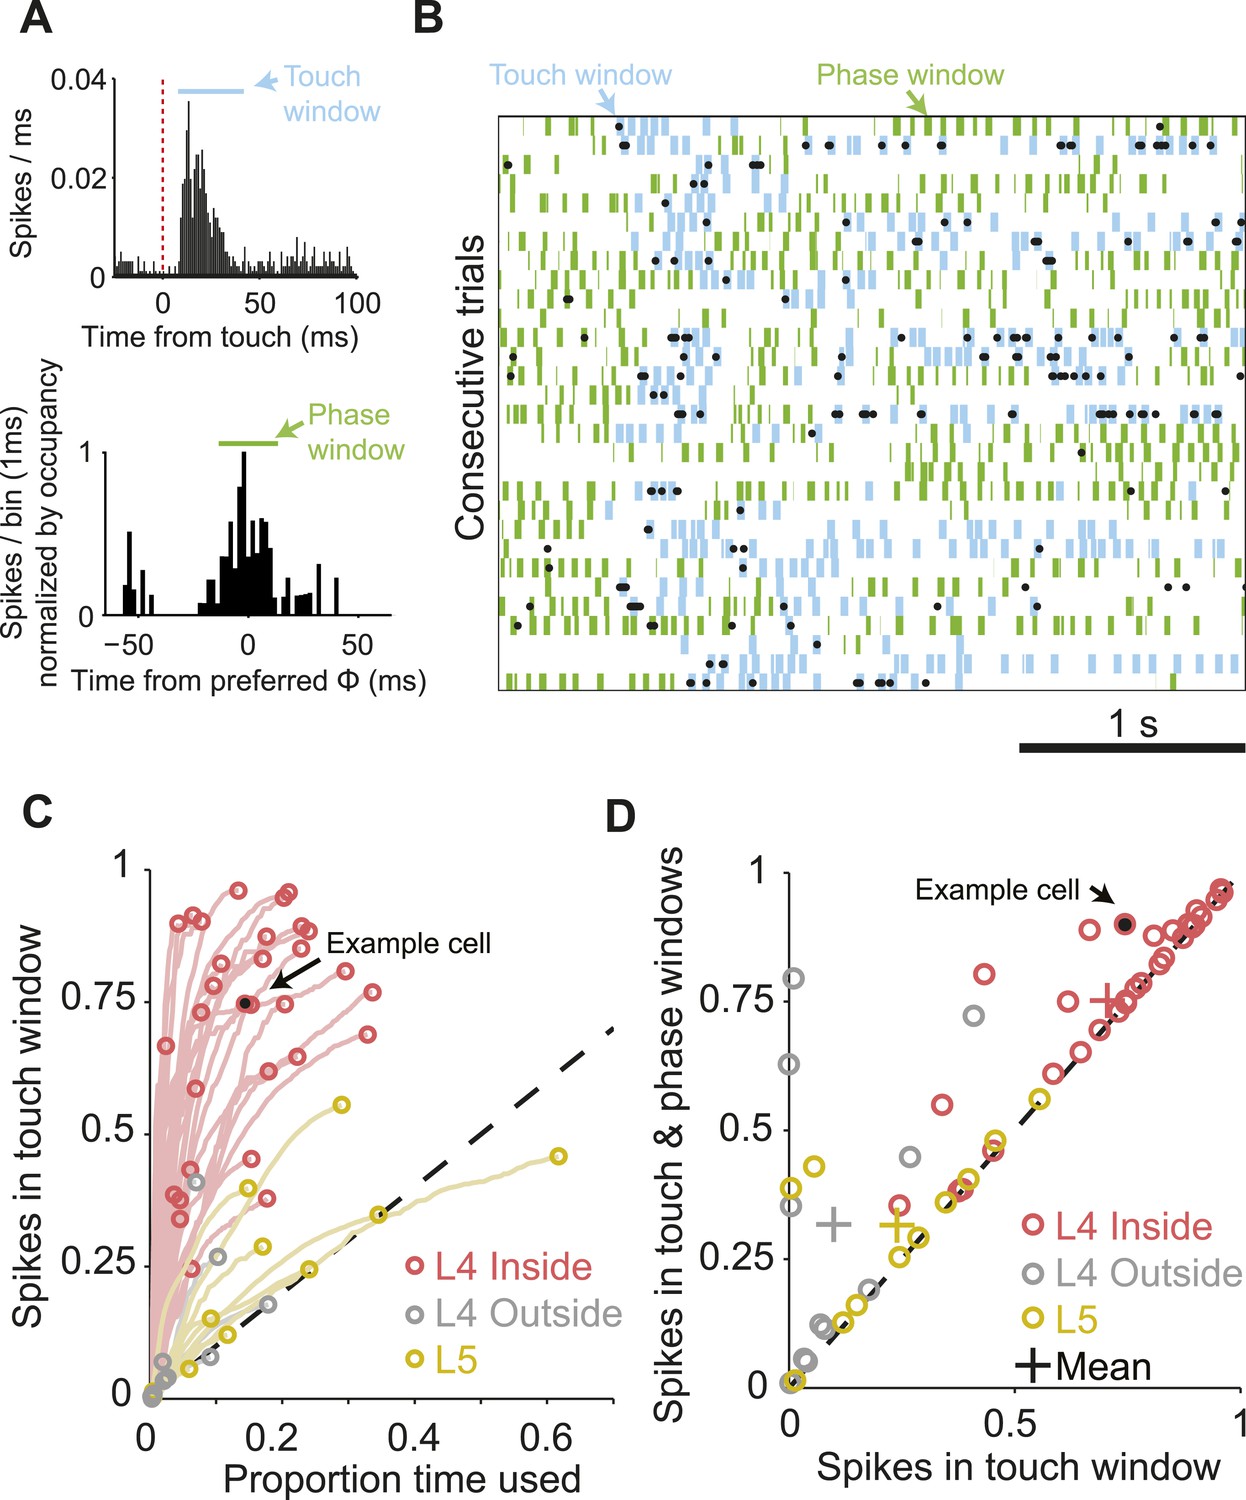
(A) Top, peri-stimulus time histogram of example cell from Figure 1 for all session touches with overlaid touch window (8–40 ms) (blue). Bottom, peri-stimulus spike histogram (PSTH) aligned to preferred whisking phase with overlaid window (green) aligned with the peak of the PSTH. Bins are normalized by occupancy. (B) Raster plot aligned to the sample period. Overlays: Blue, touch windows from A. Green, whisking phase windows from A, centered on the maximum in the phase-aligned spike histogram. Phase windows can be truncated at the margins of whisk cycles resulting in variable window lengths. (C) Proportion of spikes in touch window as a function of time in trial. Red, L4 inside C2; grey, L4 outside C2; yellow L5 near C2. Lines show the evolution of touch spikes as touch windows expand from the onset latency of each cell. Circles indicate the proportion of spikes coupled to touch at the final touch window size for each cell. (D) Proportion of spikes coupled to touch and whisking phase vs to touch alone. Colors as in C.
Figure 3—figure supplement 1
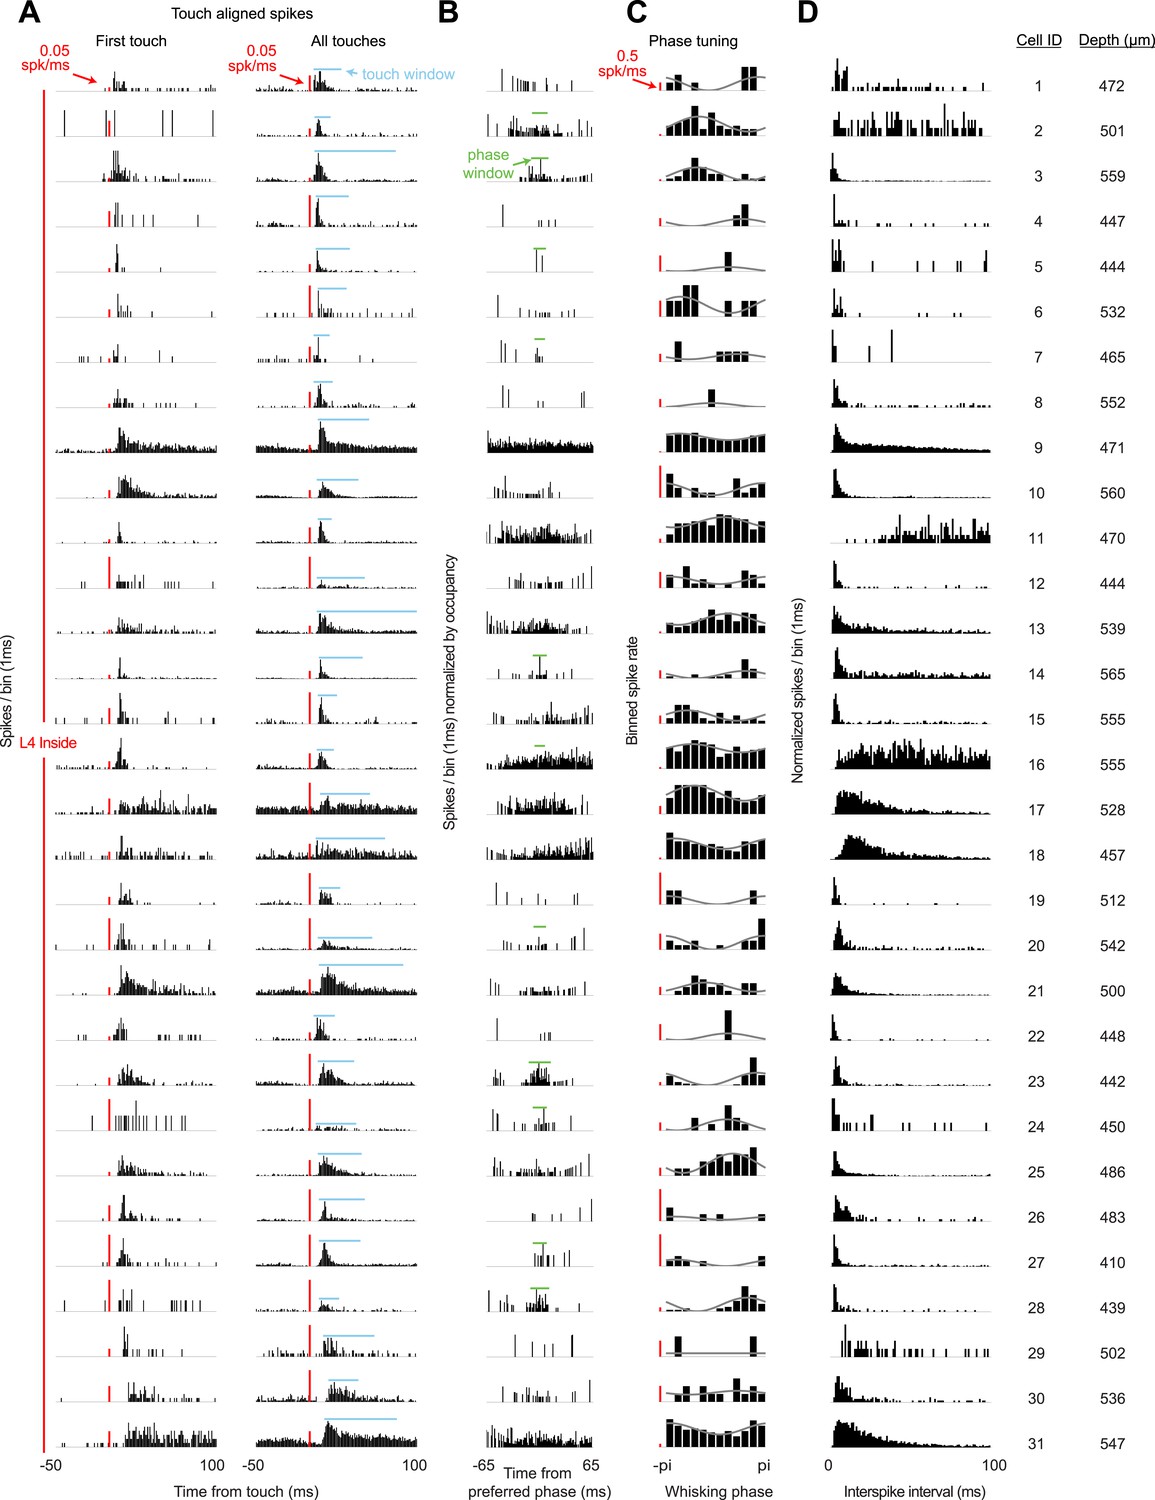
Response characteristics of all L4 recordings in C2.
(A) Peri-stimulus time histogram aligned to first touch onsets (left) or all touch onsets (right) in a session. Touch spike windows computed from all touches for each cell (blue). Red scale bar 0.05 spikes/ms. (B) Peri-stimulus spike histogram aligned to preferred whisking phase with whisking spike window (green). (C) Average spike rates for 12 phase bins (black) for each cell with sinusoidal fit (grey). Red scale bar 0.5 spikes/s. (D) Histogram of interspike intervals during each recording session. Depth is manipulator reading from pia.
Figure 3—figure supplement 2
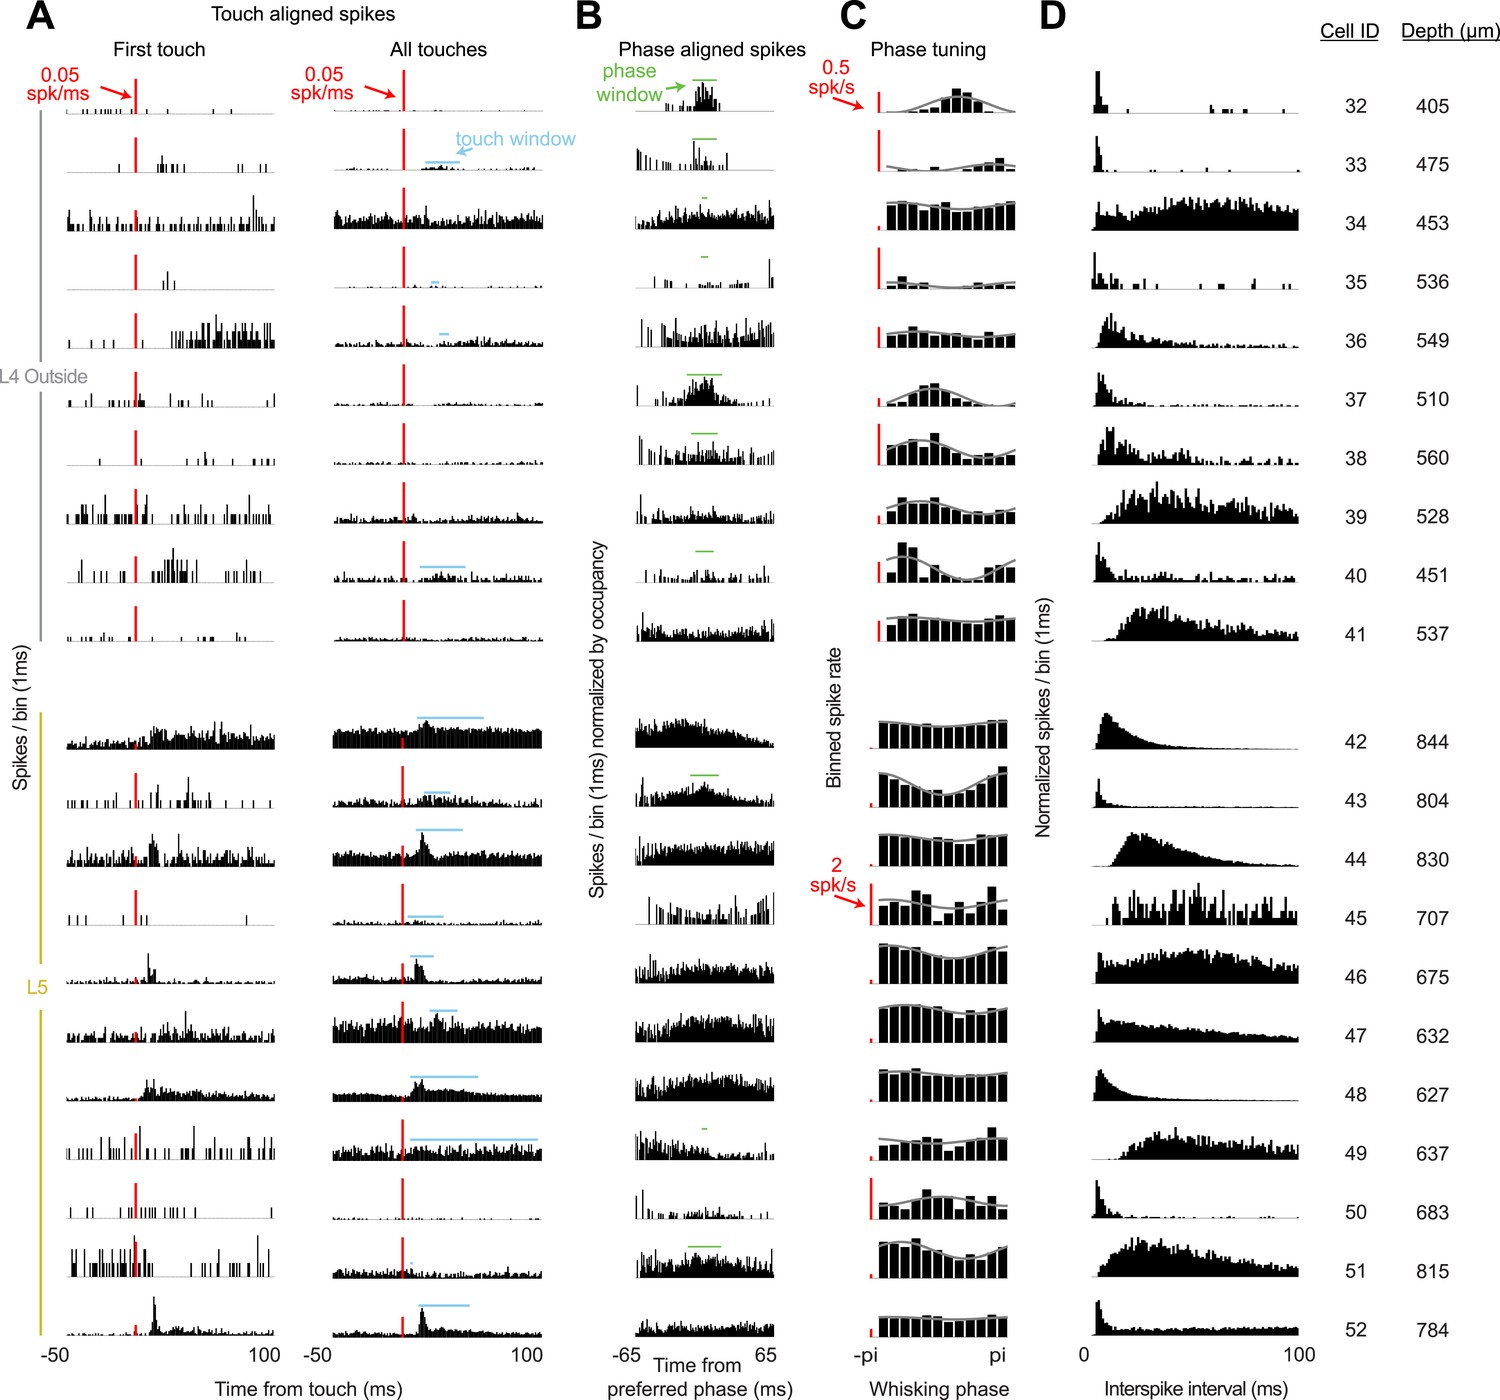
Response characteristics of all L4 recordings outside of C2 and L5 recordings near C2.
(A) Peri-stimulus time histogram aligned to first touch onsets (left) or all touch onsets (right) in a session. Touch spike windows computed from all touches for each cell (blue). Red scale bar 0.05 spikes/ms. (B) Peri-stimulus spike histogram aligned to preferred whisking phase with whisking spike window (green). (C) Average spike rates for twelve phase bins (black) for each cell with sinusoidal fit (grey). Red scale bar 0.5 spikes/s for L4 cells, 2 spikes/s for L5 cells. (D) Histogram of interspike intervals during each recording session. Depth is manipulator reading from pia.
Figure 4 with 1 supplement
Decoding of touch and phase from L4 spikes.
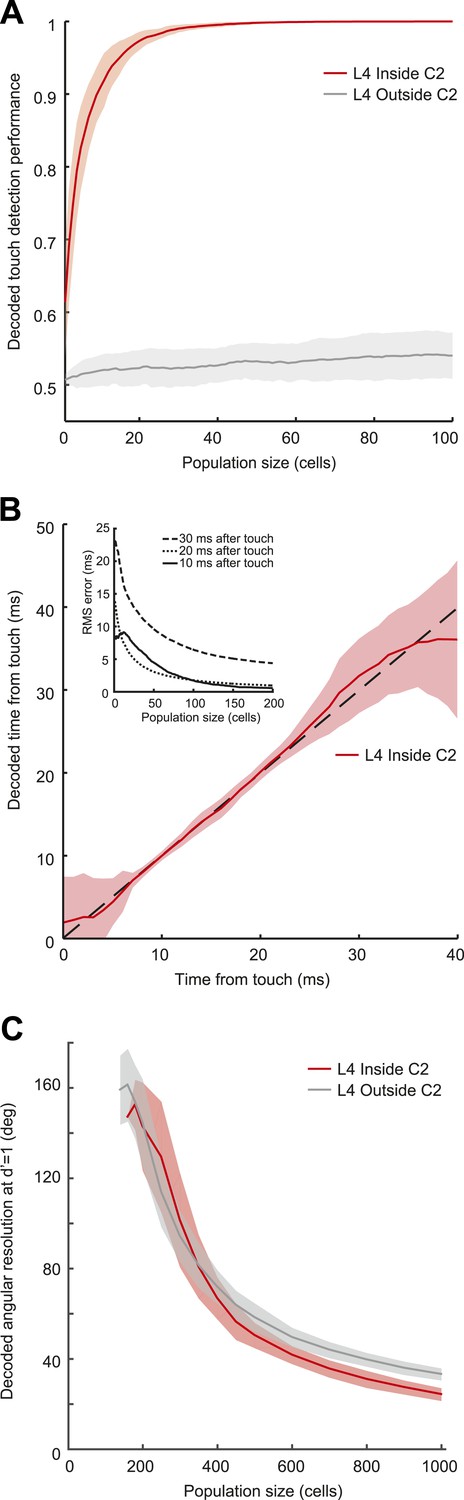
(A) Decoding of touch by a linear decoder of pooled activity. We randomly selected a variable number of neurons in two separate sets of neurons corresponding to L4 barrels inside C2 (red) and outside of C2 (gray). We pooled the activity of all the neurons in each of the sets and integrated the neural activity for 10 milliseconds. A one-dimensional linear decoder was trained to discriminate neural activity during touch and non-touch epochs. Sets of neurons inside C2 decode touch presence with high confidence. Shading indicates 95% bounds. (B) Decoding of time of touch using a naïve Bayes classifier. A decoder was trained to classify neural responses occurring at different times from touch onset (the decoder assumes that the touch onset is known). Mean prediction (red line), 95% bounds (light red), true time (black dash). Inset, precision of time of touch decoding as a function of population size and time from touch. (C) Decoding of whisking phase using a naïve Bayes classifier. Median phase resolution from 100 decoding runs (dark lines), 95% bounds (light bands). Performance of d′ = 1 is equivalent to 0.76 of estimates falling within the resolution width. Decoding performance of whisking phase is poor even with N = 1000 neurons. Inside C2, red; outside C2, grey.
Figure 4—figure supplement 1
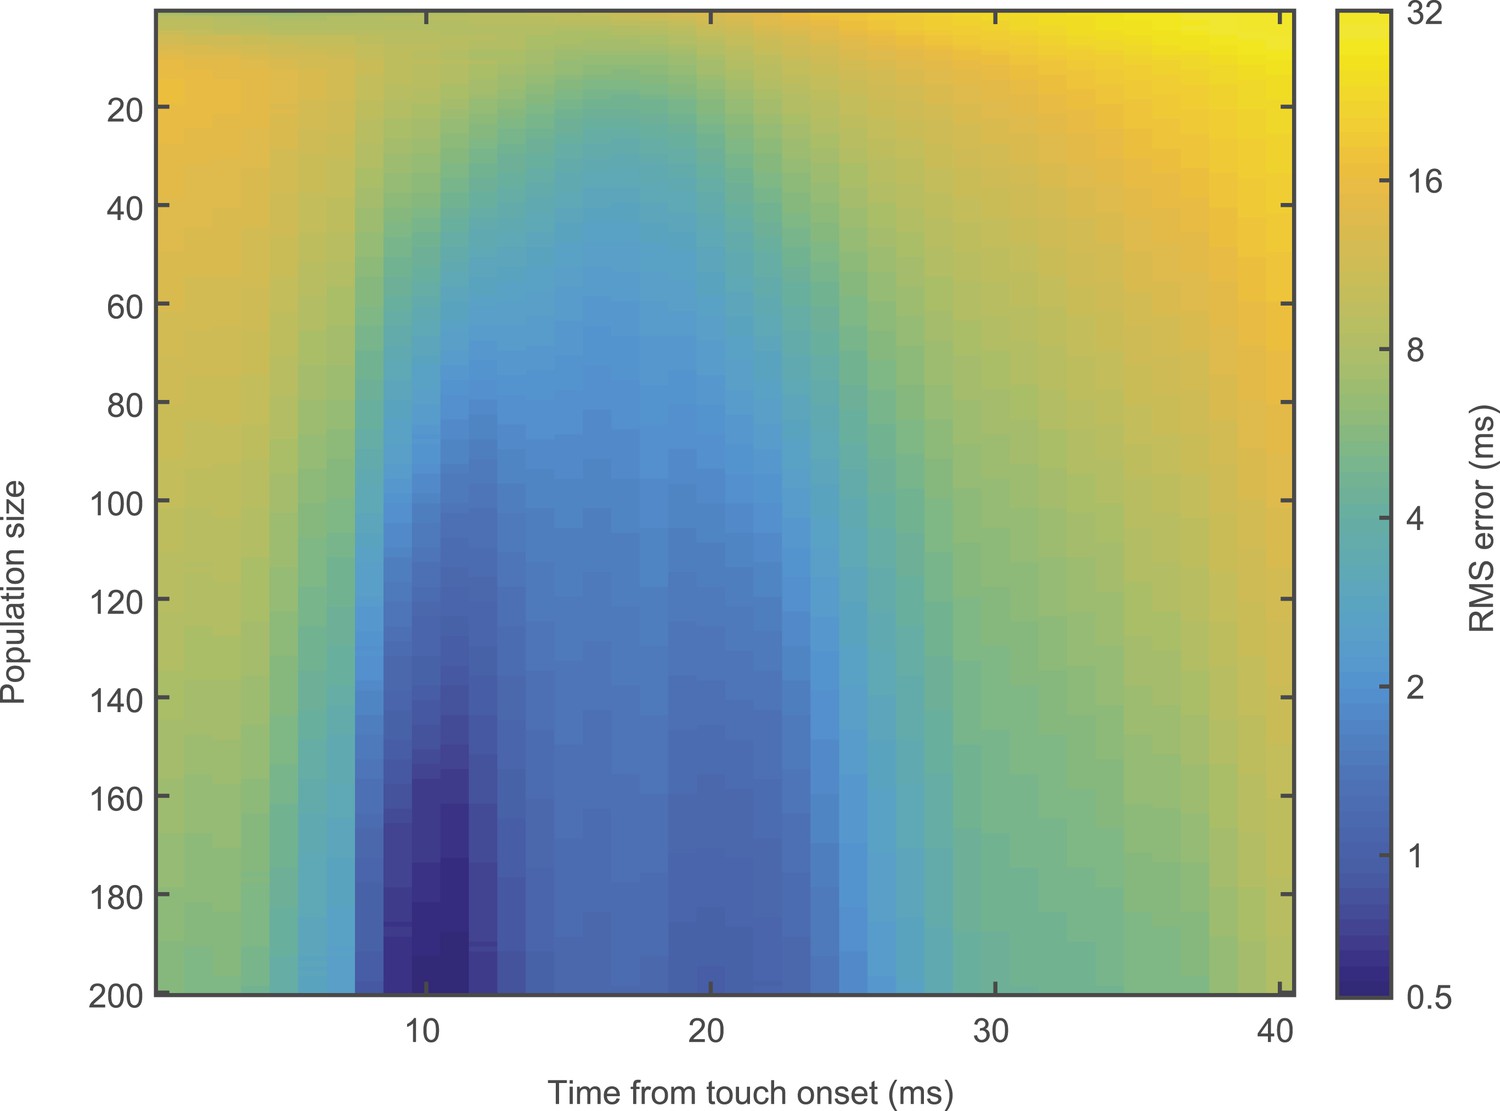
Temporal decoding error.
Heatmap of touch time decoding RMS error with respect to both population size and temporal position of analysis window.
Figure 5
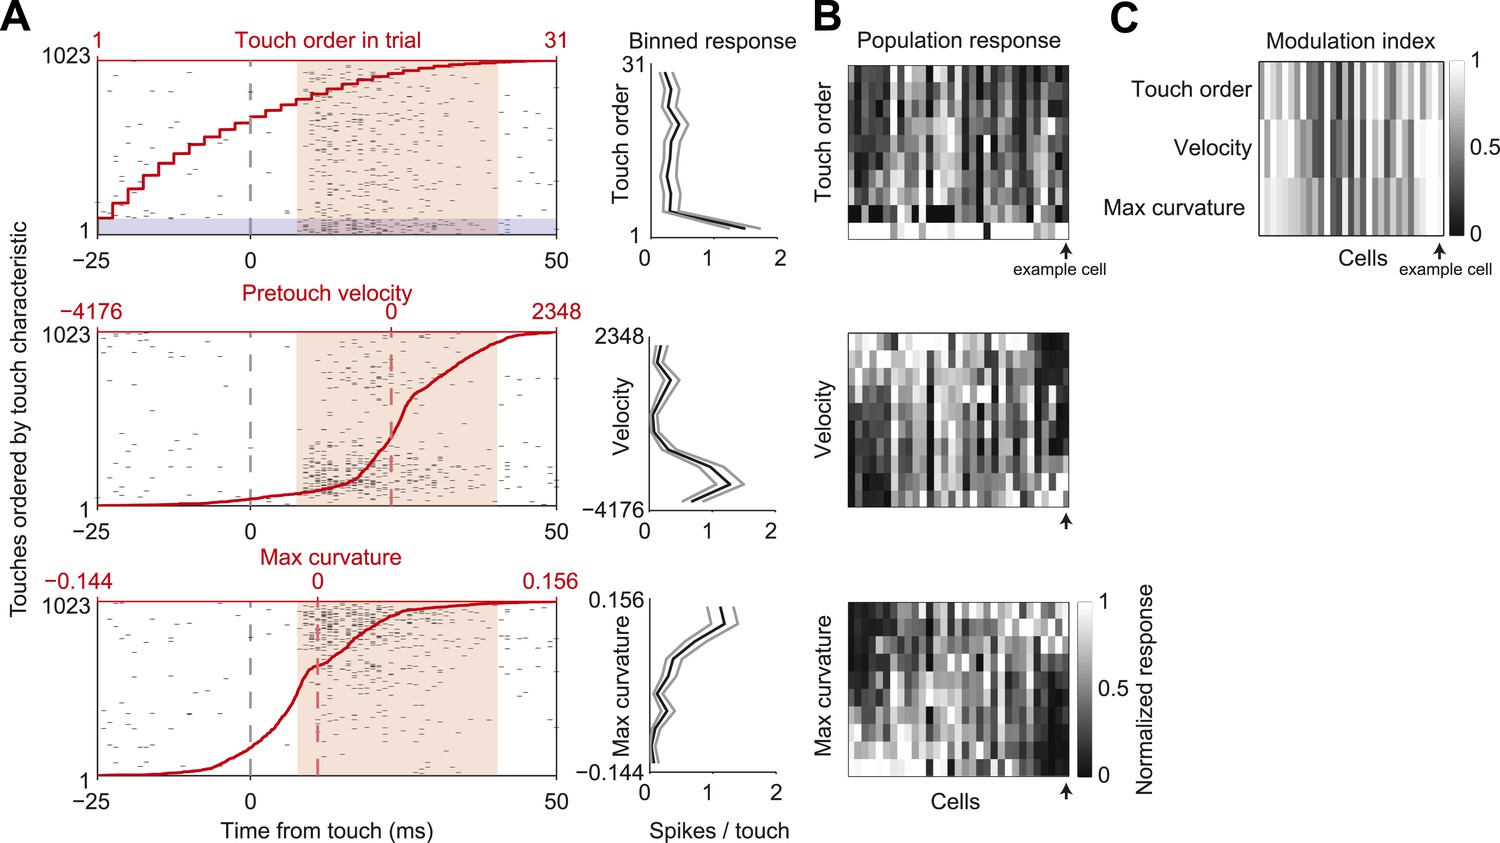
L4 spike count varies with touch properties.
(A) Left, touch aligned spike rasters for a single cell, sorted by one of three touch properties: Order of touch in trial (top), whisker velocity at touch onset (middle), maximum whisker curvature during touch (bottom). Value of touch property corresponding to the touch (red line). Spike integration window for binned touch response (pink), first touches in trials highlighted (grey). Right, average spikes per touch for a binned range of touch property (10 bins with equal number of touches) (black line), 95% confidence interval (grey line). Same example cell as in Figures 1, 3. (B) Heatmap of the response of each L4 excitatory cell inside C2 (n = 31) to the three touch characteristics across 10 equal element bins. Responses normalized to peak for each cell. Cells are ordered by the mean tuning to maximum touch curvature. Example cell highlighted by black arrow. (C) Heatmap of the modulation index of the same cells and touch characteristics (max bin − min bin)/(max bin + min bin).
Figure 6 with 1 supplement
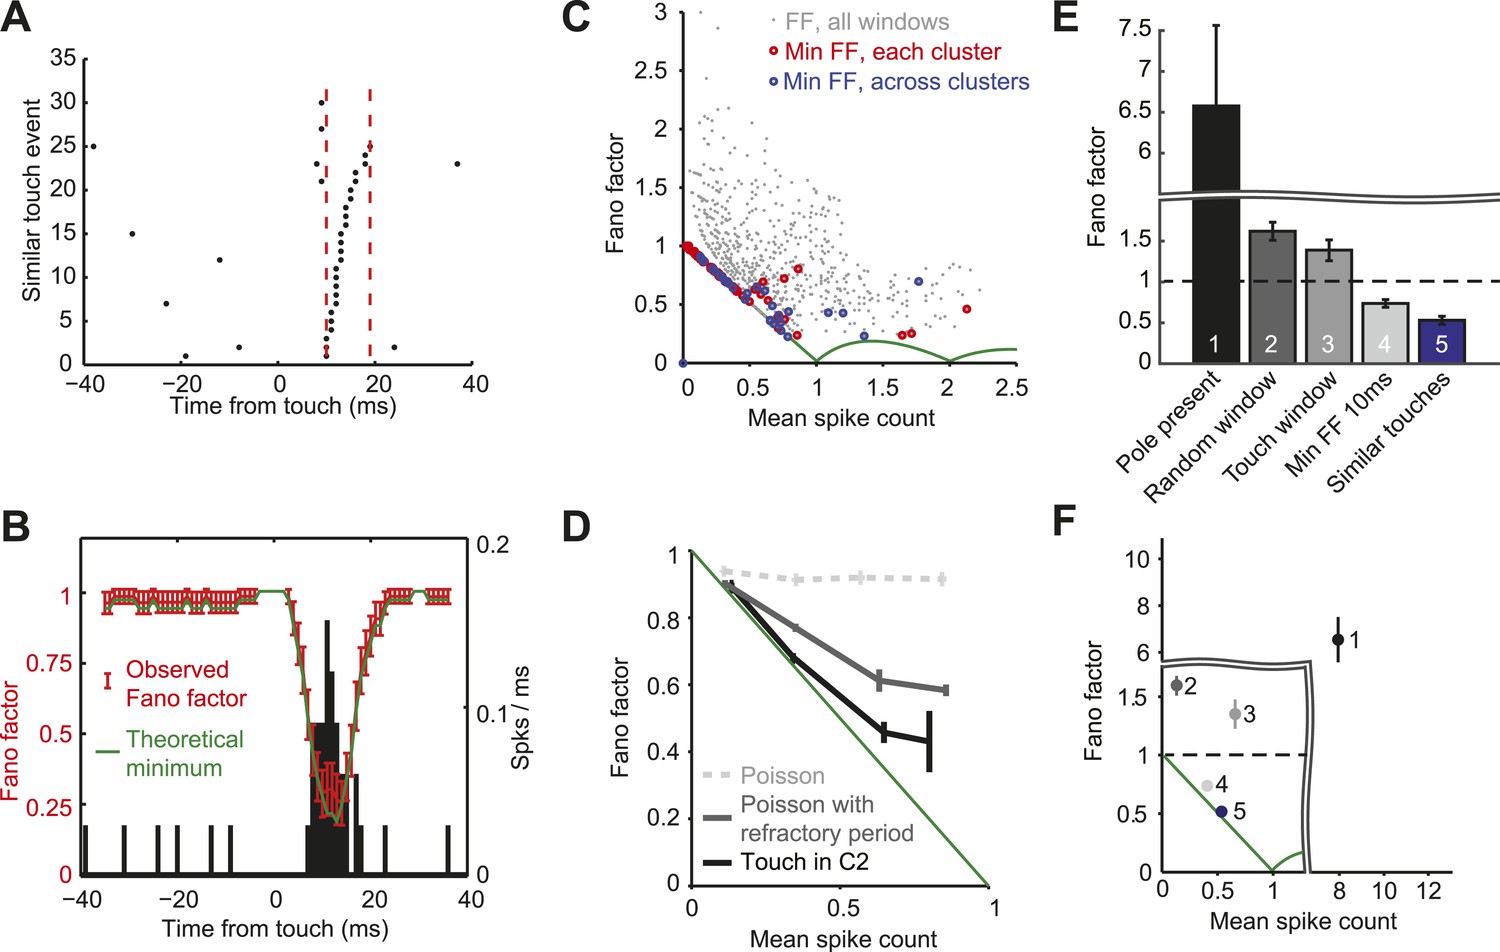
L4 responses show minimal spike count variance.
(A) Raster plot of an example neuron aligned to touch onset. Example integration window (dashed lines) in which the neuron elicits 0 or 1 spike (black dots) per touch. (B) Fano factor computed over a sliding window of 10 ms (red; same neuron as A). Fano factor is ∼1 before touch occurs because the mean spike count is very low (∼0.03), which implies a minimum possible Fano factor of ∼1. Error bars, bootstrap s.e.m. Theoretical minimum Fano factor (green). PSTH aligned to touch, 1 ms bins (black). (C) Fano factor as a function of mean spike count for all L4 neurons in C2. For each cell we calculated the Fano factor in sliding windows of 10 ms and for each of the five similar touch groups. Fano factor for each 10 ms sliding window starting from touch onset up to 20 ms post touch in 1 ms increments (grey dots). The minimum Fano factor between 0–20 ms post touch (five touch clusters per cell; red circles). The minimum Fano factor across the five groups (blue circles). Theoretical minimum Fano factor (green line). (D) Fano factor averaged across the population of L4 neurons (black). Fano factor expected for Poisson neurons with equivalent spike rates (dashed grey) and with a 2.3 ms refractory period (dark grey). Error bars represent s.e.m. (E) Comparison of Fano factors. ‘1’, counting spikes during the sample period when the pole is within reach. ‘2’, counting spikes in random windows of 38 ms duration. The number of epochs per trial was matched to the number of touches in each trial. ‘3’ counting spikes in 38 ms windows after touch plus a latency of 6 ms. ‘4’, minimum FF using a sliding window of 10 ms after touch (between 0–20 ms after touch). ‘5’, same as ‘4’, except touches were divided into five groups (as in panels A–D). Bars are s.e.m. (F) Fano factor as a function of mean spike count for the five conditions shown in panel E. Bars are s.e.m.
Figure 6—figure supplement 1
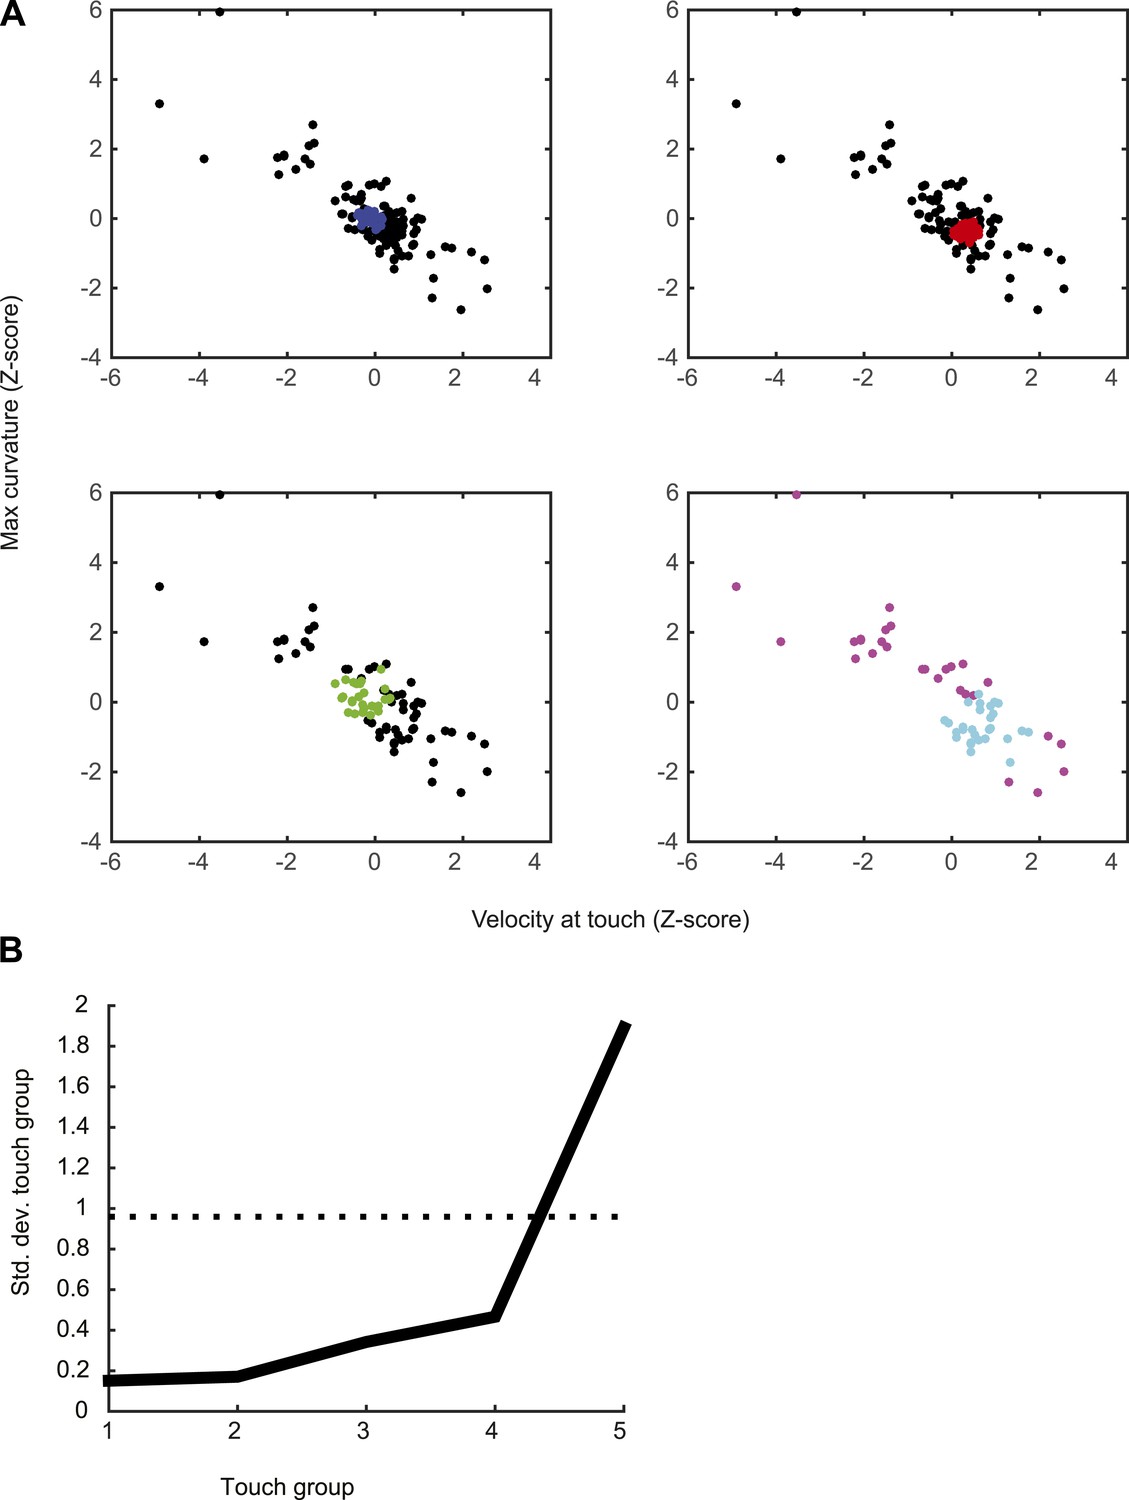
Grouping of touch events using density-based clustering (OPTICS algorithm; see ‘Materials and methods’) for an example neuron.
(A) Separation into five groups of touches by successively removing touches with similar attributes. In the first panel, blue dots represents the 20% of touches with similar velocity at touch and maximum curvature change (maximum between 0–20 ms after touch). Black dots represent all the other touches. The second group of touches (red) is obtained by repeating the clustering with the blue dots removed. This process is repeated until obtaining the five touch groups. (first group = blue; second group = red; third group = green; fourth group = cyan; fifth group = magenta). (B) Standard deviation in each of the five groups compared to random sampling. The procedure finds subset of points with significantly less behavioral variability than in the full dataset. The black curve represents the standard deviation for velocity at touch (z-scored), the curve for maximum curvature is similar (not shown).
Author response image 1
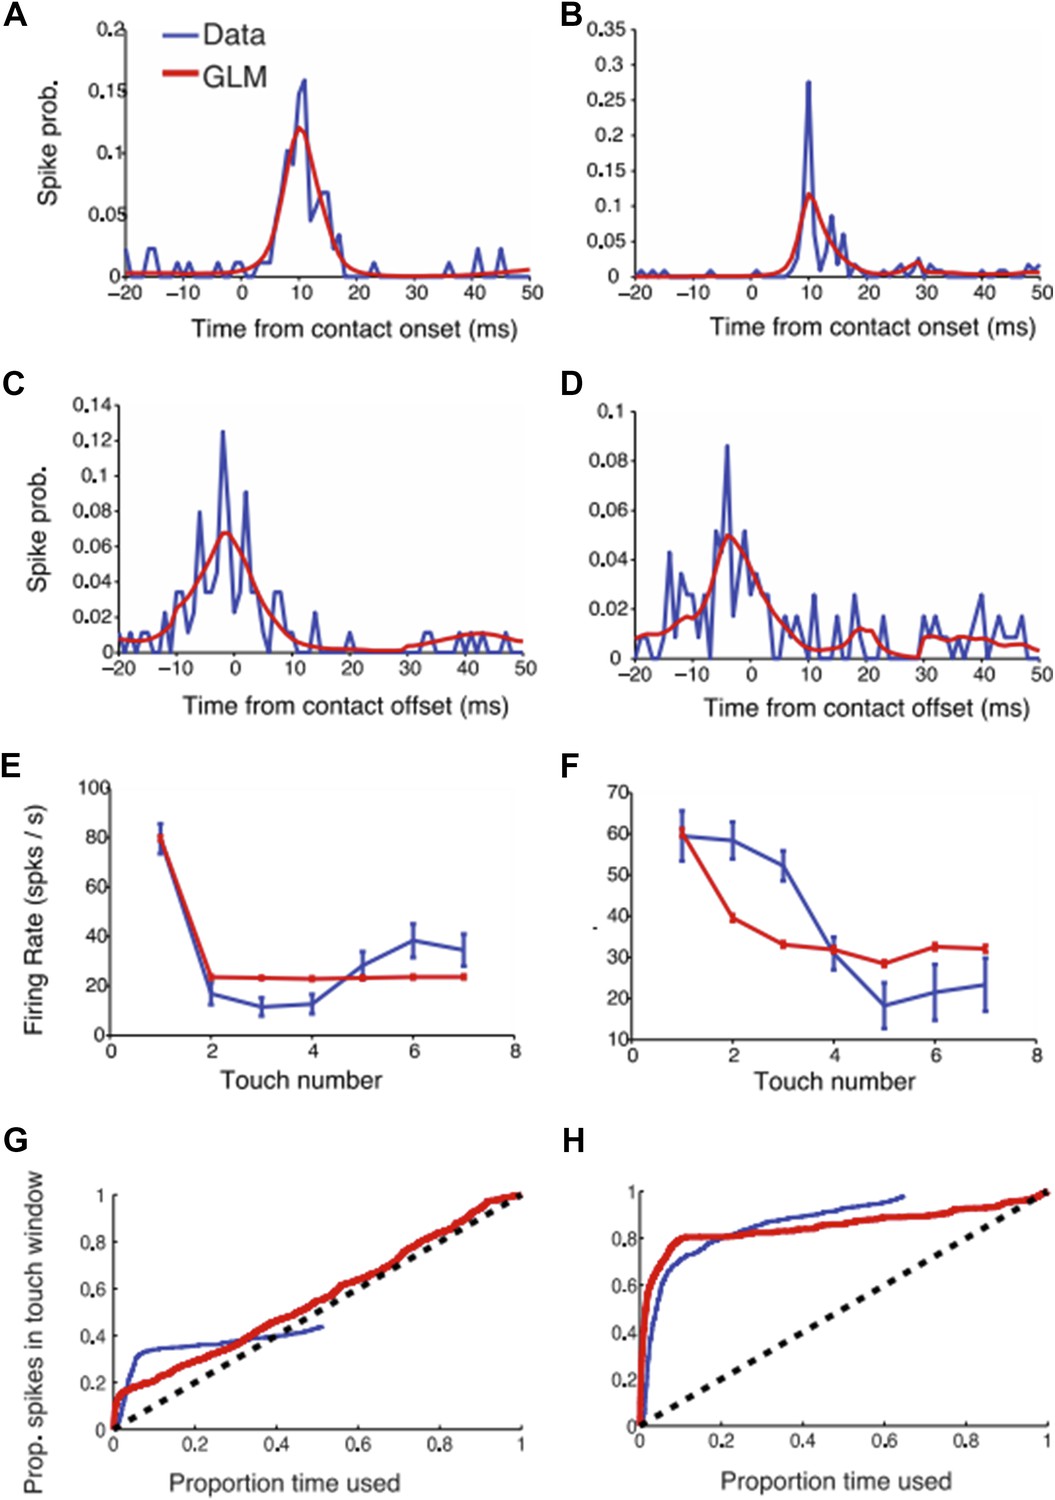
GLM modeling of L4 touch responses. (a-b) Two example neural responses (blue) aligned to touch onset and their corresponding GLM prediction (red). (c-d) Same as (a-b) but aligned to touch offset. (e-f) Touch adaptation in function of touch number. (g-h) Proportion of spikes explained as a function of the exploration time (similar to Figure 3 in the paper). The blue curve (data) was obtained as described in the paper. For the GLM we started counting spikes ranked by the maximum GLM prediction (i.e. the moments with highest probability of a spike occurring according to the GLM model).
Tables
Table 1
Spiking responses of recorded neurons
| Area | Spikes/touch first touch | Spikes/touch later touch | Spikes evoked (touch) | Spikes evoked (touch and whisking) | Phase modulation depth | Non-whisking spike rate (spk/s) | Whisking spike rate (spk/s) | Onset latency (ms) | Minimum ISI (ms) |
|---|---|---|---|---|---|---|---|---|---|
| L4 | 1.36 ± 1.32 | 0.74 ± 0.87 | 70.6 ± 20.9% | 75.2 ± 19.0% | 0.67 ± 0.32 | 1.31 ± 2.88 | 1.39 ± 2.33 | 7.8 ± 3.0 | 2.9 ± 1.9 |
| Inside C2 | 0.87 | 0.33 | 74.7% | 80.3% | 0.70 | 0.32 | 0.33 | 8 | 2.3 |
| (n=31) | (0.08–5.77) | (0.10–2.92) | (24.5–96.0%) | (35.3–96.8%) | (0–1.00) | (0.02–13.7) | (0.02–10.9) | (4–18) | (1.2–11.0) |
| L4 | 0.08 ± 0.19 | 0.02 ± 0.04 | 9.2 ± 13.7% | 33.0 ± 30.2% | 0.58 ± 0.36 | 2.20 ± 2.91 | 2.41 ± 3.48 | 18.5 ± 6.0 | 3.3 ± 1.3 |
| Outside C2 | 0 | 0 | 3.6% | 23.8% | 0.61 | 1.10 | 1.31 | 18 | 2.8 |
| (n=10) | (0–0.61) | (0–0.12) | (0–41.0%) | (1.0–79.4%) | (0.10–1.00) | (0.03–8.86) | (0.17–11.8) | (12–26) | (2.3–6.7) |
| L5 | 1.95 ± 2.96 | 1.28 ± 1.88 | 24.0–18.6% | 31.5 ± 16.4% | 0.18 ± 0.12 | 12.0 ± 9.87 | 16.2 ± 15.3 | 9.7 ± 5.2 | 3.7 ± 2.5 |
| Near C2 | 0.98 | 0.42 | 24.4% | 36.0% | 0.13 | 12.8 | 13.5 | 8 | 2.7 |
| (n=11) | (0–8.68) | (0–5.47) | (0.5–55.5%) | (1.4–56.1%) | (0.06–0.46) | (0.23–29.7) | (1.00–54.0) | (4–20) | (1.6–9.1) |
-
Mean ± standard deviation; median; (range).
Download links
A two-part list of links to download the article, or parts of the article, in various formats.
Downloads (link to download the article as PDF)
Open citations (links to open the citations from this article in various online reference manager services)
Cite this article (links to download the citations from this article in formats compatible with various reference manager tools)
Low-noise encoding of active touch by layer 4 in the somatosensory cortex
eLife 4:e06619.
https://doi.org/10.7554/eLife.06619


