Regulation of the PI3K pathway through a p85α monomer–homodimer equilibrium
- University of Texas MD Anderson Cancer Center, United States
- King Abdullah University of Science and Technology, Saudi Arabia
Figures
Figure 1 with 5 supplements
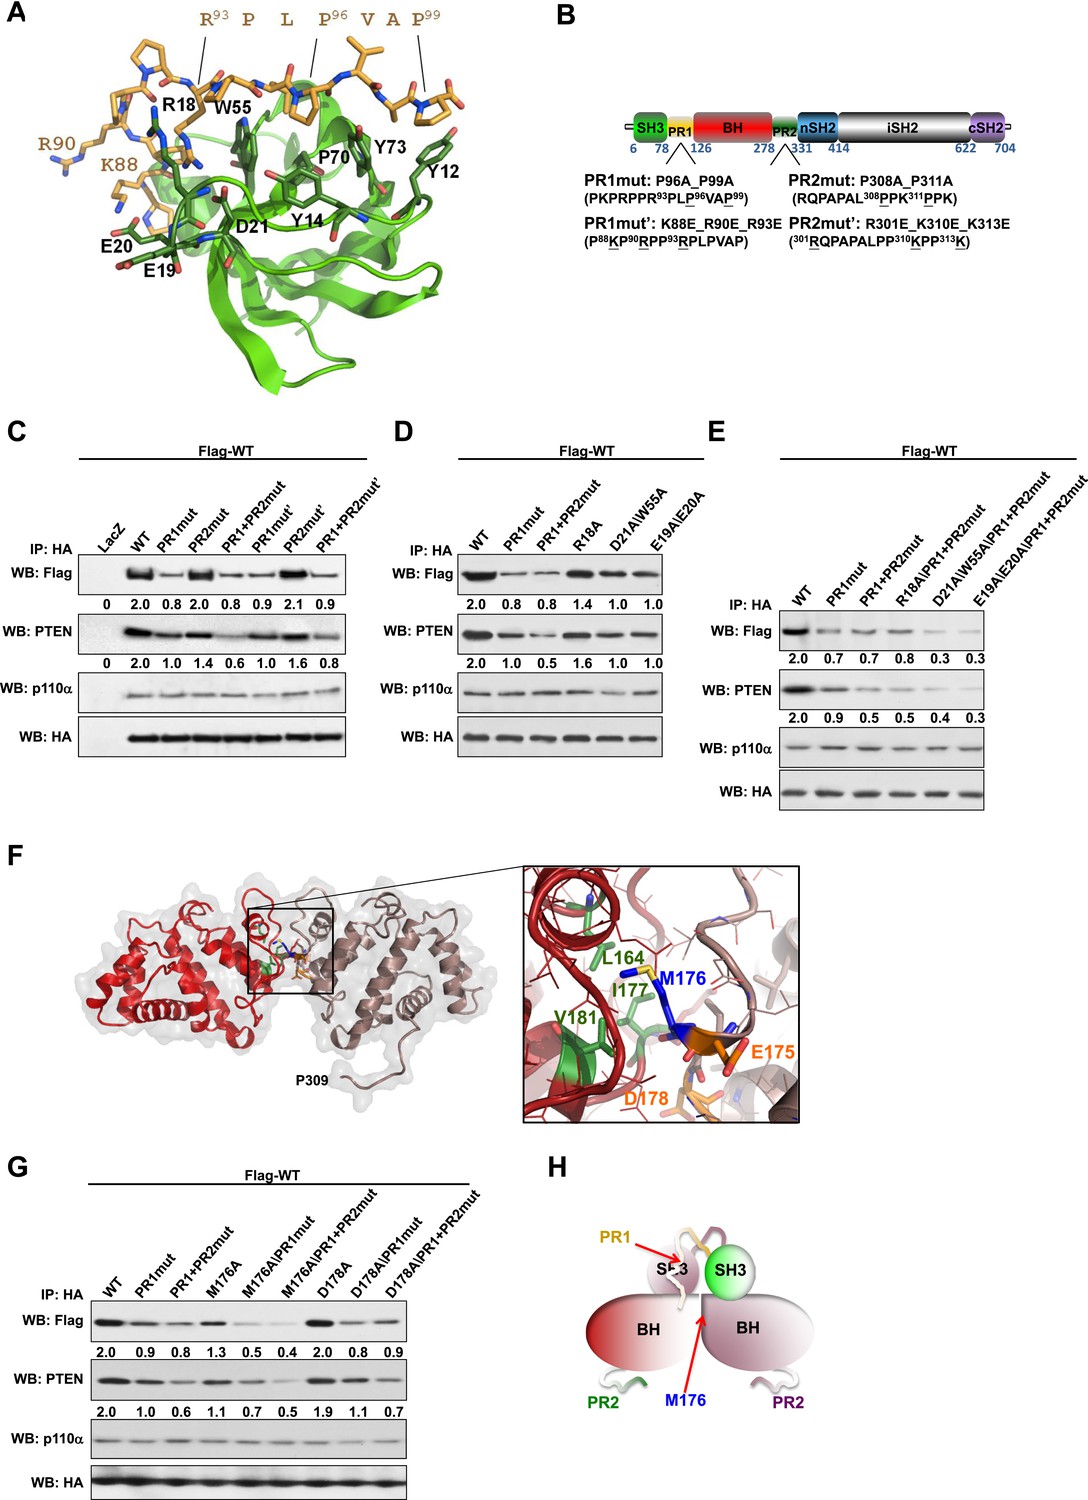
Intermolecular interactions contribute to p85α homodimerization and PTEN binding.
(A) Theoretical molecular model of the p85α SH3:PR1 interaction. The Qualitative Model Energy Analysis (QMEAN) Z-score of the model is −0.8 [the QMEAN Z-score ranges from −4 (worse) to +4 (best) with the average for high-resolution X-ray structures being 0 (Benkert et al., 2009)]. Key residues on the Src homology 3 (SH3) domain (green) are highlighted. The RXXPXXP motif of the PR1 region (carbons colored in amber) is indicated. (B) Schematic showing the residues mutated in the PR1 and PR2 mutants. (C) KLE cells co-transfected with Flag-tagged wild-type (WT) p85α (Flag-WT) and HA-tagged WT p85α or proline-rich (PR) mutants for 72 hr were harvested for immunoprecipitation (IP) with anti-HA and Western blotting (WB). (D, E) In other sets of the experiment, cells co-transfected with Flag-WT and mutants in SH3 domain (D) or both SH3 and PR domains (E) were harvested for IP using the same Materials and methods. (F) The molecular structure of BH:BH domain dimer, taken from the crystal structure of this domain (1PBW). Individual monomers are color-coded. P309, the last PR2 residue modeled in the crystal structure, is indicated. The zoom-in window shows details of the BH:BH interaction, with residues discussed in this study highlighted. (G) KLE cells co-transfected with Flag-WT and HA-WT or mutants in BH domain were collected for IP with anti-HA. LacZ was used as control. Numerical values below each lane of the immunoblots represent quantification of the relative protein levels by densitometry (normalized to HA levels). (H) Schematic model of the p85α SH3-PR1-BH homodimer. The nSH2-iSH2-cSH2 fragment is not included the model.
Figure 1—figure supplement 1
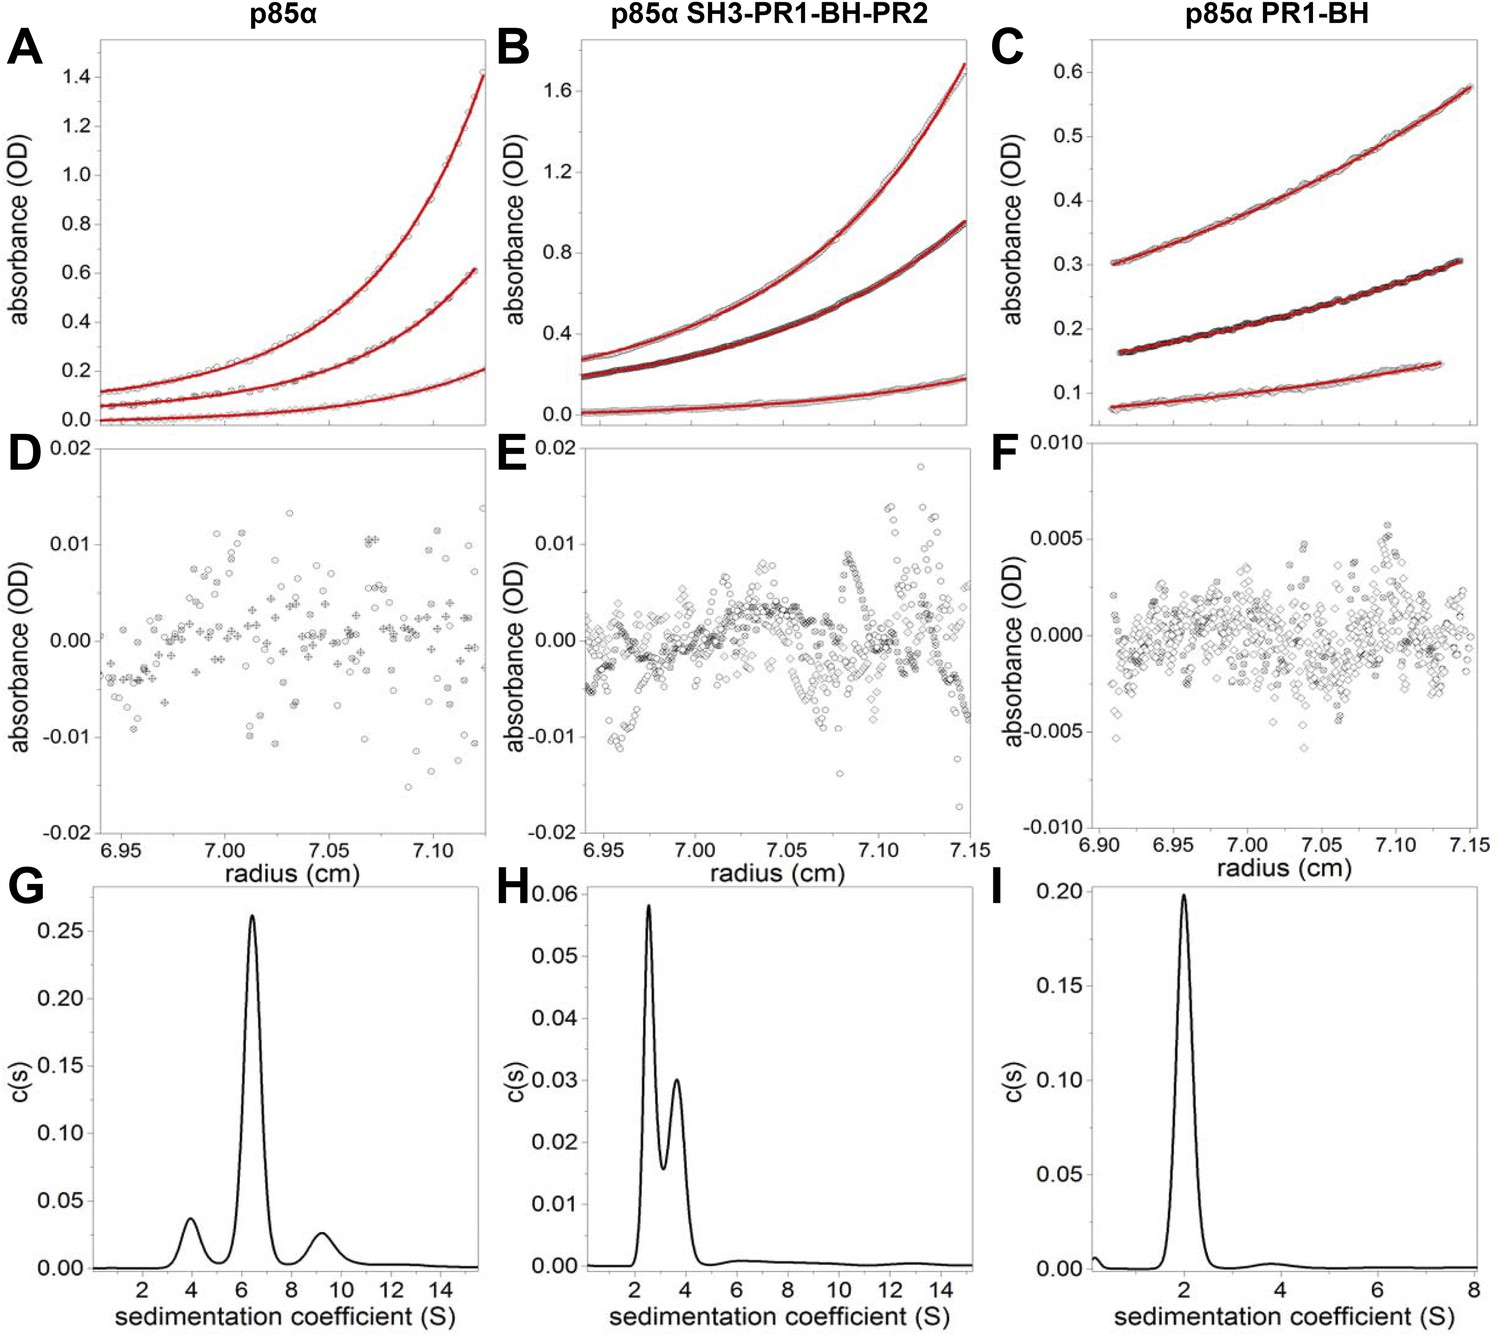
(A–F) Sedimentation equilibrium data for full-length p85α, p85α PR1-SH3-BH-PR2 (residues 1–333), and p85α PR1-BH (residues 79–301).
The data of final equilibrium profiles (black symbols) were fitted (red line) to the monomer–dimer–tertramer model (p85α and p85α PR1-SH3-BH-PR2) or a monomer–dimer model (PR1-BH) with reduced χ2 of 1.253, 1.14, and 1.18 and root mean squared differences of 0.0026–0.0090, 0.0021–0.0073, 0.0017–0.0018; yielding the dimerization Kd of 7.0 ± 0.7 μM, 0.53 ± 0.03 μM, and 162.9 ± 41.4 μM for p85α, p85α PR1-SH3-BH-PR2, and p85α PR1-BH, respectively. The errors represent standard errors. (G–I) Sedimentation coefficient distribution profiles of each protein at 1.5 mg/ml.
Figure 1—figure supplement 2
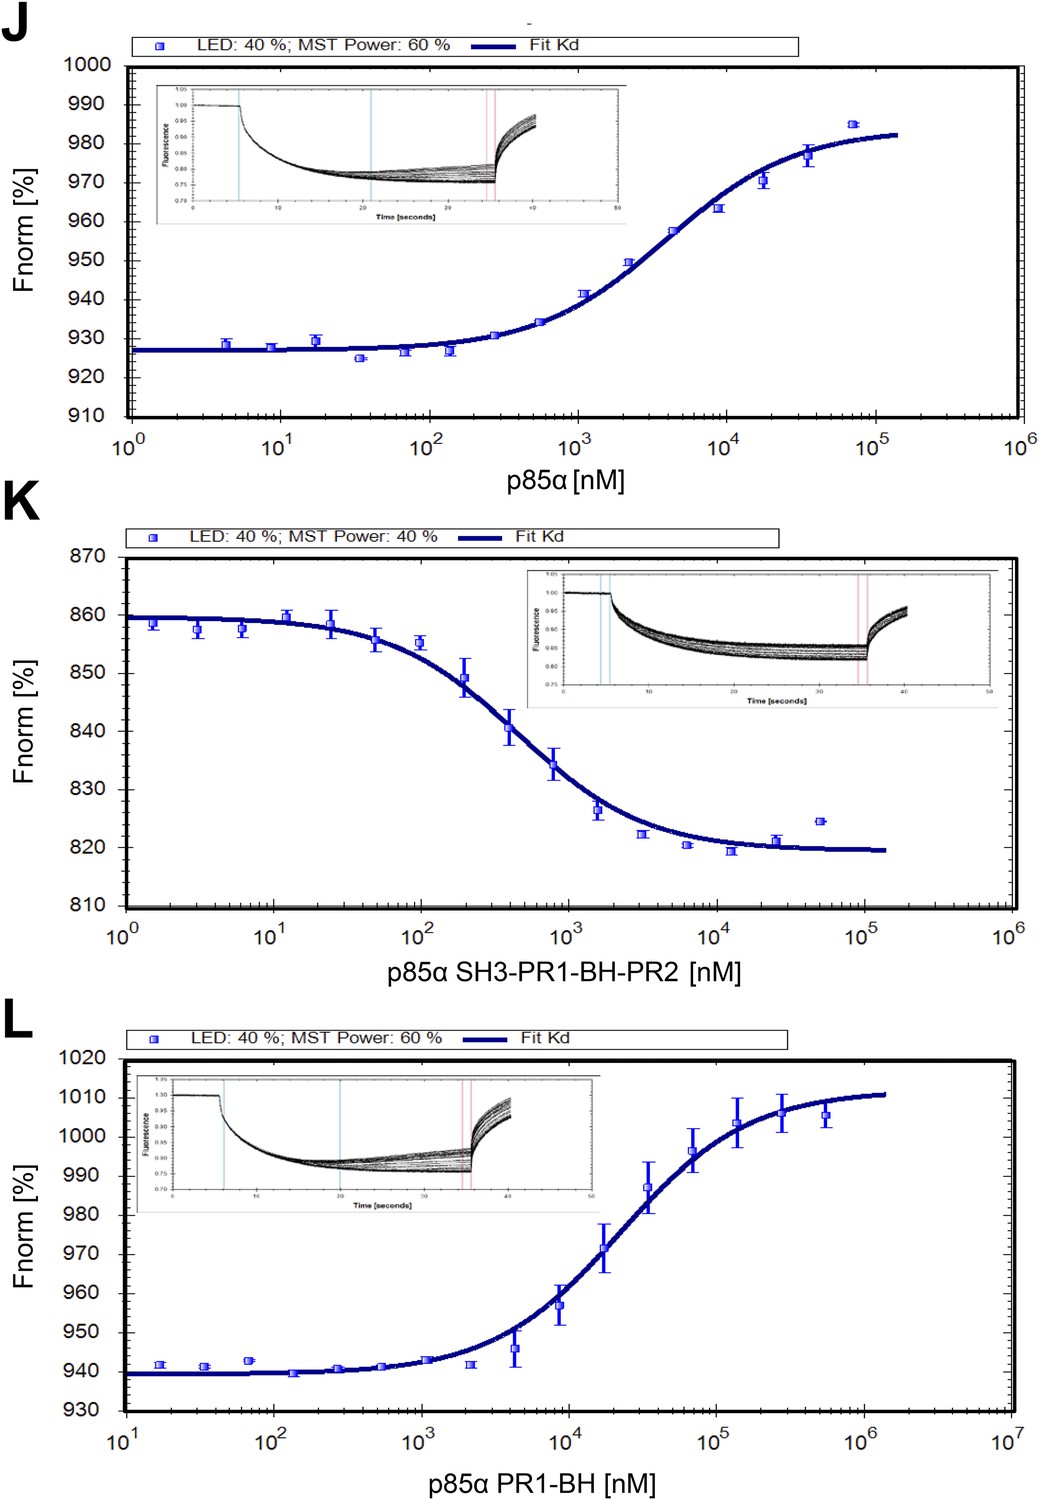
(J–L) Microscale thermophoresis (MST) data on dimerization of p85α (full length, SH3-PR1-BH-PR2 and PR1-BH).
Affinities for individual constructs were determined at Kd p85α = 3.9 ± 0.2 μM, Kd p85α1-333 = 441 ± 30 nM, and Kd p85α PR1-BH = 22.3 ± 1.5 μM. The errors are standard deviation calculated from three independent measurements.
Figure 1—figure supplement 3
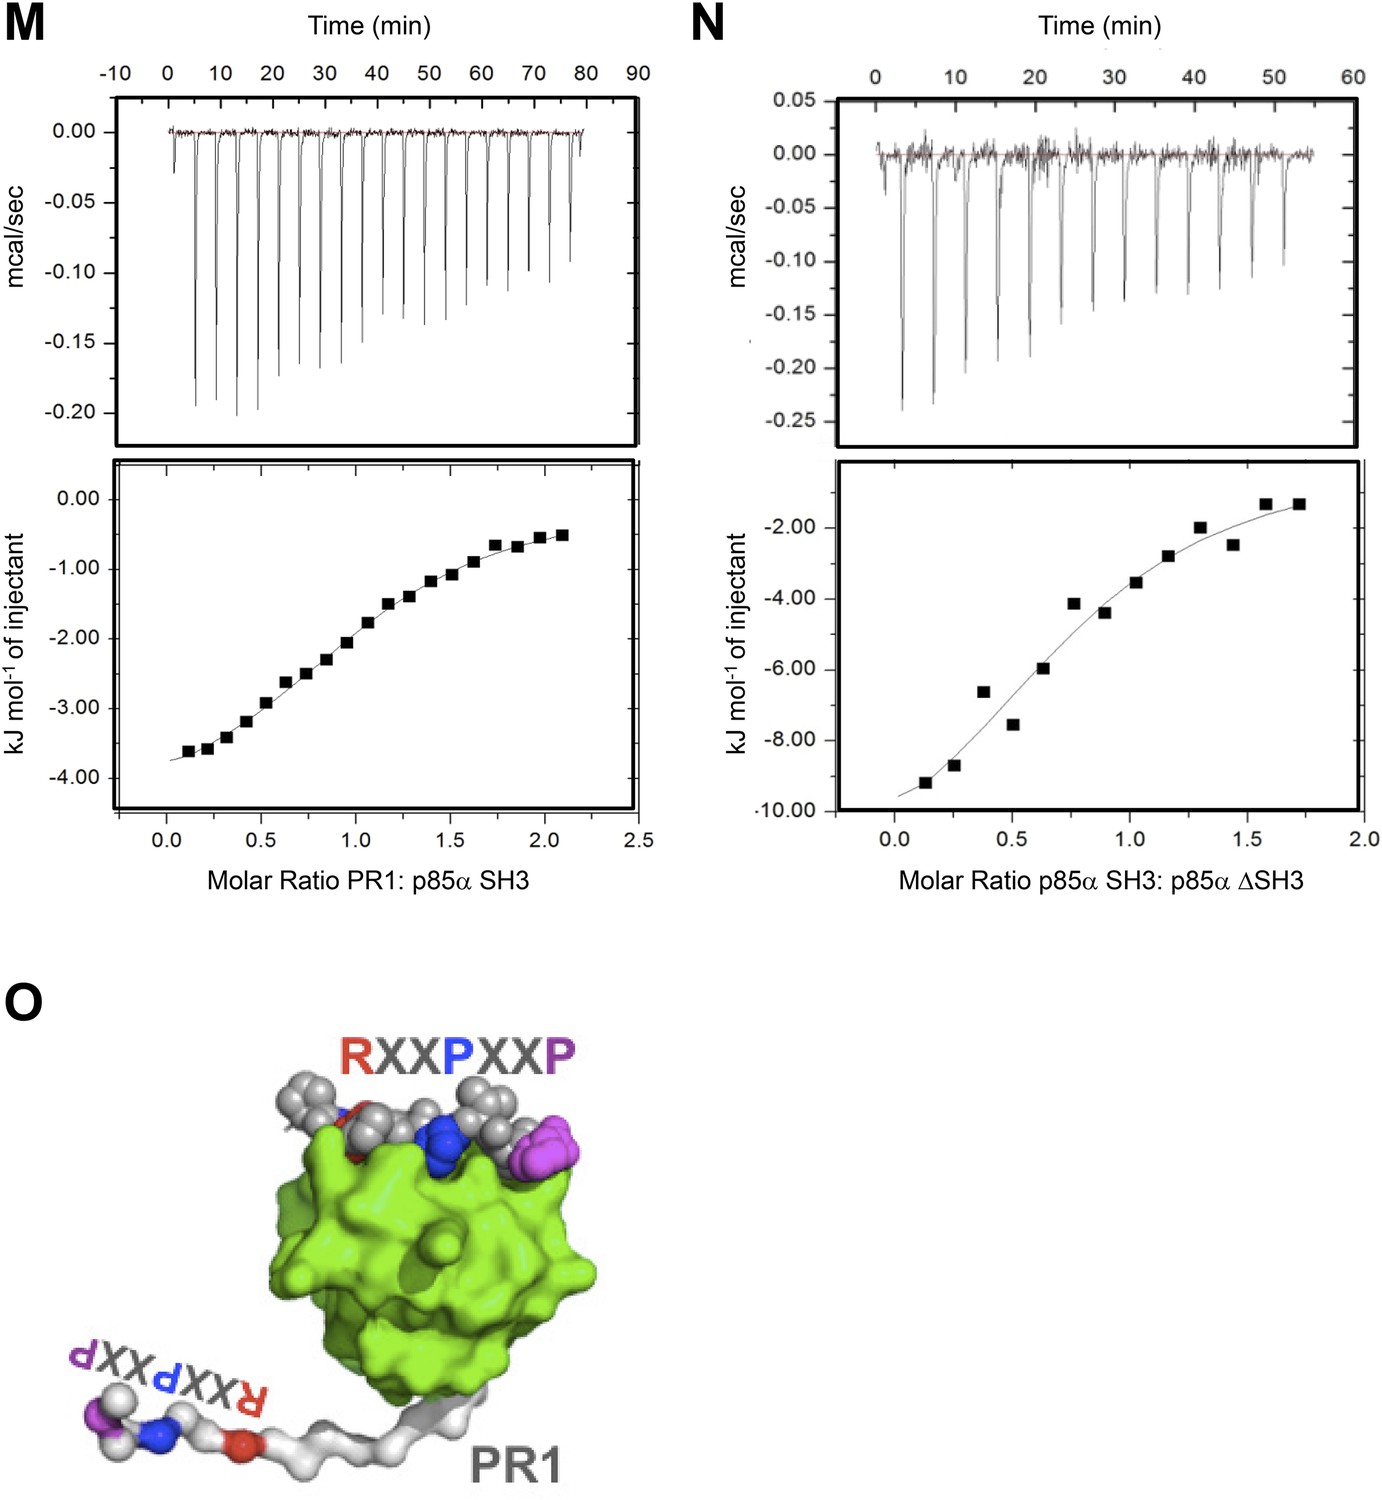
(M–N) Isothermal titration calorimetry (ITC) data on p85α SH3:PR1 and p85αΔSH3 interactions.
Kd = 23.3 ± 6 μM, ΔG = −26.5 kJ/mol, ΔH = −4.9 kJ/mol, TΔS = 21.5 kJ/mol and the stoichiometry N = 1.06 ± 0.3 (M) and Kd = 16.8 ± 4.2 μM ΔG = −27.7 kJ/mol, ΔH = −13.4 kJ/mol, TΔS = 14.4 kJ/mol and the stoichiometry N = 0.8 ± 0.1(N). Measurement errors are less than 10% for ΔH and TΔS, as judged from independent analysis of repeat experiments. The errors are standard deviation. (O) Graphical illustration showing that SH3:PR1 interactions in cis are not possible because the RXXPXXP motif (color-coded) on PR1 (white) is located too close to the SH3 domain C-terminus to be able to reach the RXXPXXP binding site on the same SH3 (green surface). RXXPXXP bound to SH3 is shown as color-coded spheres.
Figure 1—figure supplement 4
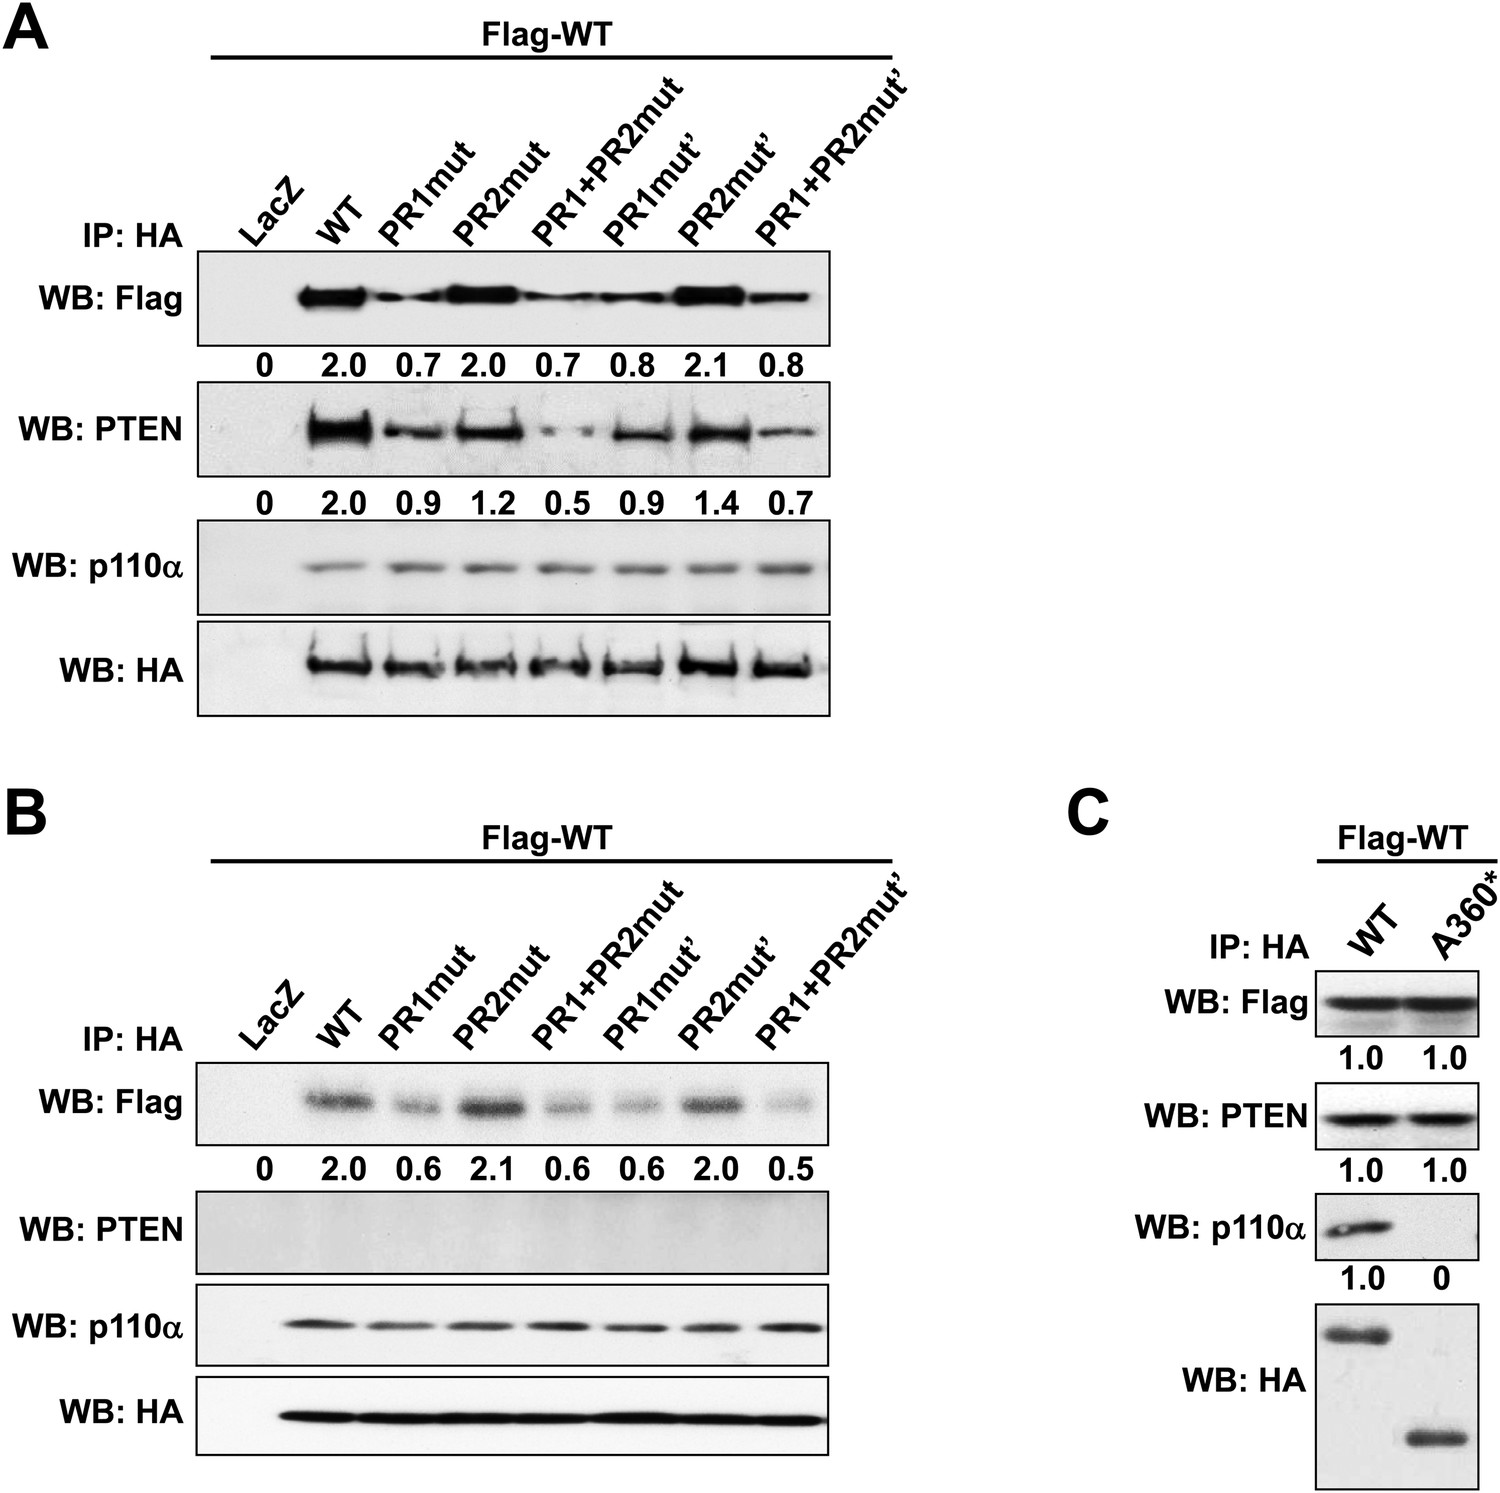
(A, B) p85α knockout mouse embryonic fibroblast (MEF) cells (A) or PTEN knockout MEF cells (B) co-transfected with Flag-tagged WT p85α (Flag-WT) and HA-tagged WT p85α or PR mutants for 72 hr were collected for IP with anti-HA and WB.
(C) KLE cells co-transfected with Flag-WT and HA-tagged WT p85α or truncated mutant A360* were collected for IP with anti-HA and WB. LacZ was used as control. Numerical values below the immunoblots represent quantification of the relative protein levels by densitometry.
Figure 1—figure supplement 5
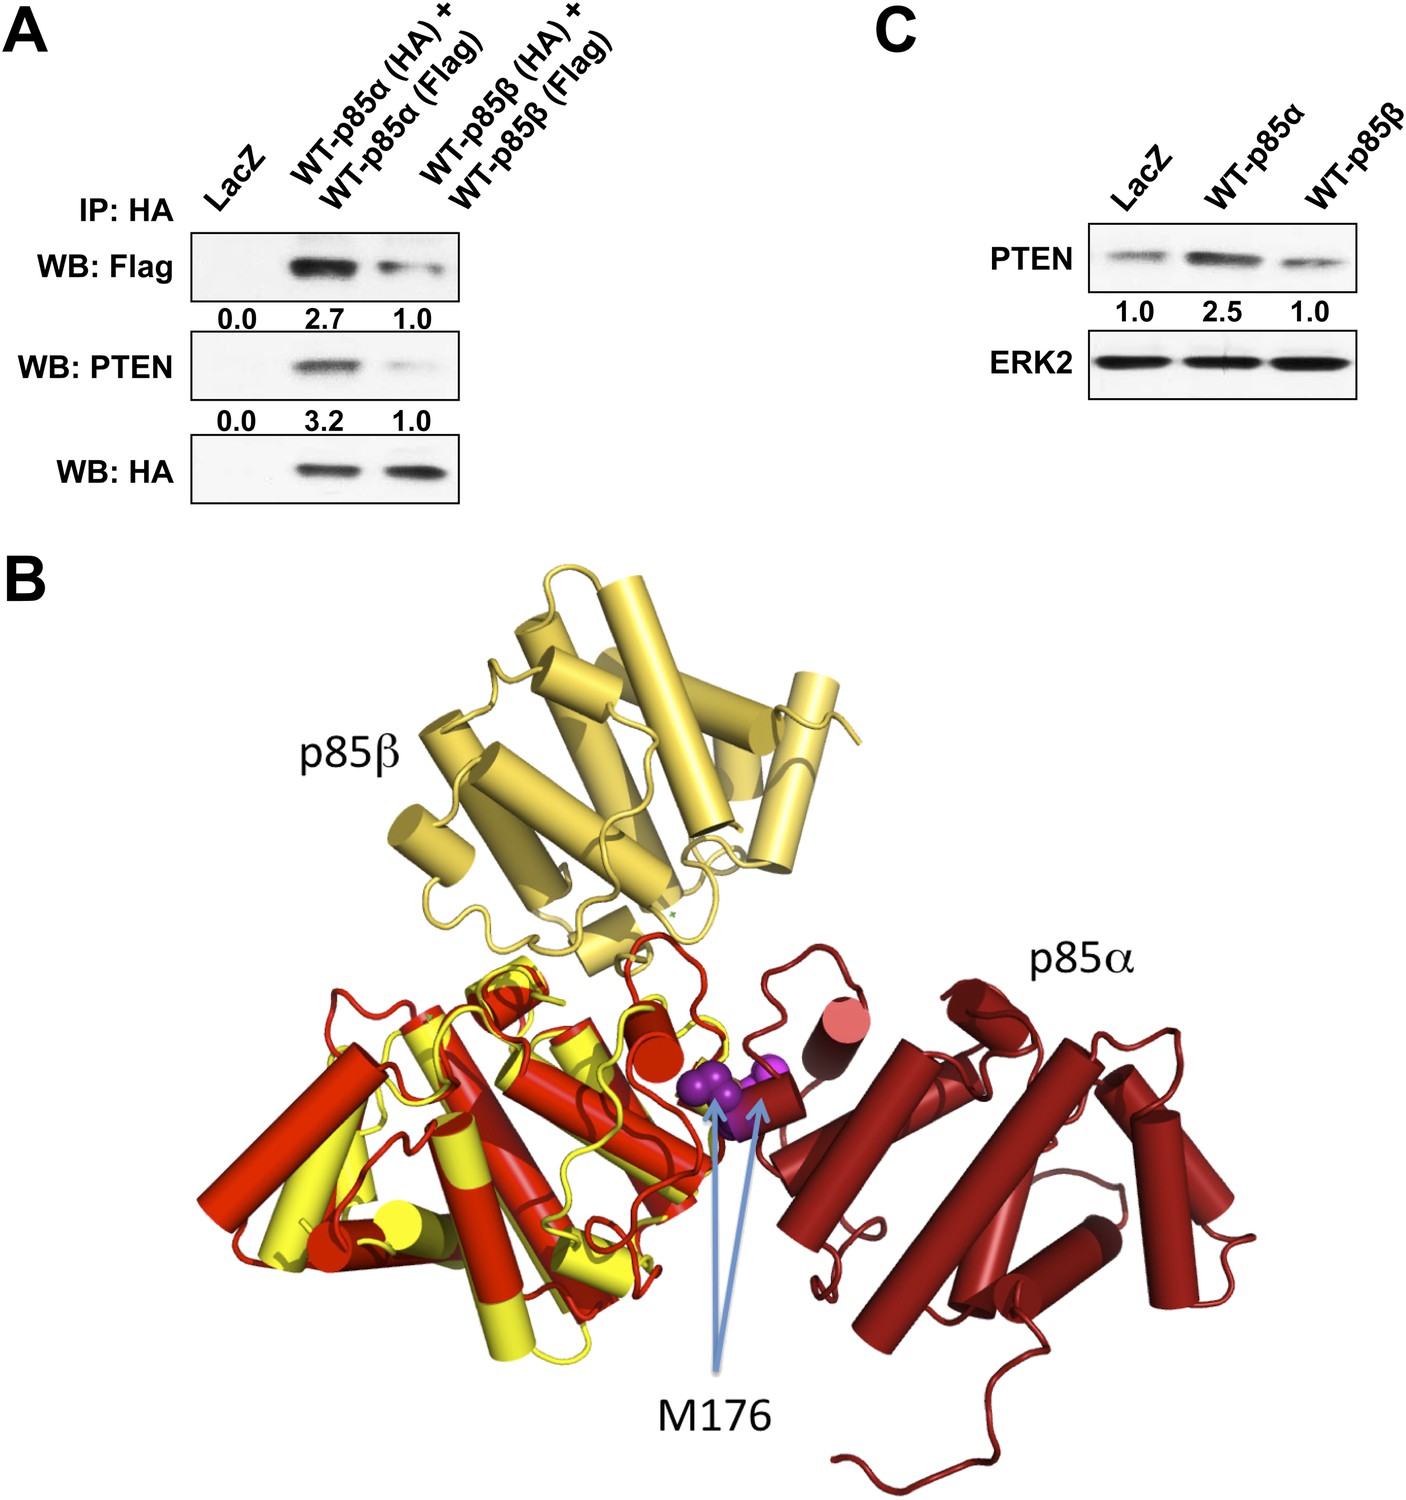
(A) KLE cells co-transfected with HA-tagged WT p85α (or p85β) and Flag-tagged WT p85α (or p85β) for 72 hr were harvested for IP with anti-HA and WB.
(B) The crystallographic BH domain dimers from p85α (PDB id. 1PBW; light and dark red) and p85β (PDB 2XS6; yellow and pale yellow) are superimposed on one of the BH domains. (C) KLE cells transfected with WT p85α or WT p85β for 72 hr were collected for WB. LacZ was used as control.
Figure 2 with 2 supplements
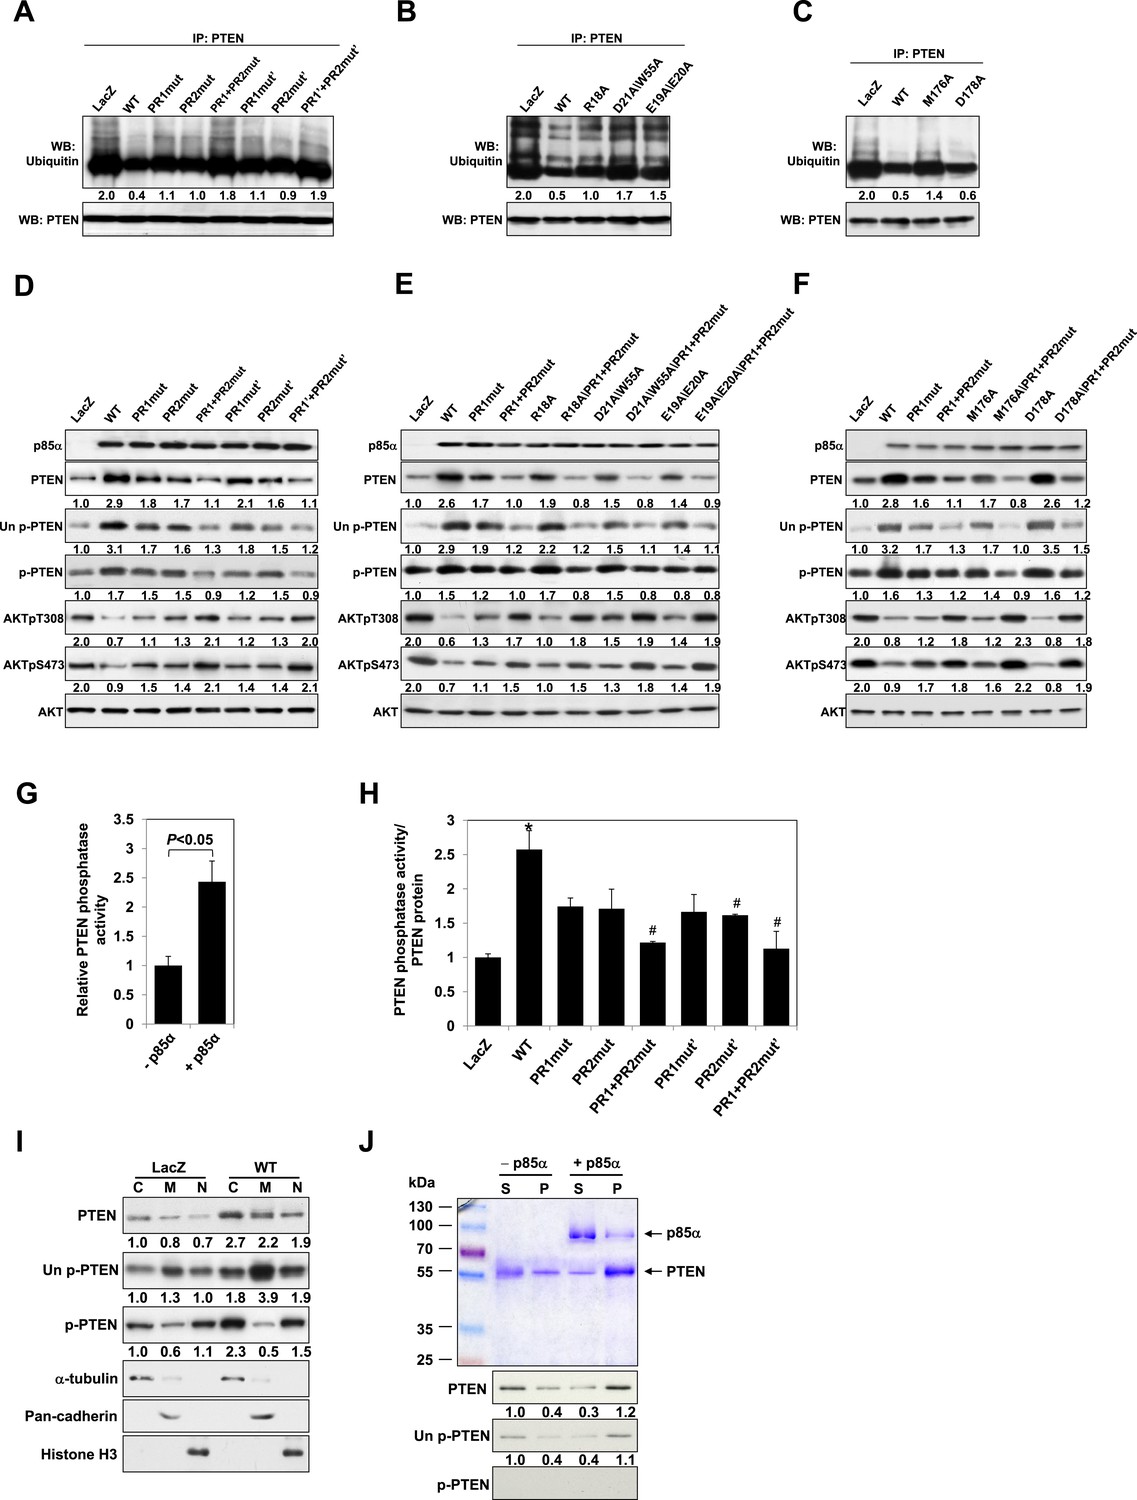
p85α homodimer increases protein stability, lipid phosphatase activity, and membrane association of PTEN.
(A–F) KLE cells transfected with WT p85α or PR1 and PR2 mutants (A, D), SH3 domain mutants (B, E), or BH domain mutants (C, F) for 72 hr were collected for IP with anti-PTEN and WB with anti-ubiquitin (A–C) or directly for WB (D–F). PTEN protein levels were normalized prior to IP by using proportionally different amounts of lysates. (G) In vitro lipid phosphatase activity of recombinant PTEN in the presence or absence of recombinant p85α was determined. (H) Endogenous PTEN proteins were immunoprecipitated indirectly using anti-p85α antibody and phosphatase activity was measured. The activity was normalized to the levels of immunoprecipitated PTEN protein in each sample. (I) Transfected KLE cells were harvested for subcellular fractionation and WB (C, cytosol; M, membrane; N, nuclear). (J) Binding of recombinant PTEN to large multilamellar vesicles in the presence or absence of recombinant p85α was assayed. Pellets (P) and supernatants (S) corresponding to phospholipid-bound fraction and phospholipid-unbound fraction, respectively, were subjected to SDS-PAGE followed by top, Coomassie blue staining or bottom, WB. Numerical values below the immunoblots represent relative protein levels by densitometry. *p < 0.05, compared with LacZ control. #p < 0.05, compared with WT. The error bars represent S.D. of triplicates from two independent experiments.
Figure 2—figure supplement 1
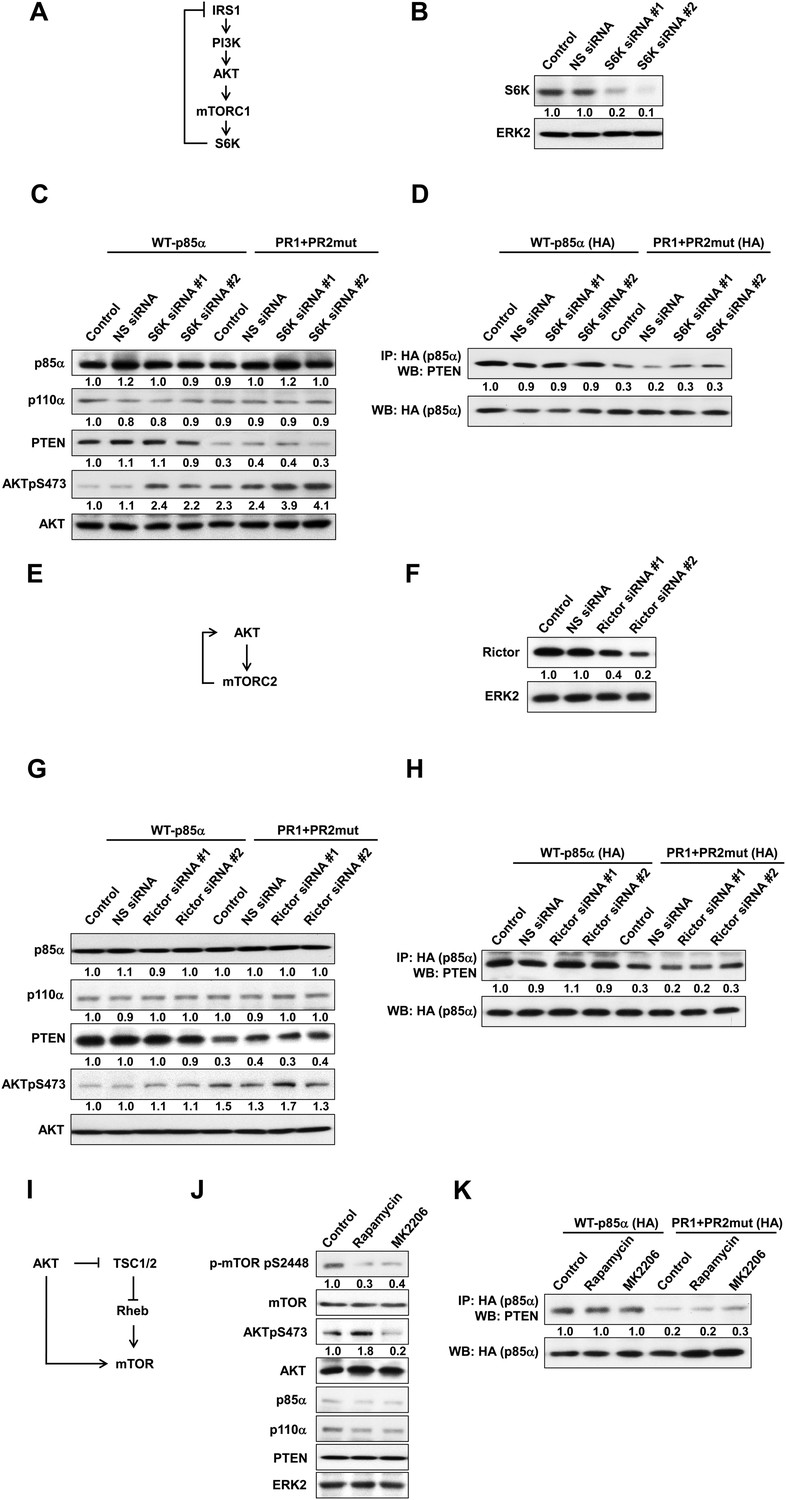
(A) Negative feedback of the phosphatidylinositol 3-kinase (PI3K) pathway mediated by S6K.
(B) The efficiency of siRNAs targeting S6K was confirmed by WB. Non-specific (NS) siRNA was used as control. (C, D) KLE cells co-transfected with WT p85α or PR1+PR2mut and 10 nM siRNA targeting S6K or NS control for 72 hr were harvested for WB directly (C) or IP with anti-HA and WB (D). (E) Positive feedback of the PI3K pathway mediated by mTORC2 to AKT. (F) The efficiency of siRNAs targeting Rictor was confirmed by WB. (G, H) Cells co-transfected with WT p85α or PR1+PR2mut and 10 nM siRNA targeting Rictor or NS control for 72 hr were harvested for WB directly (G) or IP with anti-HA (H). (I) Feedforward activation of mTOR by AKT. (J) Cells were treated with rapamycin (500 nM) or AKT inhibitor (MK2206; 1 μM) for 48 hr and were harvested for WB. DMSO was used as vehicle control. (K) Cells transfected with WT p85α or PR1+PR2mut were treated with rapamycin or MK2206 for 48 hr before being harvested for IP with anti-HA.
Figure 2—figure supplement 2
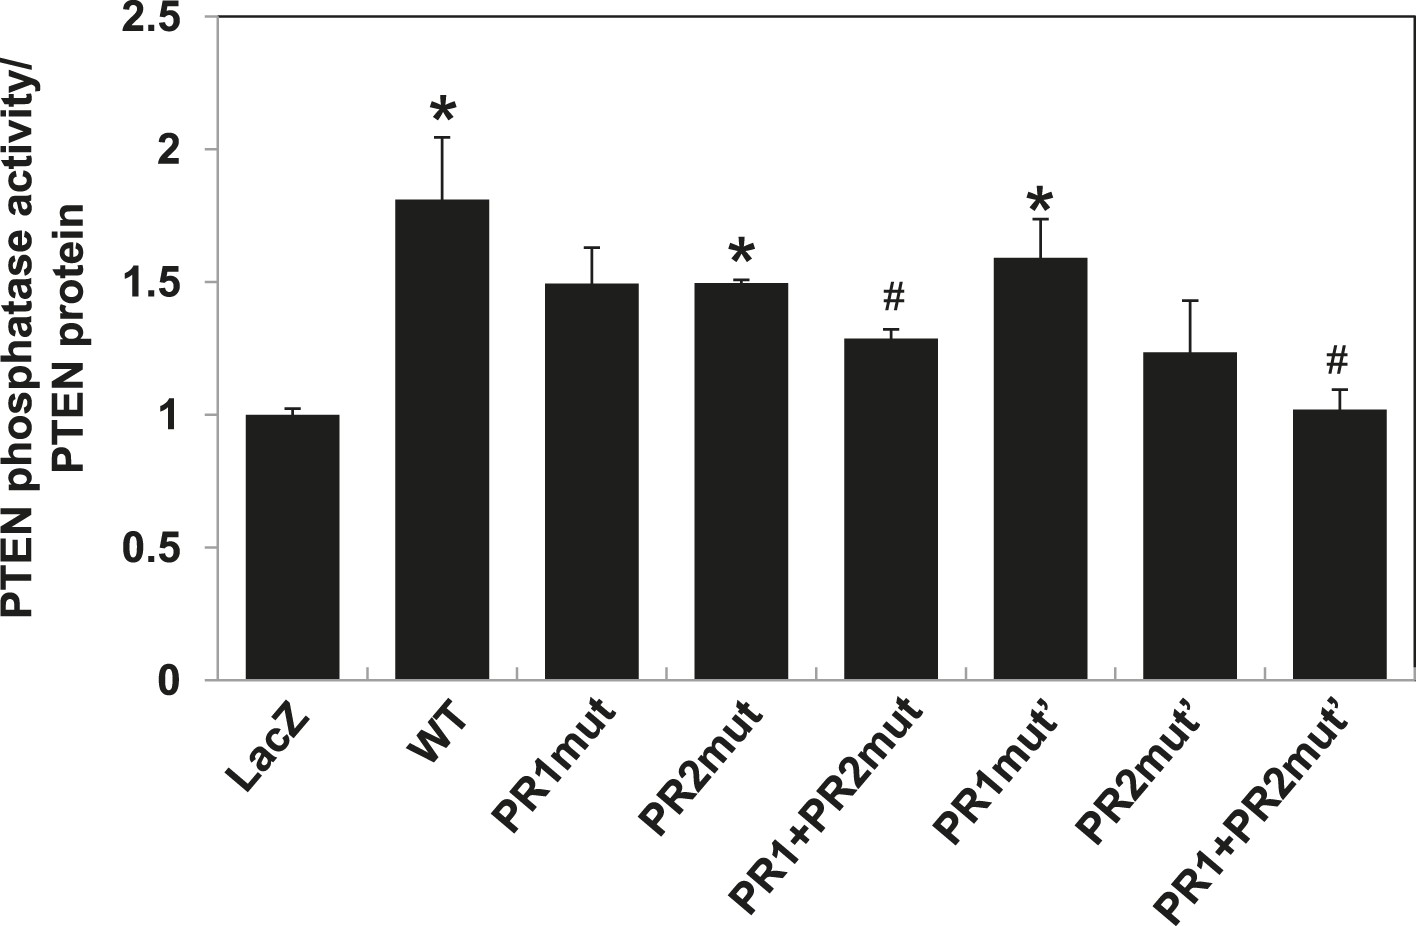
PTEN in vitro lipid phosphatase activity was determined using a malachite green phosphatase assay with soluble PIP3 as the substrate.
Endogenous PTEN proteins were immunoprecipitated in lysates using anti-PTEN antibody extracted from transfected cells and phosphatase activity was measured in triplicate. The activity was normalized to the levels of immunoprecipitated PTEN protein in each sample. *p < 0.05, compared with LacZ control. #p < 0.05, compared with WT. The error bars represent S.D. of triplicates from two independent experiments.
Figure 3 with 2 supplements
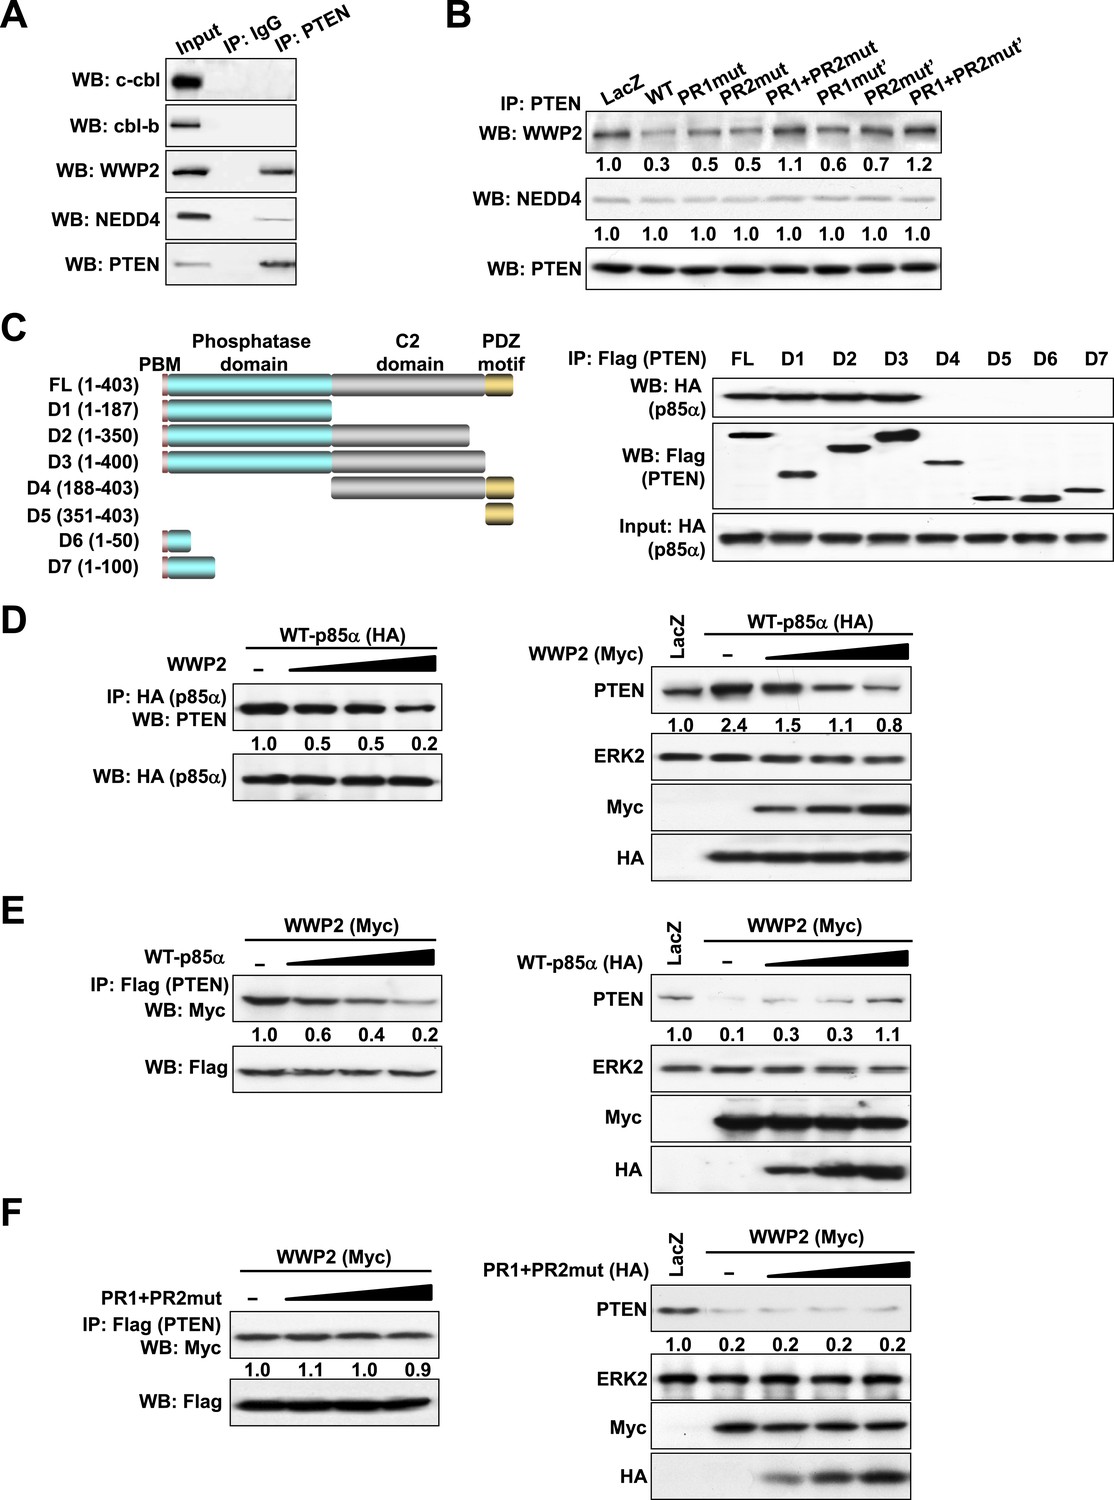
p85α homodimer competes with E3 ligase WWP2 for PTEN binding.
(A) KLE cells were harvested for IP with anti-PTEN and WB. Normal IgG was used as a negative control. (B) Cells transfected with WT p85α or PR mutants were harvested for IP after 72 hr. (C) Cells were co-transfected with p85α and full-length PTEN (FL) or deletion mutants (Left). PTEN proteins were immunoprecipitated by anti-Flag antibody and the immunoprecipitate was analyzed by WB (Right). (D) Cells transfected with HA-tagged p85α in the absence or presence of an increasing amount of WWP2 were collected for IP with HA (Left) or WB (Right). (E, F) Cells transfected with Myc-tagged WWP2 in the absence or presence of an increasing amount of WT p85α (E) or PR mutant (F) were collected for IP with Flag for PTEN (Left) or WB (Right). LacZ was used as control. Numerical values below each lane of the immunoblots represent quantification of the relative protein levels by densitometry. PBM, phosphoinositide-binding motif.
Figure 3—figure supplement 1
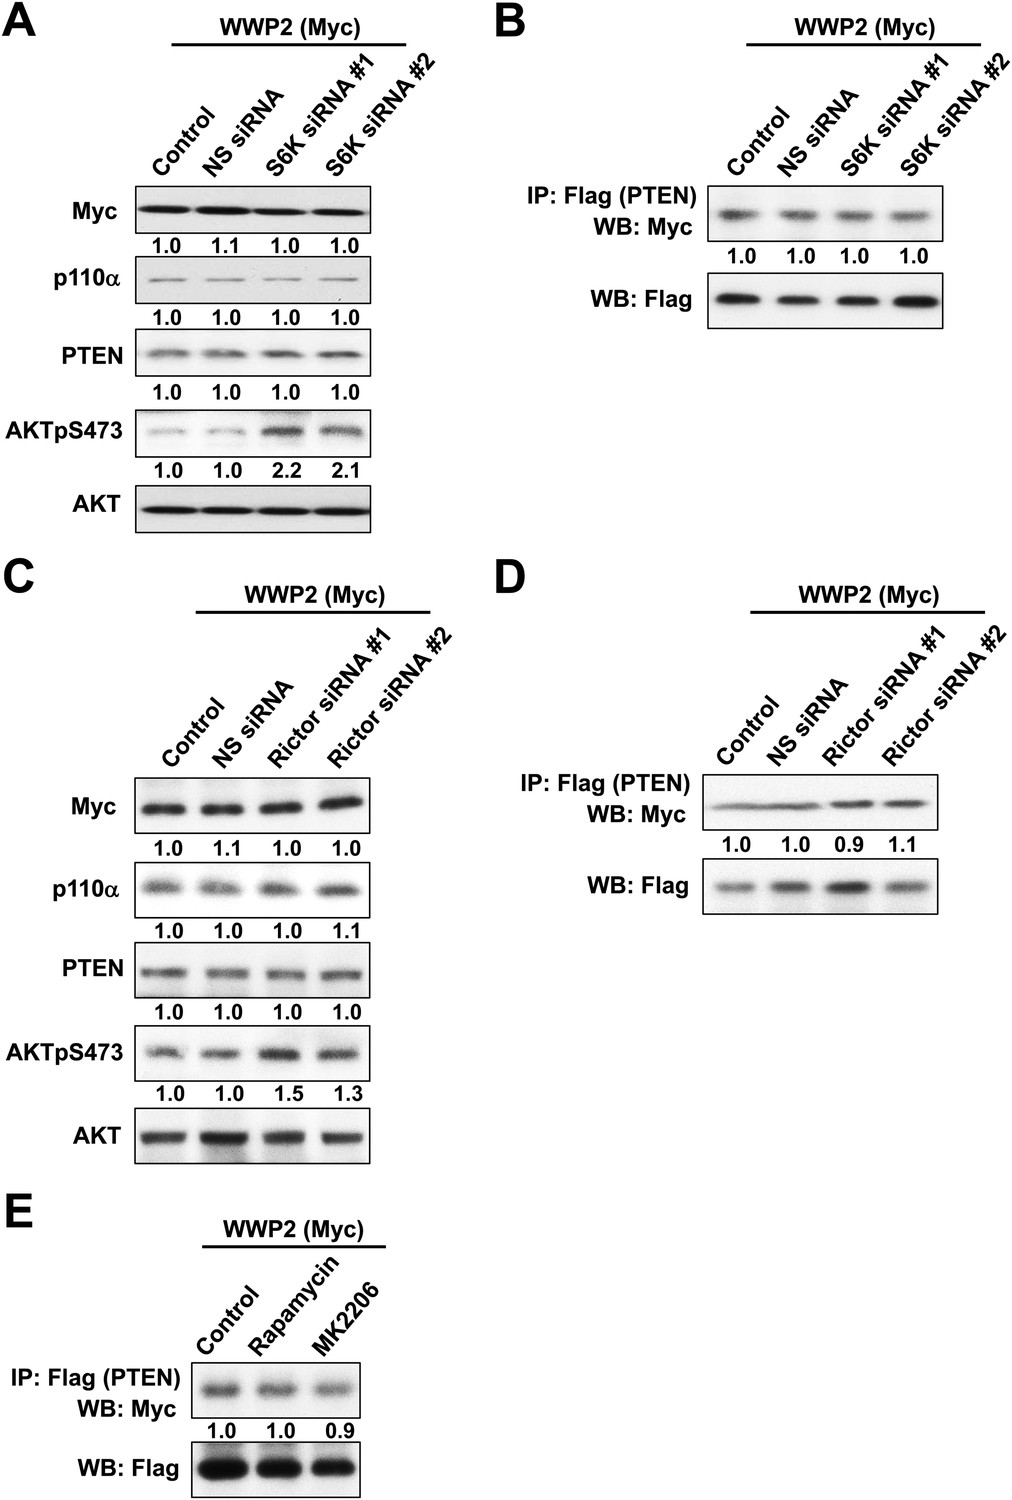
(A, B) KLE cells co-transfected with WWP2 and 10 nM siRNA targeting S6K or NS control for 72 hr were harvested for WB directly (A) or IP with anti-Flag and WB (B).
(C, D) Cells co-transfected with WWP2 and 10 nM siRNA targeting Rictor or NS control for 72 hr were harvested for WB (C) or IP with anti-Flag (D). (E) Cells transfected with WWP2 were treated with rapamycin (500 nM) or MK2206 (1 μM) for 48 hr before being harvested for IP with anti-Flag.
Figure 3—figure supplement 2
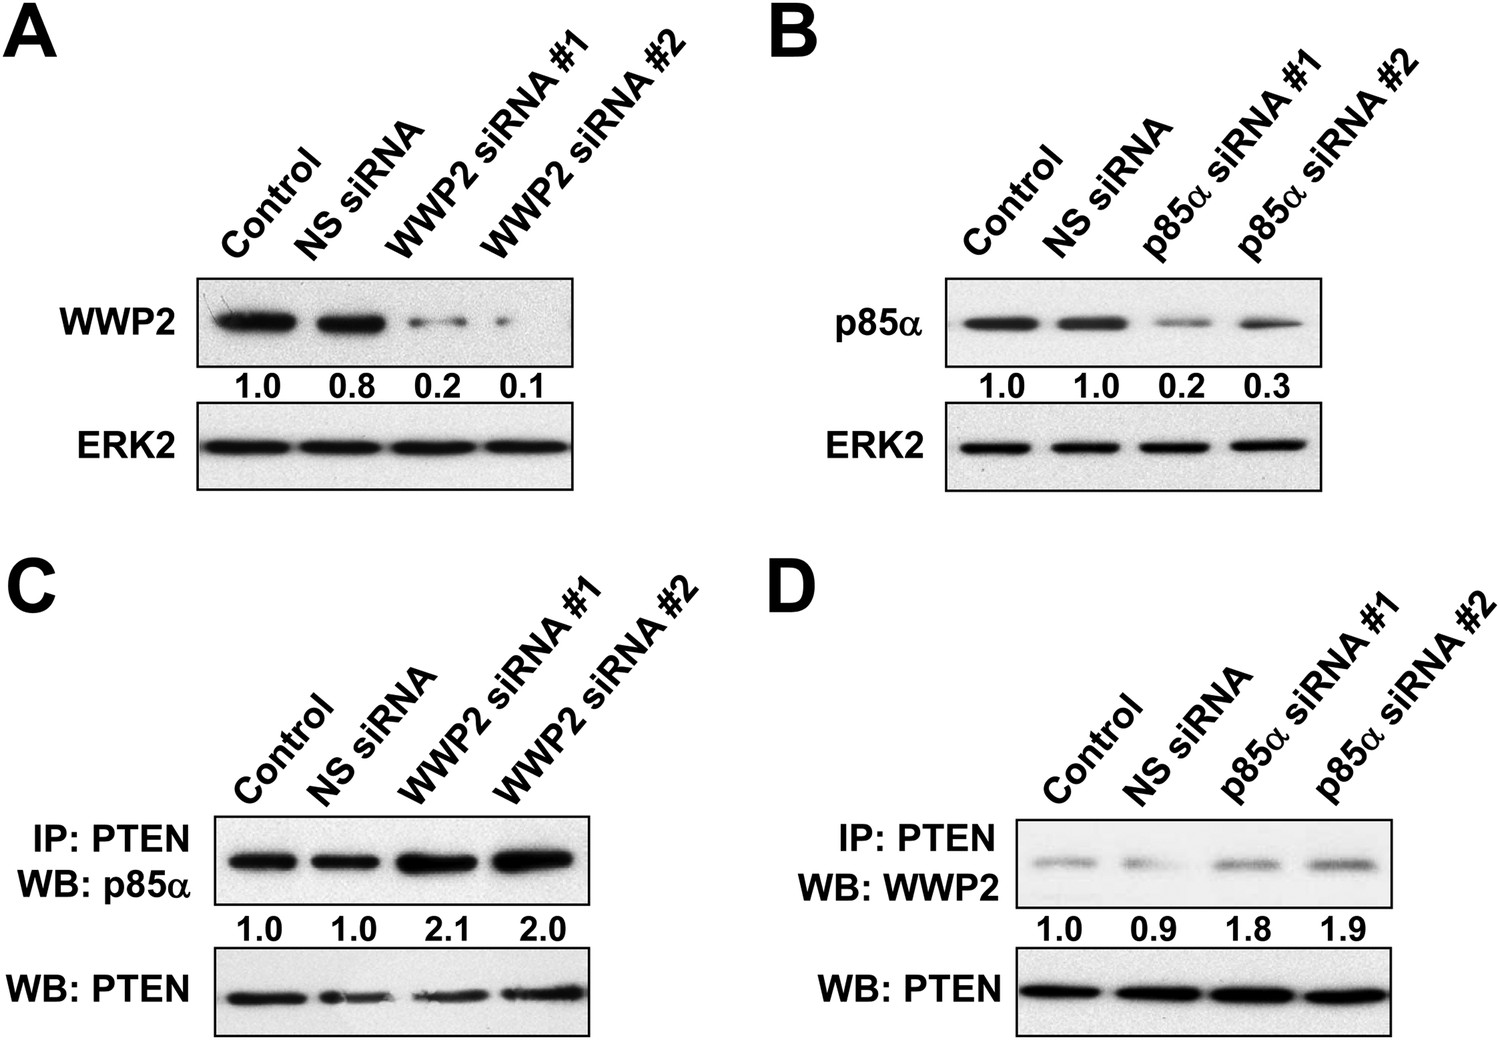
(A, B) HEC1A cells were transfected with 10 nM siRNA targeting WWP2 (A) or p85α (B) for 72 hr.
The efficiency of the siRNAs was confirmed by WB. NS siRNA was used as control. (C, D) Cells transfected with 10 nM siRNA targeting WWP2 (C) or p85α (D) or NS control for 72 hr were harvested for IP with anti-PTEN and WB.
Figure 4 with 1 supplement
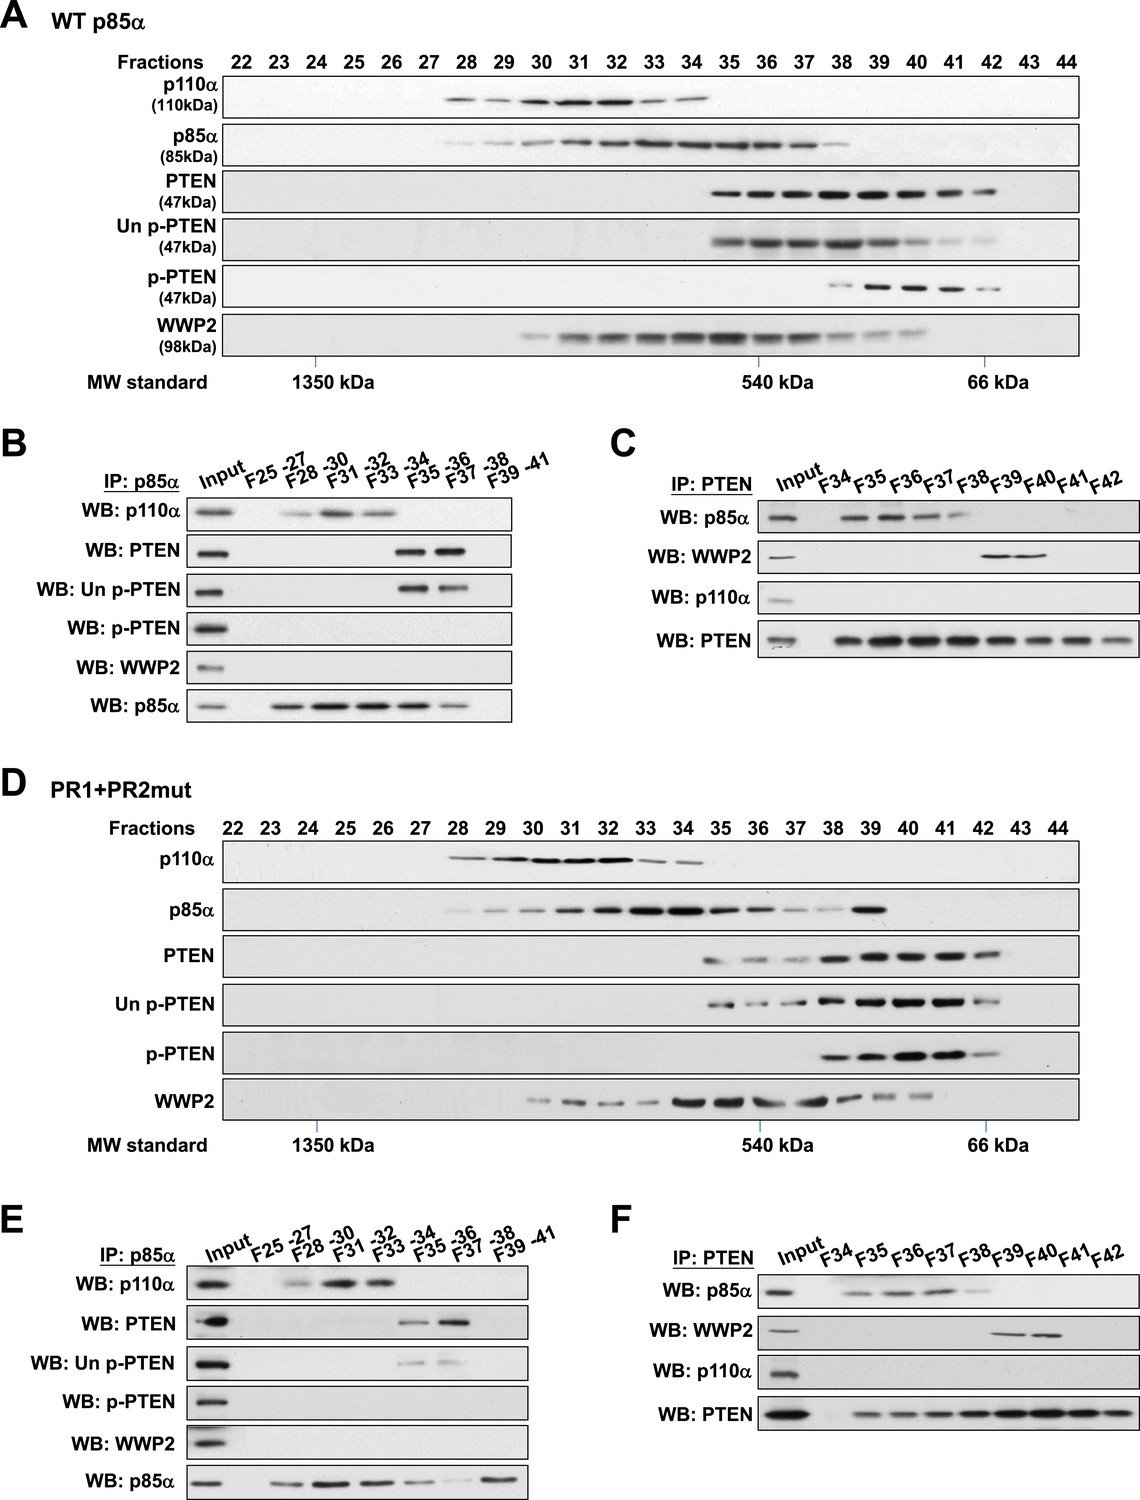
Binding of PTEN to WWP2 and to p85α homodimer is mutually exclusive.
(A–F) Cell lysates from KLE cells transfected with WT p85α (A–C) or combined PR1 and PR2 mutant (PR1+PR2) (D–F) were fractionated using a gel filtration column and the indicated fractions were analyzed by WB (A, D) or pooled for IP with anti-p85α antibody (B, E) or anti-PTEN antibody (C, F). Input, total lysates before being subjected to gel filtration; F, fraction; MW, molecular weight.
Figure 4—figure supplement 1
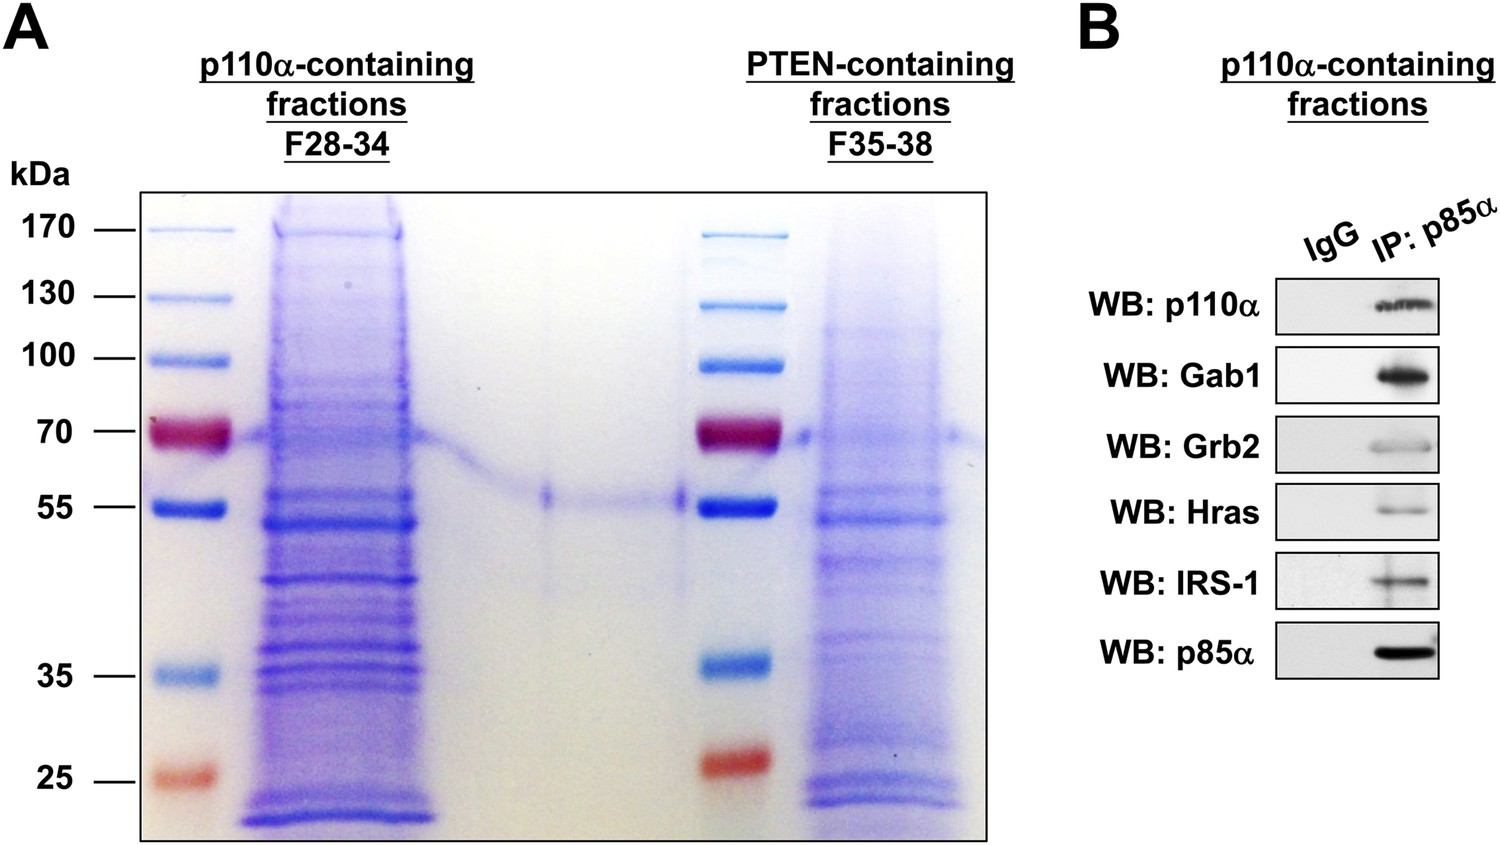
(A-B) KLE cells were transfected with WT p85α for 72 hr.
Whole cell lysates were then fractionated using a gel filtration column and the indicated fractions were pooled for IP with anti-p85α antibody. The immunocomplexes were subjected to SDS-PAGE followed by Coomassie Blue staining (A) or WB (B) with indicated antibodies. F, fraction.
Figure 5 with 1 supplement
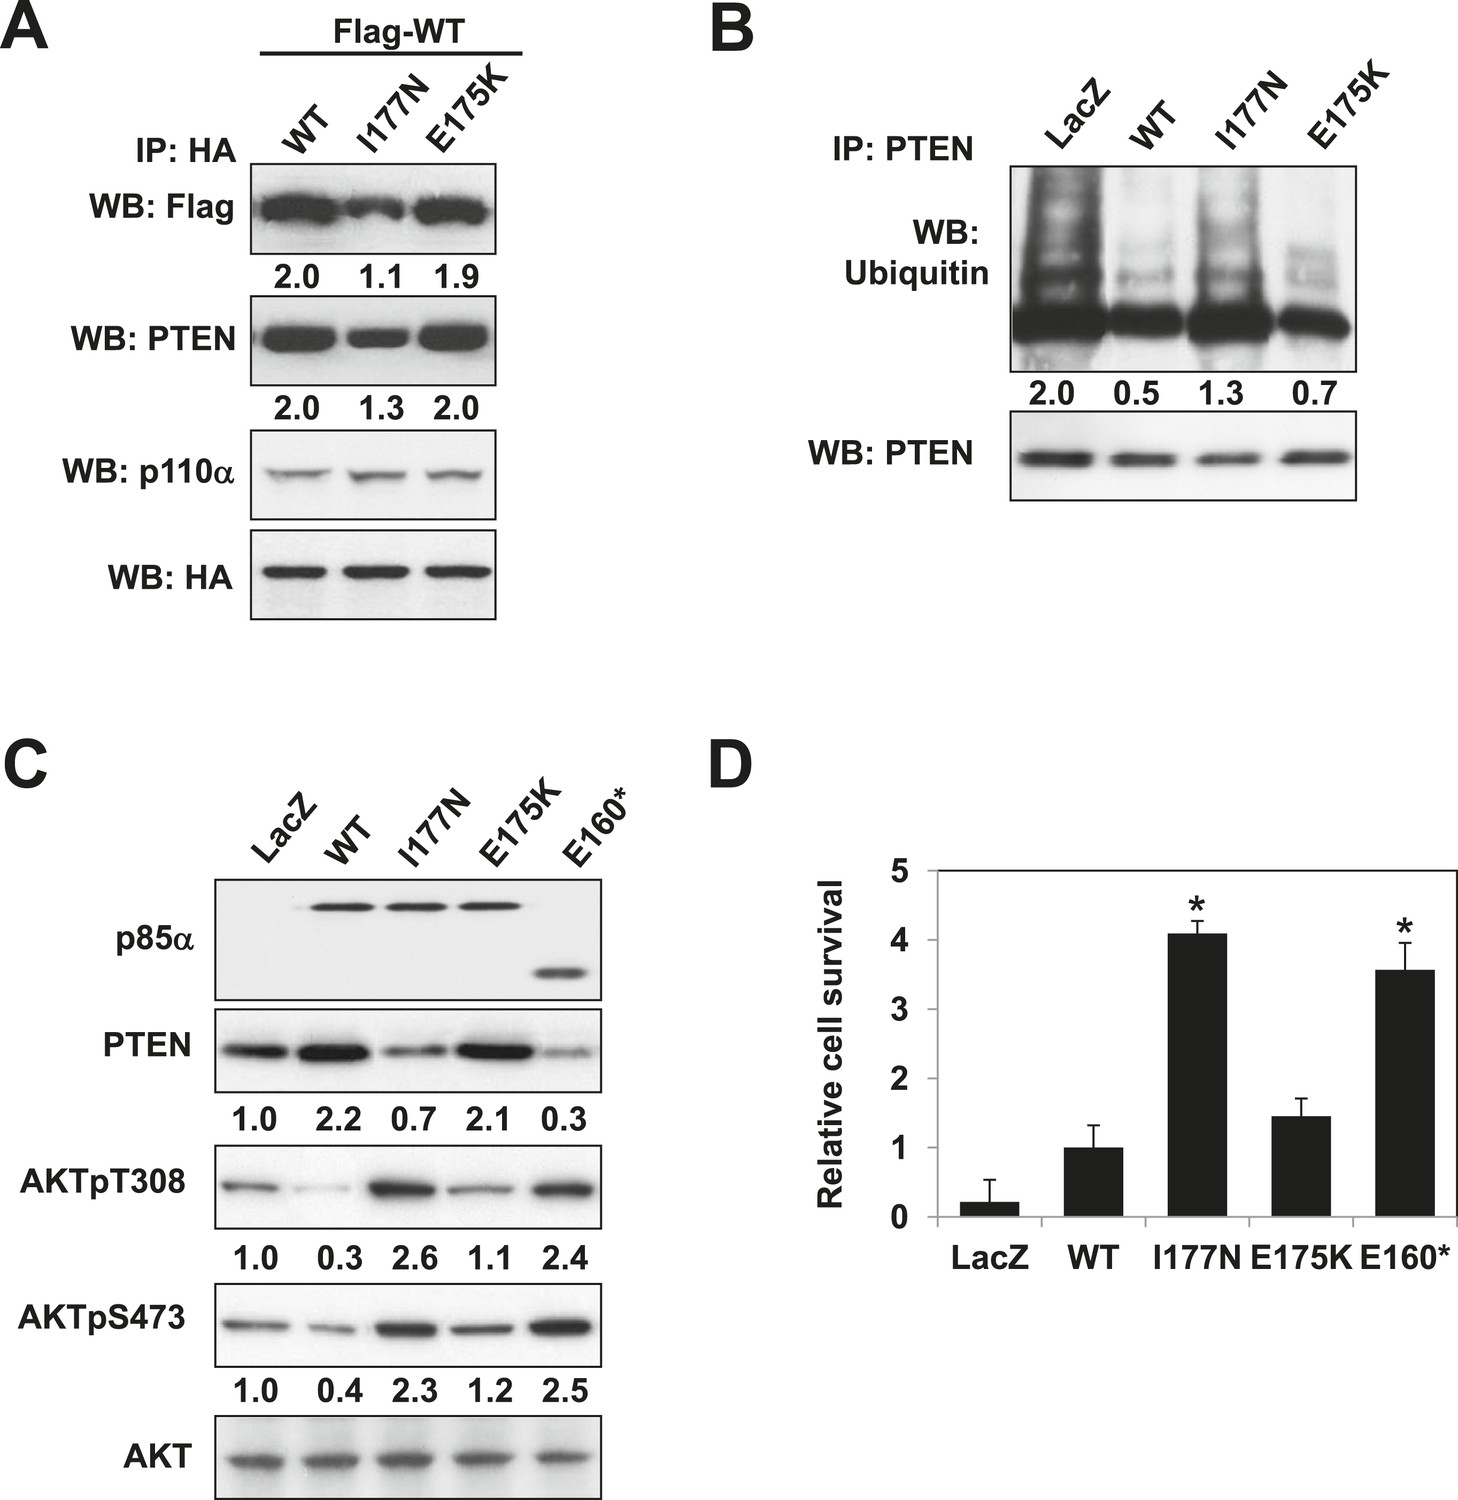
Oncogenic cancer patient-derived PIK3R1 mutation perturbs p85α homodimerization leading to PI3K pathway activation.
(A) KLE cells co-transfected with Flag-tagged WT p85α (Flag-WT) and HA-tagged WT p85α or patient-derived p85α BH domain mutants were collected for IP with anti-HA and WB. (B, C) Cells transfected with WT p85α or mutants were collected for IP with anti-PTEN and WB with anti-ubiquitin (B) or directly for WB (C). PTEN protein levels were normalized prior to IP by using proportionally different amounts of lysates. Numerical values below each lane of the immunoblots represent quantification of the relative protein levels by densitometry. (D) Ba/F3 cells transfected with WT p85α or mutants were cultured without interleukin-3 for 4 weeks and harvested for viability assays. *p < 0.05, compared with WT. The error bars represent S.D. of triplicates from three independent experiments.
Figure 5—figure supplement 1
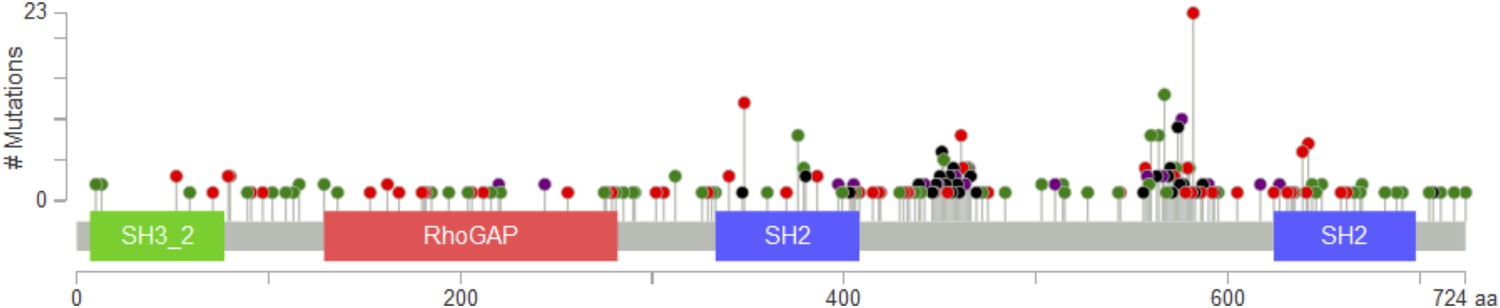
PIK3R1 mutations from The Cancer Genome Atlas (TCGA) data sets across tumor lineages are represented by lollipops (green, missense; red, nonsense, frameshift, or splice; black, in-frame deletion/insertion; purple, different types of mutations at the same site).
The diagram was adopted from the cBioPortal (http://www.cbioportal.org/public-portal/).
Figure 6 with 1 supplement
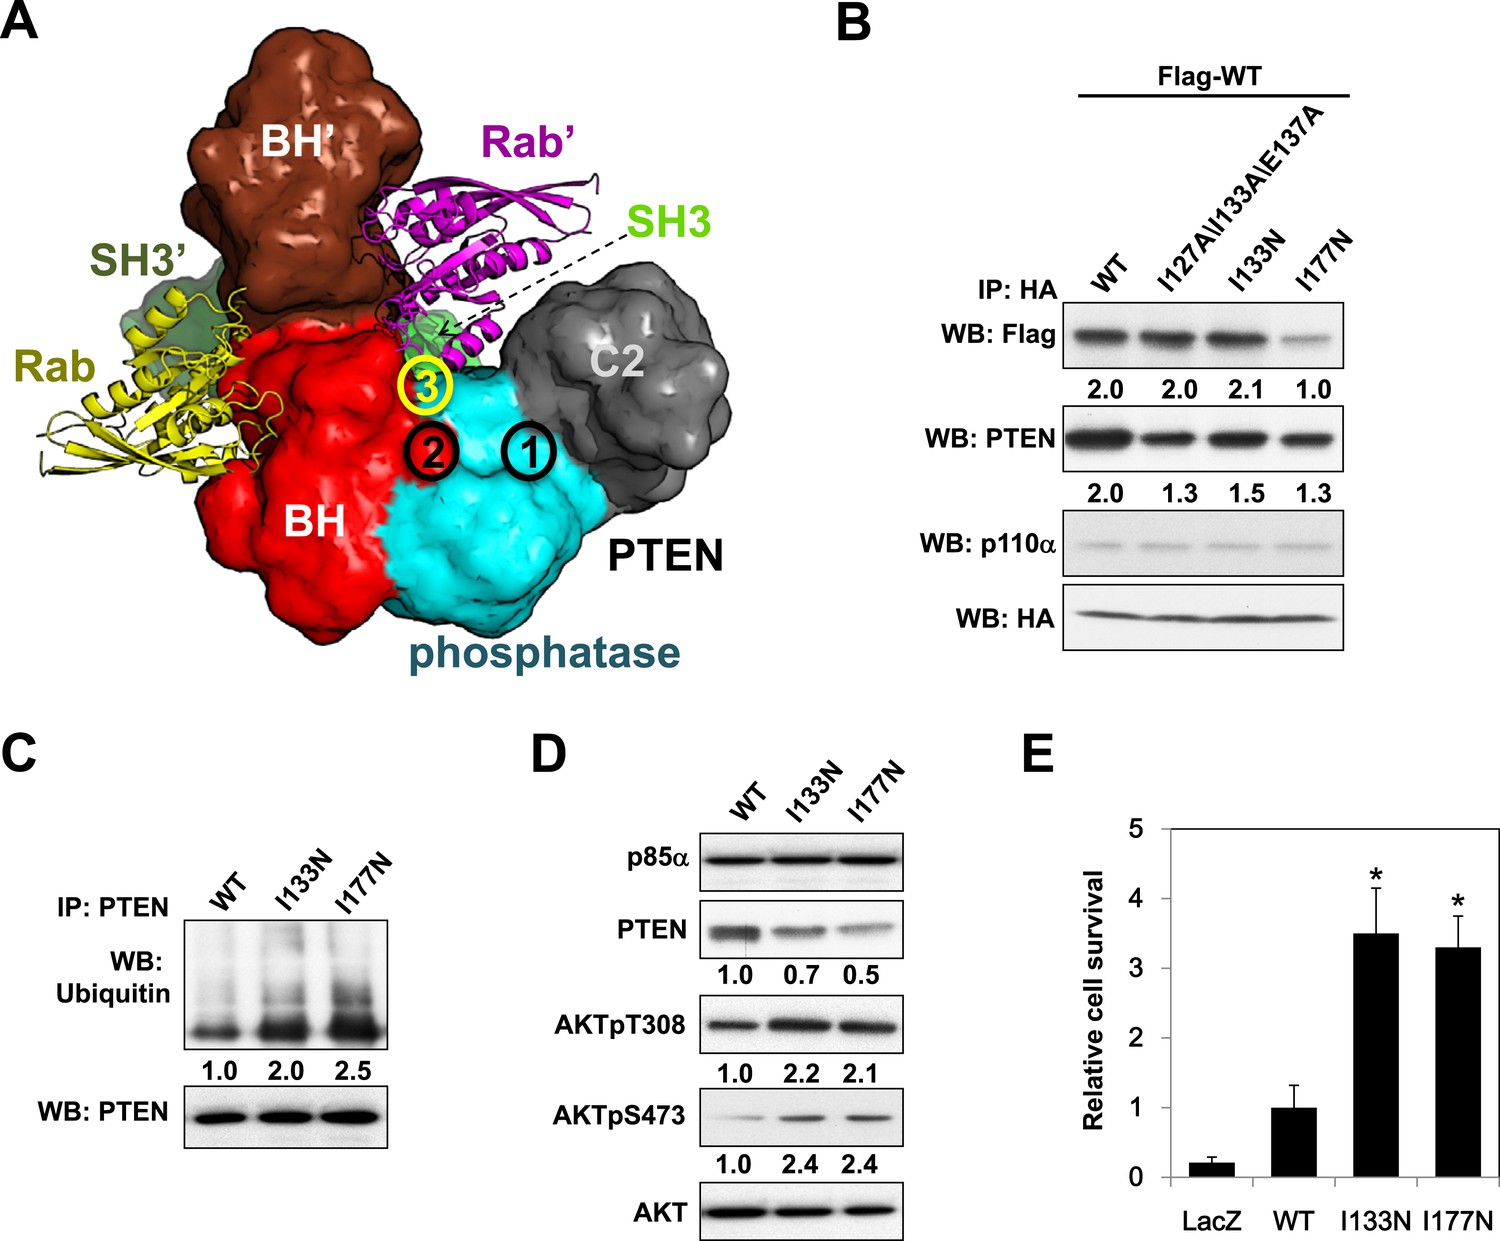
Molecular model of the p85α homodimer:PTEN complex reveals cancer patient-derived p85α mutant with decreased PTEN binding.
(A) Schematic theoretical molecular working model of the homodimerized p85α:PTEN. This speculative model has been constructed by integrating experimental data, physical constraints, and computational scoring functions (see Appendix 1 for details). For simplicity, only one PTEN molecule is shown. The PTEN molecular structure is taken from PDB 1D5R (Lee et al., 1999). The model orientation corresponds to the view from the membrane toward the cytosol. Encircled numbers indicate locations of: 1, PTEN phosphatase active site; 2, the side chain of p85α W298, located at the start of the flexible PR2 sequence; 3, approximate position of the PTEN K13 and of the p85α triple mutation I127/I133/E137. (B) KLE cells co-transfected with Flag-tagged WT p85α (Flag-WT) and HA-tagged WT p85α or mutants were collected for IP and WB. (C) Cells transfected with WT p85α or mutants were harvested for IP and WB. PTEN protein levels were normalized prior to IP by using proportionally different amounts of lysates. (D) Cells transfected with WT p85α or mutants were harvested for WB. Numerical values below the immunoblots represent relative protein levels by densitometry. (E) Ba/F3 cells transfected with WT p85α or mutants were cultured without interleukin-3 for 4 weeks and harvested for viability assays. *p < 0.05, compared with WT. The error bars represent S.D. of triplicates from three independent experiments.
Figure 6—figure supplement 1
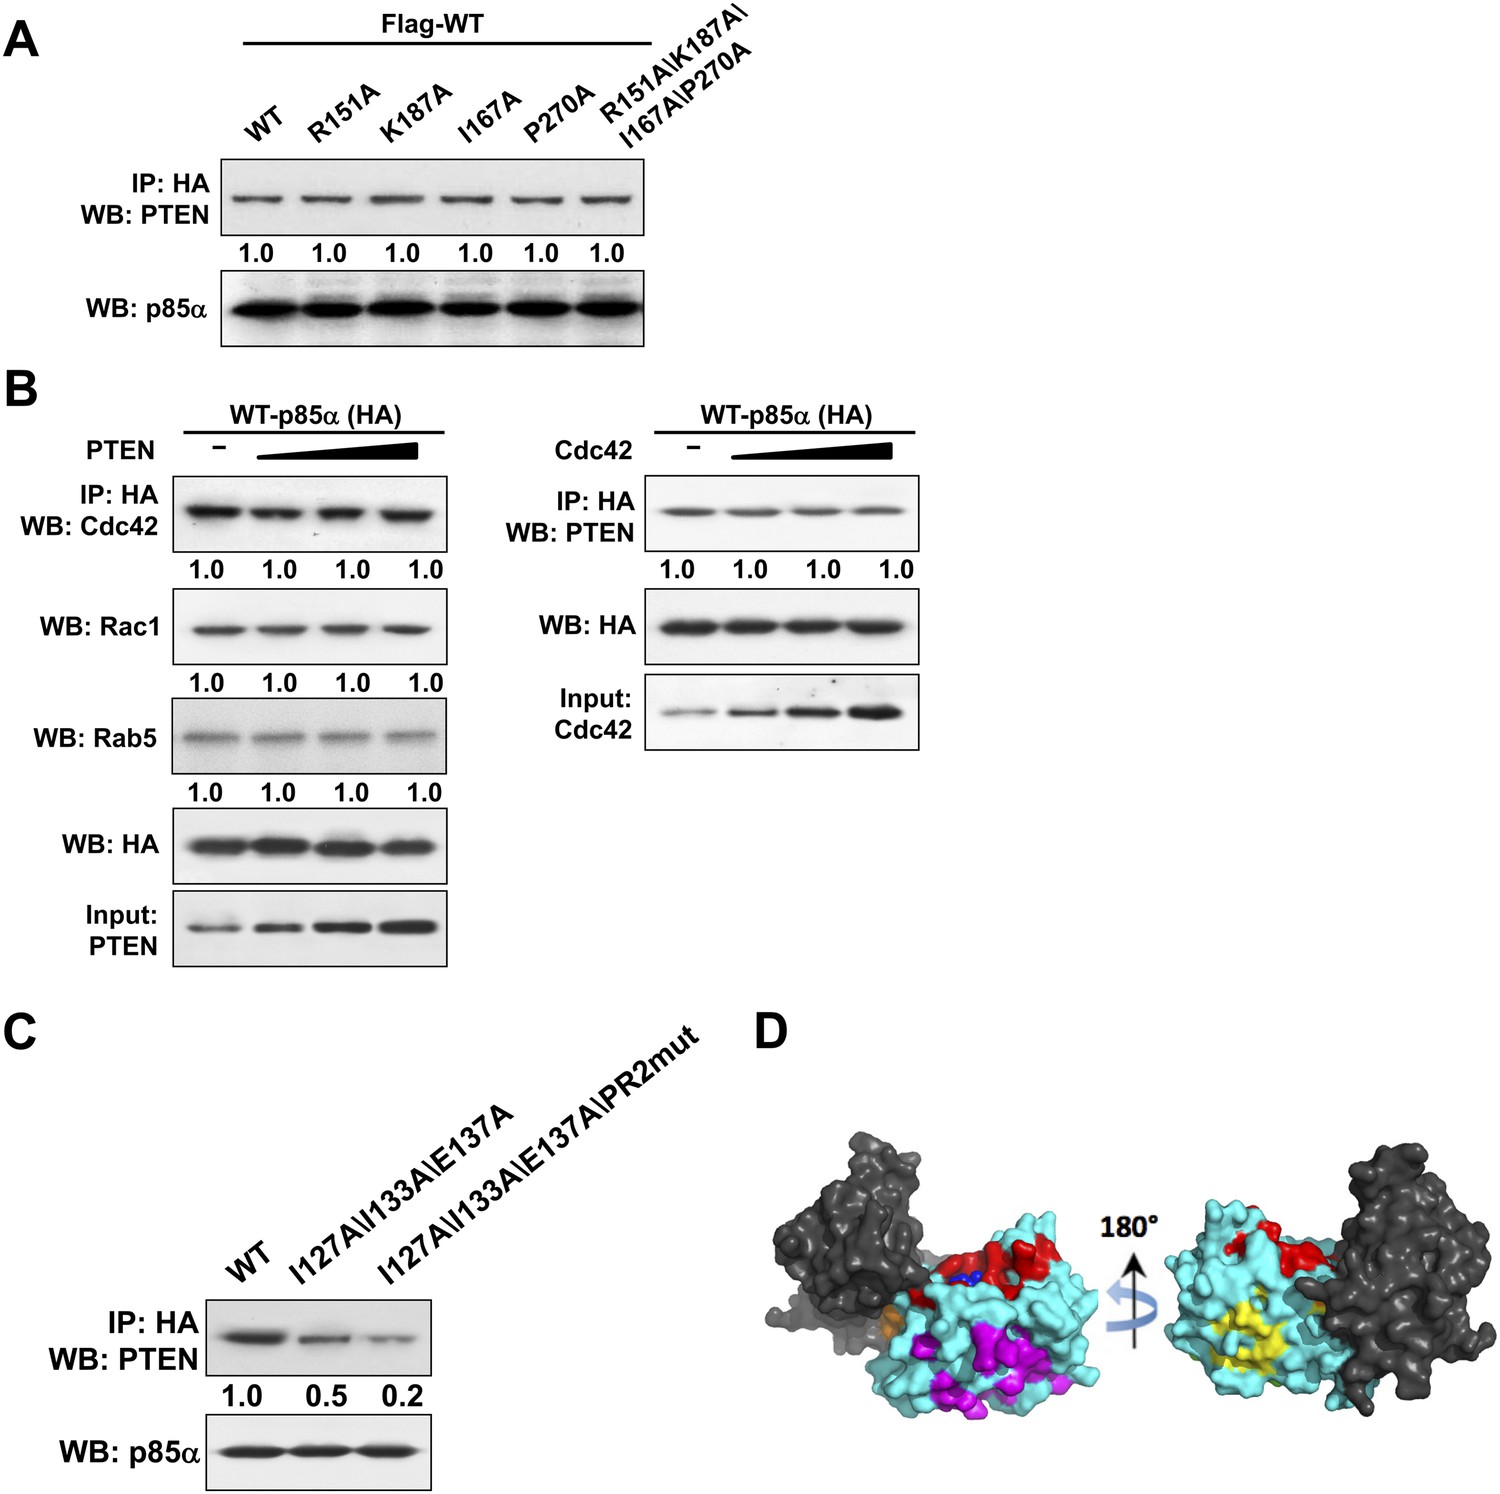
(A) KLE cells co-transfected with Flag-tagged WT p85α (Flag-WT) and HA-tagged WT p85α or mutants were harvested for IP with anti-HA and then subjected to WB.
The mutated amino acids are highly conserved residues potentially for small GTPase binding. (B) Cells were co-transfected with HA-tagged p85α in the absence or presence of increasing amounts of PTEN (Left) or Cdc42 (Right). The lysates were collected for IP with anti-HA antibody. (C) Cells transfected with HA-tagged WT p85α or mutants were harvested for IP with anti-HA and WB. Numerical values below the immunoblots represent quantification of the relative protein levels by densitometry. (D) 62 patient-derived PTEN phosphatase domain missense mutations from our in-house endometrial cancer data set and TCGA were mapped onto the surface of PTEN. These mutations form three clusters. Red: mutations in the active site and membrane anchoring regions (27 mutations out of 62); magenta: mutations of the predicted p85α binding site (19/62); orange: mutations of the phosphatase-C2 interface (5/62); yellow: mutations of a site with unknown function (11/62). Blue spheres represent a bound L(+)-tartrate molecule found in the PTEN crystal structure (1D5R), which is thought to mimic interactions of PTEN with substrate phosphates.
Figure 7
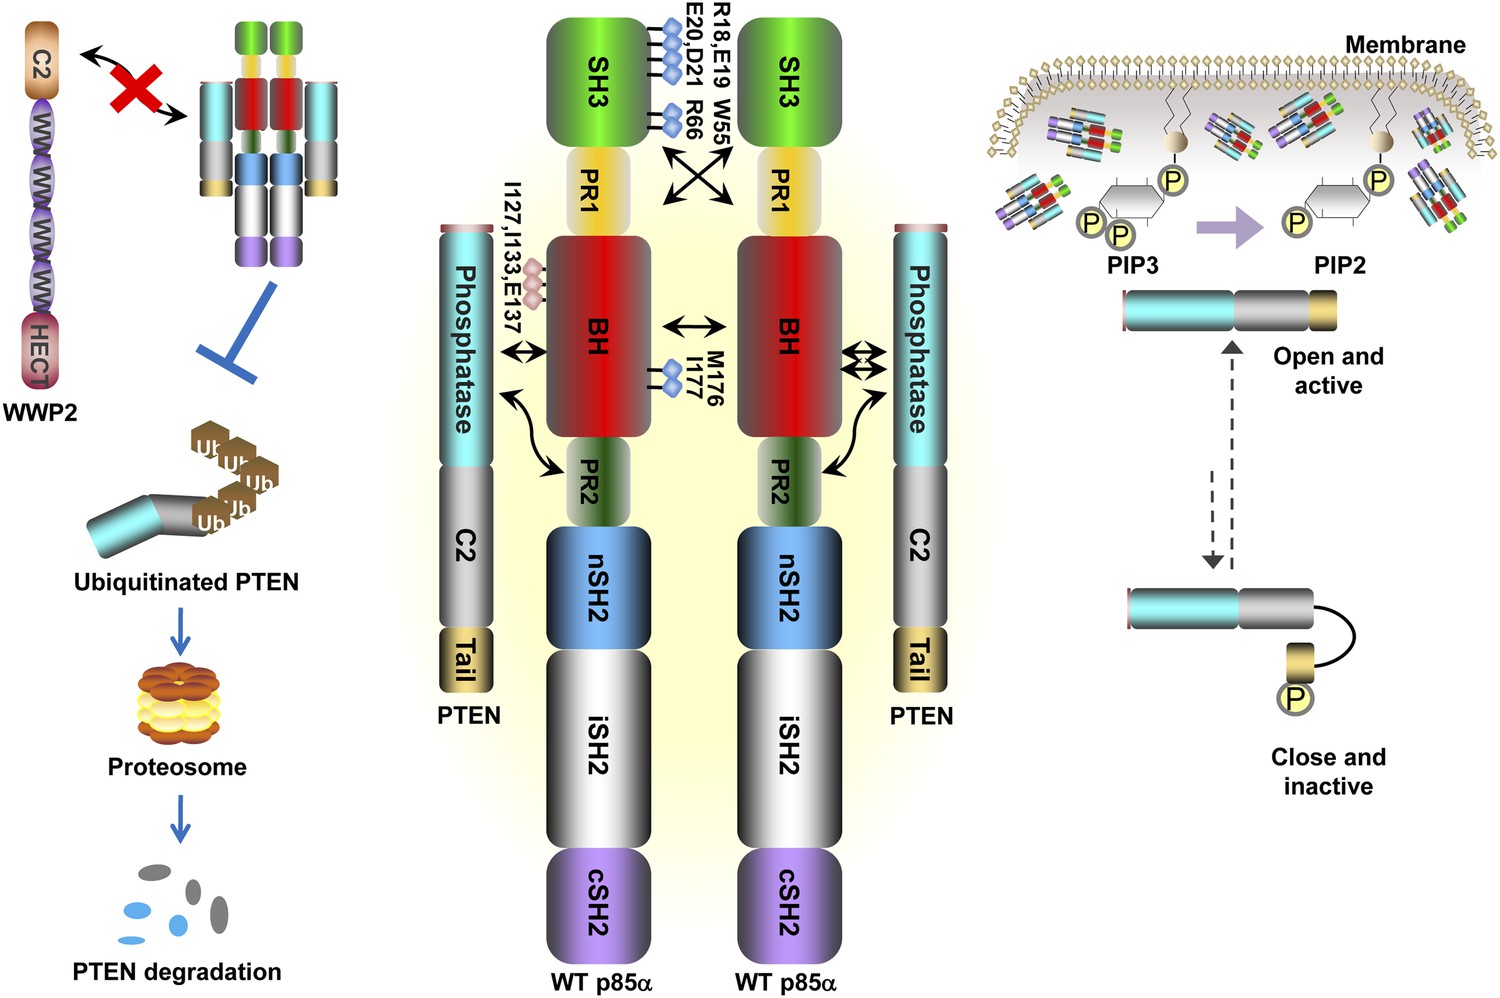
Schematic working model of how homodimerized p85α promotes PTEN stabilization and lipid phosphatase activity.
Our data support a p85α homodimer model that includes intermolecular interactions between SH3:PR1 in trans and BH:BH interactions between protomers. Key contact residues at the interfaces are shown as blue lollipops. The homodimerized p85α binds PTEN at least partly through the PR2 domain and the indicated residues (red lollipops) in the BH domain. This interaction prevents PTEN from binding to the E3 ligase WWP2, thereby inhibiting PTEN ubiquitination. The homodimerized p85α preferentially binds unphosphorylated PTEN, which has an open conformation and is more active. Independent of stabilizing PTEN protein, homodimerized p85α also enhances PTEN lipid phosphatase activity and association of unphosphorylated PTEN with the membrane where the PIP3 substrates localize. It remains unknown whether homodimerized p85α induces conversion of unphosphorylated PTEN from its close, inactive phosphorylated counterpart.
Appendix figure 1
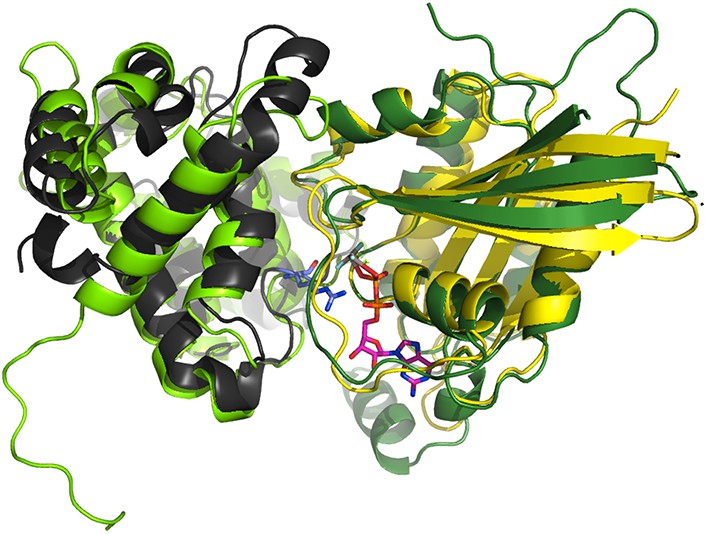
Superimposition of the crystallographic complex Cdc42GAP (light green) bound to Cdc42 (dark green) (1GRN) onto p85α BH (black) and the crystal structure of Rab5 (yellow; 1R2Q).
The GTP analogue (magenta) and the important catalytic arginine residue (blue) are highlighted.
Appendix figure 2
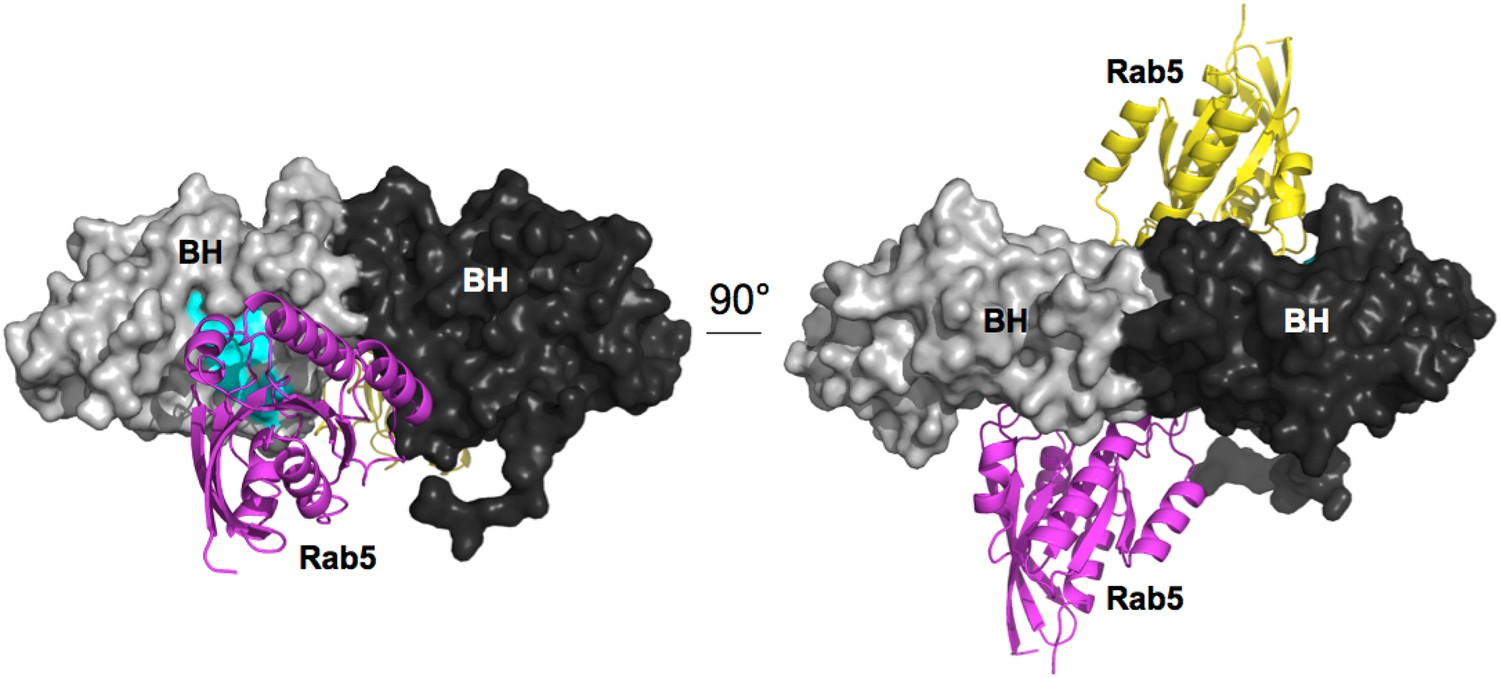
Model for Rab5 bound to the BH domain. Left and right panel are 90° views.
Cyan: Residues mutated in the GTPase-binding site that did not affect PTEN binding.
Appendix figure 3
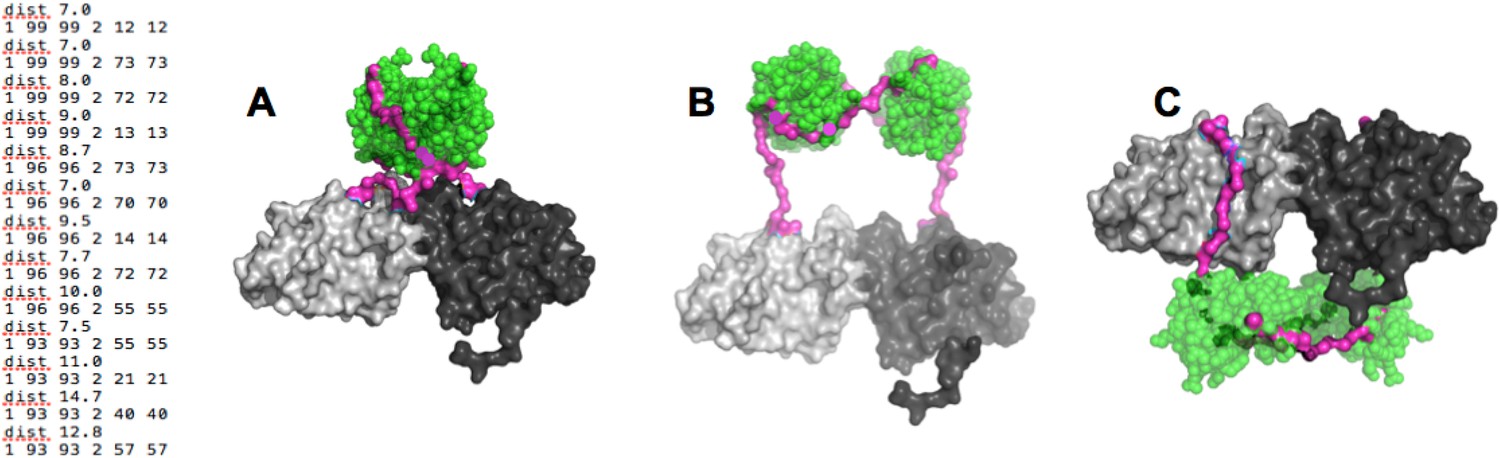
(Left) distance constraints used in BUNCH.
(A-C) Examples of dimeric SH3-PR1-BH models obtained by BUNCH. SH3: green; SH3-BH linker: magenta; BH dimer: light and dark gray.
Appendix figure 4
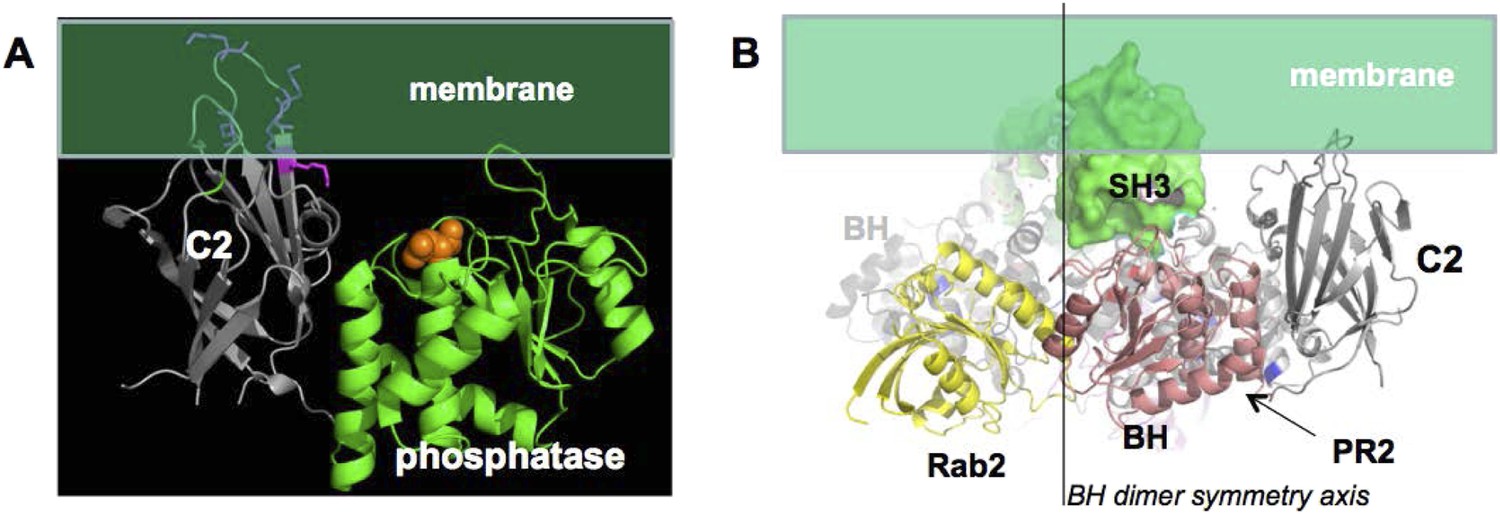
(A) approximate positioning of PTEN with respect to the membrane (green).
C2 residues required for membrane binding are highlighted. Orange spheres represent a bound L(+)-tartrate molecules found in the PTEN crystal structure (1D5R) and are thought to mimic interactions of PTEN with substrate phosphates(Lee et al., 1999). (B) When oriented with the SH3 domains (green) pointing towards the membrane, the two PTEN molecules cannot simultaneously interact with the membrane and with PR2.
Appendix figure 5
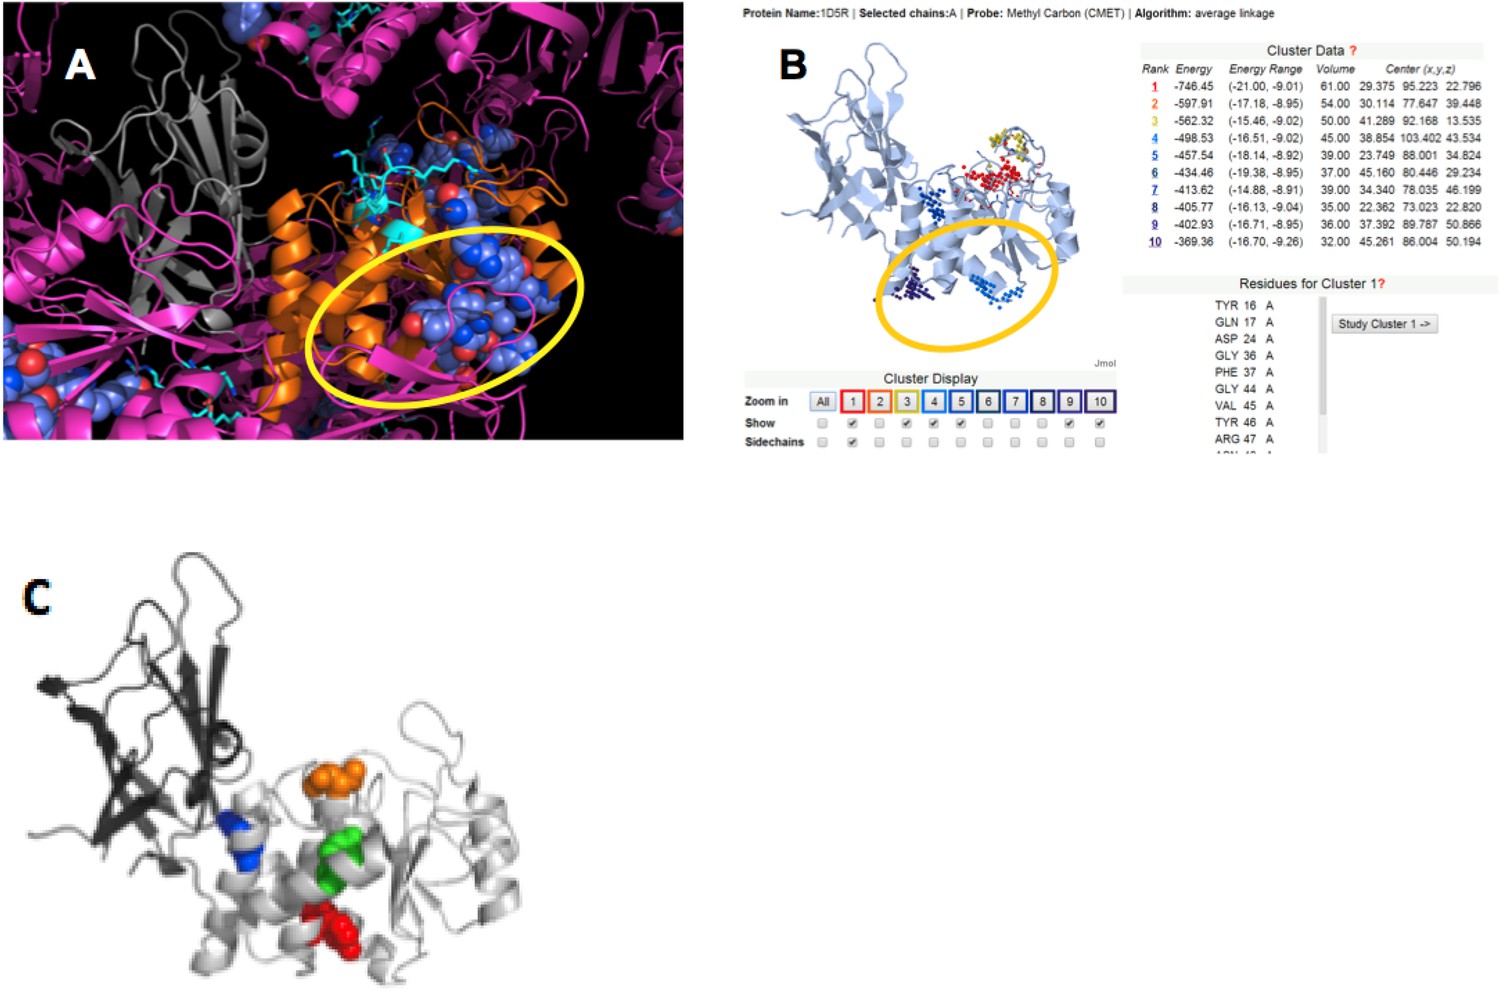
(A) PTEN is shown in the crystal lattice of 1D5R.
Gray: C2; orange: phosphatase; magenta: symmetric molecules. Highly conserved regions are shown as blue spheres. (B) Result of Sitehound search (http://scbx.mssm.edu/sitehound/ (Hernandez et al., 2009) using a methyl carbon probe). Red and yellow dotted regions are close to the active site and hence unlikely BH interaction regions. (C) Maddika et al. have previously observed PTEN mutations that enhance (Y155F; green), slightly enhance (Y138F, red) and slightly decrease (Y174F; blue) WWP2 binding (Maddika et al., 2011). Y174 locates to the C2:PTEN interface and is inaccessible to solvent and ligands. Y155 and Y138 both localize to the same side on PTEN and this side is the same as highlighted in (A) and (B).
Appendix figure 6

Cluster of ClusPro models that satisfy all constraints.
(A) Complexes viewed from the membrane; (B) side view with respect to the membrane.
Download links
A two-part list of links to download the article, or parts of the article, in various formats.
Downloads (link to download the article as PDF)
Open citations (links to open the citations from this article in various online reference manager services)
Cite this article (links to download the citations from this article in formats compatible with various reference manager tools)
Regulation of the PI3K pathway through a p85α monomer–homodimer equilibrium
eLife 4:e06866.
https://doi.org/10.7554/eLife.06866


