Evidence that synthetic lethality underlies the mutual exclusivity of oncogenic KRAS and EGFR mutations in lung adenocarcinoma
- National Human Genome Research Institute, United States
Figures
Figure 1
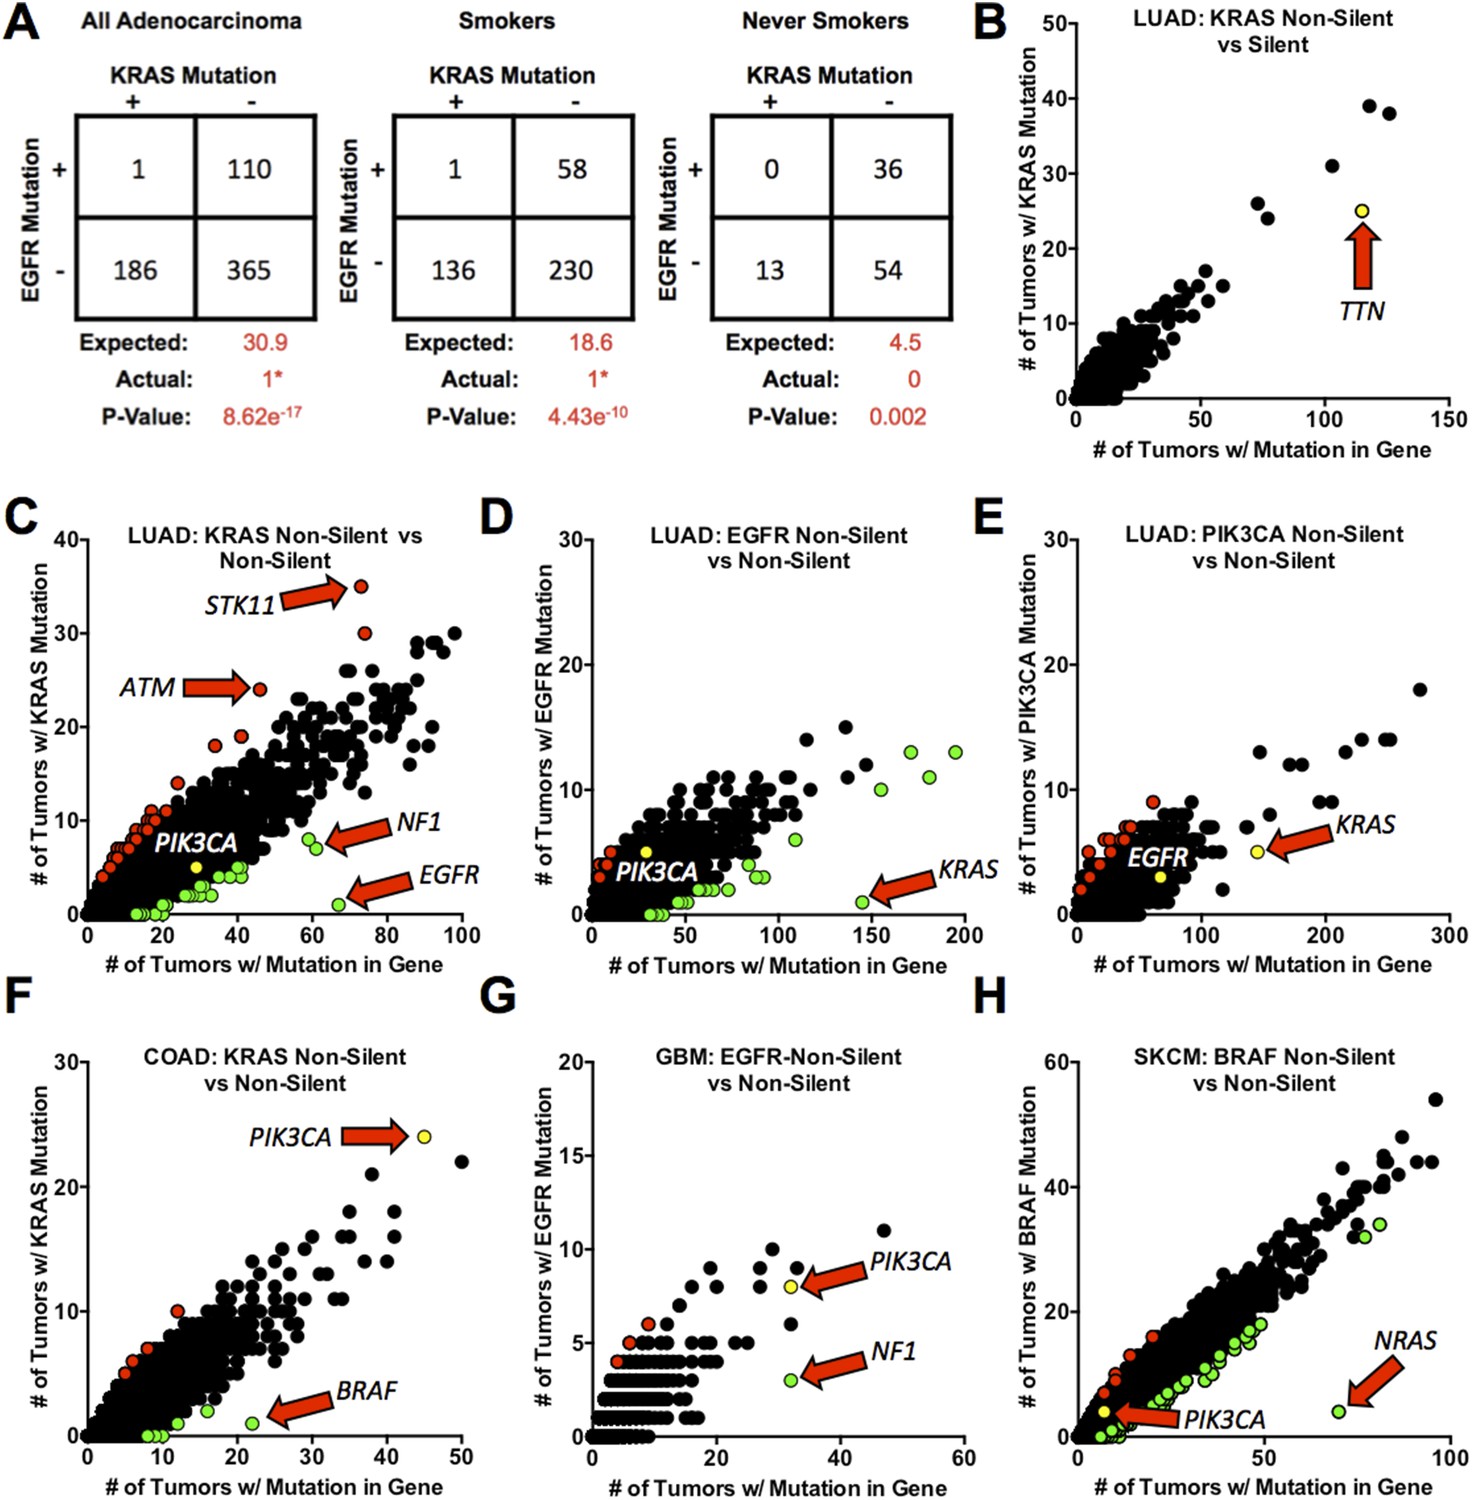
Mutations in KRAS and EGFR in lung adenocarcinoma are mutually exclusive.
(A) Coincidence of EGFR and KRAS mutations in 662 lung adenocarcinomas (LUAD). Numbers are presented for all tumors combined and for tumors found in smokers or never smokers. ‘Expected’ values are for co-occurrence of mutations based on the frequency of mutation of either gene alone (including assumptions about selective advantage and other features as described in the text). (e.g., in all LUAD, KRAS is mutant in 28.2% and EGFR is mutant in 16.6%, so the expected number of co-occurrences is 30.9 cases or 0.282 × 0.166 × 662.). p-values were calculated by a left-tailed 2 × 2 Fisher's Exact Test to assess significance of negative association. *The single tumor with co-incident non-silent mutations contained a non-activating EGFRR574L mutation. (B–H) Frequencies of coincidence of somatic silent (synonymous point mutations) or non-silent mutations (non-synonymous point mutations and small insertions or deletions that affect protein coding sequence) in coding sequences of other genes co-occurring with non-silent mutations in proto-oncogenes (EGFR, KRAS, PIK3CA, or BRAF) in 520 LUAD or other cancer types as noted below for individual panels. In these panels, each point represents a unique gene but data points overlap when multiple genes are mutated in the same number of tumors. Red dots represent genes for which non-silent mutations are positively associated with proto-oncogene mutations in the tumors (Right side Fisher's Exact Test p ≤ 0.01); green dots represent genes for which mutations are negatively associated with mutant proto-oncogenes (Left side Fisher's Exact Test p ≤ 0.01). Yellow dots represent some important genes that are co-mutated at the expected rate. Genes of special interest are indicated by the arrows. (B) Co-occurrence of silent mutations in other genes with non-silent KRAS mutations in LUAD. (C) The similar analysis for non-silent mutations co-occurring with KRAS mutations. (D, E) As in panel C, but with mutant EGFR and PIK3CA in LUAD. (F–H) Additional analyses for mutations co-existing with mutant KRAS in colorectal adenocarcinoma (COAD), F; with mutant EGFR in glioblastoma multiforme (GBM), G; and with mutant BRAF in skin cutaneous melanoma (SKCM), H. For presentation purposes, not all gene points are displayed. Complete lists of significant gene pairs from each of analysis can be found in Supplementary file 2.
Figure 2
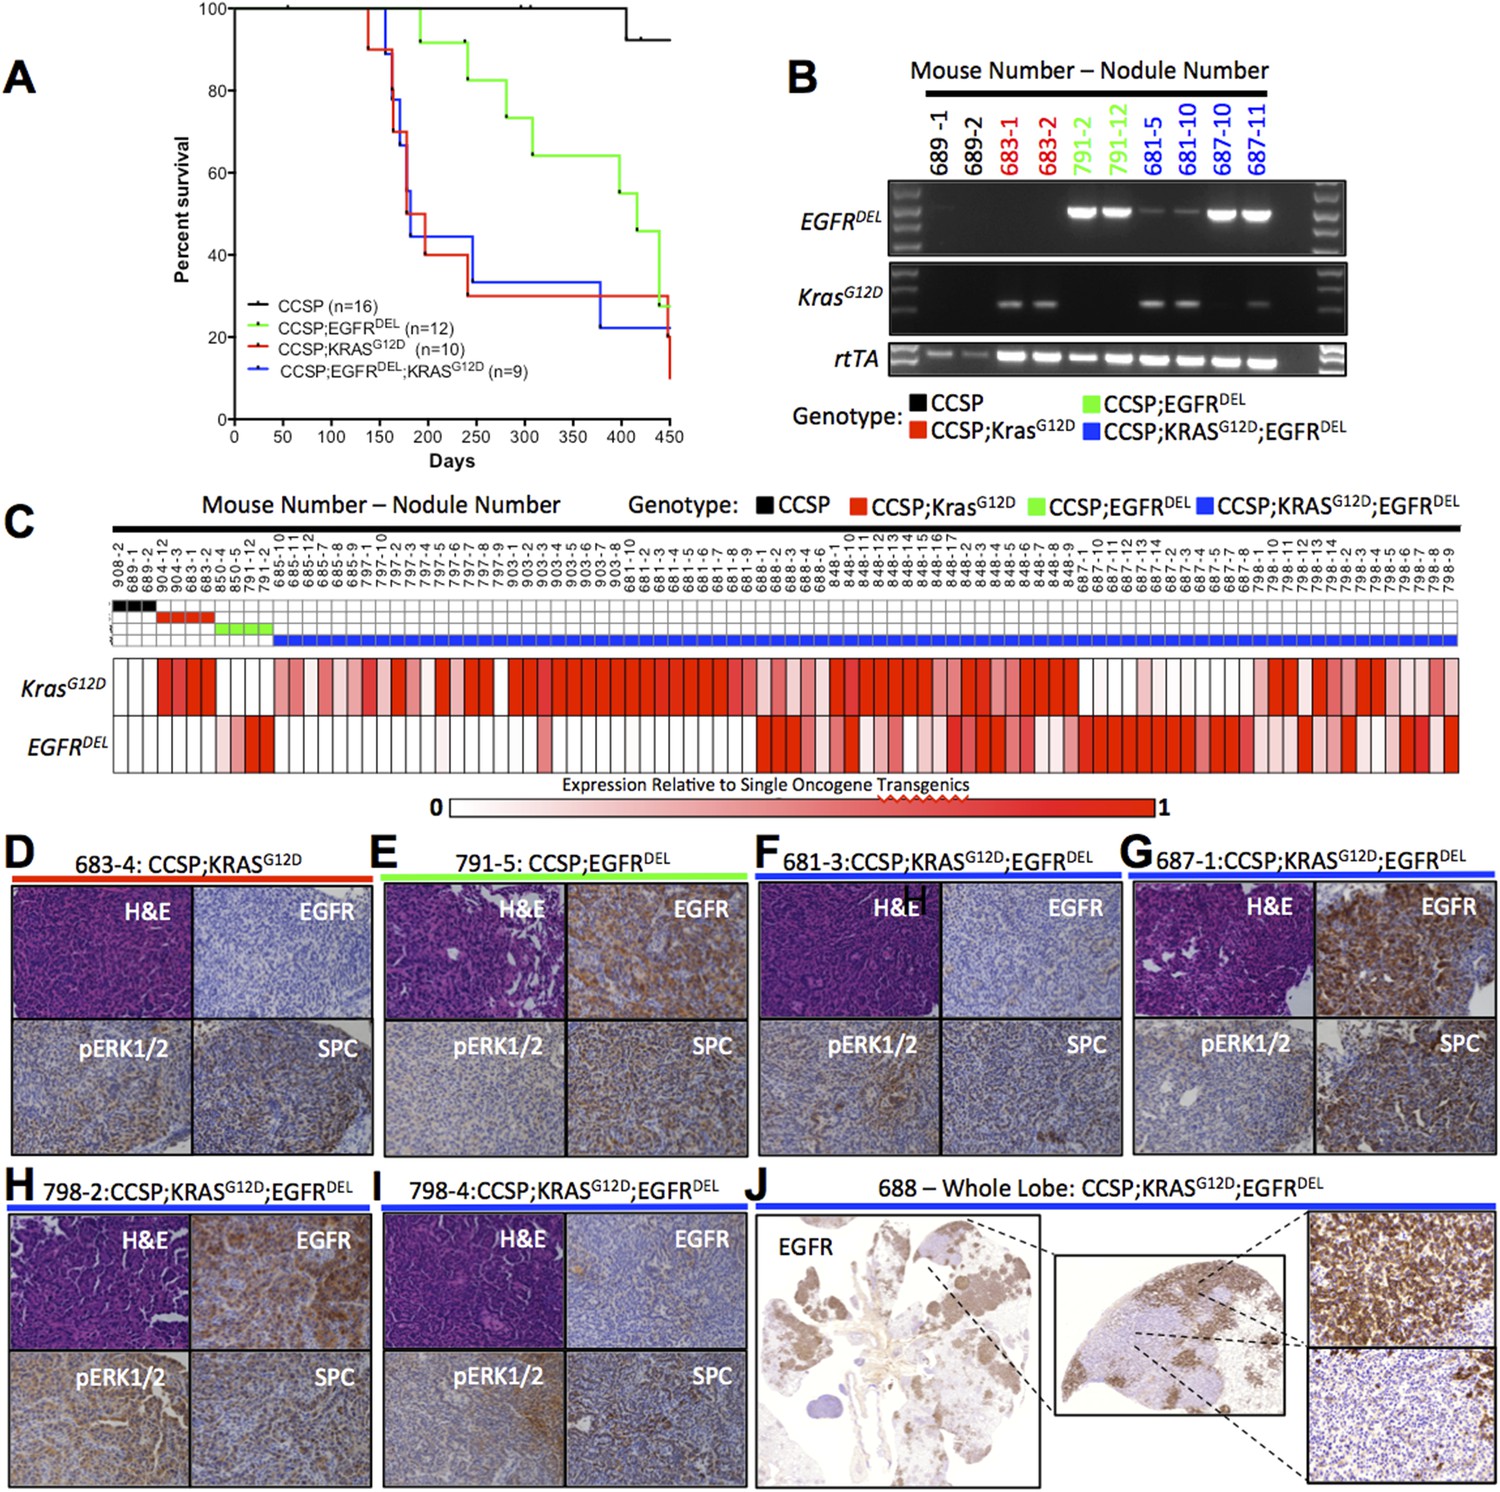
Co-induction of mutant Kras and mutant EGFR in the mouse lung epithelium leads to the development of LUAD that express a single oncogene.
(A) Survival curves for mono-transgenic mice expressing only rtTA from the clara cell specific promoter (CCSP, black line); bi-transgenic mice expressing mutant EGFR (CCSP;EGFRDEL, green line); bi-transgenic mice expressing mutant Kras (CCSP;KrasG12D, red line); and tri-transgenic mice (CCSP;EGFRDEL;KrasG12D, blue line). (B) Levels of transgene-specific RNA from normal lung tissue (for CCSP only) and tumor nodules (for oncogene containing transgenics) as measured by gel electrophoresis of products of RT-PCR reactions primed by oligonucleotides specific for KrasG12D, EGFR and rtTA RNA, prepared from animals encoding only rtTA (CCSP; black), KrasG12D (CCSP;KrasG12D; red), EGFRDEL only (CCSP;EGFRDEL;green) and EGFRDEL plus KrasG12D (CCSP;EGFRDEL;KrasG12D;blue). Mice are indicated by the initial number; the number following the dash represents the nodule or tissue number from that mouse. (C) EGFRDEL and KrasG12D RNA levels measured by qRT-PCR from normal lung (for CCSP mice only) and from tumor nodules (for all mice containing transgenic oncogenes). Data for each nodule are represented in a ‘heat map’ with the expression levels shown relative to the average of the respective bi-transgenic animals for each transgene (see ‘Materials and methods’). Mice and nodules are identified as above. (D–I) Histological appearance (H&E staining) and IHC detection of relevant proteings (human EGFR, phospho-ERK1/2 and SPC) in selected mouse lung nodules also examined in panel C. Mouse and nodule numbers are indicated as before along with the respective genotype for each mouse; the genotype is also indicated by the color of the line below each label by the color scheme for genotype according to the key used in panel C. (J) IHC for human EGFR in a lung lobe from a tri-transgenic mouse, indicating regions of distinct staining within the same region of tumor.
Figure 3
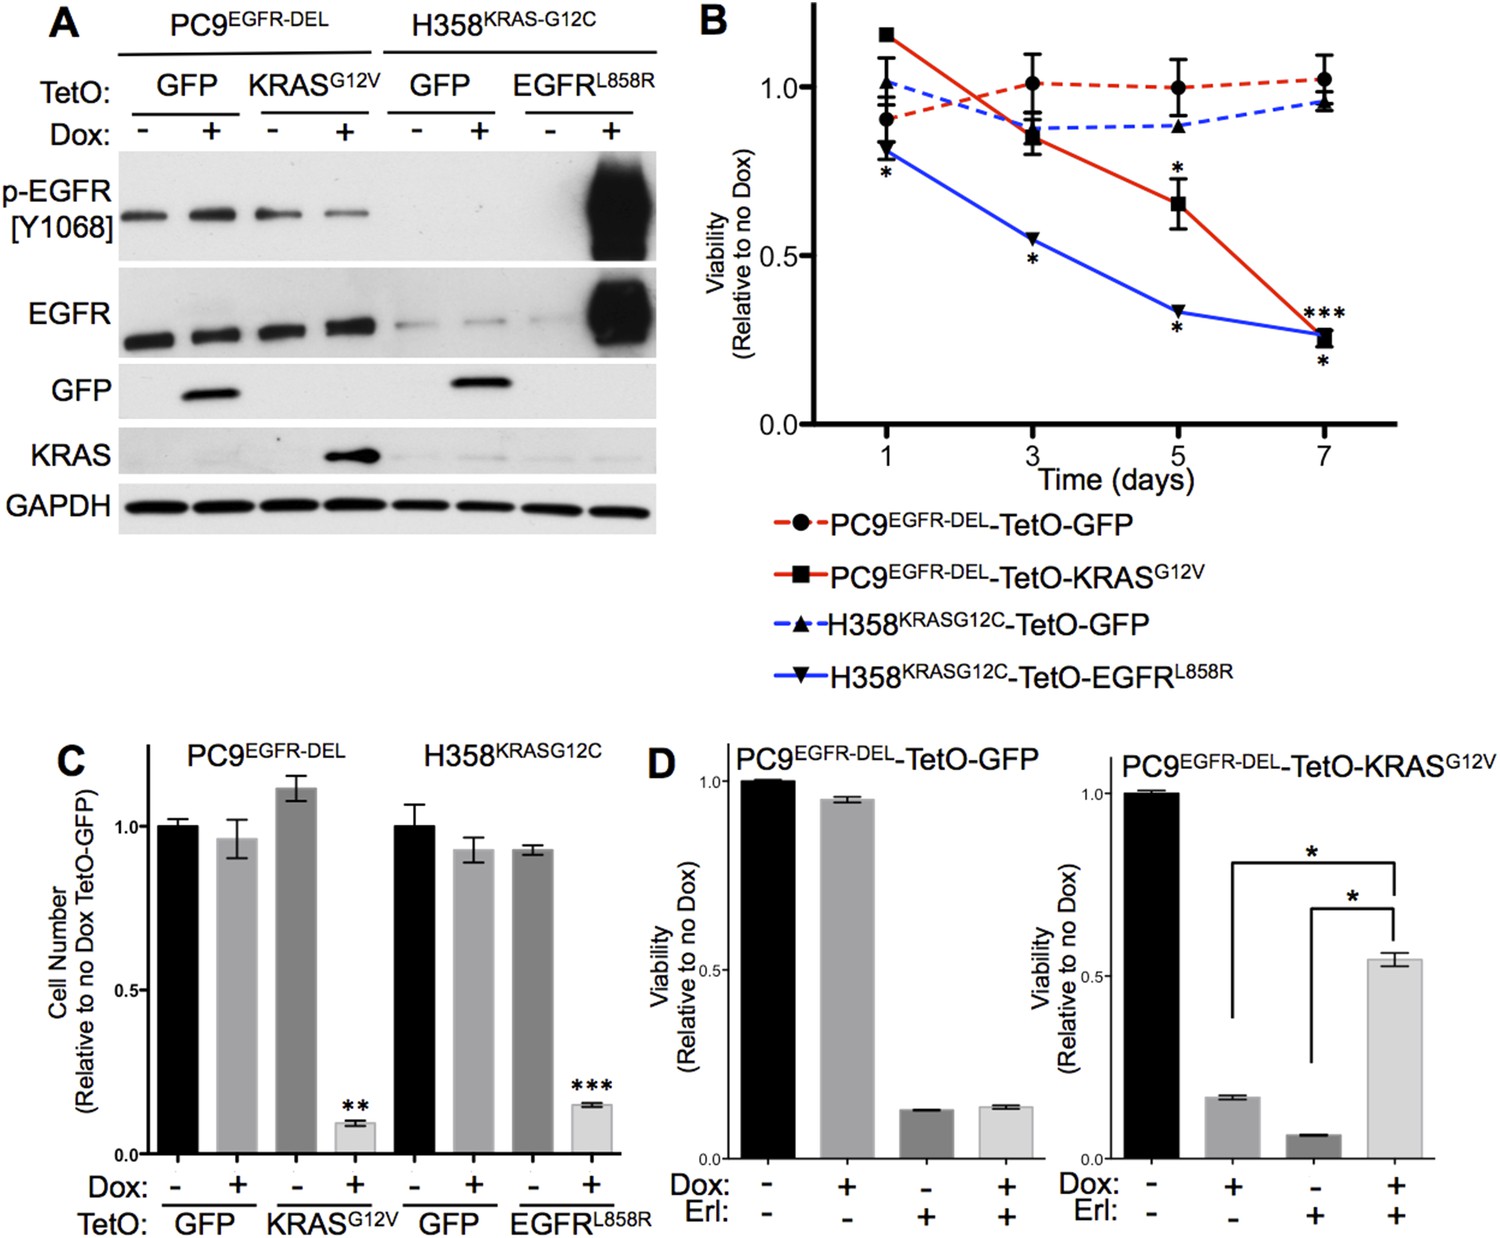
Co-expression of mutant KRAS and mutant EGFR decreases viability of human lung adenocarcinoma cell lines.
(A) Induced expression of transduced genes in human lung cancer cell lines. PC9 and H358 cell lines were transduced with the indicated tetracycline-responsive plasmids. Lysates of cells cultured in the presence or absence of doxycycline (Dox) for 24 hr were prepared and assayed for the indicated protein expression by western blotting, as described in Materials and Methods. (B) Co-expression of mutant KRAS and EGFR reduces cell viability. Cells were grown in the presence or absence of Dox for up to 7 days and tested for viability by alamar blue. Averaged values from three independent experiments were normalized and plotted for each cell line relative to untreated cells (no Dox) at the indicated time points. Error bars represent ± standard deviation (SD) for each point. p-values were calculated between the + and − Dox states of individual cell lines at each time point using a two-tailed, unpaired t test with Welch's correction. *, ** and *** represent significance values <0.01, <0.001 and <0.0001, respectively. (C) Co-expression of mutant KRAS and EGFR reduces cell number. Cells were grown as in panel B and counted on day 7. Average cell number from three independent experiments were normalized and plotted for each cell line relative to cells expressing TetO-GFP in the absence of Dox. Error bars represent ± standard error of the mean (SEM) and p-values were calculated between the + and − Dox states as described in A. (D) Erlotinib protects PC9-TetO-KRASG12V cells from the toxic effects of oncogene co-expression. Cells were grown with or without erlotinib (Erl) and/or Dox for 7 days and cell viability determined by alamar blue. Results from three independent experiments were normalized and plotted for each cell line relative to untreated cells (no Dox) with error bars representing ± SEM. p-values were calculated between the groups indicated as in A.
Figure 4

Effects of mutant KRAS and EGFR co-expression.
(A) Measurement of apoptosis after co-expression of mutant oncogenes. The indicated cells were grown for 5 days with or without Dox and assessed for apoptosis by flow cytometry for Annexin V and 7-AAD. Data are plotted as either Annexin V positive/7-AAD negative (AV+/7-AAD−, early apoptosis, black bars) or Annexin V/7-AAD positive (AV/7-AAD+, late apoptosis, gray bars) cells. (B) PARP cleavage after co-expression of mutant oncogenes. Cells were grown as in panel A (5 days) and lysates assayed for cleavage of PARP protein by western blotting. Cells treated with staurosporine (Stau) for 24 hr were used as a positive control. (C) LC3A lipidation with co-expression of mutant oncogenes. Cells were grown as above (5 days) and assayed for autophagy by measuring the levels of LC3-II, the faster migrating band of LC3 (where applicable). Cells treated with chloroquine (Chlor) for 16 hr were used as a positive control. (D) Cell cycle analysis in cells co-expressing mutant oncogenes. Cells were grown for 3 and 5 days as indicated after induction of a second oncogene, and cell cycle status was determined by propidium iodide staining and flow cytometry. The fraction of cells in G1, S and G2/M are gated as indicated. The percentages of cells in each cell cycle stage are plotted as stacked bars. Data from A and D are plotted as averages from cells grown in triplicate wells ± SEM all data are representative of multiple independent experiments.
Figure 5
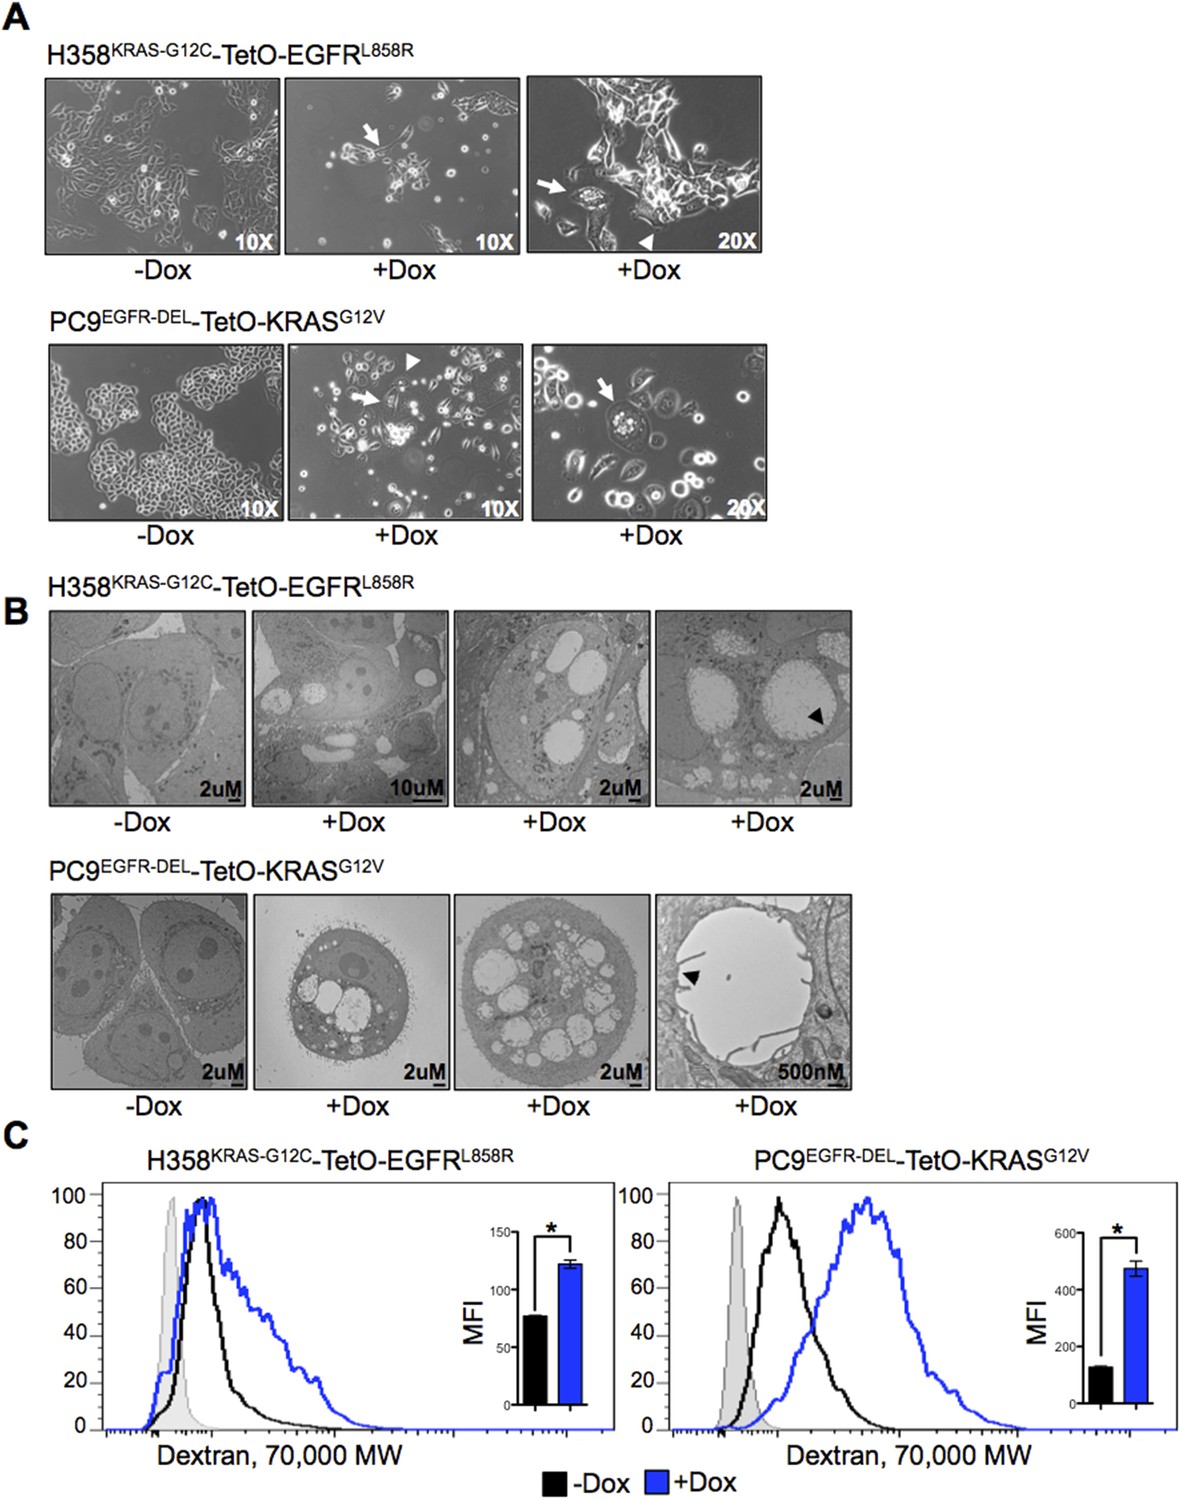
Co-expression of mutant KRAS and EGFR induces morphological changes and increased macropinocytosis in lung adenocarcinoma cells.
(A) Changes in morphology induced by co-expression of mutant oncogenes. Cells were grown for 5 days after induction of expression of a second oncogene, and phase contrast images were taken with indicated objectives. Arrows show a vacuolated cell and arrowheads show membrane ruffling. Images are representative of cell morphology during the analyses (as early as day 1 and as late as day 7 after Dox). (B) Vacuolization in cells co-expressing mutant oncogenes. Cells were cultured for 5 days after induction of a second oncogene and analyzed by transmission EM (TEM). Scale bars on lower right. Far right panels for each cell type shows a vacuolar structure bound by a single membrane (black arrowhead). (C) Increased macropinocytosis with co-expression of mutant oncogenes. Cells were cultured for 3 days in the presence or absence of Dox and assayed for macropinocytosis by uptake of fluorescent 70 kDa Dextran for 30 min. Dextran uptake was measured by flow cytometry. A histogram of data from one experiment and the average MFI (median fluoresence intensity) from three independent experiments ± SEM are also shown. The shaded light gray histogram represents fluorescence intensity of cells that received neither Dextran nor Dox. p-values were calculated between the + and − Dox states using a two-tailed, unpaired t test with Welch's correction with * representing significance values <0.01.
Figure 6
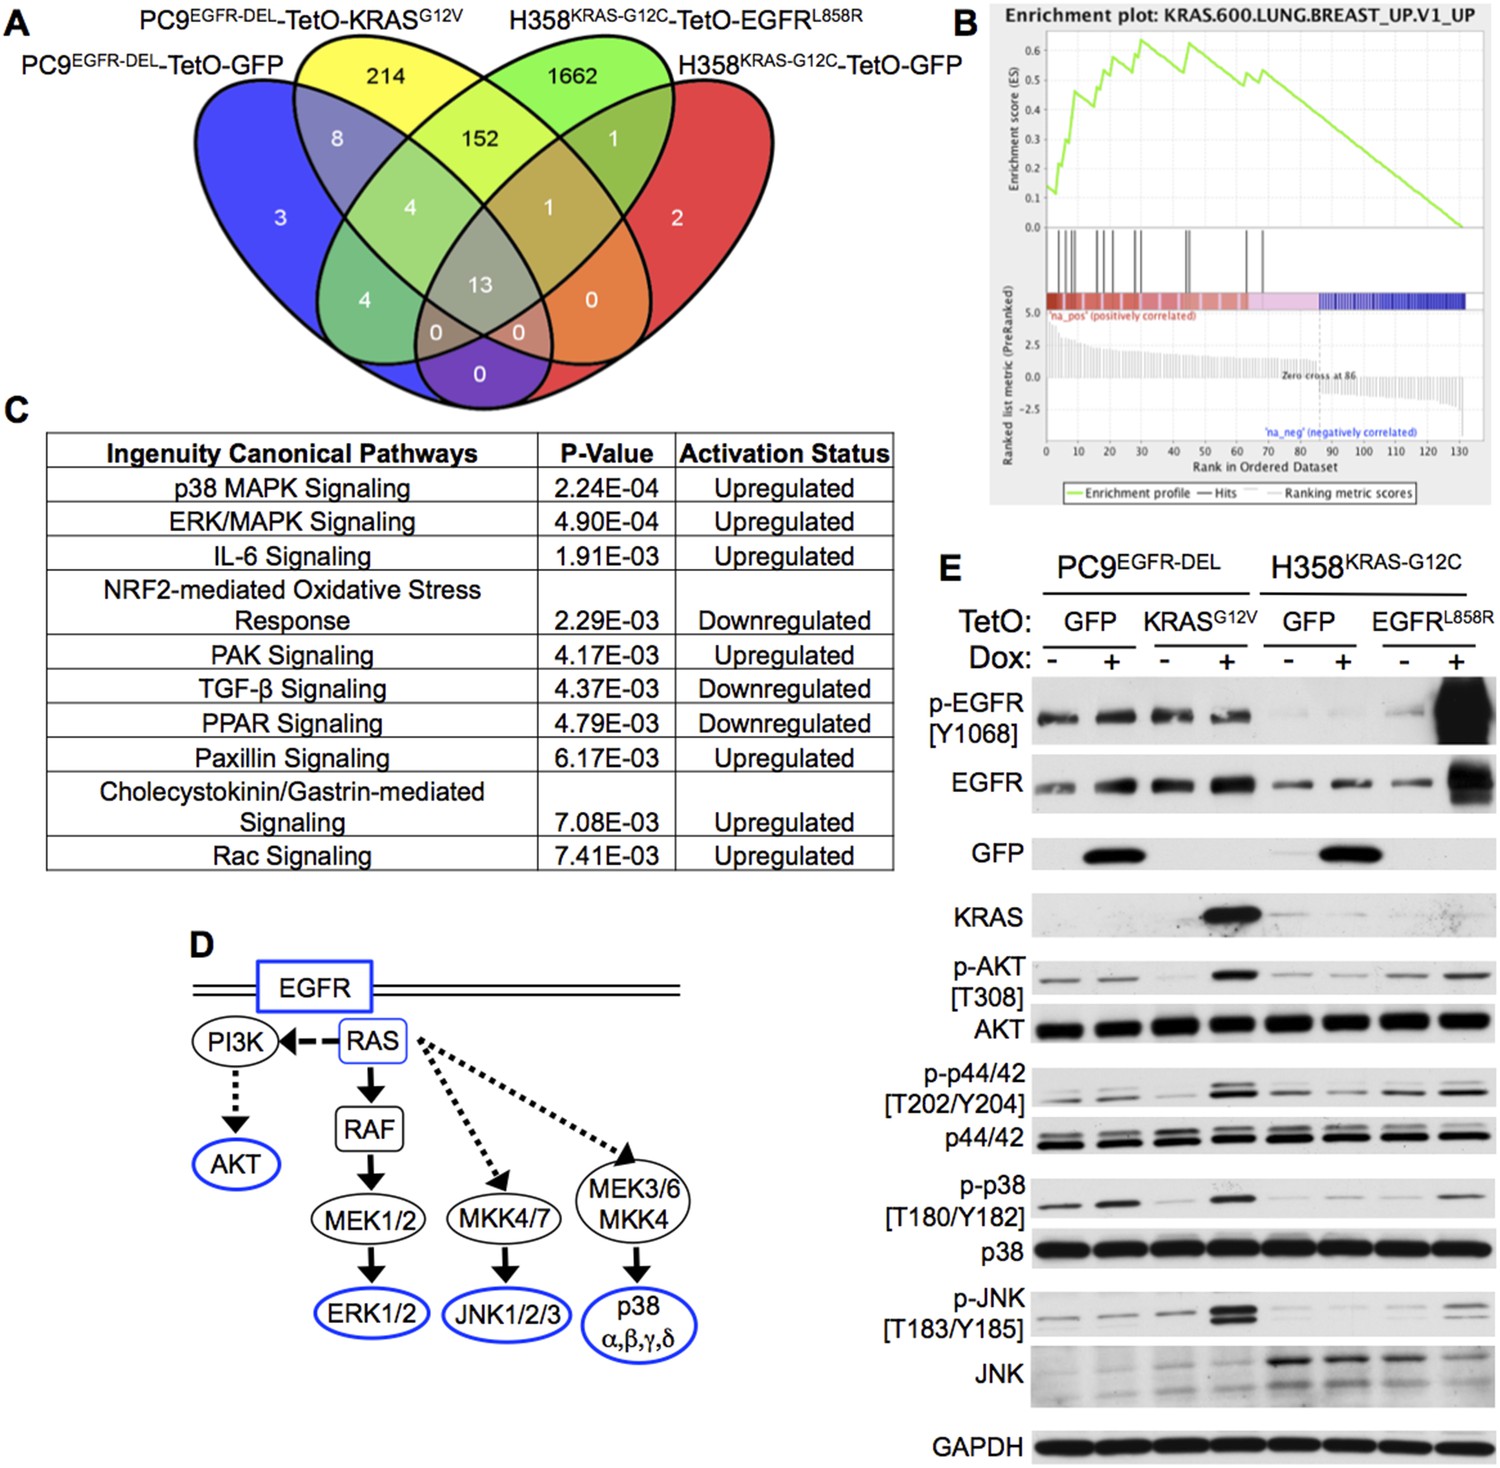
Co-expression of mutant KRAS and EGFR increases MAP kinase (MAPK) signaling.
(A) Modified PC9 and H358 lung adenocarcinoma cells (see Figure 3) were cultured in the presence or absence of doxycycline (Dox) for 24 hr and analyzed for global gene expression changes using Affymetrix microarrays (see ‘Materials and methods’ for details). Microarray probes differentially expressed in each TetO cell line upon the addition of Dox were identified (corrected p < 0.01, compared to control without Dox), and those genes specifically induced by Dox in either TetO-KRAS or TetO-EGFR cells and not the TetO-GFP control cells were determined. The Venn diagram indicates the resulting number of gene probes identified in each cell line, including the 152 unique probes specifically modulated by expression of mutant KRAS and EGFR in both PC9 and H358 cells. (B) Gene Set Enrichment Analysis (GSEA) of the genes specifically regulated upon mutant KRAS and EGFR co-expression in both PC9 and H358 lung adenocarcinoma cells identified three oncogenic signatures that were significantly upregulated (FDR q-value <0.01) upon co-expression; the top two are indicative of KRAS signaling (see ‘Materials and methods’ and Supplementary file 5). The displayed enrichment plot is for the most significant gene set (q-value = 0, Normalized Enrichment Score = 2.29) demonstrating enrichment for genes related to the upregulation of mutant KRAS. (C) Ingenuity Pathway Analysis (IPA) of the KRAS + EGFR induced gene set was performed and the top ten significantly regulated canonical pathways in which these genes are involved are displayed (see ‘Materials and methods’). P38 MAPK signaling was identified as the most significant upregulated pathway from this analysis; ERK/MAPK signaling was the second. (D) A highly simplified diagram of the EGFR/RAS signaling pathway is illustrated; the components assessed by western blot highlighted in blue. (E) Increased MAPK signaling in cells co-expressing mutant oncogenes. The indicated cells were cultured for 3 days with or without Dox; lysates were assayed by western blotting for the indicated proteins and phospho-proteins. Where relevant, the phosphorylated Tyrosine (Y) or Threonine (T) residue being measured is shown. Data are representative of three independent experiments.
Additional files
-
Supplementary file 1
KRAS and EGFR Mutations in Lung Adenocarcinoma (Excel File A).
- https://doi.org/10.7554/eLife.06907.009
-
Supplementary file 2
Combinations of mutated genes significantly associated, positively or negatively, in various cancer types (Excel File B).
- https://doi.org/10.7554/eLife.06907.010
-
Supplementary file 3
Genotypes for all experimental mice used in this study (Below).
- https://doi.org/10.7554/eLife.06907.011
-
Supplementary file 4
Genes differentially expressed 24 hr after co-induction of mutant KRAS and EGFR (Excel File C).
- https://doi.org/10.7554/eLife.06907.012
-
Supplementary file 5
Gene sets enriched upon co-induction of mutant KRAS and EGFR.
- https://doi.org/10.7554/eLife.06907.013
Download links
A two-part list of links to download the article, or parts of the article, in various formats.
Downloads (link to download the article as PDF)
Open citations (links to open the citations from this article in various online reference manager services)
Cite this article (links to download the citations from this article in formats compatible with various reference manager tools)
Evidence that synthetic lethality underlies the mutual exclusivity of oncogenic KRAS and EGFR mutations in lung adenocarcinoma
eLife 4:e06907.
https://doi.org/10.7554/eLife.06907


