The neuropeptide tachykinin is essential for pheromone detection in a gustatory neural circuit
- Temasek Life Sciences Laboratory, Singapore
- National University of Singapore, Singapore
- Institute of Molecular and Cell Biology, Singapore
- Toyo Gosei Co., Ltd, Japan
- University of Hawaii at Mānoa, United States
Figures
Figure 1
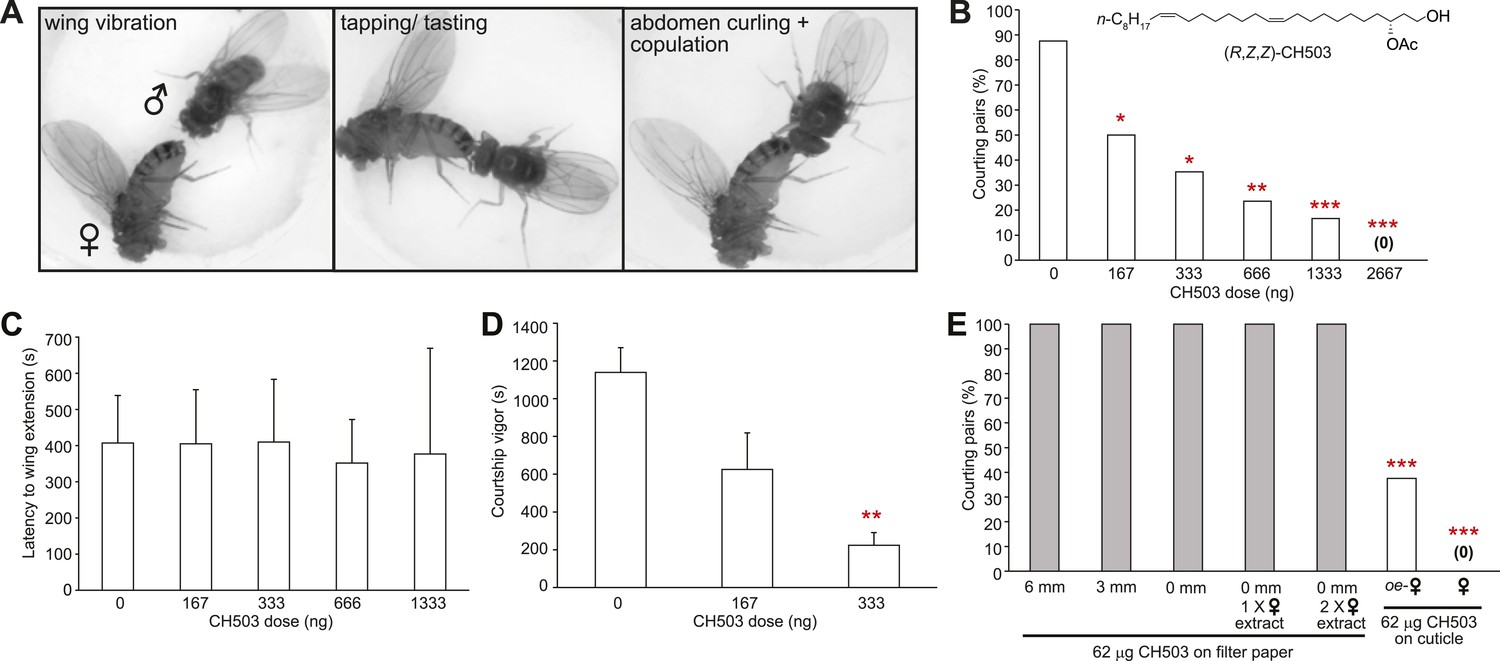
Functional properties of the male sex pheromone CH503.
(A) The typical courtship sequence of D. melanogaster is comprised of wing vibration performed by the male towards the female, tapping and tasting of the female abdomen with the forelegs, and abdomen curling followed by copulation. (B) Courtship behavior exhibited by wild-type Drosophila males decreases in a dose-dependent manner with increasing amounts of CH503 on the surface of virgin females. N = 25–30, Fisher's exact probability test, *p < 0.05, **p < 0.01, ***p < 0.001. (C) CH503 does not change the latency to courtship initiation, as measured by the latency to wing vibration. N = 16–24, ANOVA with Tukey's multiple comparison test. Error bars represent SEM. (D) CH503 suppresses the amount of time the fly actively spends courting. Courtship vigor is defined as the total time the male spends courting, calculated from the first instance of orientation and wing vibration. N = 8–24, ANOVA with Tukey's multiple comparison test, **p < 0.01. Error bars represent SEM. (E) CH503 has low volatility and inhibits courtship only when detected on female cuticles. The absence of female cuticular hydrocarbons in oenocyte-less (oe-) flies also did not affect CH503-induced courtship suppression. N = 8, Fisher's exact probability test, ***p < 0.001.
Figure 2 with 3 supplements
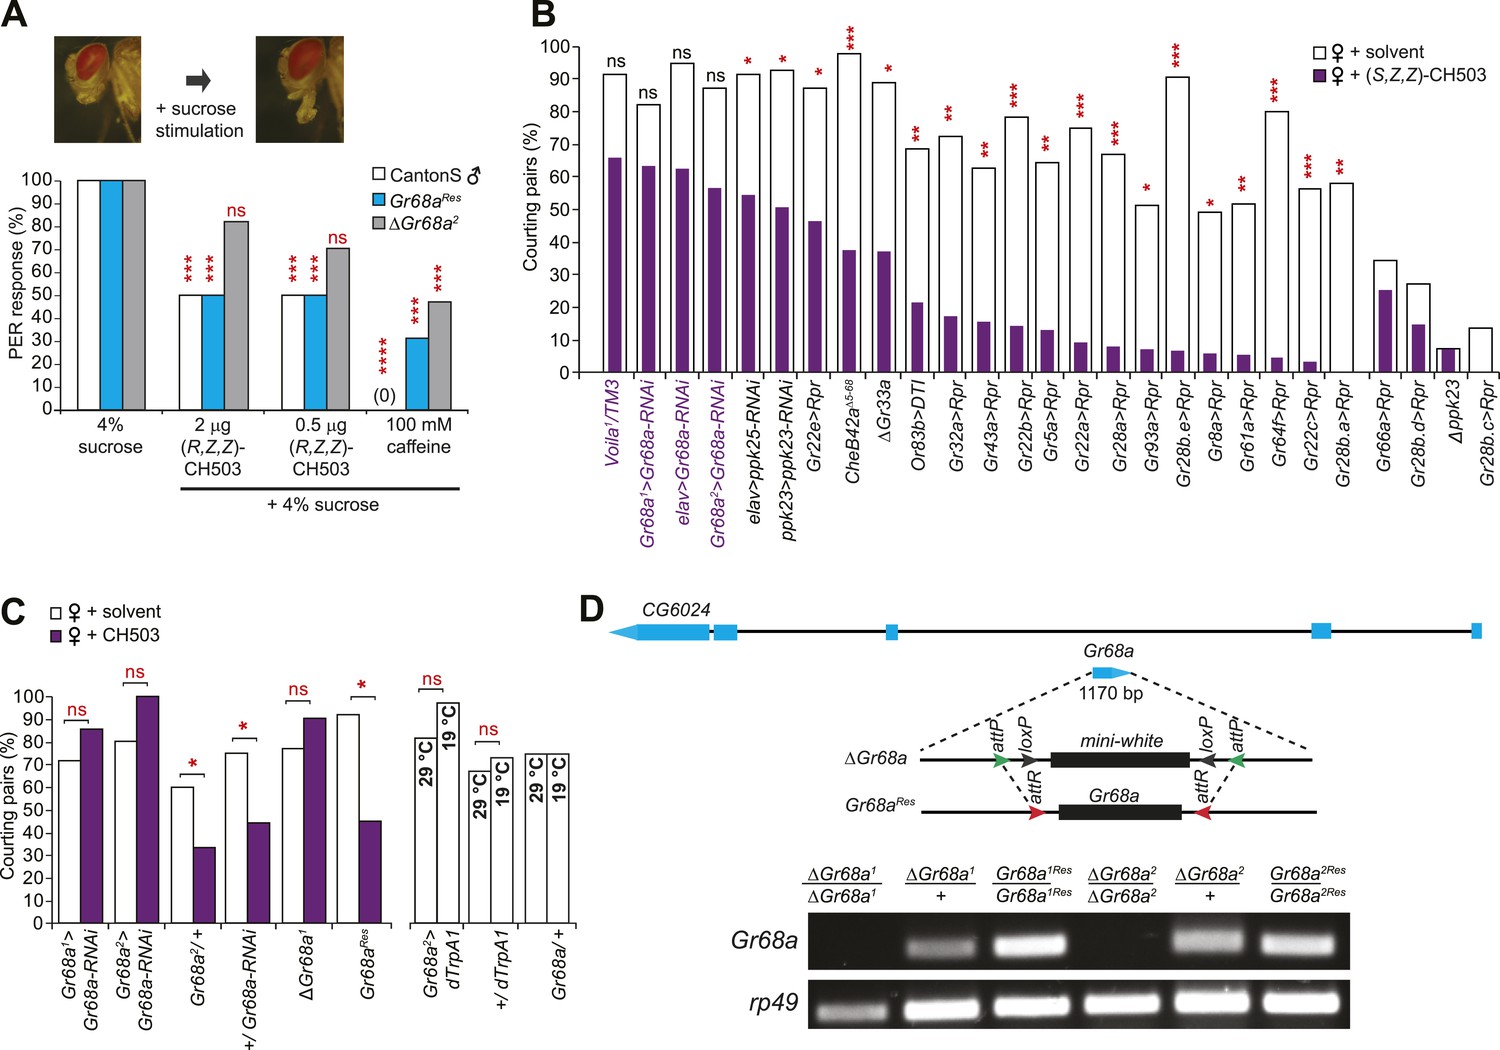
Gr68a expression in the male foreleg is required for CH503 detection.
(A) Simultaneous stimulation of the male foreleg with 4% sucrose and CH503 or caffeine significantly inhibits the proboscis extension reflex (PER; shown in pictures) in CantonS males (white). The PER suppression was not observed in ΔGr68a mutant flies (gray) but was restored upon re-introduction of the Gr68a gene (Gr68aRes; blue). For each genotype, the response to each test compound was compared to the response to sucrose alone. N = 18, Fisher's exact probability test, ***p < 0.001, ****p < 0.0001, ns: not significant. (B) A behavioral screen targeting foreleg-specific gustatory receptor neurons, pheromone receptors, and a pheromone binding protein reveals that Gr68a is a candidate receptor for detecting (S, Z, Z)-CH503. The number of flies exhibiting courtship in response to the pheromone (purple) was compared to the response to a solvent-perfumed female (white). For some genotypes (far right of graph), the basal courtship level was too low to observe a courtship suppression effect. N = 12–73, Fisher's exact probability test, *p < 0.05, **p < 0.01; ***p < 0.001. (C) Silencing Gr68a expression with RNAi or genetic deletion resulted in a loss of sensitivity to CH503. The courtship suppression response was unaltered in parental control lines and restored upon re-introduction of the gene into the mutant. Hyperactivation of Gr68a-expressing neurons using dTrpA1 at the activation temperature (29°C) resulted in a slight but non-significant courtship suppression compared to the inactive temperature (19°C). Parental control lines exhibited no difference in courtship behavior at 29°C or 19°C. N = 12–37, Fisher's exact probability test, *p < 0.05, ns: not significant. (D) (Top) A schematic of the Gr68a gene locus shows that the single coding exon (blue) resides within the intronic region (black) of another gene, CG6024. (middle) The homologous recombination strategy for deletion and rescue of Gr68a involves replacement of the endogenous gene with the mini-white marker using recombinase-mediated cassette exchange (RMCE). Genomic rescue of Gr68a is accomplished by exchanging mini-white via RMCE with the Gr68a sequence. (Bottom) Analysis by semi-quantitative PCR of genomic DNA shows the complete absence of Gr68a expression in two homozygous mutant alleles and successful rescue in the respective Gr68aRes lines. Rp49 expression is used as a loading control. CG6024 expression is not changed in mutant or rescue lines (Figure 2—figure supplement 3).
Figure 2—figure supplement 1
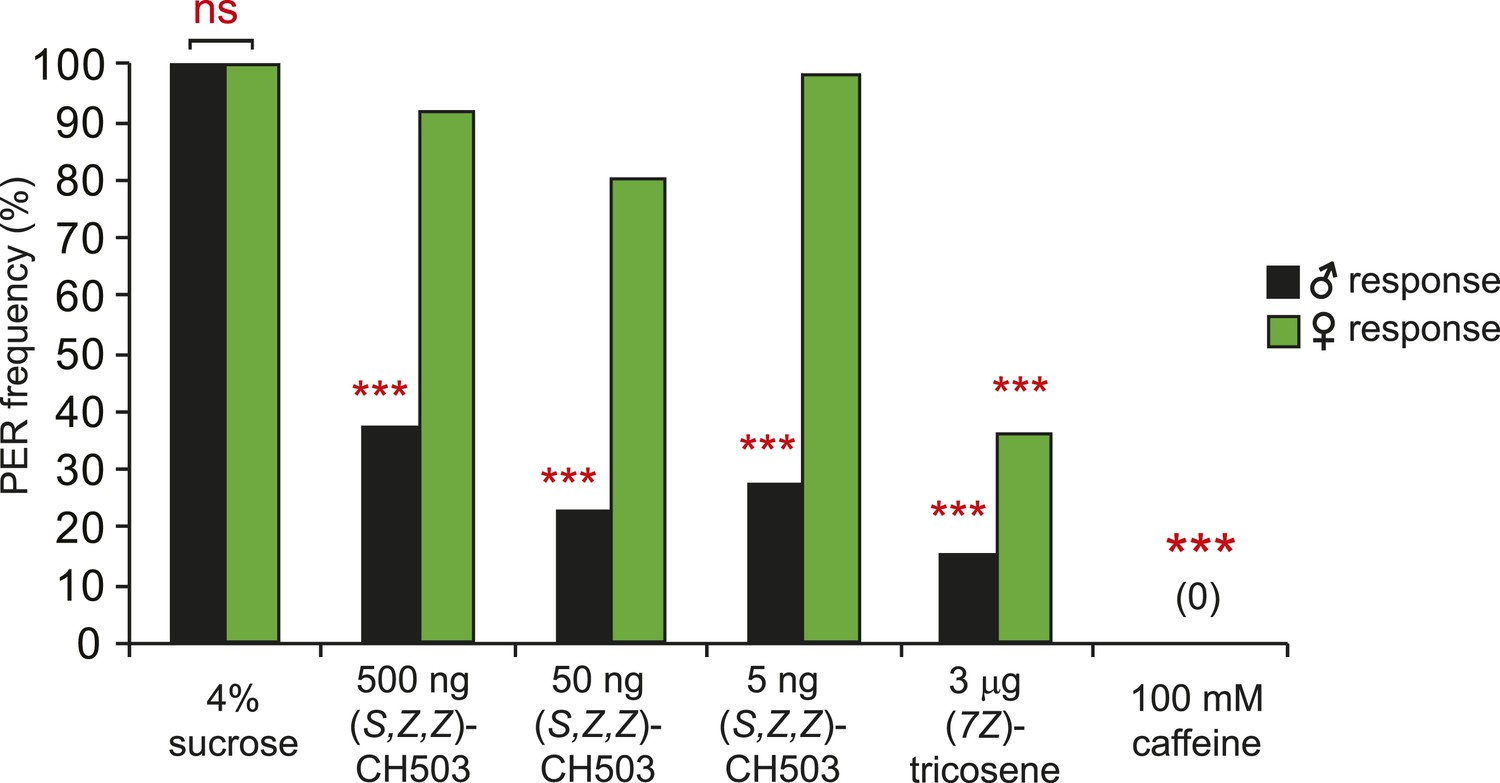
Sexually dimorphic PER response to CH503.
The PER response to (S, Z, Z)-CH503 is sexually dimorphic. Females do not respond to the more potent stereoisomer (S, Z, Z)-CH503 (green) while males respond across a range of doses (black). Both males and females suppress PER when presented with other aversive substances, (7Z)-tricosene and caffeine. N = 18, Fisher's exact probability test, ns: not significant; ***p < 0.001.
Figure 2—figure supplement 2
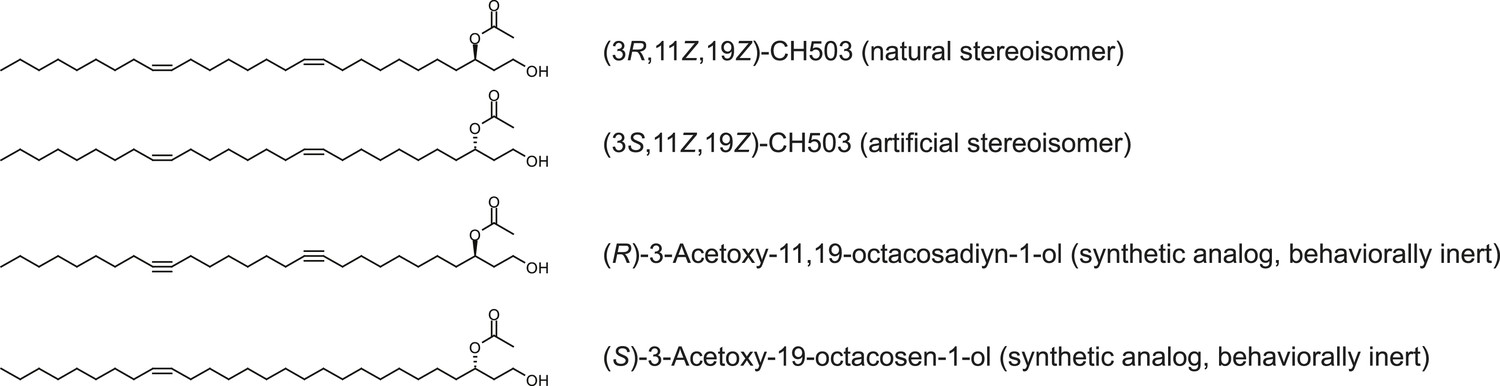
Chemical structures of (R, Z, Z)-CH503, (S, Z, Z)-CH503, and CH503 analogs.
https://doi.org/10.7554/eLife.06914.006
Figure 2—figure supplement 3
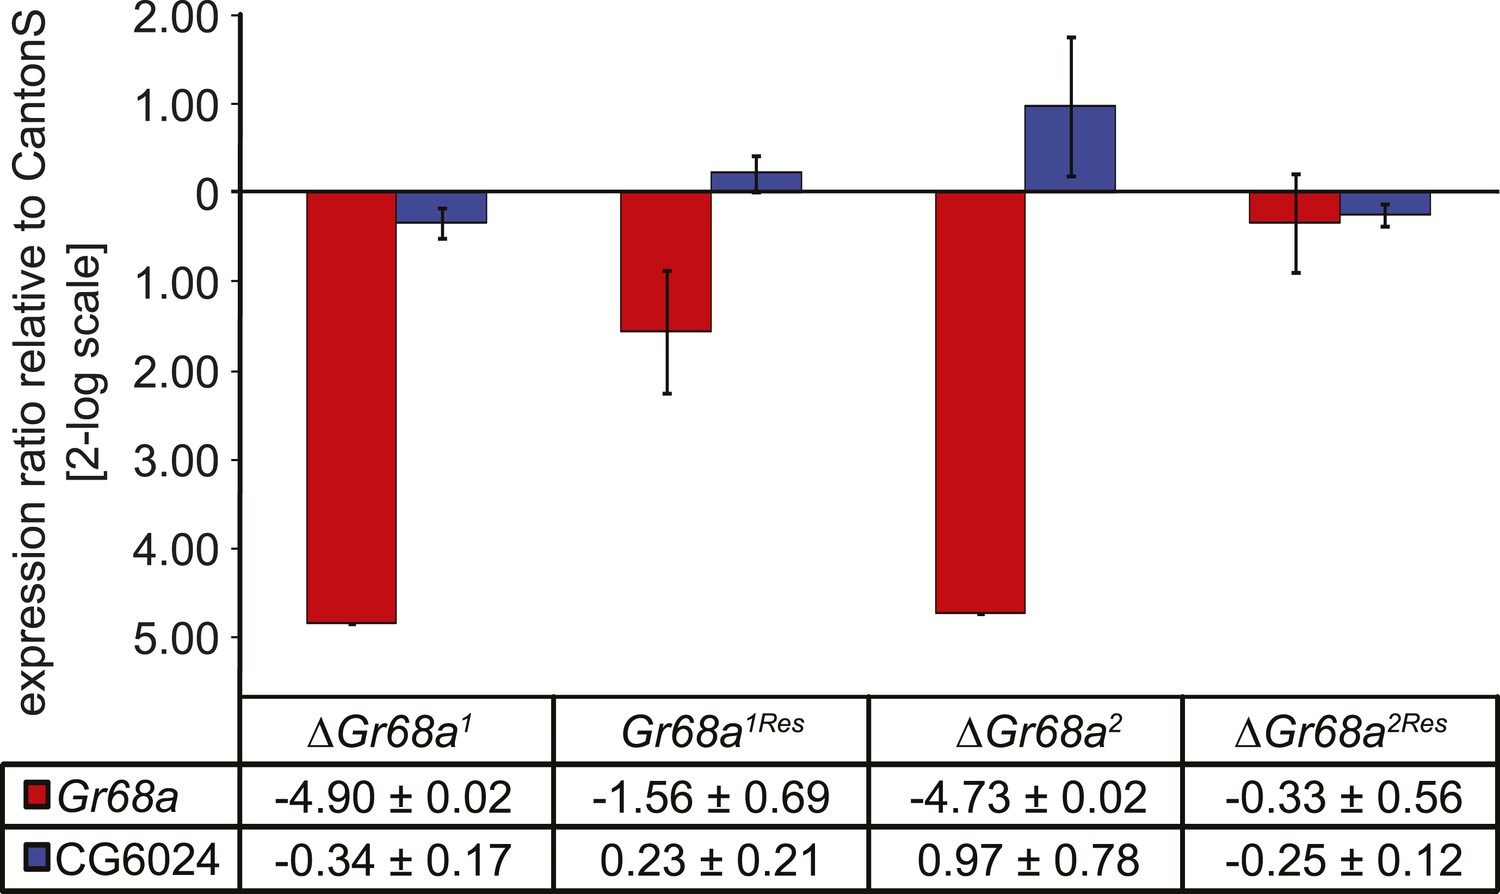
Characterization of ΔGr68a mutant alleles by quantitative PCR.
Gr68a levels are effectively reduced in homologous recombinant mutant (ΔGr68a) and restored in rescue (Gr68Res) alleles. Gene expression levels are shown normalized to wild-type CantonS levels. The expression of CG6024 is unaffected by manipulation of the Gr68a locus. Data show normalized average ± standard deviation (SD), N = 3.
Figure 3 with 6 supplements
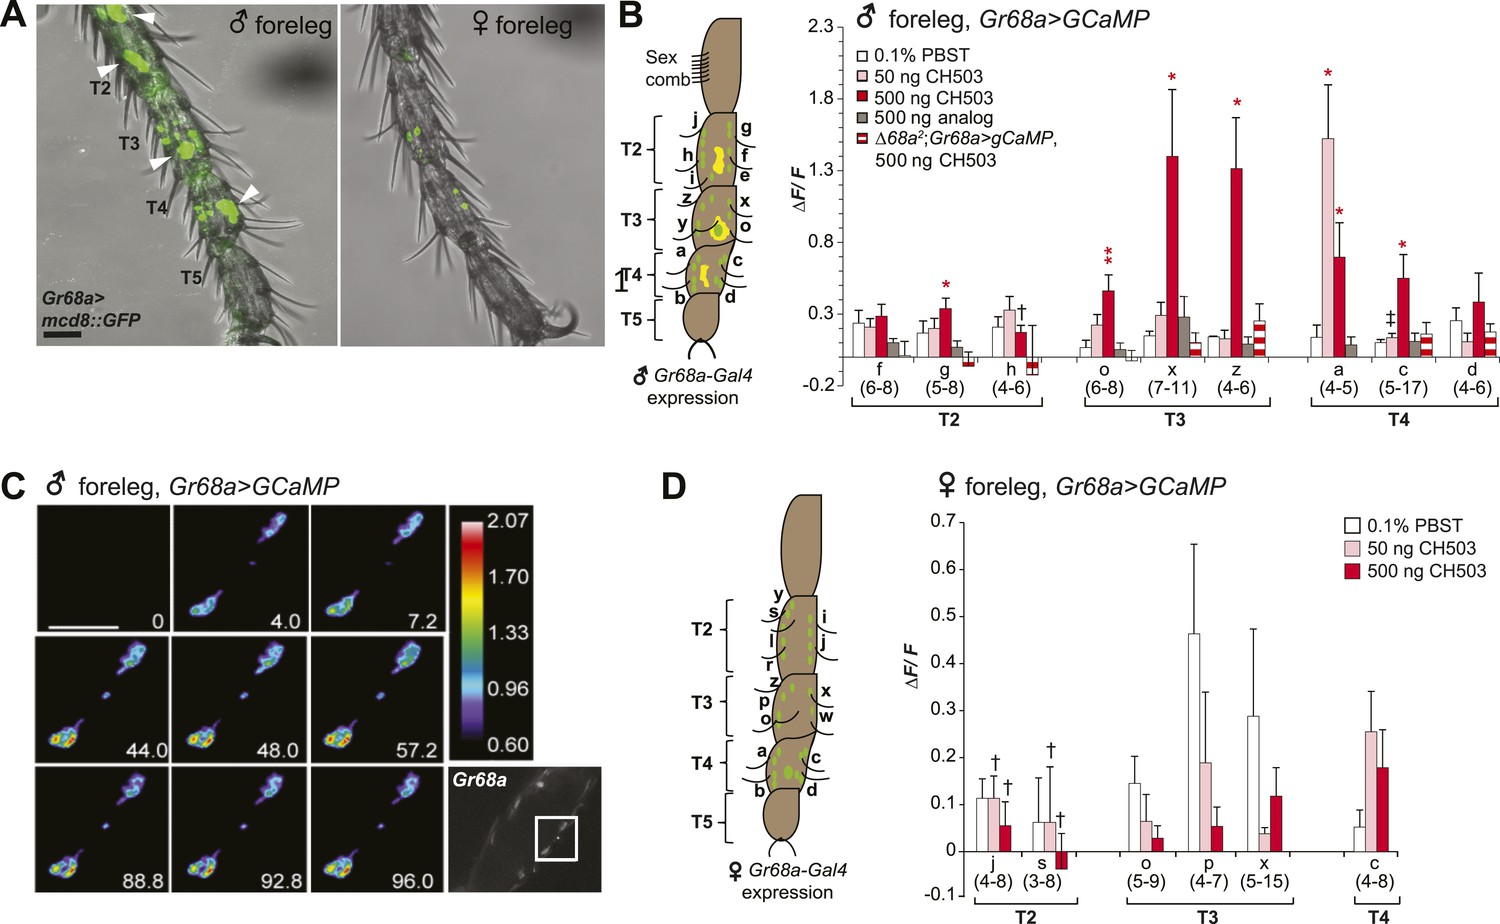
Gr68a is essential for CH503-evoked neuronal responses in the male foreleg.
(A) Visualization of GFP-labeled Gr68a-expressing neurons reveals neuronal and non-neuronal cells (arrowheads) in tarsal segments T2-5 from the male foreleg. Scale bar: 35 μm. (B) Gr68a-expressing neurons in the male foreleg show changes in Ca2+ activity in response to two doses of CH503 (pink, red). The behaviorally inert analog (R)-3-Acetoxy-11, 19-octacosadiyn-1-ol fails to elicit a significant response (gray). No increase in ΔF/F is observed from the forelegs of ΔGr68a-mutant flies (red stripes). Cells are designated according to the schematic (left) showing sensory neurons (green) and non-neural cells (yellow). For each cell type, the averaged response ± SEM and sample size is shown; Student's t-test with unequal variance, *p < 0.05, **p < 0.01. Unless otherwise indicated, statistical power is at least 0.8 for a significance level of 0.05 for the 50 and 500 ng CH503 doses. ‡N = 47 required for power of 0.8; †N = 201 required for 0.8 power. (C) A color-coded time course from 0–96 s showing the response in T2 Gr68a neurons evoked by 500 ng of CH503. The positions of the neurons on the foreleg are shown in the raw fluorescent image (bottom right corner, square). See also Figure 3—figure supplement 1 and Video 1. Scale bar: 10 μm. (D) Gr68a-expressing neurons on the female foreleg do not show a statistically significant response to (R, Z, Z)-CH503. Student's t-test with unequal variance, p > 0.05 for all cells tested. Error bars indicate SEM; sample sizes are shown below each cell type. Unless otherwise indicated, statistical power is at least 0.8 for a significance level of 0.05 for the 50 and 500 ng CH503 doses. †N ∼ 100 needed to achieve 0.8 power.
Figure 3—figure supplement 1
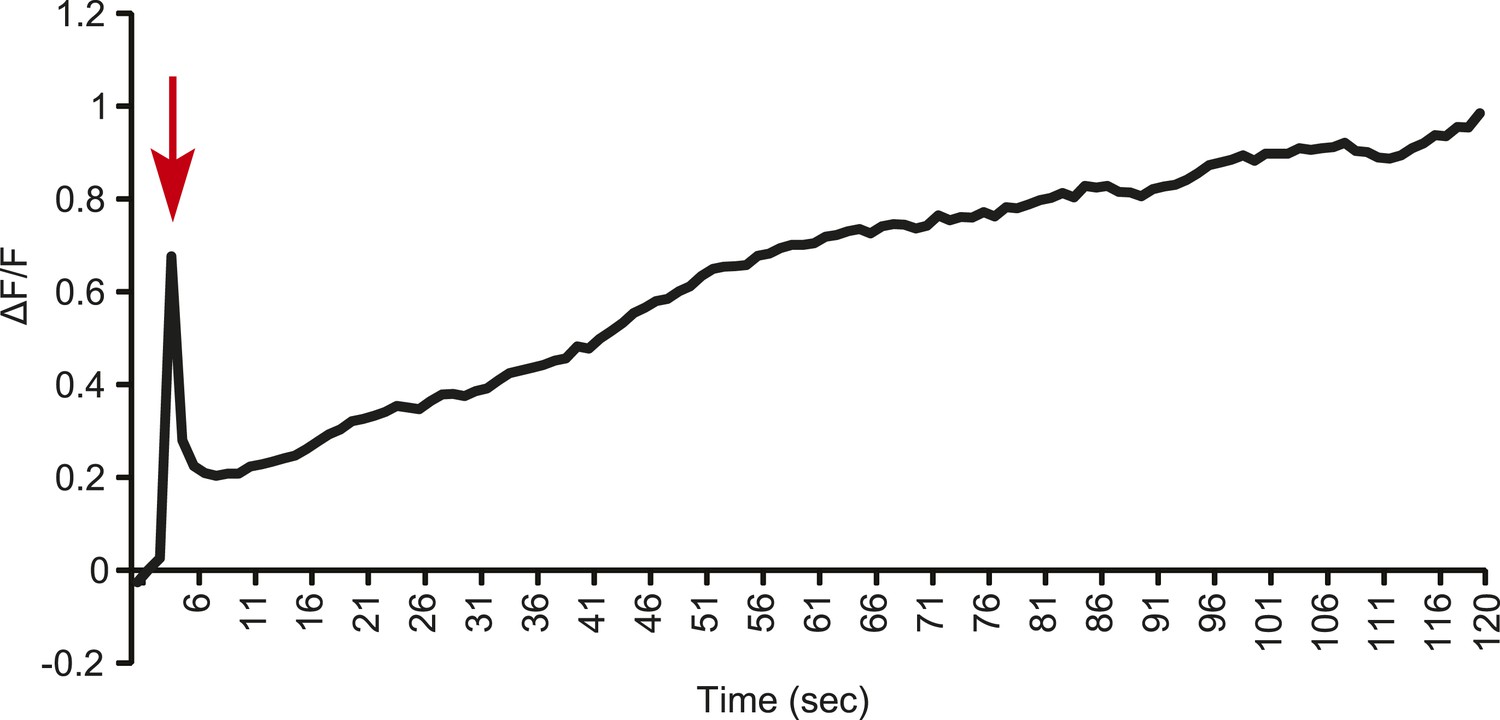
Line graph representation showing the tonic response of a T2 Gr68a neuron upon stimulation with 500 ng of CH503.
Red arrow indicates the time at which the stimulus was added.
Figure 3—figure supplement 2
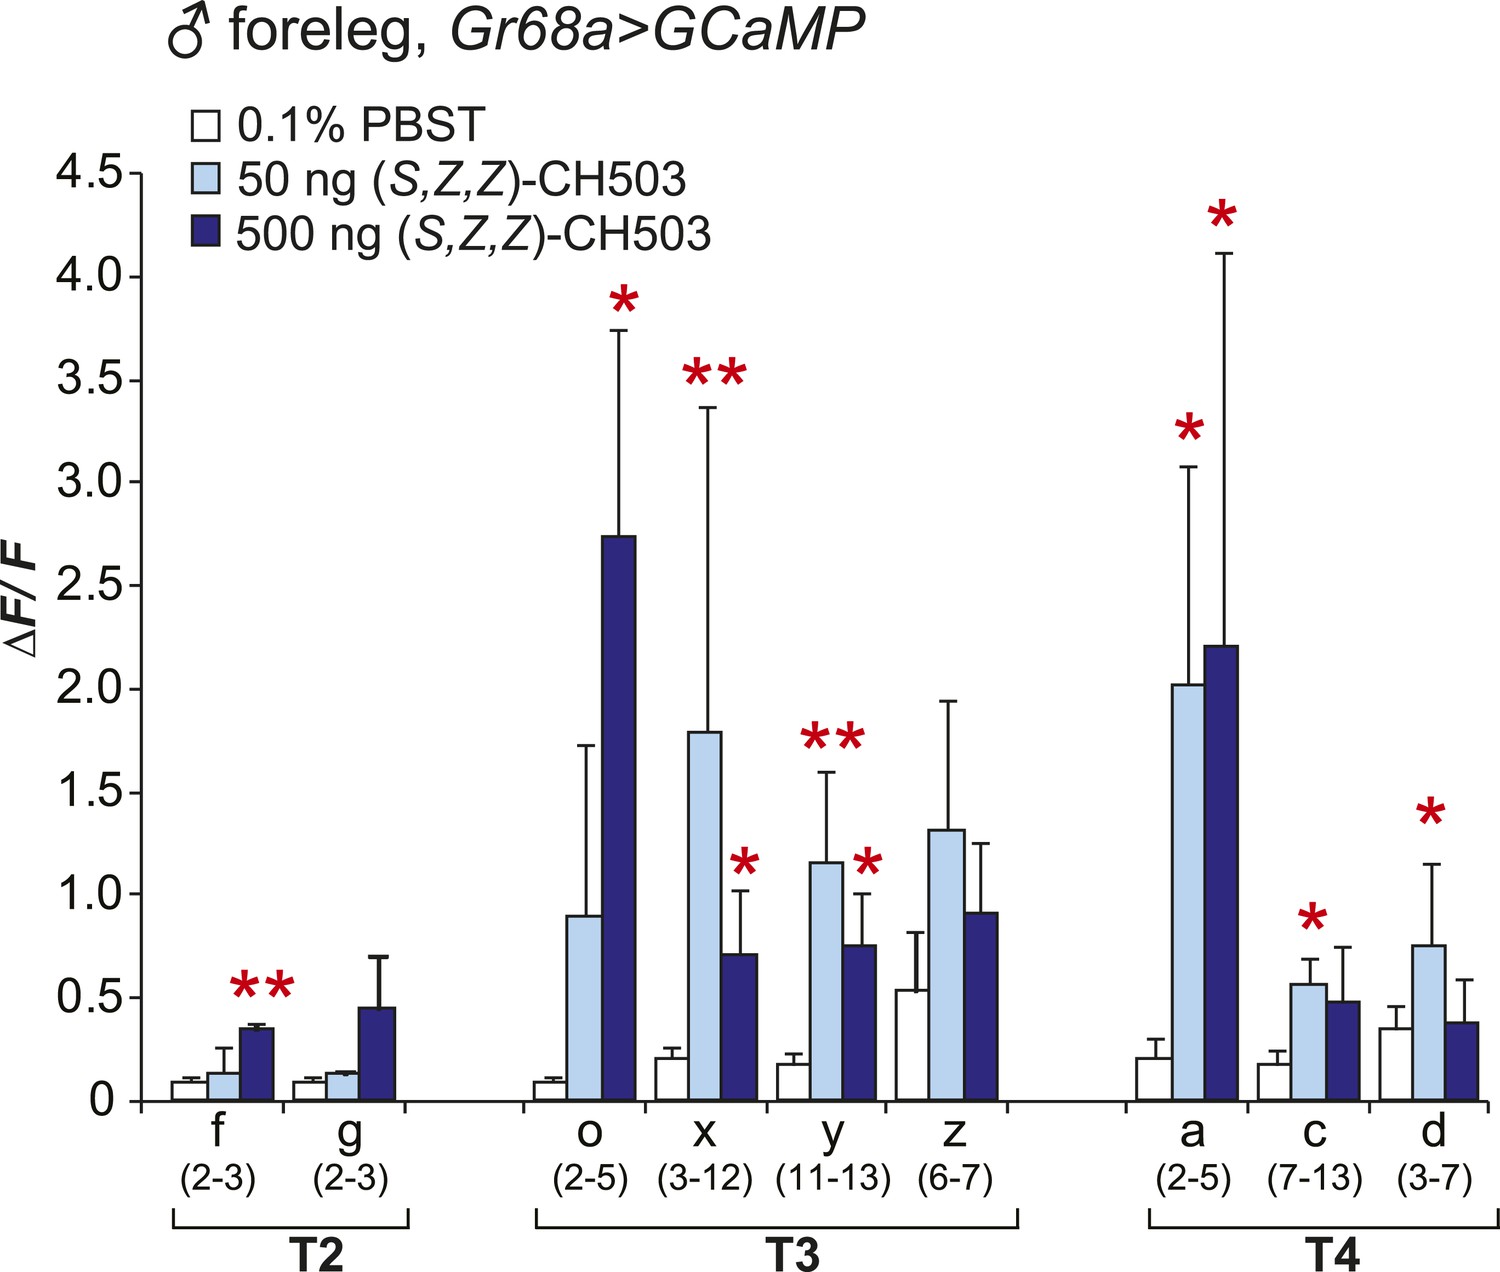
Physiological responses of male Gr68a neurons to (S, Z, Z)-CH503.
An increase in intracellular Ca2+ levels was observed in Gr68a-expressing neurons upon application of (S, Z, Z)-CH503. Two cells (o, x) showed a higher ΔF/F increase in response to 500 ng of (S, Z, Z)-CH503 (dark blue) compared with the natural pheromone applied at the same dose (Figure 3B, red). Maximum ΔF/F values plateau at 50 ng of (S, Z, Z)-CH503 in 5 cells (x, y, a, c, d). The averaged response for each cell type ± SEM and sample size is shown; Student's t-test with unequal variance, *p < 0.05, **p < 0.01.
Figure 3—figure supplement 3
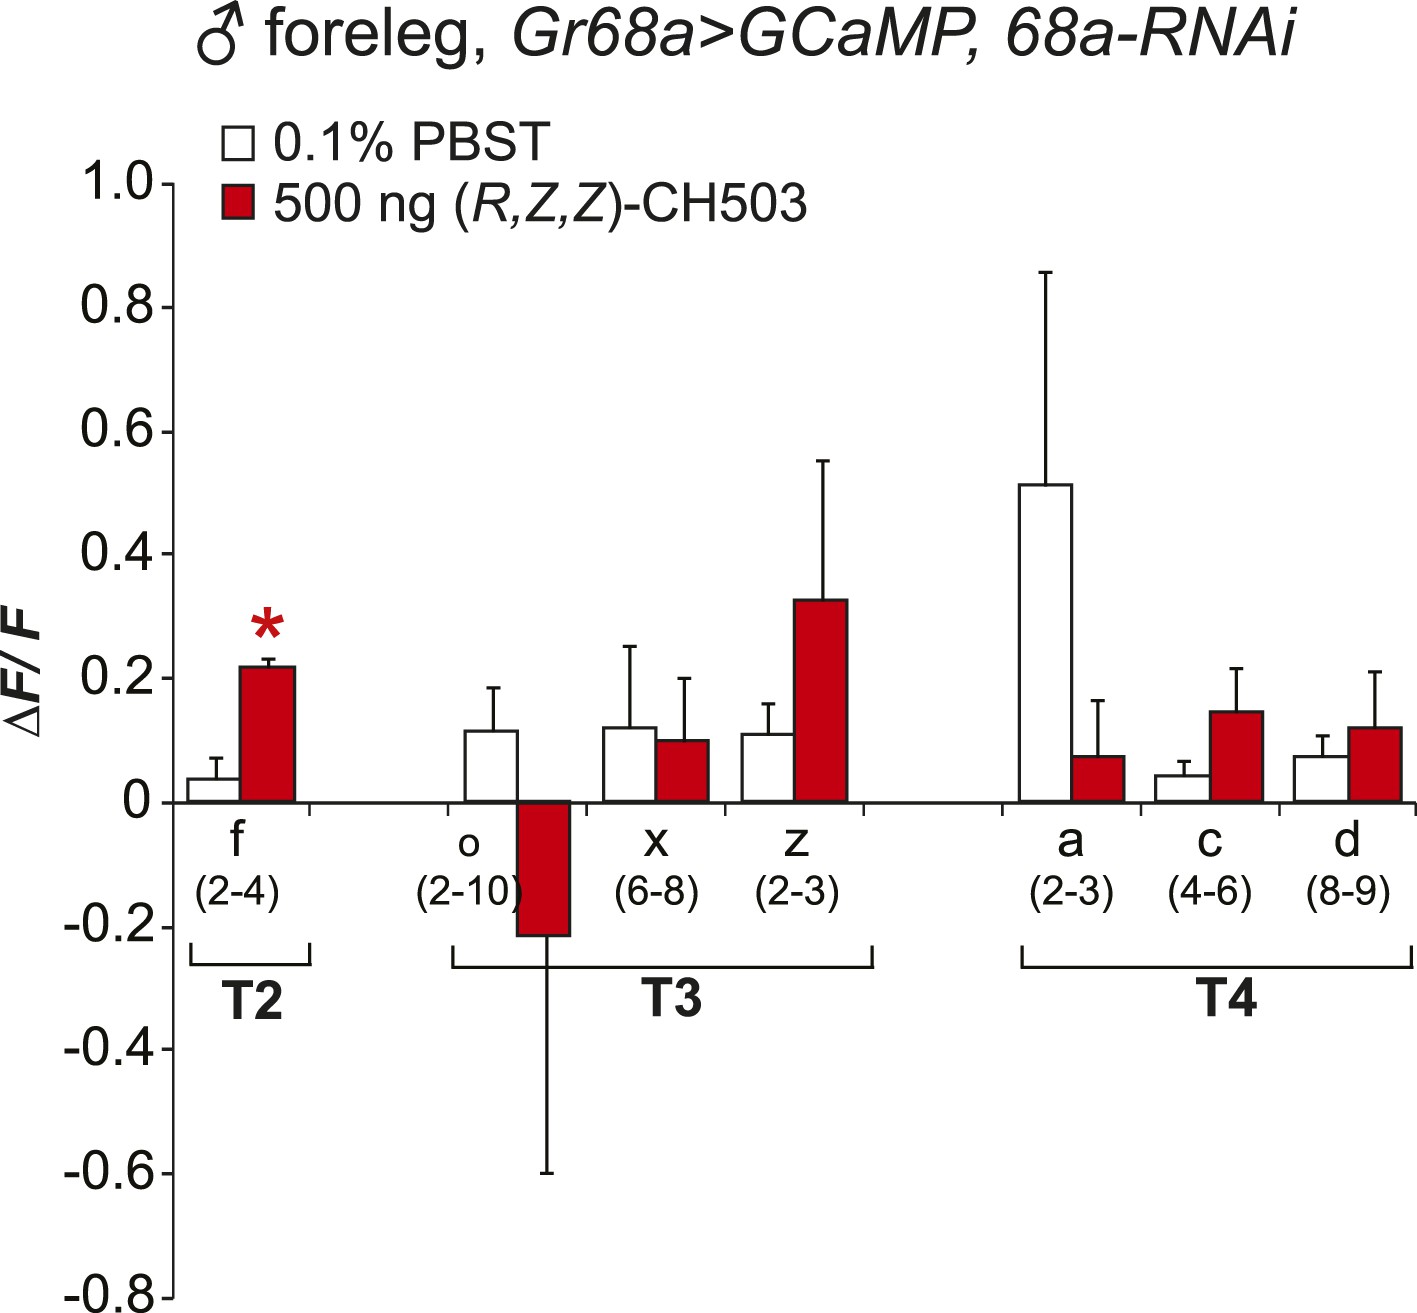
Physiological responses of Gr68a neurons upon RNAi-mediated silencing of Gr68a expression.
RNAi-mediated suppression of Gr68a severely reduces neural responses induced by (R, Z, Z)-CH503 (red). In most cells, the response to the pheromone was not distinguishable from the response to buffer (white), with the exception of cell f. The averaged response for each cell type ± SEM and sample size is shown; Student's t-test with unequal variance, *p = 0.016.
Figure 3—figure supplement 4
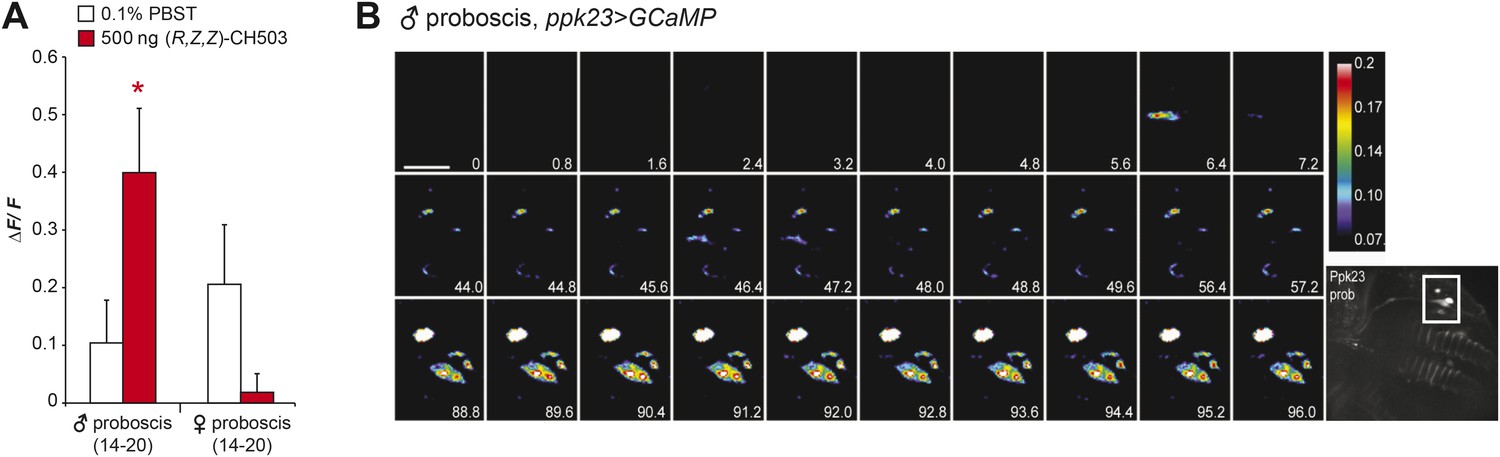
Physiological responses of ppk23 proboscis neurons to (R, Z, Z)-CH503.
(A) Application of 500 ng of CH503 elicited a significant ΔF/F increase in ppk23-expressing neurons on the male proboscis (red). In contrast, ppk23-expressing neurons from the female proboscis did not show a significant change in ΔF/F. The averaged response for each cell type ±SEM and sample size is shown; Student's t-test, *p = 0.012. (B) A color-coded time course from 0 to 96 s showing the response of ppk23 neurons on the proboscis to 500 ng of CH503. Heterogeneity in response times is apparent amongst the different cell types with some cells responding intensely at 6.4 s and others only ∼88 s after CH503 application. See also Video 2. The positions of the neurons on the proboscis are shown in the raw fluorescent image (bottom right corner). Scale bar: 10 μm.
Figure 3—figure supplement 5
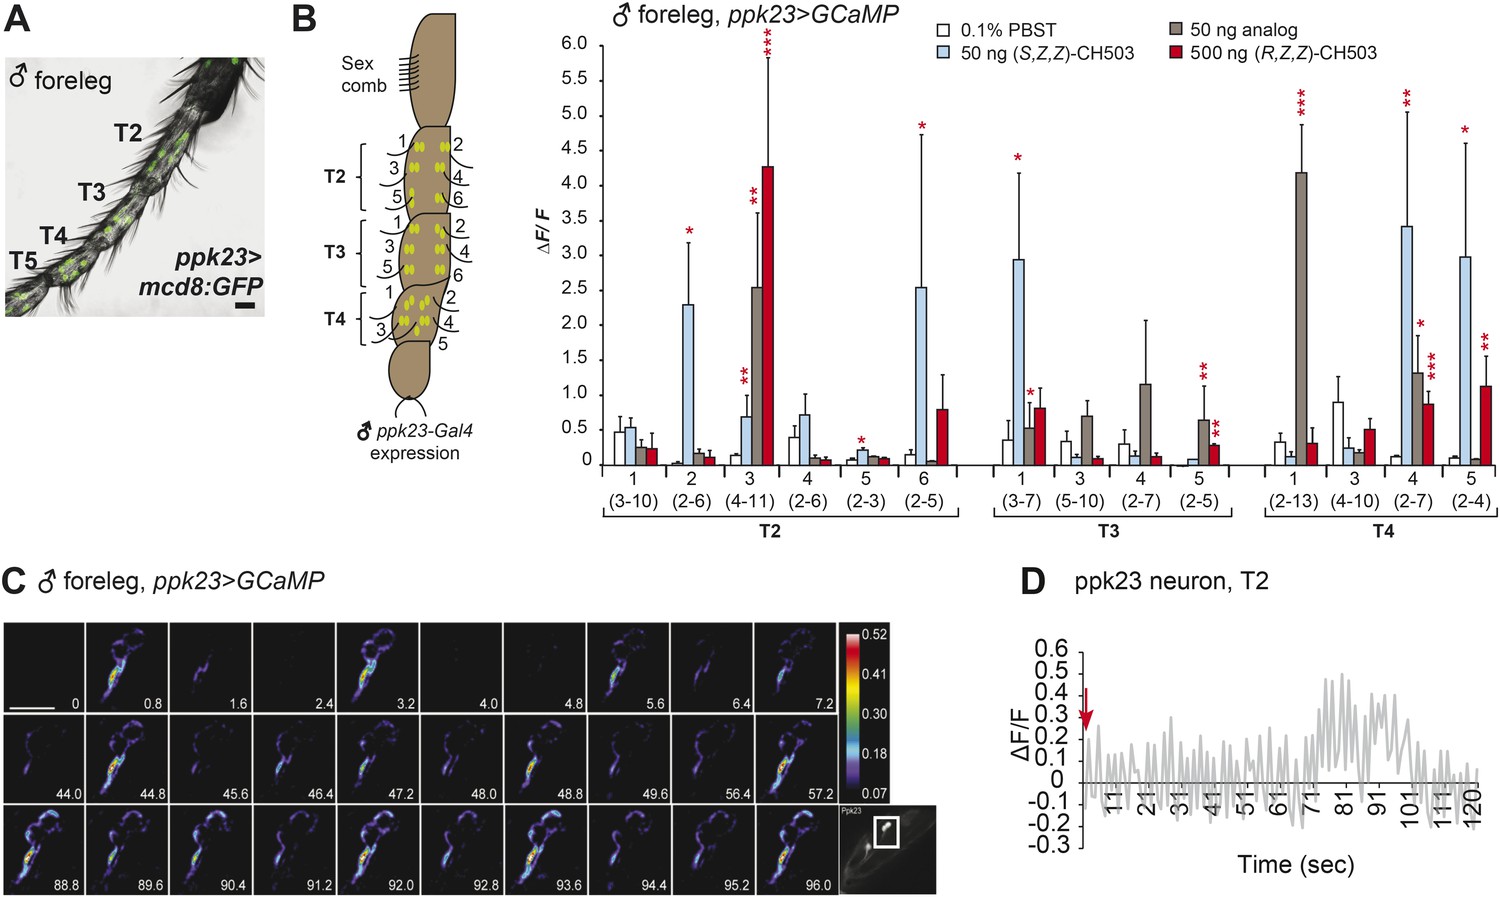
Physiological responses of ppk23 leg neurons to (R, Z, Z)-CH503.
(A) Visualization of GFP-labeled ppk23-expressing neurons in the male foreleg in tarsal segments T2-5. Scale bar: 35 μm. (B) Ppk23-expressing neurons on tarsal segments T2-5 were stimulated with 50 ng of (S, Z, Z)-CH503, an equivalent dose of the behaviorally inactive analog (S)-3-acetoxy-11-octacosen-1-ol or 500 ng of (R, Z, Z)-CH503. A robust increase in ΔF/F specific to (S, Z, Z)-CH503 was elicited from 2 cells on T2 and 1 cell on T3. Several cells in each segment displayed a robust response to the analog. The averaged response for each cell type ± SEM and sample size is shown, Student's t-test, *p < 0.05, **p < 0.01, ***p < 0.001. (C) A color-coded time course from 0 to 96 s showing the response in ppk23-expressing neurons on the male foreleg to 500 ng of CH503. The cells exhibit a bursting response consisting of fluorescence intensity increasing at periodic intervals for the duration of the recording. See also Video 3. The positions of the neurons on the foreleg are shown in the raw fluorescent image (bottom right corner). Scale bar: 10 μm. (D) Line graph representation showing the oscillatory response of a T2 ppk23 neuron upon stimulation with 500 ng of CH503. Red arrow indicates the time point at which the stimulus was added.
Figure 3—figure supplement 6
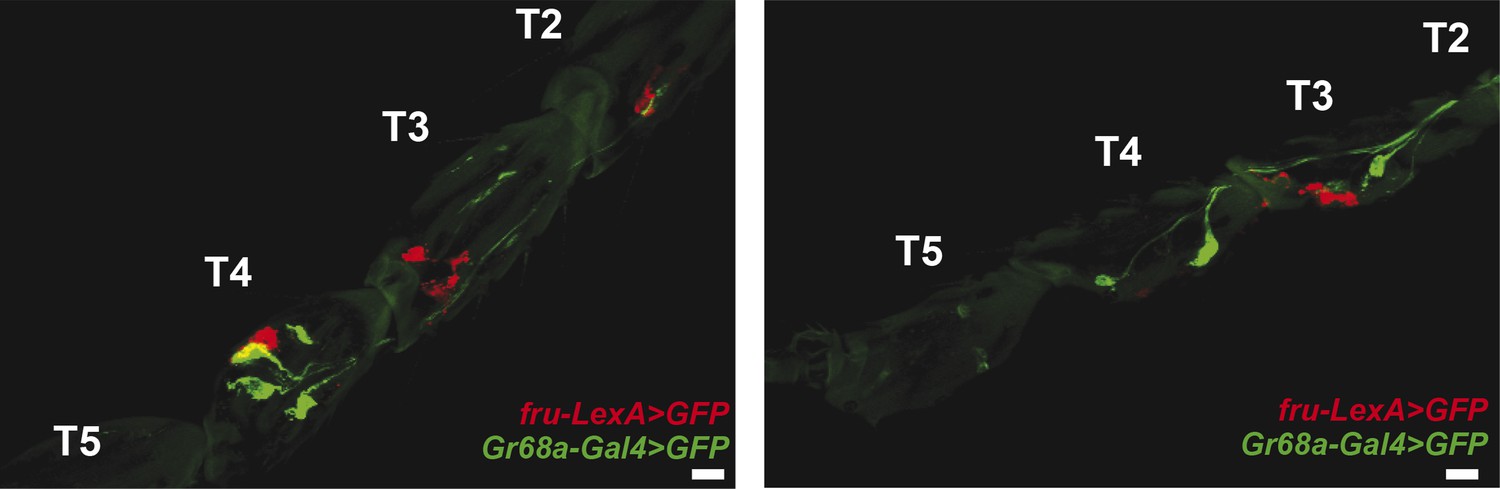
Gr68a-Gal4 and fruitless (fru)-expression in the foreleg do not co-localize.
Pearson's coefficients: 0.06 (left) and 0.02 (right); scale bar: 50 μm.
Figure 4 with 4 supplements
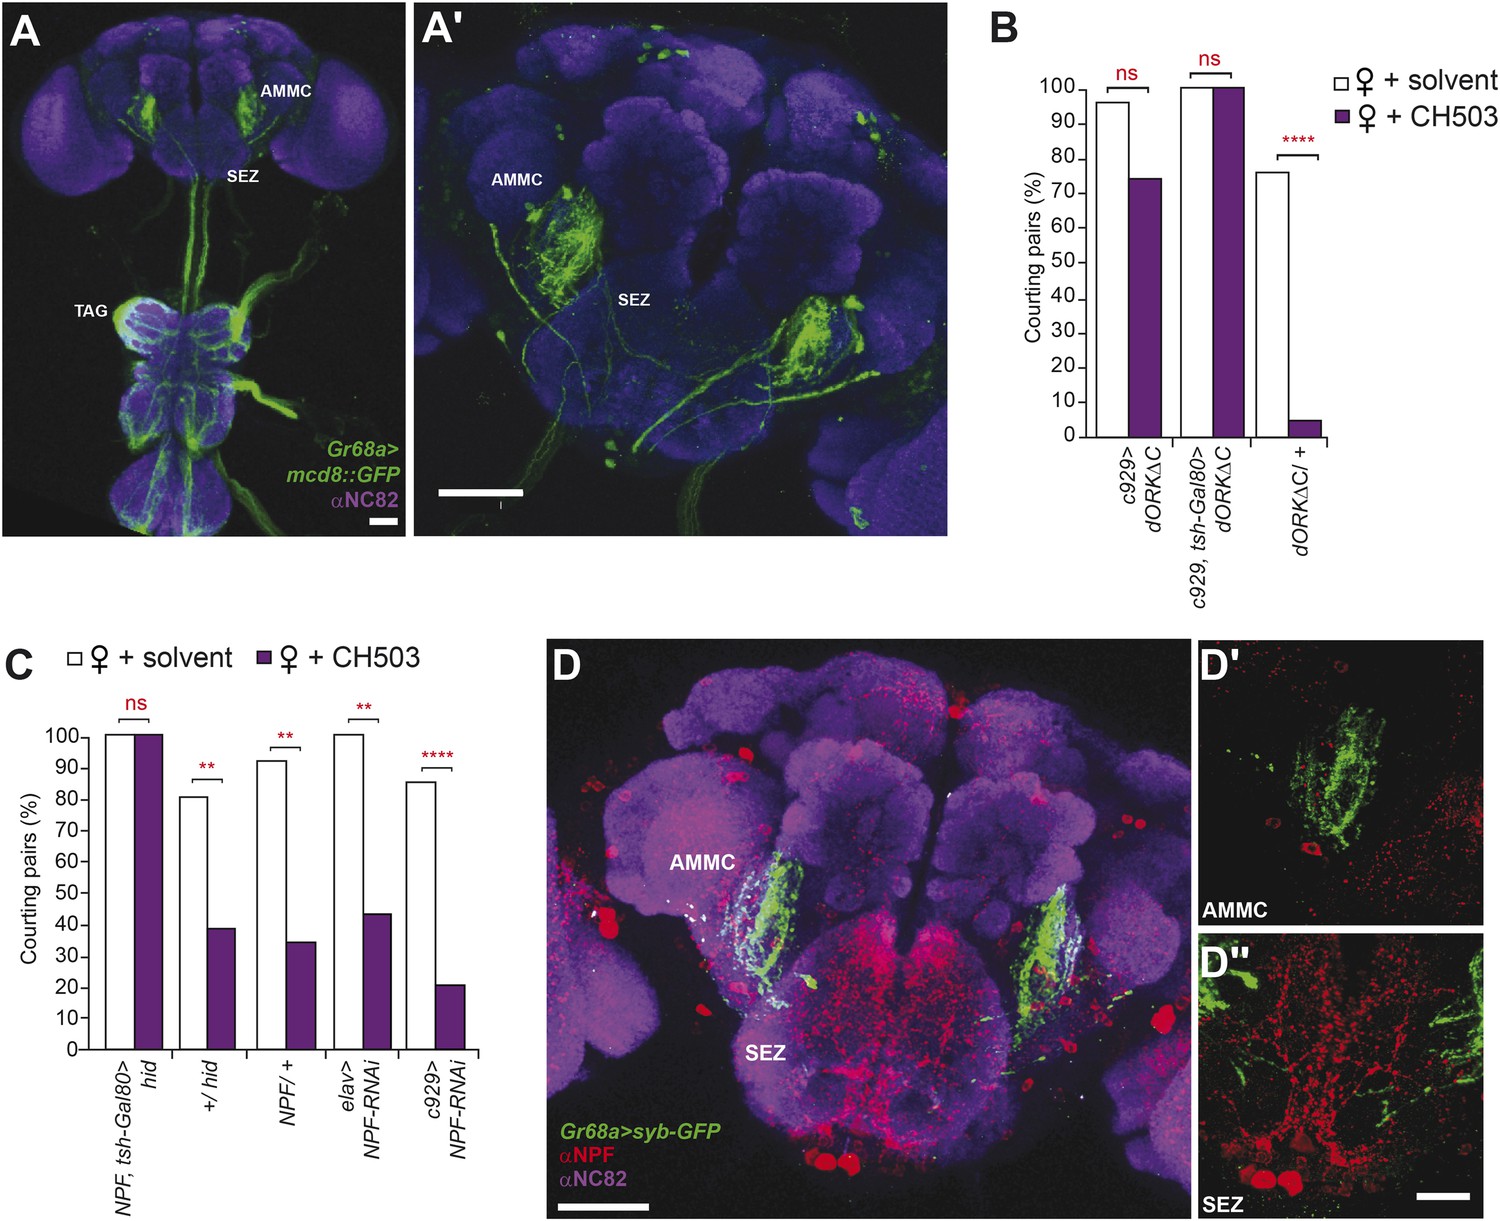
Higher order neural circuits essential for processing CH503.
(A) Gr68a-Gal4-labeled afferent projections extend to the thoracico-abdominal ganglia (TAG), subesophageal zone (SEZ), and antennal mechanosensory and motor center (AMMC). Image represents a maximum intensity Z-series projection. Scale bar A: 25 μm; A′: 50 μm. (B) Inhibition of electrical activity in c929-Gal4-labeled neurons with UAS-dORKΔC, an inwardly rectifying K+ channel, resulted in high courtship levels in the presence of CH503. Suppressing Gal4 expression in the ventral cord with a tsh-Gal80 transgene (hence, limiting dORKΔC expression primarily to the central brain) failed to restore sensitivity to CH503. No change in CH503 response was observed in the absence of the c929-Gal4 driver. N = 23–25, Fisher's exact probability test, ns: not significant, ****p < 0.0001. (C) Ablation of central brain neural circuits associated with NPF abolished the courtship suppression response to CH503. The courtship behavior of genetic controls was unaffected. Silencing NPF expression in all neural cells (using elav-Gal4) or in peptidergic neurons (using c929-Gal4) did not alter flies' sensitivity to CH503. N = 14–33, Fisher's exact probability test, ns: not significant, **p < 0.01, ****p < 0.0001. (D) NPF-expressing processes are closely apposed to Gr68a-Gal4 synaptic terminals labeled with synaptobrevin-GFP (syb-GFP) in the AMMC (D′) and SEZ (D′′). No co-localization is observed (Pearson's coefficient: 0.01). Image represents a maximum intensity Z-series projection. Scale bar D: 50 μm; D′, D′′: 20 μm.
Figure 4—figure supplement 1
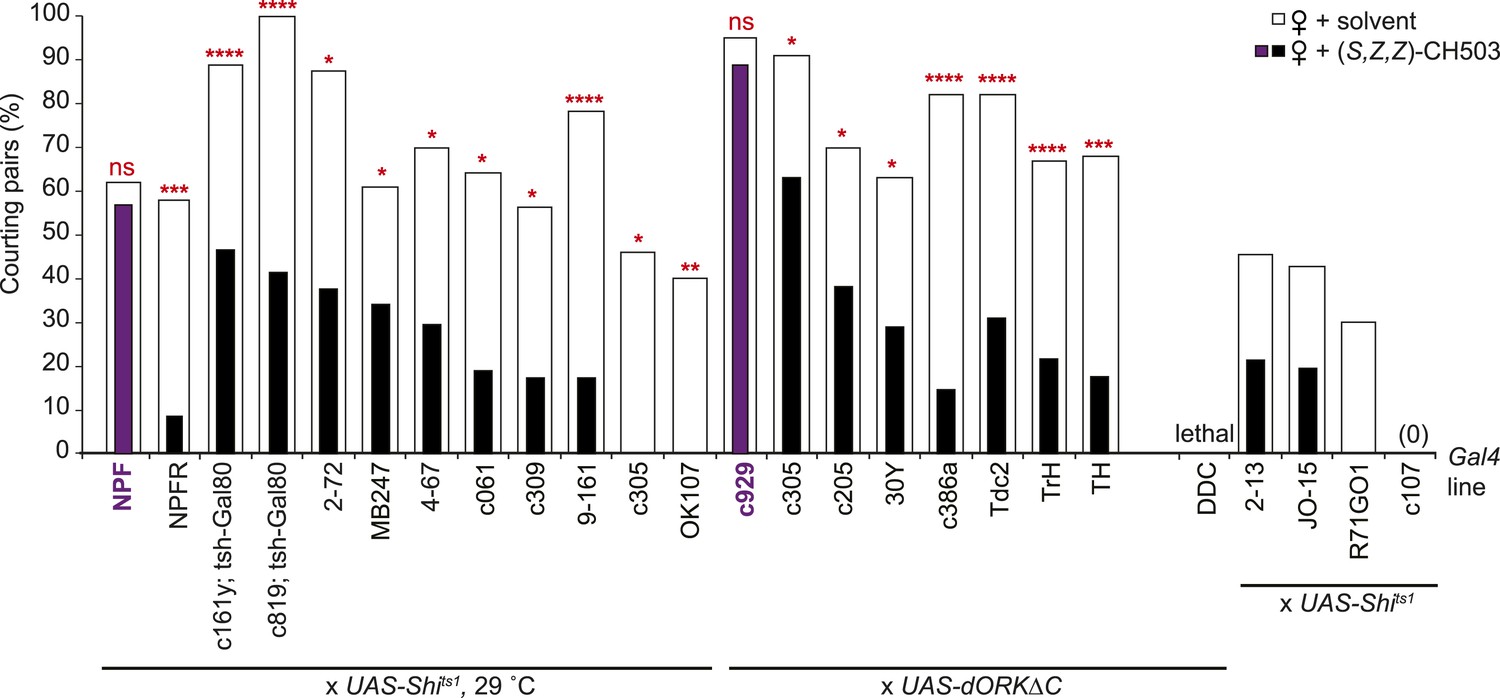
Central brain screen to identify CH503-processing circuits.
Inactivation of neural activity by expression of the temperature-sensitive Shibire transgene (UAS-Shits1) or UAS-dORKΔC within NPF- and c929-Gal4 circuits resulted in a loss of sensitivity to CH503 (purple vs white). It was not possible to assess some Gal4 lines (far right) due to low activity or lethality upon suppression of neural activity. N = 8–24 for each line, Fisher's exact probability test, ns: not significant; *p < 0.05; **p < 0.01; ***p < 0.001; ****p < 0.0001.
Figure 4—figure supplement 2
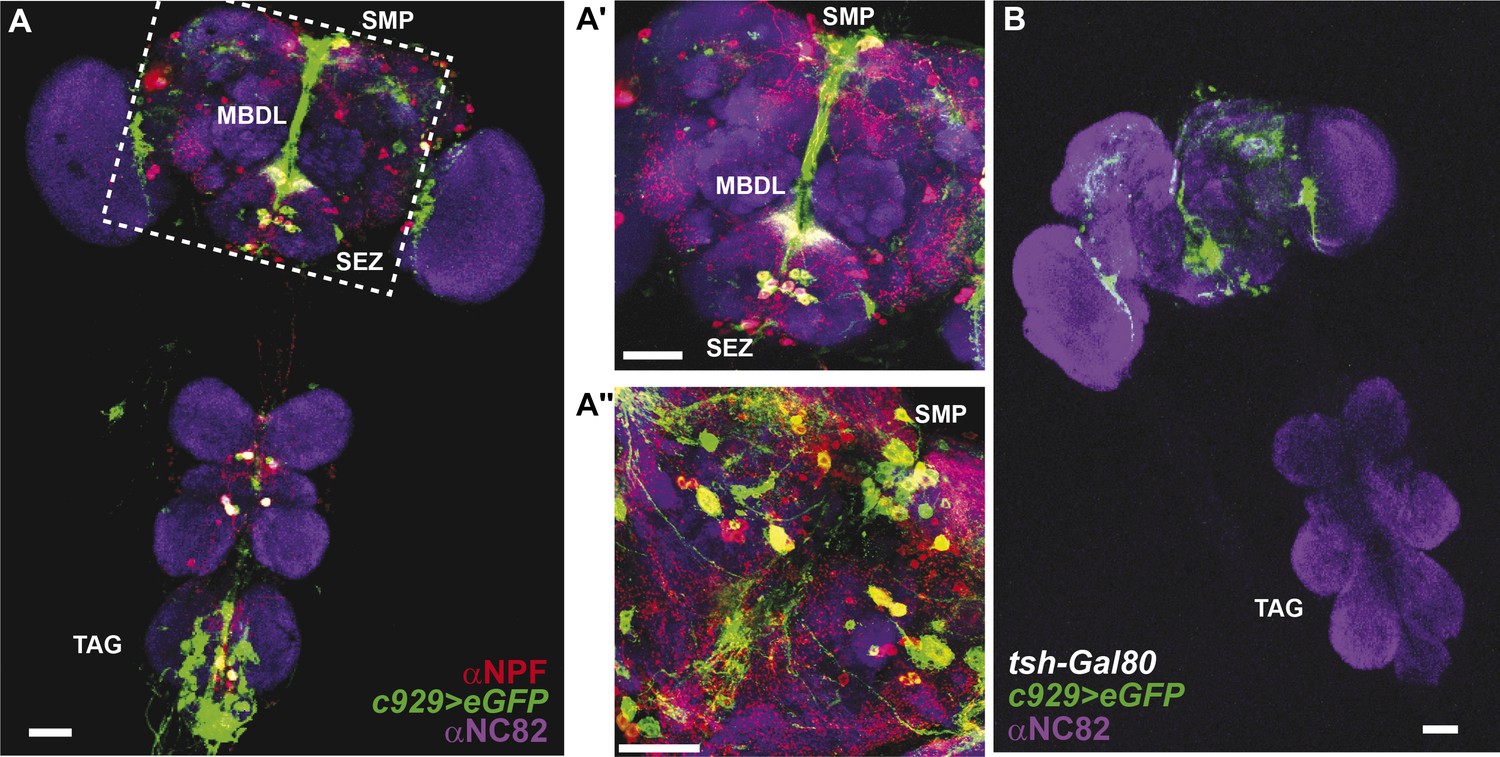
Co-expression of anti-NPF immunostaining with c929-Gal4-directed GFP expression.
(A) Co-expression is observed in cell bodies housed in the thoracico-abdominal ganglia (TAG), subesophageal zone (SEZ), superior medial protocerebrum (SMP), and processes along the median bundle (MBDL). (A′) Magnification of square in A. (A′′) Z-section from another depth. Images represent maximum intensity Z-series projections. Scale bar A: 25 μm; A′ and A′′: 50 μm. (B) The tsh-Gal80 transgene restricts c929-Gal4 expression to the brain Scale bar: 25 μm.
Figure 4—figure supplement 3
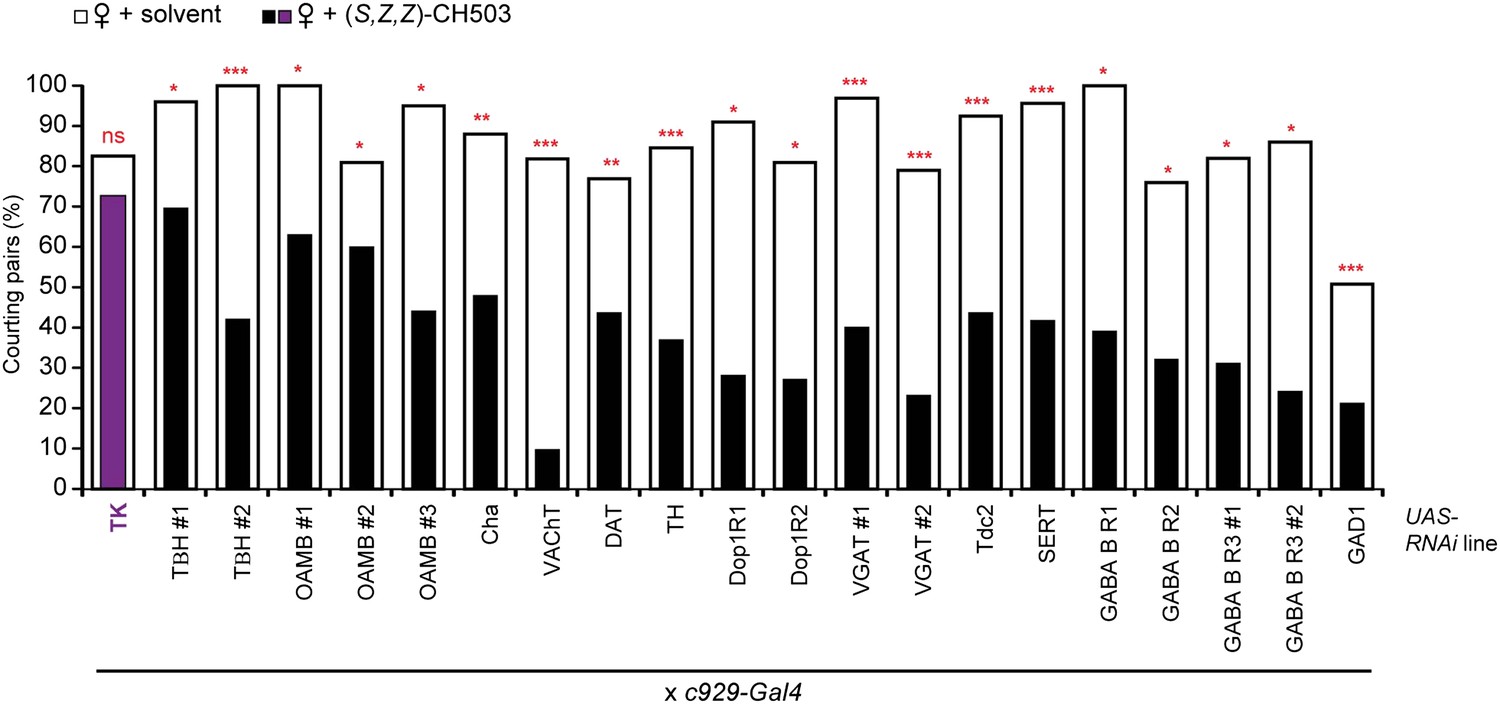
Screen of tachykinin and small transmitter systems within the c929-Gal4 circuit.
RNAi-mediated silencing of tachykinin (TK) expression within the c929-Gal4 circuit inhibits sensitivity to (S, Z, Z)-CH503 (purple vs white). RNAi manipulation of other neurotransmitter systems did not have a significant effect on CH503-detection (black vs white). N = 21–35, Fisher's exact probability test, ns: not significant; **p < 0.01; ***p < 0.001.
Figure 4—figure supplement 4
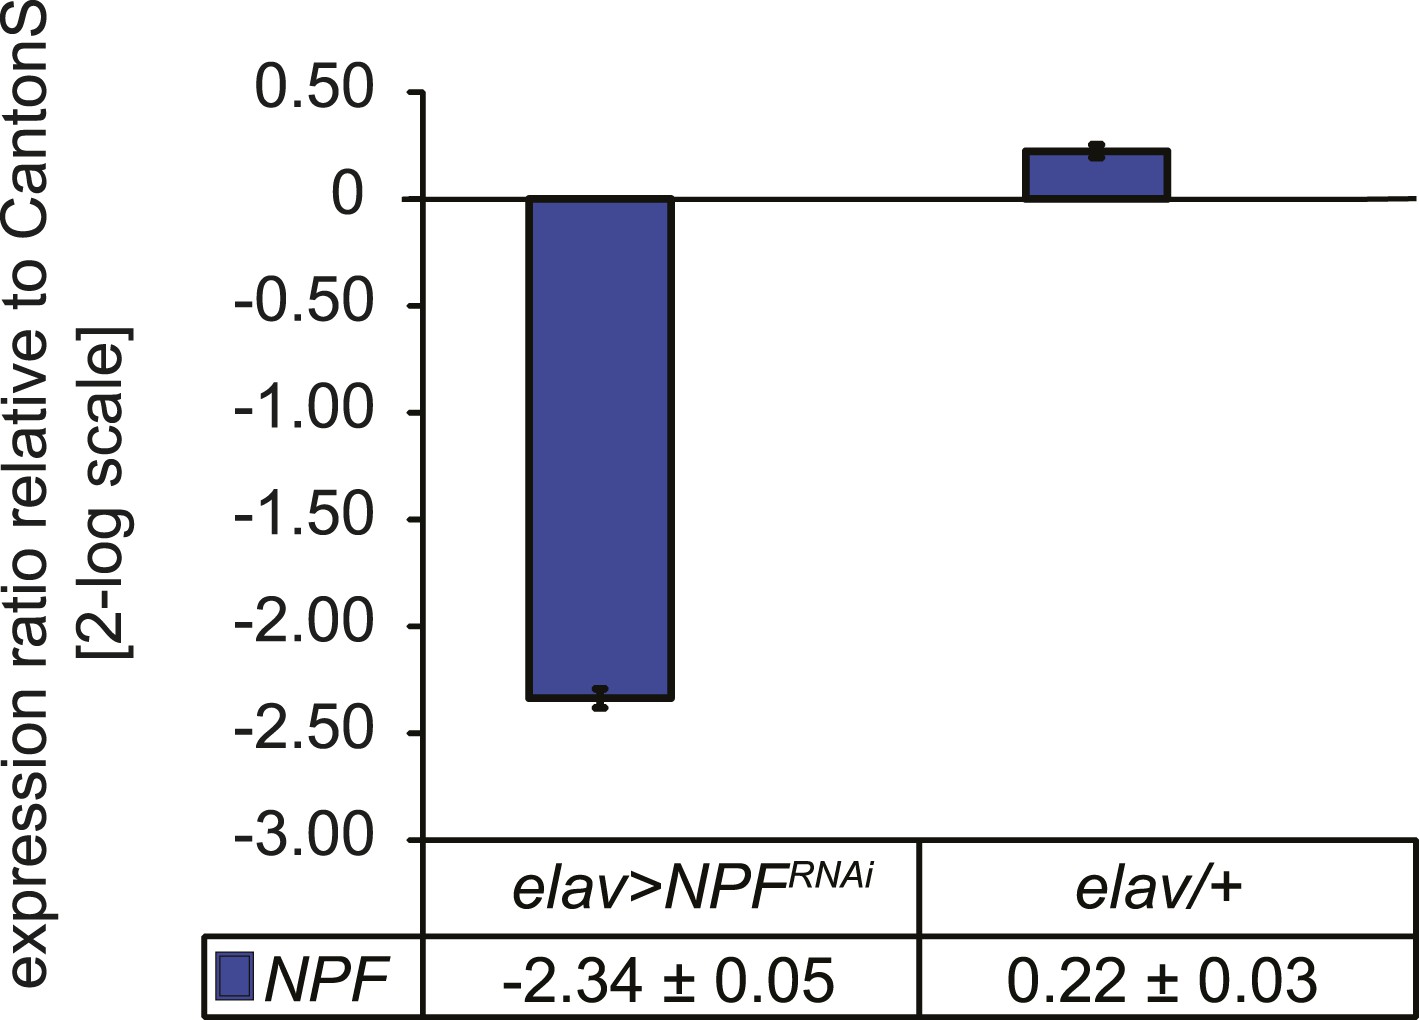
Characterization of NPF transcript levels.
Quantitative PCR analysis of NPF transcript levels from heads of elav>NPF-RNAi and elav/+ control flies. RNAi induces a 5.3-fold reduction of NPF transcript levels. Gene expression levels are shown normalized to wildtype CantonS levels. Data show normalized average ± standard deviation (SD), N = 3.
Figure 5 with 3 supplements
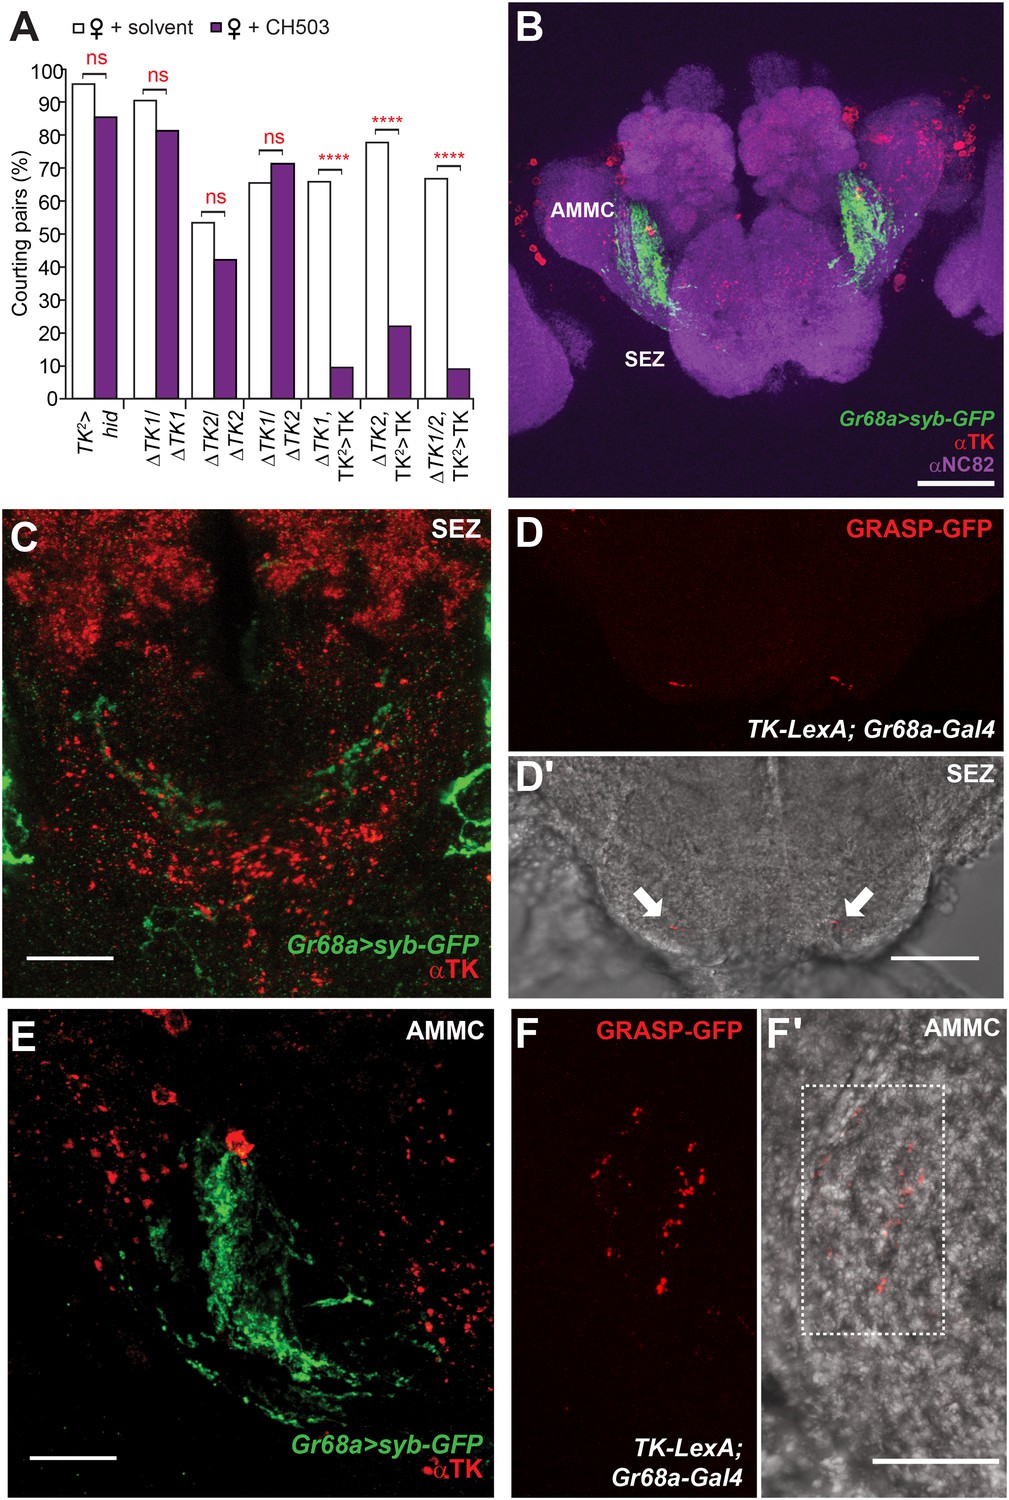
Tachykinin-expressing cells in the SEZ are a second order circuit for Gr68a neurons.
(A) Ablation of TK-expressing circuits using two independent Gal4 drivers (TK2 and TK3) removed sensitivity to CH503. Homozygous or trans-heterozygous ΔTK deletion mutants also exhibit a loss of sensitivity to CH503. Rescuing TK expression in two different mutant backgrounds restored the behavioral response to CH503. See Figure 5—figure supplement 2 for parental controls. N = 15–31, Fisher's exact probability test, ns: not significant, ****p < 0.0001. (B, C, E) TK-expressing cells are closely apposed to Gr68a-Gal4 synaptic terminals labeled with synaptobrevin-GFP (syb-GFP) in the SEZ (C) and AMMC (E). No co-localization is observed (Pearson's coefficient: 0). Image represents a maximum intensity Z-series projection. (D, D′) Positive GRASP-GFP signal in the SEZ indicates synaptic connectivity between Gr68a neurons and TK processes. The GFP signal is overlaid on a phase-contrast image of the tissue (arrows). (F, F′) Positive GRASP-GFP signal in the AMMC indicates synaptic connectivity between Gr68a neurons and TK processes. The GFP signal is overlaid on a phase-contrast image of the tissue (rectangle). Scale bar B: 50 μm; all other scale bars: 20 μm.
Figure 5—figure supplement 1
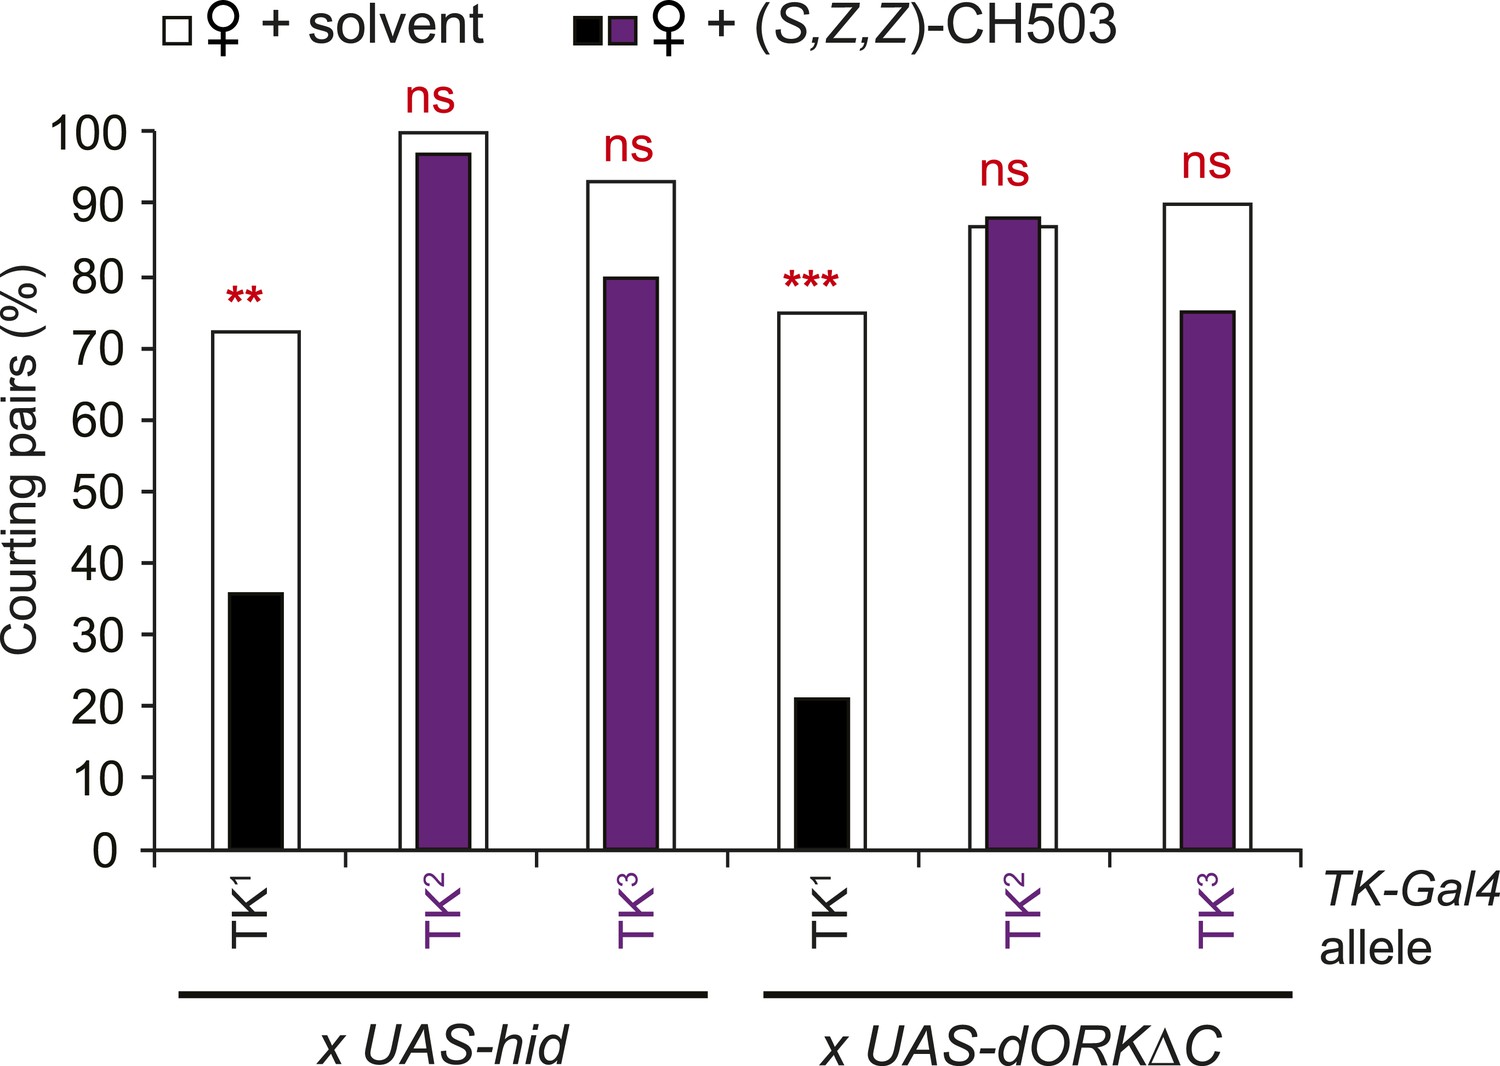
Tachykinin is essential for CH503 detection.
Three different TK-Gal4 drivers were tested for their contribution to CH503 processing. Cell ablation or inactivation of neural activity using TK2-Gal4 and TK3-Gal4 (purple vs white) but not TK1-Gal4 (black vs white) removed sensitivity to (S, Z, Z)-CH503. N = 28–36, Fisher's exact probability test, ns: not significant; **p < 0.01; ***p < 0.001.
Figure 5—figure supplement 2
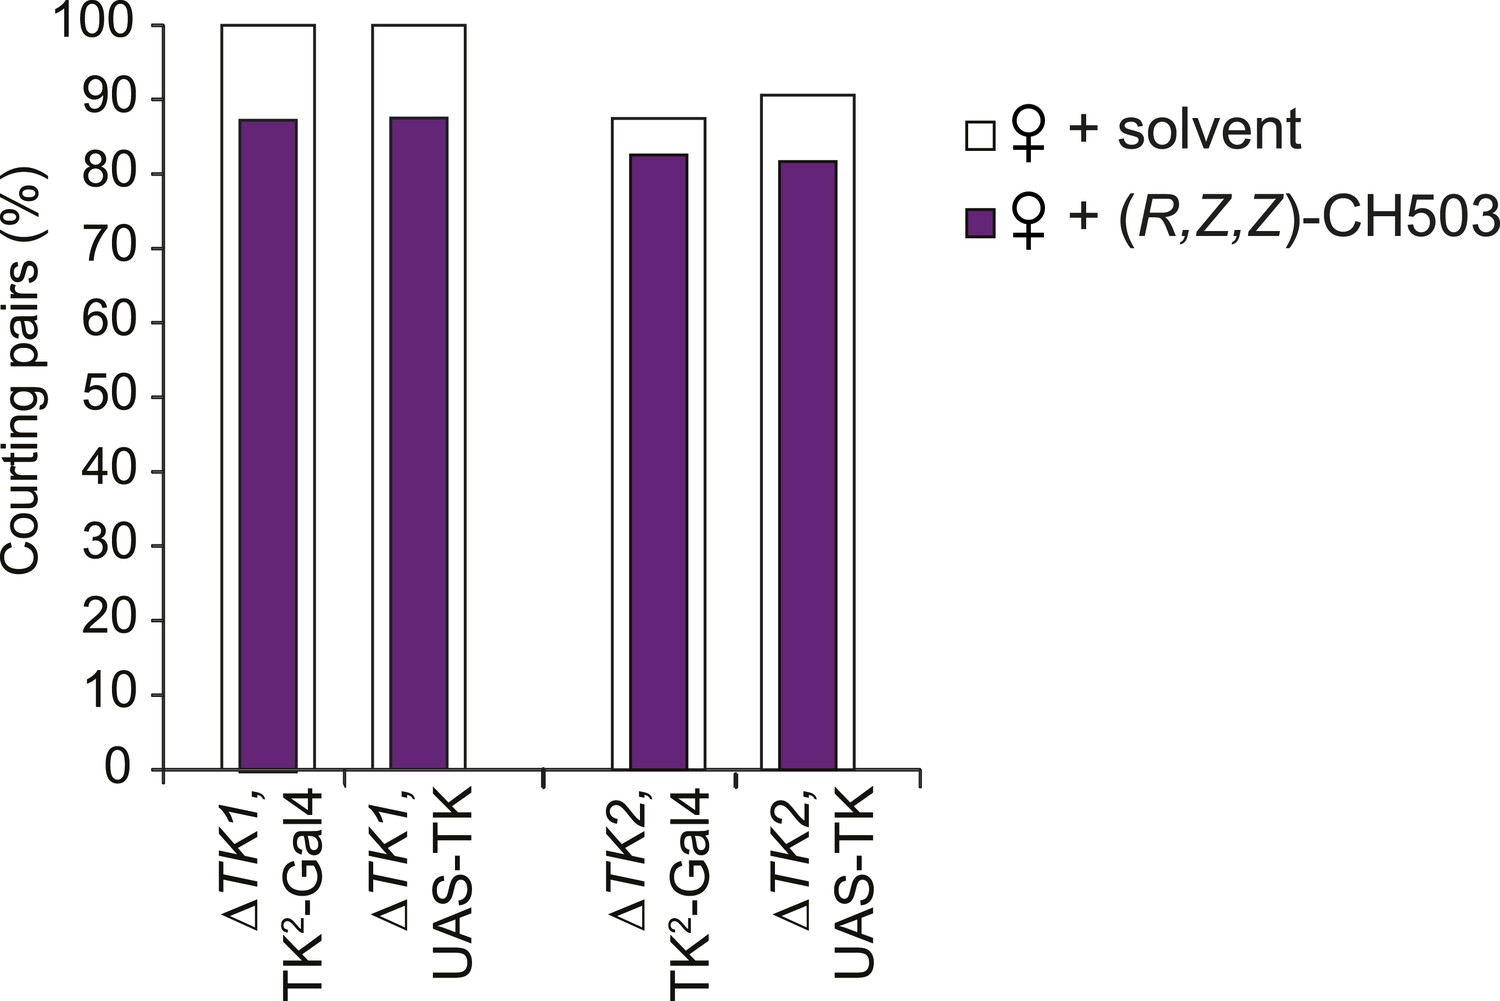
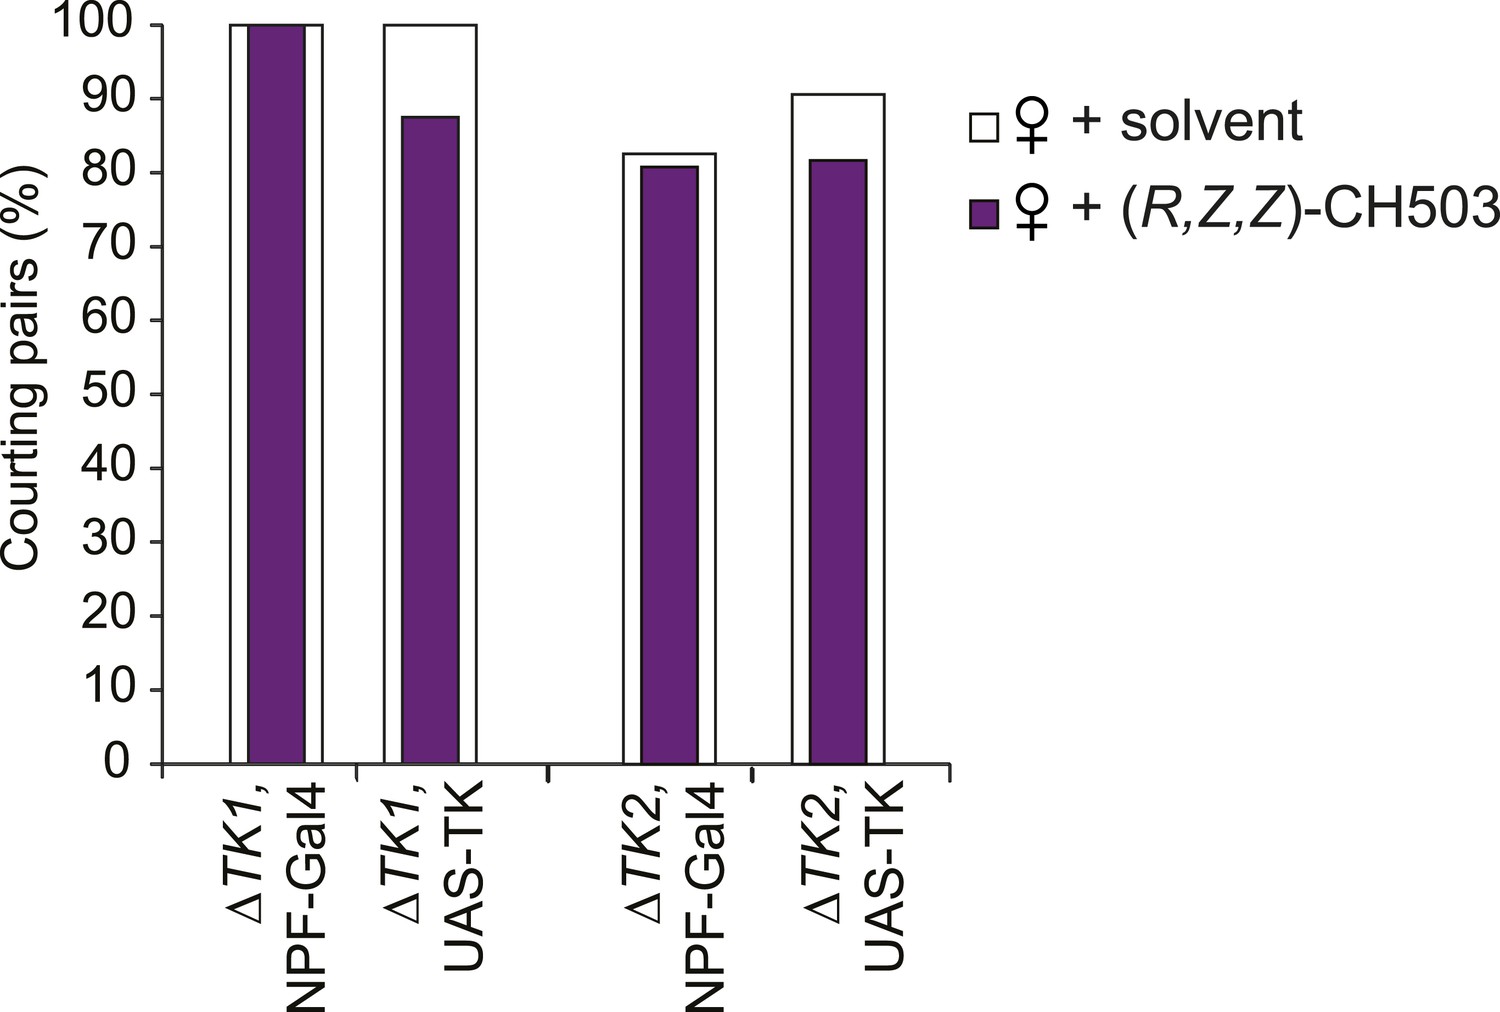
Parental control lines for tachykinin mutant rescue experiments.
The presence of the Gal4 or UAS transgene is not sufficient to rescue the response to CH503. N = 23–30, Fisher's exact probability test, all results are not significant.
Figure 5—figure supplement 3
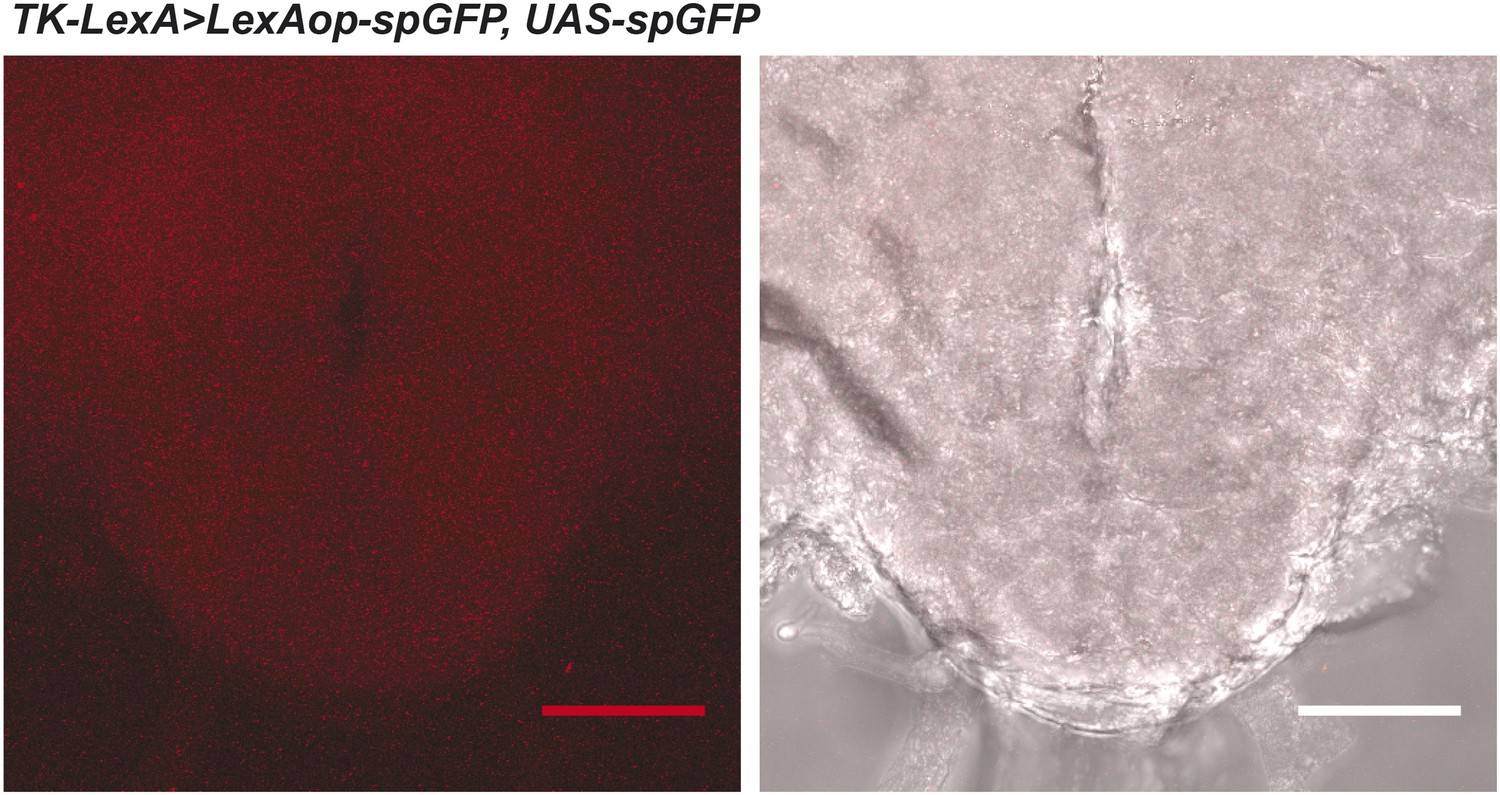
Non-specific diffuse staining is observed in tissue from GRASP negative controls lacking the Gr68a-Gal4 driver.
Left: the brightness of the confocal image is exaggerated in order to visualize the tissue. Right: the fluorescent image is overlaid on a phase-contrast image of the tissue. Scale bar: 50 μm.
Figure 6 with 2 supplements
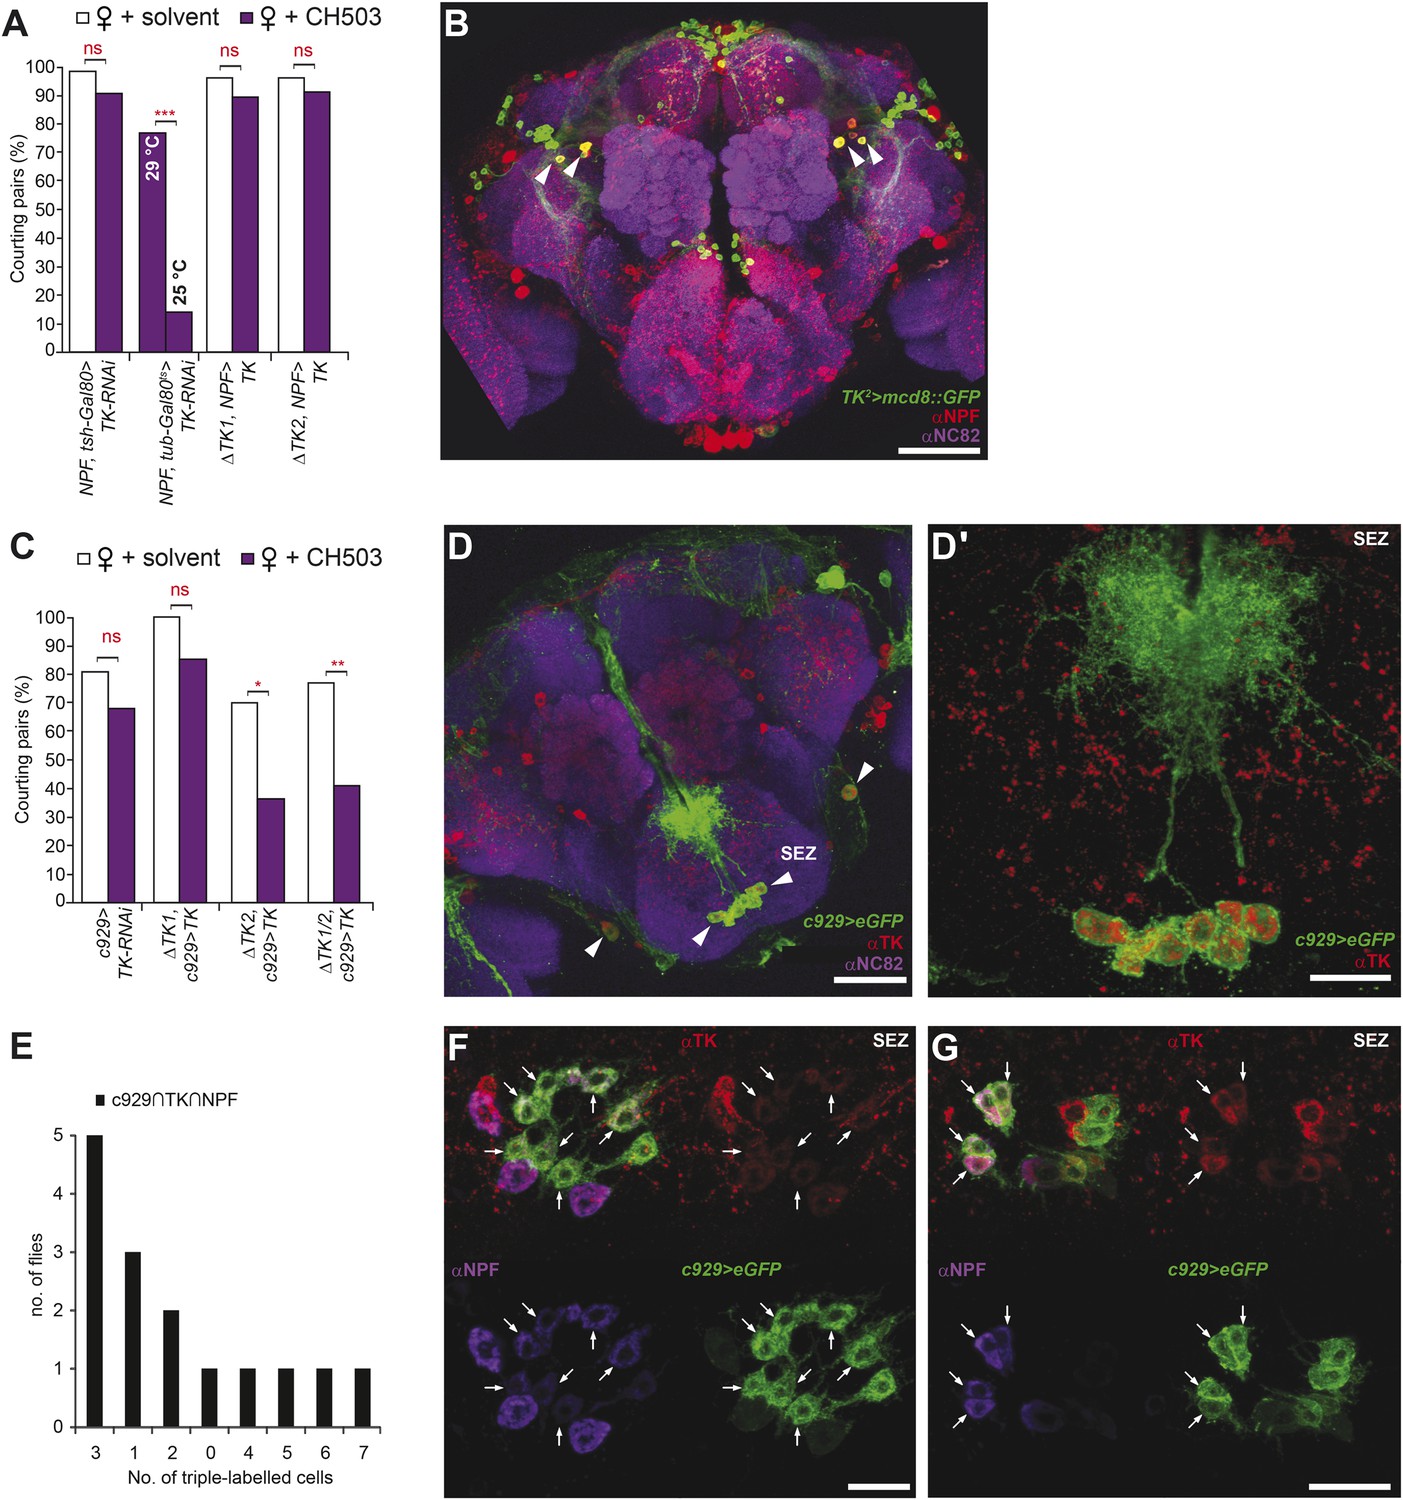
Tachykinin release within the NPF- and c929-defined circuits is required for the processing of CH503.
(A) RNAi-mediated knockdown of TK only in central NPF-Gal4 circuits abrogates the CH503-induced courtship suppression response. Conditional knockdown only from late pupal stage onwards (29°C permissive temperature, TK-RNAi expressed) elicits the same phenotype. At the 25°C restrictive temperature (TK-RNAi not expressed), flies continue to respond to the pheromone. Restoring TK expression only in the NPF-Gal4 circuit is not sufficient to restore sensitivity to CH503. See Figure 6—figure supplement 2 for parental controls. N = 14–23, Fisher's exact probability test, ns: not significant, ***p < 0.001. (B) Co-expression and co-localization of anti-NPF immunostaining with TK2-Gal4 processes is observed only in two pairs of bilateral cells in the ventrolateral protocerebrum (indicated by arrowheads; Pearson's coefficient: 0.7). No co-expression is observed in midline cells—the apparent co-localization observed in some cells (yellow signal) is due to overlapping signals from stacking different optical layers. Image represents a maximum intensity Z-series projection. Scale bar: 50 μm. (C) Silencing TK expression only in the c929-Gal4 circuit removes CH503 sensitivity. Rescuing TK expression only in the c929-Gal4 circuit restores sensitivity. N = 16–24, Fisher's exact probability test, ns: not significant, *p < 0.05. (D) Co-expression of anti-TK immunostaining with c929-Gal4 GFP expression is observed in 10 cell bodies housed in the SEZ (arrowheads; D′). Images represent maximum intensity Z-series projections. Scale bar D: 50 μm; D“: 35 μm. (E) Histogram showing frequency of cells in the SEZ that are triple-labeled with anti-NPF antibody, anti-TK antibody, and c929-Gal4 GFP expression. (F, G) Seven or three triple-labeled cells (arrows) in the SEZ. Images represent maximum intensity Z-series projections. Scale bar: 20 μm.
Figure 6—figure supplement 1
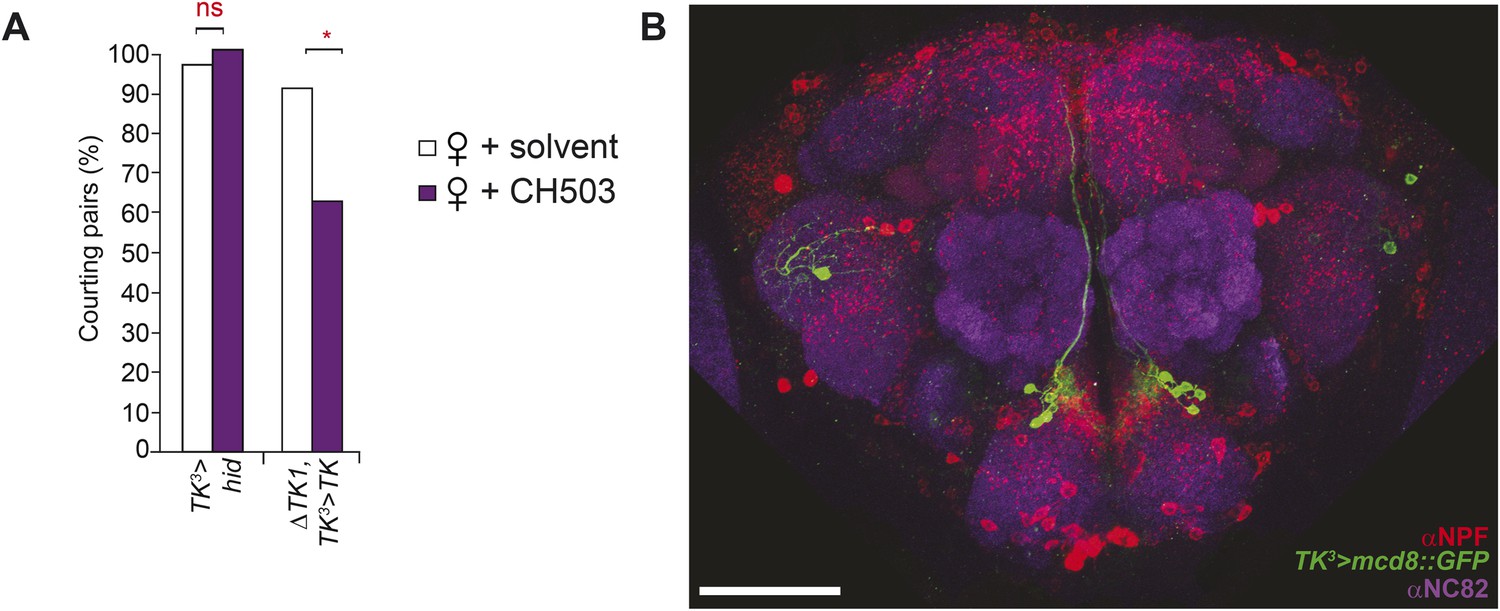
The TK3-Gal4 circuit does not co-localize with NPF.
(A) Inactivation of TK neurons using a third TK-Gal4 line results in a loss of sensitivity to CH503. The sensitivity is restored upon rescue of TK expression. (B) No co-localization or co-expression is evident (Pearson's coefficient: 0.02). Image represents a maximum intensity Z-series projection. Scale bar: 50 μm.
Figure 6—figure supplement 2
Parental control lines for tachykinin mutant rescue experiments.
N = 24–32, Fisher's exact probability test, all results are not significant.
Figure 7
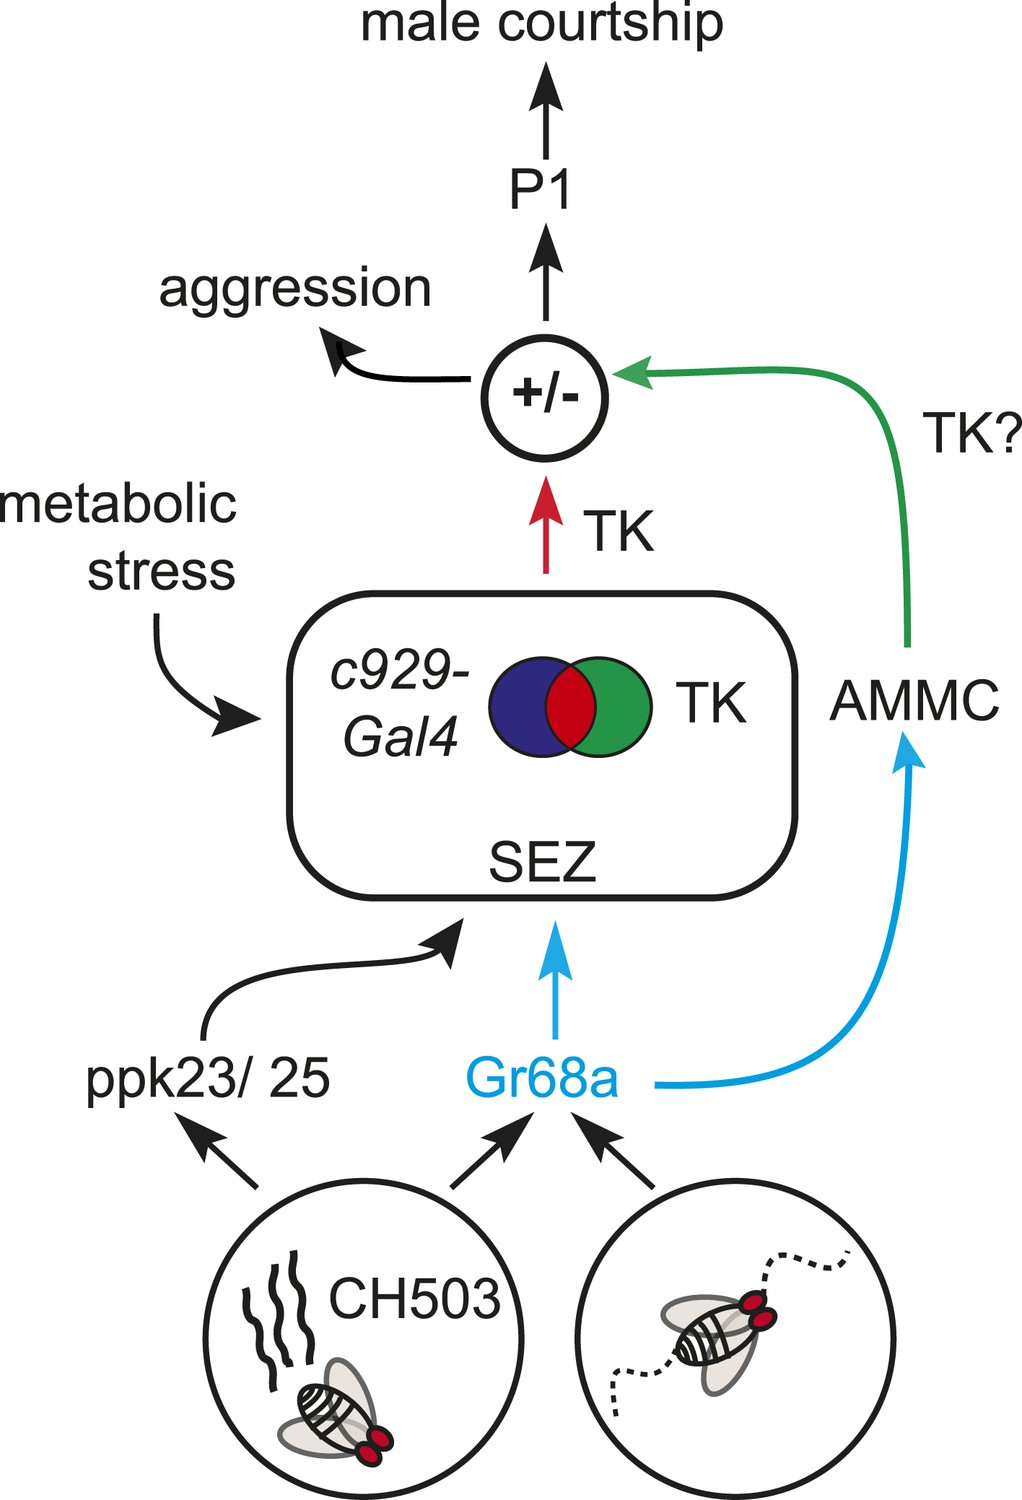
A model for gustatory pheromone perception in peripheral and central neural circuits.
Gr68a neurons on the foreleg relay chemosensory and mechanosensory signals to the subesophageal zone (SEZ) and AMMC, respectively. Movement detection via Gr68a neurons contributes to the decision to court, possibly through TK signaling. The c929-TK cell cluster within the SEZ transduces information via TK release to higher order centers, potentially including the P1 courtship ‘command center’. Metabolic stress responses and pheromone detection converge on the c929-TK cluster. Overall levels of TK release from this group of 8–10 cells could modulate the behavioral switch between aggression and courtship.
Videos
Video 1
Physiological response from Gr68a neurons on the male foreleg expressing GCaMP.
Cell bodies in T3 exhibit a tonic response upon stimulation with 500 ng of CH503.
Video 2
Physiological response from ppk23 neurons on the male proboscis expressing GCaMP.
Following stimulation with 500 ng of CH503, the projections of ppk23 neurons exhibit a bursting response. The cell bodies respond in a tonic manner, displaying a gradual increase in fluorescence intensity. The tonic response could be due to persistent stimulation from the pheromone.
Video 3
Physiological response from ppk23 neurons on the male foreleg expressing GCaMP.
Following stimulation with 500 ng of CH503, cell bodies and projections in T3 display a bursting response.
Tables
Table 1
Average number of GFP-positive cells in male and female foreleg segments labeled using Gr68a-Gal4
| T1 | T2 | T3 | T4 | T5 | Total* | |
|---|---|---|---|---|---|---|
| ♂ neurons | 2 ± 1 | 2 ± 1 | 3 ± 1 | 2 ± 1 | 0 (9/12 flies) | 9 ± 1 |
| ♀ neurons | 2 ± 1 | 1 ± 1 | 2 ± 1 | 1 ± 1 | 0 (11/12 flies) | 6 ± 2 |
| ♂ non-neural cells | 2 ± 1 | 3 ± 0 | 2 ± 0 | 1 ± 0 | 0 | 8 ± 1 |
| ♀ non-neural cells | 0 | 0 | 0 | 0 | 0 | 0 |
-
*
Averaged count (±SD) from 12 flies.
Table 2
Gal4 and RNAi lines used to screen for CH503-related defects
| Stock | Expression pattern or gene targeted* | Source |
|---|---|---|
| c386a-Gal4 | EB | www.fly-trap.org |
| 2-72-Gal4 | EB | gift from U Heberlein (Janelia Farm, VA, USA) |
| 4-67-Gal4 | EB | Gift from U Heberlein |
| 9-161-Gal4 | PC, FSB, MB | Gift from U Heberlein |
| 2-13-Gal4 | interneurons, PC | Gift from U Heberlein |
| c819-Gal4 | (Pan et al., 2012) | (Pan et al., 2012) |
| c061-Gal4 | PC, FSB, MB | (Pan et al., 2012) |
| R71GO1-Gal4 | PI, VNC | (Pan et al., 2012) |
| OK107-Gal4 | MB | DGRC #106098 |
| TrH-Gal4 | 5HT cells | Bloomington #10531 |
| TH-Gal4 | DA cells | Bloomington #8848 |
| Tdc2-Gal4 | TA and OCT cells | Bloomington #9313 |
| MB247-Gal4 | MB, EB | Bloomington #50742 |
| JO-15-Gal4 | Johnston's organ | Bloomington #6753 |
| DDC-Gal4 | DA and 5HT cells | Bloomington #7010 |
| c309-Gal4 | MB, SEZ, CX, AL, PI, TG | Bloomington #6906 |
| c305-Gal4 | MB, EB, AL, glia | Bloomington #30829 |
| c305-Gal4 | MB | Bloomington #30829 |
| c205-Gal4 | FB | Bloomington #30827 |
| c161y-Gal4 | EB, FSB, PC, chordotonal organ | Bloomington #27893 |
| c107-Gal4 | EB, FSB, PC, chordotonal organ | Bloomington #30823 |
| 30Y-Gal4 | MB | Bloomington #30818 |
| CheB42aΔ5–68 | CheB42a | (Park et al., 2006) |
| UAS-TbH-RNAi #1, 2 | Tyrosine β-hydroxylase | VDRC #107070, 51667 |
| UAS-OAMB-RNAi #1, 2, 3 | Mushroom body OA receptor | Bloomington #31233, 31711; VDRC #106511 |
| UAS-Cha-RNAi | Choline acetyltransferase | VDRC #20183 |
| UAS-VAChT-RNAi | Vesicular acetylcholine transporter | VDRC #40918 |
| UAS-DAT-RNAi | DA transporter | VDRC #12082 |
| UAS-TH-RNAi | Tyrosine hydroxylase | VDRC #3308 |
| UAS-Dop1R1-RNAi | DA 1-like receptor 1 | VDRC #107058 |
| UAS-Dop1R2-RNAi | DA 1-like receptor 2 | VDRC #105324 |
| UAS-VGAT-RNAi #1, 2 | Vesicular GABA transporter | VDRC #103586, 45916 |
| UAS-Tdc2-RNAi | Tyrosine decarboxylase | Bloomington #25871 |
| UAS-SERT-RNAi | 5HT transporter | VDRC #11346 |
| UAS-GABA B R1-RNAi | Metabotropic GABA-B receptor subtype1 | VDRC #101440 |
| UAS-GABA B R2-RNAi | Metabotropic GABA-B receptor subtype2 | VDRC #1785 |
| UAS-GABA B R3-RNAi #1, 2 | Metabotropic GABA-B receptor subtype3 | VDRC #108036, 50176 |
| UAS-GAD1-RNAi | Glutamic acid decarboxylase | VDRC #32344 |
-
*
AL: antennal lobe; CX: central complex; EB: ellipsoid body; FSB: fan-shaped body; MB: mushroom body; PC: protocerebrum; PI: pars intercerebralis; SEZ: subesophageal zone; TG: thoracic ganglion; VNC: ventral nerve cord; 5HT: serotonin; DA: dopamine; OCT: octopamine; TA: tyramine.
Table 3
Primers used for quantitative and semi-quantitative (semi-Q) PCR experiments
| Forward primer (5′–3′) | Reverse primer (5′–3′) | Annealing temperature (°C) | |
|---|---|---|---|
| Gr68a (qPCR) | CCAAGGTGATACCGAGGAGGAGA | TCGTGAAGAGTGCGAAAGTG | 60 |
| Gr68a (semi-Q PCR) | CCAAGGTGATACCGAGGAGA | CATTGGCCAGCAGATACTCA | 55 |
| CG6024 | CCAAGGTGATACCGAGGAGA | TCATGAAGAGTGCGAAAGTG | 60 |
| NPF | GCGAAAGAACGATGTCAACAC | TGTTGTCCATCTCGTGATTCC | 60 |
| rp49 | CCAAGGACTTCATCCGCCACC | GCGGGTGCGCTTGTTCGATCC | 55 |
| RMCE vector | GTACTGACGGACACACCGAAG | GGATCAACTACCGCCACCT | 52 |
Download links
A two-part list of links to download the article, or parts of the article, in various formats.
Downloads (link to download the article as PDF)
Open citations (links to open the citations from this article in various online reference manager services)
Cite this article (links to download the citations from this article in formats compatible with various reference manager tools)
The neuropeptide tachykinin is essential for pheromone detection in a gustatory neural circuit
eLife 4:e06914.
https://doi.org/10.7554/eLife.06914


