Measuring the optimal exposure for single particle cryo-EM using a 2.6 Å reconstruction of rotavirus VP6
- Janelia Research Campus, Howard Hughes Medical Institute, United States
- Brandeis University, United States
Figures
Figure 1
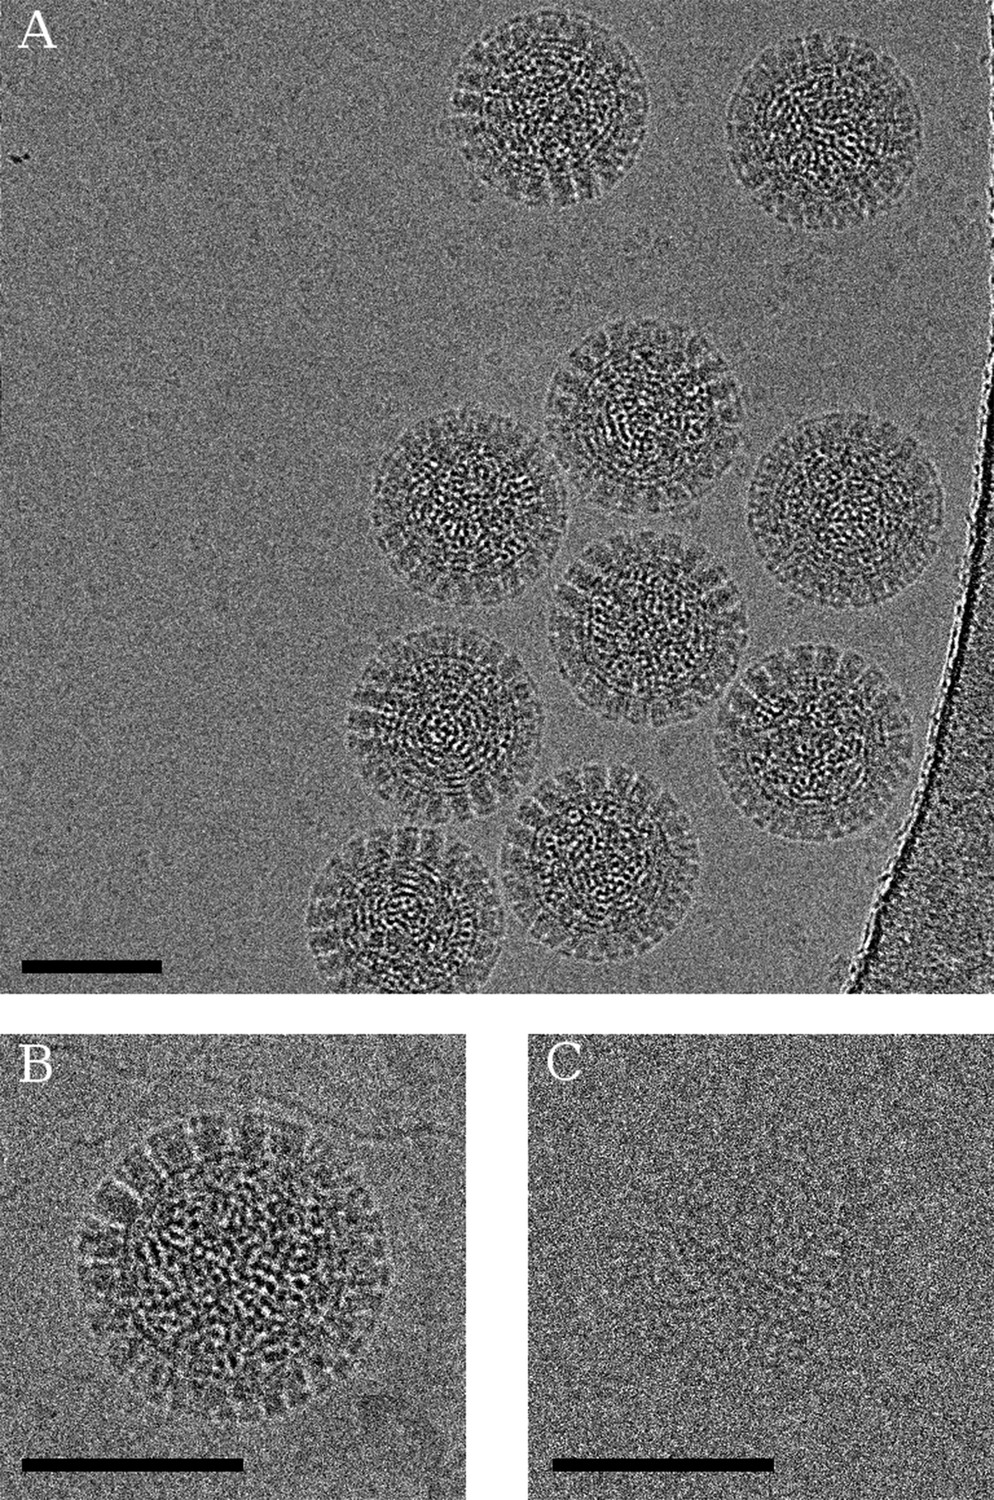
(A) Example of an aligned movie sum of the rotavirus double-layered particle (DLP) sample imaged with a total exposure of 100 e−/Å2.
(B) Particle sum created using all frames and (C) the first 3 frames of the movie, demonstrating the kind of data used in the analysis. In all cases, the scale bar represents 500 Å.
Figure 2
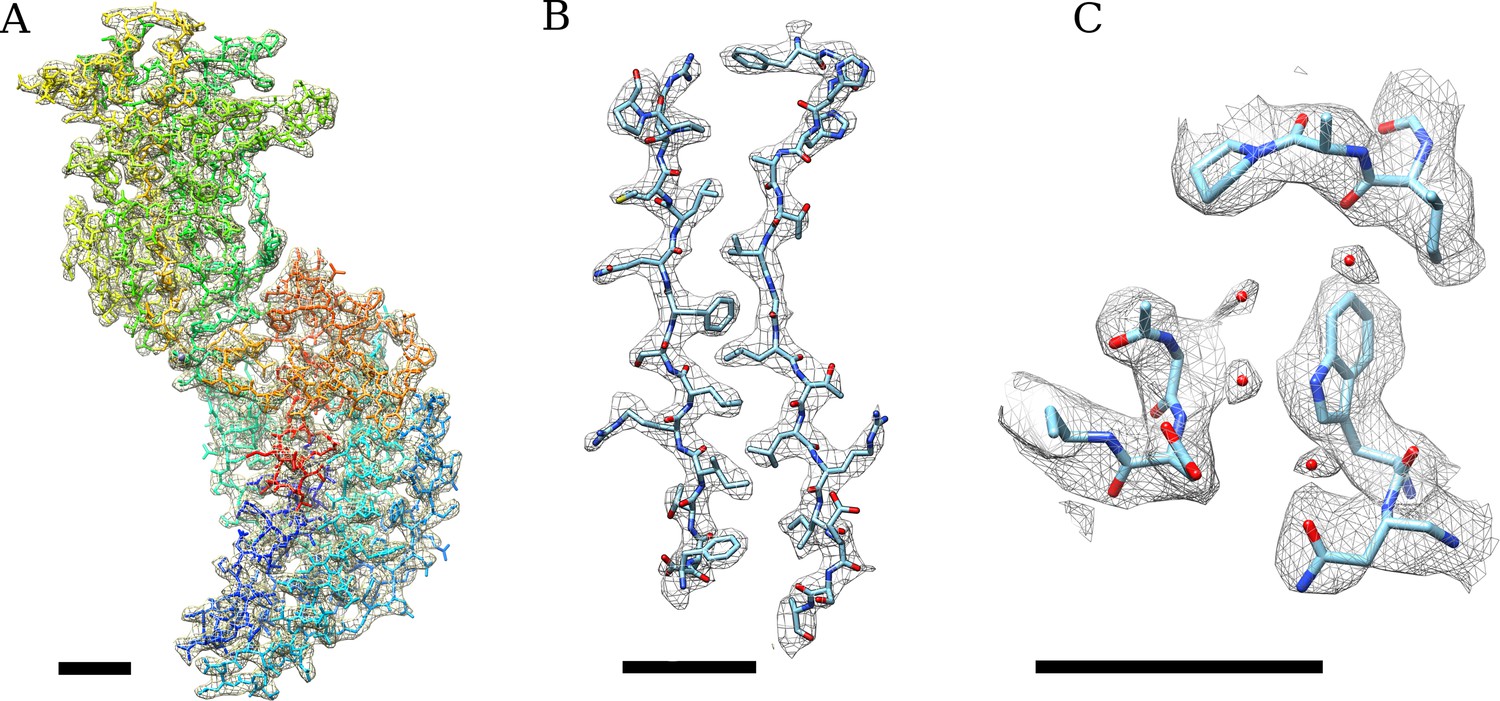
(A) Density of an isolated VP6 subunit is shown as a mesh along with the docked atomic model.
The model is colored using a rainbow spectrum, starting with the N-terminus in blue and ending with the C-terminus in red. (B) Zoomed region of the VP6 subunit. (C) At higher thresholds, small density features become visible that we interpret as water molecules because their locations are very close to water molecules found in the VP6 crystal structure (Mathieu et al., 2001). A B-factor of −175 Å2 was applied to the DLP reconstruction before 13-fold non-icosahedral averaging to sharpen the VP6 map. In all cases, the scale bar represents 10 Å.
Figure 3
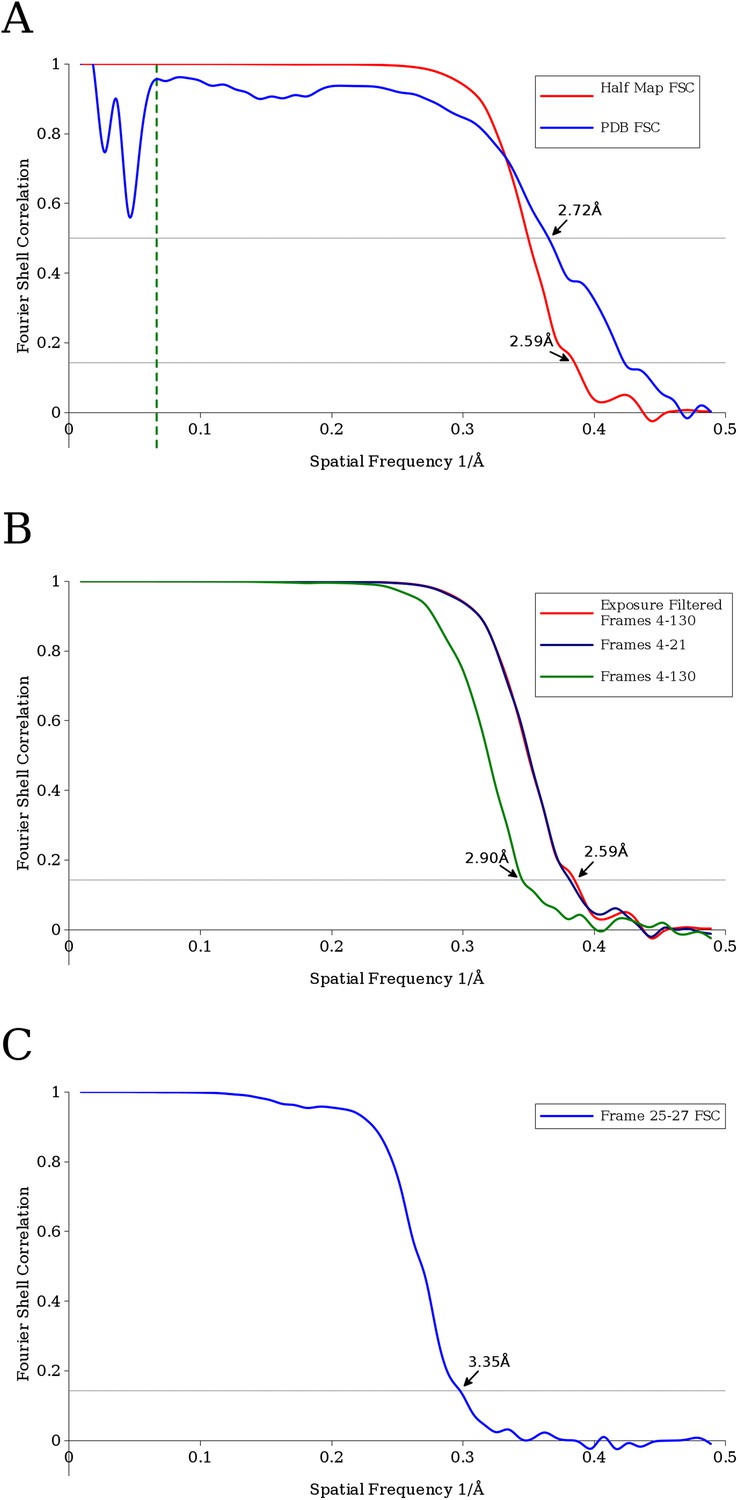
(A) Fourier Shell Correlation (FSC) curves estimating the resolution of the final VP6 reconstruction calculated using exposure-filtered data.
Two FSC curves were obtained, one from maps calculated from two halves of the data set, another using the modeled atomic coordinates. The dashed green line represents 15 Å, the upper resolution limit used during parameter refinement. (B) FSC curves between half data set reconstructions of the VP6 subunit when using an exposure-filtered sum of frames 4–130, an unfiltered sum of frames 4–130, and an unfiltered sum of frames 4–21, which were determined to be the best set of unfiltered frames by trial and error. Exposure filtering was applied only to the final reconstruction, and not during refinement (C) FSC curve for the reconstruction using only frames 25–27, indicating a resolution of ∼3.4 Å after a pre-exposure of ∼19 e−/Å2.
Figure 4
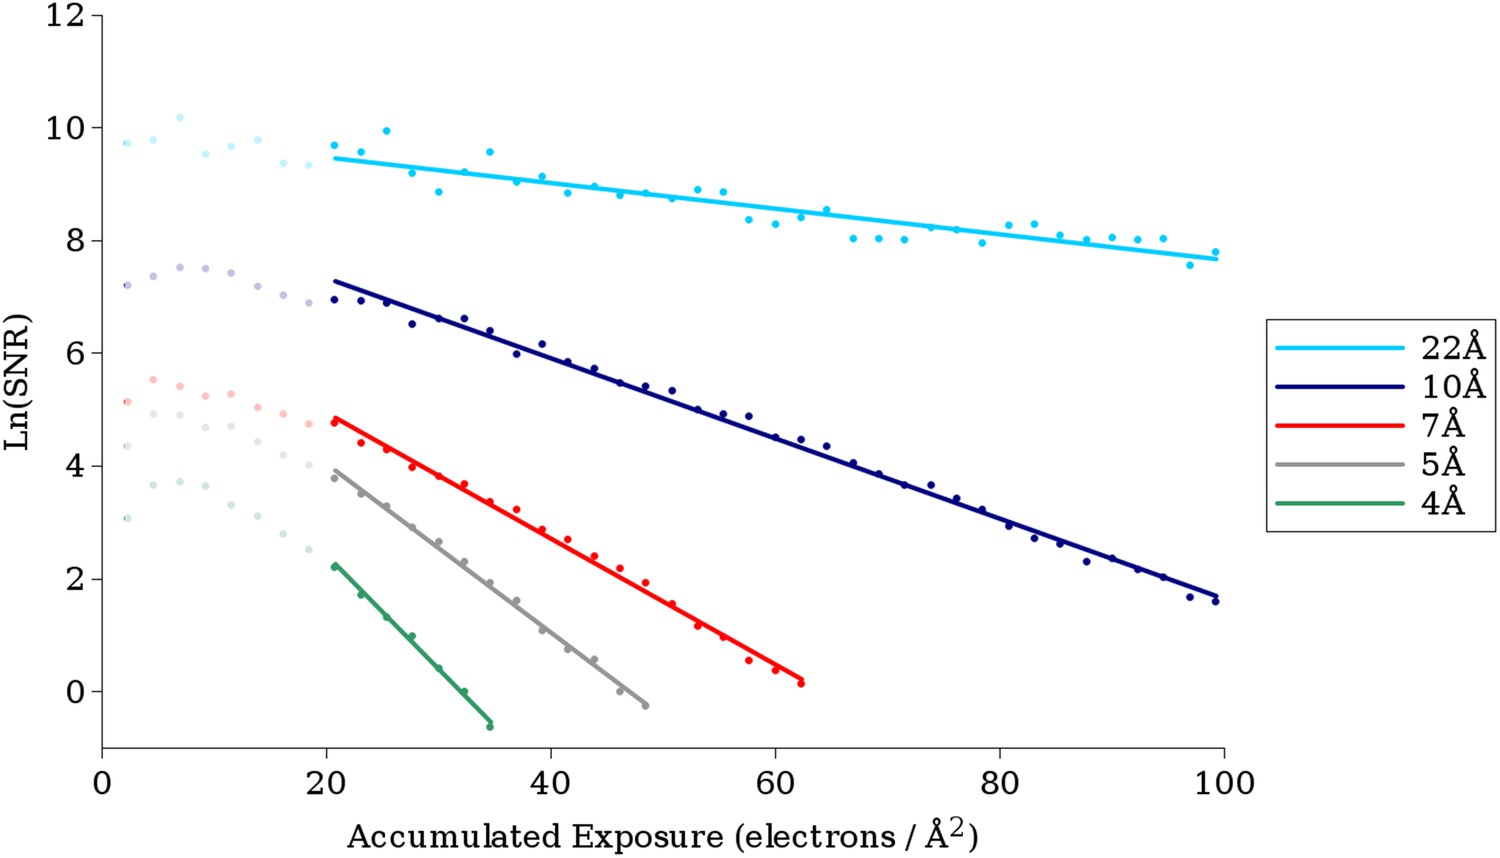
Example plots of ln(SNR) vs accumulated exposure with associated linear fits at a number of different resolutions.
Data used in this study are shown in darker color, while data for early frames excluded from the analysis due to specimen movement are shown in lighter color. The slopes of the lines become steeper as the resolution increases, corresponding to faster fading of the signal. The linear plots fit the data well, suggesting that in the analyzed regions a single-exponential process is dominant in the decay.
Figure 5
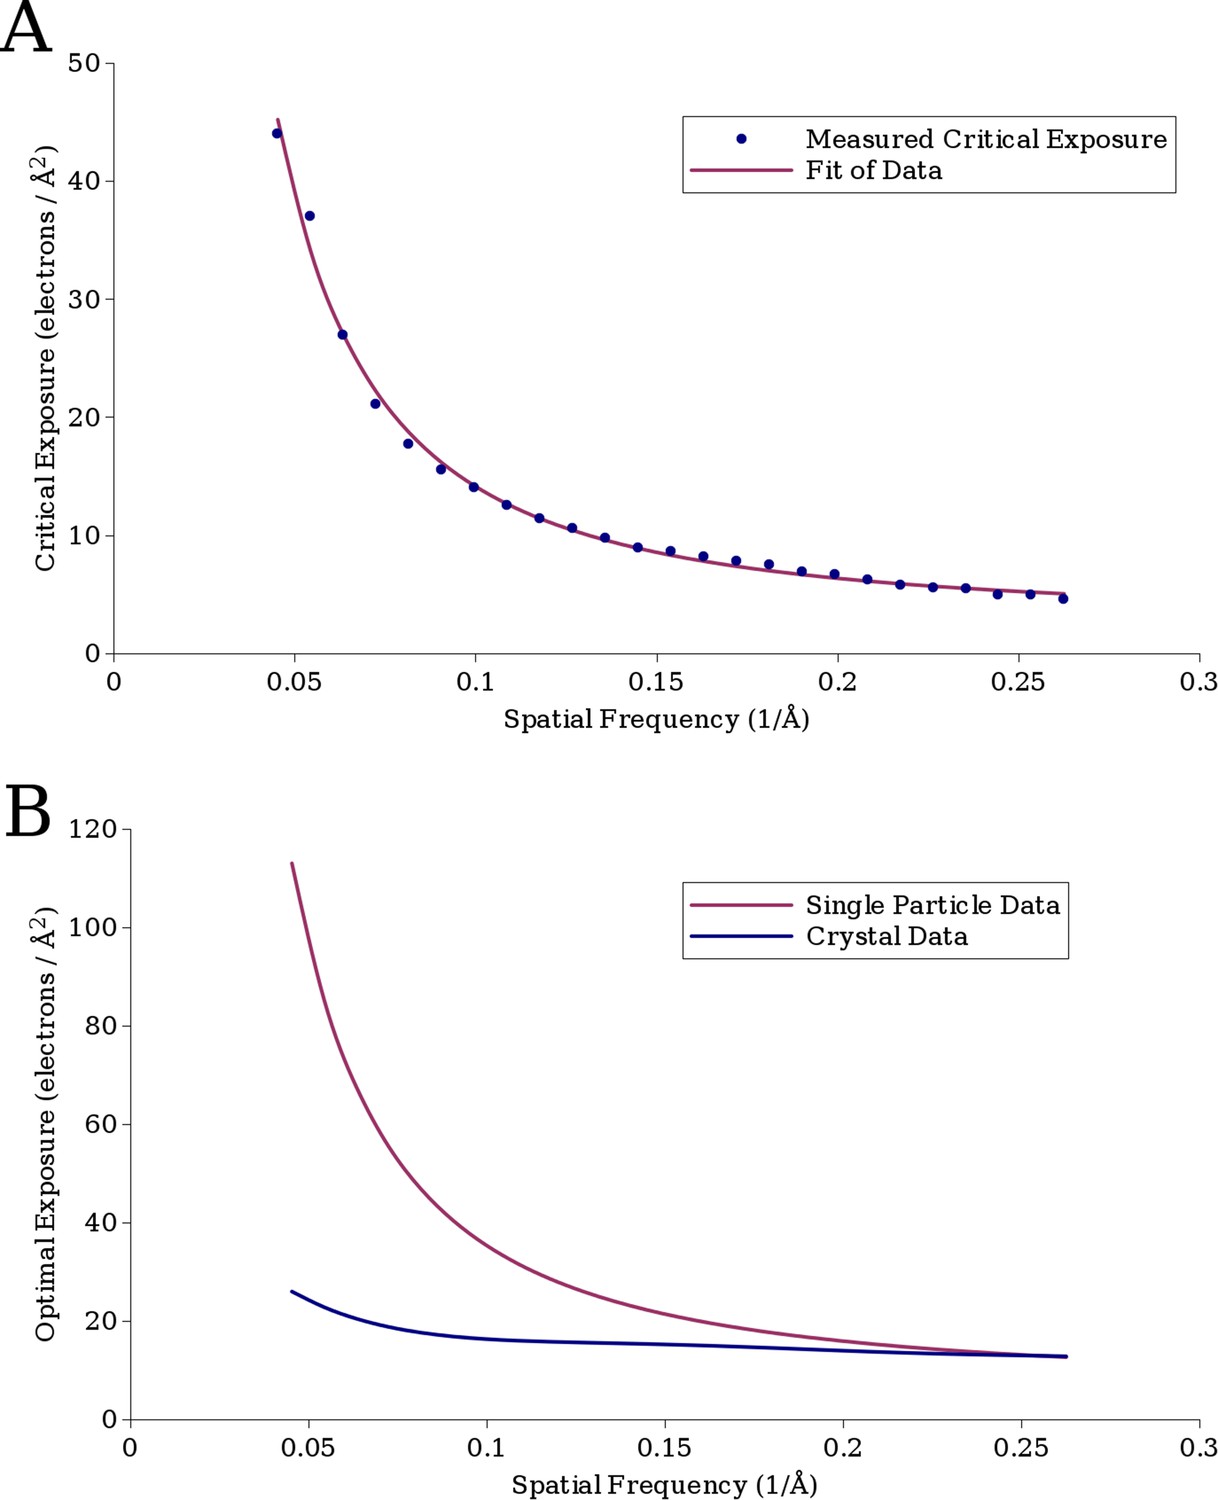
(A) The measured critical exposure curve plotting the critical exposure at each measured resolution and the fit function for comparison.
(B) Curve plotting the optimal exposure obtained in this study alongside that obtained in a previous study on crystalline specimens, scaled by a factor of 1.25 to compensate for the fact that the previous study was conducted at 200 kV (Baker et al., 2010).
Figure 6
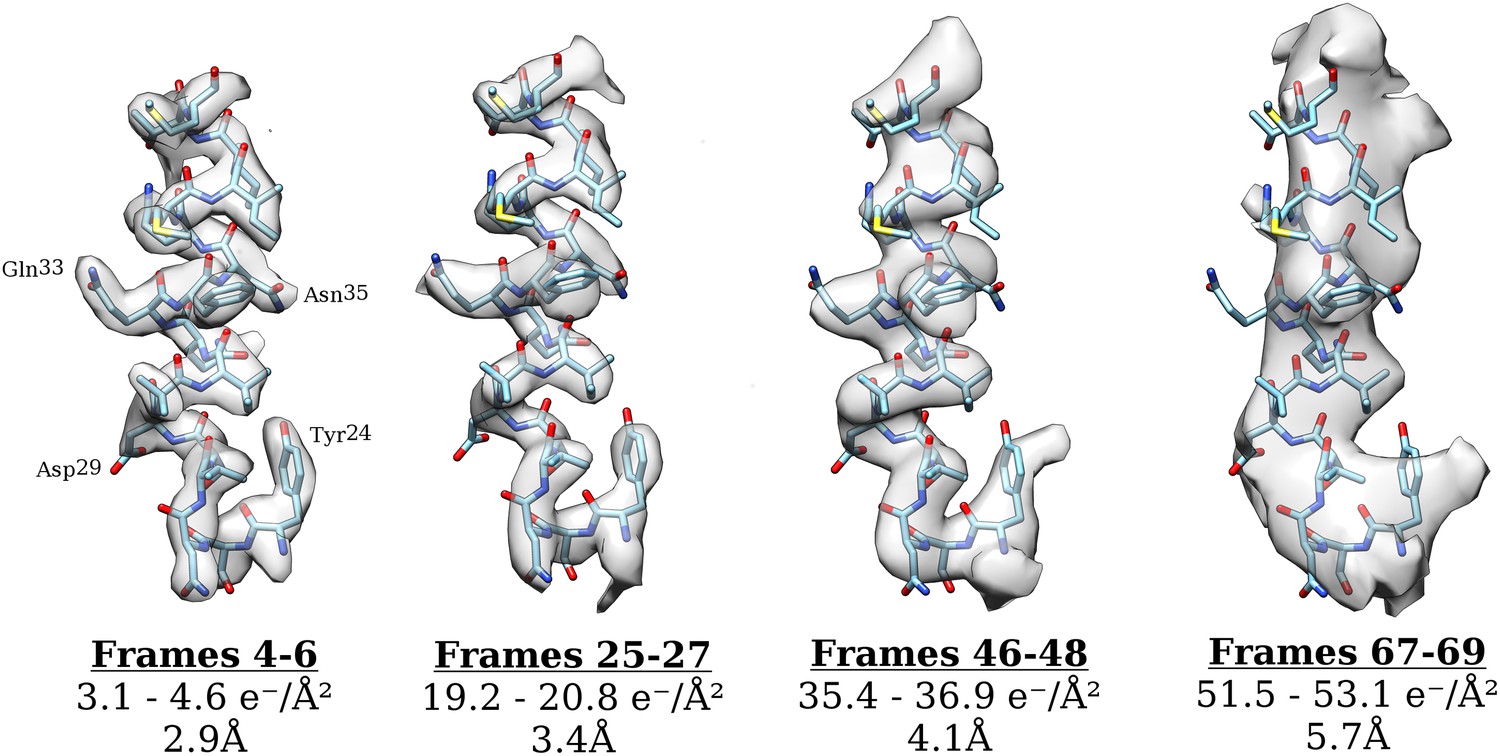
Surface rendering of an isolated small helix from different 3-frame reconstructions shown with the docked model.
Each reconstruction is shown with its exposure range and resolution as calculated from the FSC using the 0.143 cut-off.
Figure 7
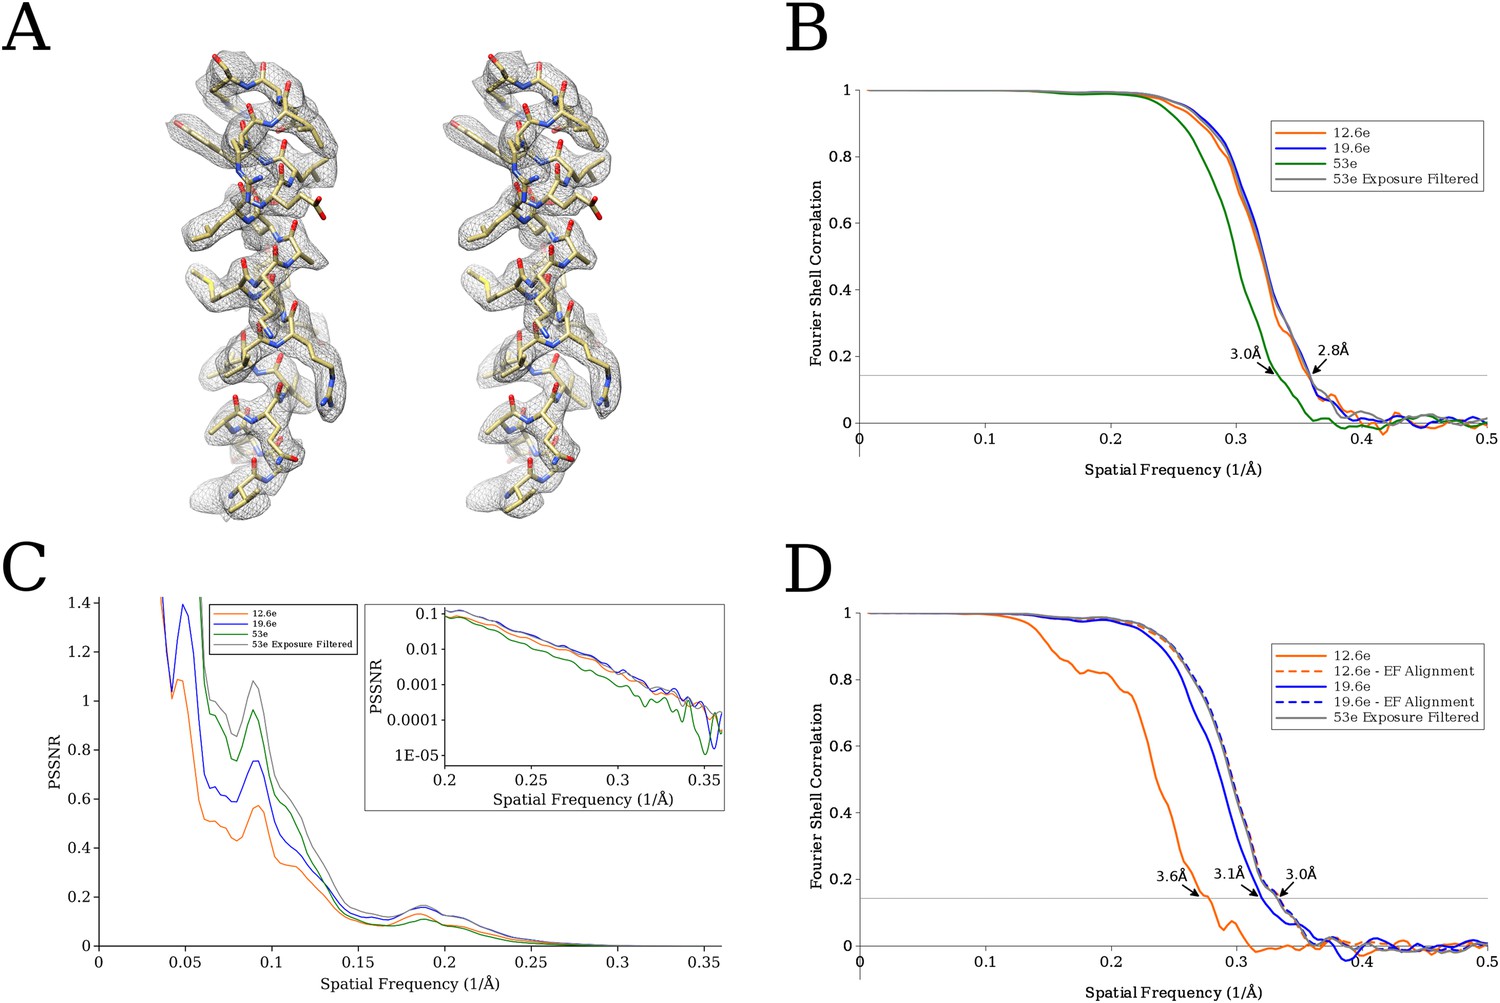
(A) Comparison of an isolated helix from the previously published reconstruction (Campbell, 2015) on the left, and the reconstruction using exposure-filtered data on the right.
The two maps appear almost identical after scaling the amplitudes using diffmap (http://grigoriefflab.janelia.org/diffmap), suggesting that in this case exposure filtering performs as well as the weighting based on B-factors implemented in Relion (Scheres, 2014). (B) Plot of FSC curves for the various proteasome reconstructions. The exposure-filtered reconstruction has a resolution of ∼2.8 Å, matching the resolution previously obtained. (C) Plot of the average particle signal-to-noise ratio (SNR) as a function of resolution. The exposure-filtered particles have equal or higher SNR than the other data sets at all resolutions. (D) Plot of FSC curves from the signal-limited data set. In this case, the exposure-filtered reconstruction is of better quality than those derived from the other data sets. Recalculating the non-filtered reconstructions with particle alignment parameters obtained for the exposure-filtered data set increases the resolution to that of the filtered data set (curves labeled ‘EF Alignment’), demonstrating that the loss in resolution was due to particle misalignments.
Videos
Video 1
Density of an isolated VP6 subunit is shown as a mesh along with the docked atomic model (see also Figure 2A).
The model is colored using a rainbow spectrum, starting with the N-terminus in blue and ending with the C-terminus in red.
Video 2
Zoomed region of the VP6 subunit showing two β-sheet strands (see also Figure 2B).
https://doi.org/10.7554/eLife.06980.011Additional files
-
Supplementary file 1
Archive containing the program Unblur. It contains the program precompiled for use on a Linux 64-bit system and source code. This archive and future updates are also available for download from the Grigorieff lab web page (http://grigoriefflab.janelia.org/unblur).
- https://doi.org/10.7554/eLife.06980.012
-
Supplementary file 2
Archive containing the program Summovie. It contains the program precompiled for use on a Linux 64-bit system and source code. This archive and future updates are also available for download from the Grigorieff lab web page (http://grigoriefflab.janelia.org/unblur).
- https://doi.org/10.7554/eLife.06980.013
Download links
A two-part list of links to download the article, or parts of the article, in various formats.
Downloads (link to download the article as PDF)
Open citations (links to open the citations from this article in various online reference manager services)
Cite this article (links to download the citations from this article in formats compatible with various reference manager tools)
Measuring the optimal exposure for single particle cryo-EM using a 2.6 Å reconstruction of rotavirus VP6
eLife 4:e06980.
https://doi.org/10.7554/eLife.06980


