Arcuate hypothalamic AgRP and putative POMC neurons show opposite changes in spiking across multiple timescales
- Beth Israel Deaconess Medical Center, United States
- Harvard Medical School, United States
Figures
Figure 1 with 1 supplement
Stable optetrode recordings from arcuate hypothalamic neurons.
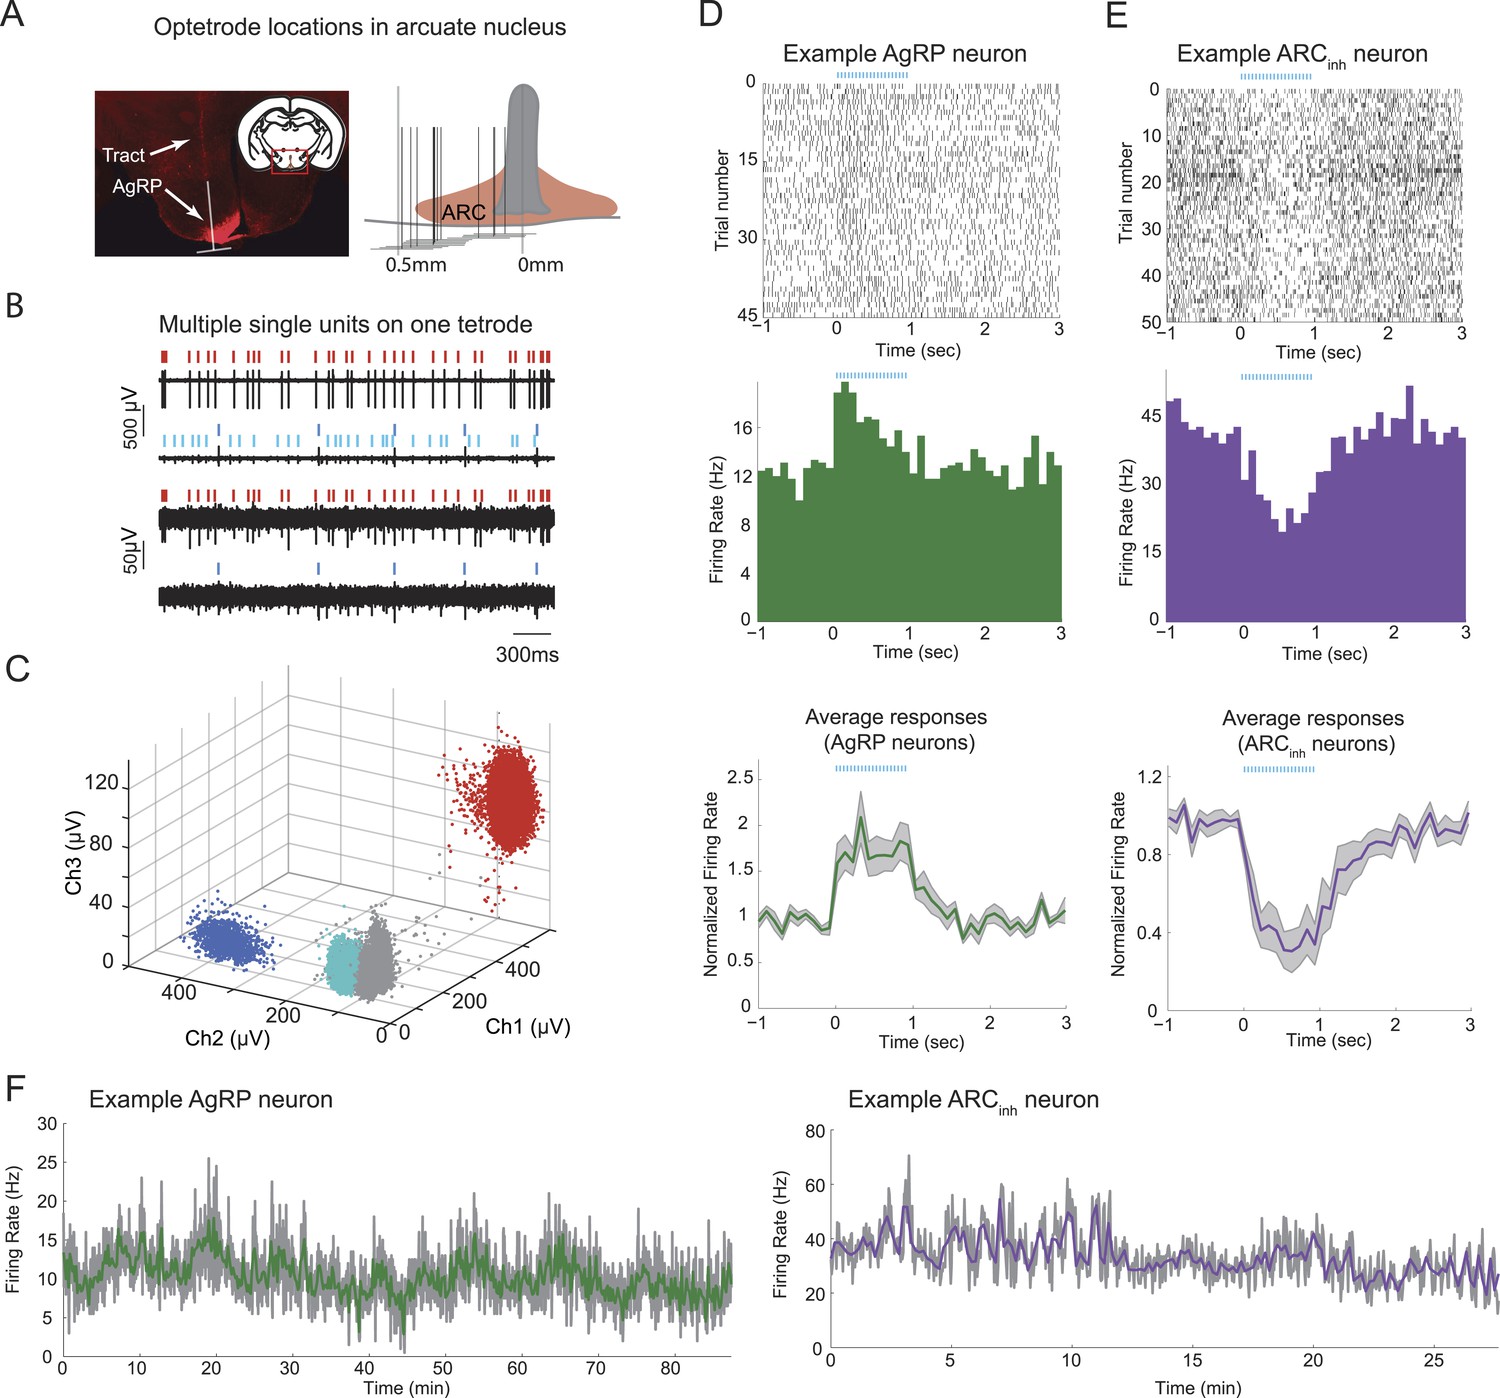
(A) An optetrode was implanted into the arcuate nucleus of the hypothalamus to identify genetically-defined, ChR2-mCherry-expressing agouti-related-peptide (AgRP) neurons (see below and ‘Materials and methods’). Left: coronal section, 1.5 mm posterior to Bregma (inset) and example histological section, showing AgRP neurons in the ARC (mCherry expression, red), and localization of optetrode recording site (as determined by visualization of optetrode track). White inverted ‘T’ shape denotes location of optetrode track (vertical line) and approximate width of optetrode (horizontal line), which estimates the medial-lateral range of potential locations of recorded single-units. Right: schematic showing optetrode locations across 12 mice for which optetrode tracks were recovered. (B) Example voltage traces from recordings of spontaneous spiking from one tetrode. Note differences in scale bar across electrode channels, reflecting difference in waveform amplitude across channels. (C) Cluster-plots showing discriminability of spikes from different cells using tetrodes. Each dot represents the peak amplitude of a single-spike waveform, measured on three different electrodes within the four-wire tetrode bundle. In this example, each spike waveform was designated as belonging to one of three separable single-units (colored dots), or to multi-unit activity (gray dots). Colors for different single-units match the ticks above the spike traces in B. (D) Example of a single-unit defined as a putative AgRP neuron, with peri-photostimulation (blue lines) spike raster plot (top), average peri-stimulus time histogram (PSTH) across trials (middle), and mean normalized PSTH (average of individual neuron PSTHs after normalization by pre-pulse-train firing rate) across all 19 AgRP neurons recorded from 9 ad libitum-fed mice (bottom). Shaded areas denote SEM. (E) Raster and PSTH plots (top, middle) for an example single-unit defined as significantly and strongly (>20%) inhibited by AgRP neuron photostimulation (ARCinh), and mean normalized PSTH (bottom) across all ARCinh units in ad libitum-fed mice (n = 14). (F) Firing rate timecourses, in 2-s bins (gray) and 10-s bins (colored), for the two example cells in D and E. In ad libitum-fed mice in the absence of food cues or food, AgRP neurons and ARCinh neurons exhibited stable minute-to-minute firing rates across recordings ranging from 30 to 90 min.
Figure 1—figure supplement 1
Light-evoked responses in different populations of arcuate neurons.
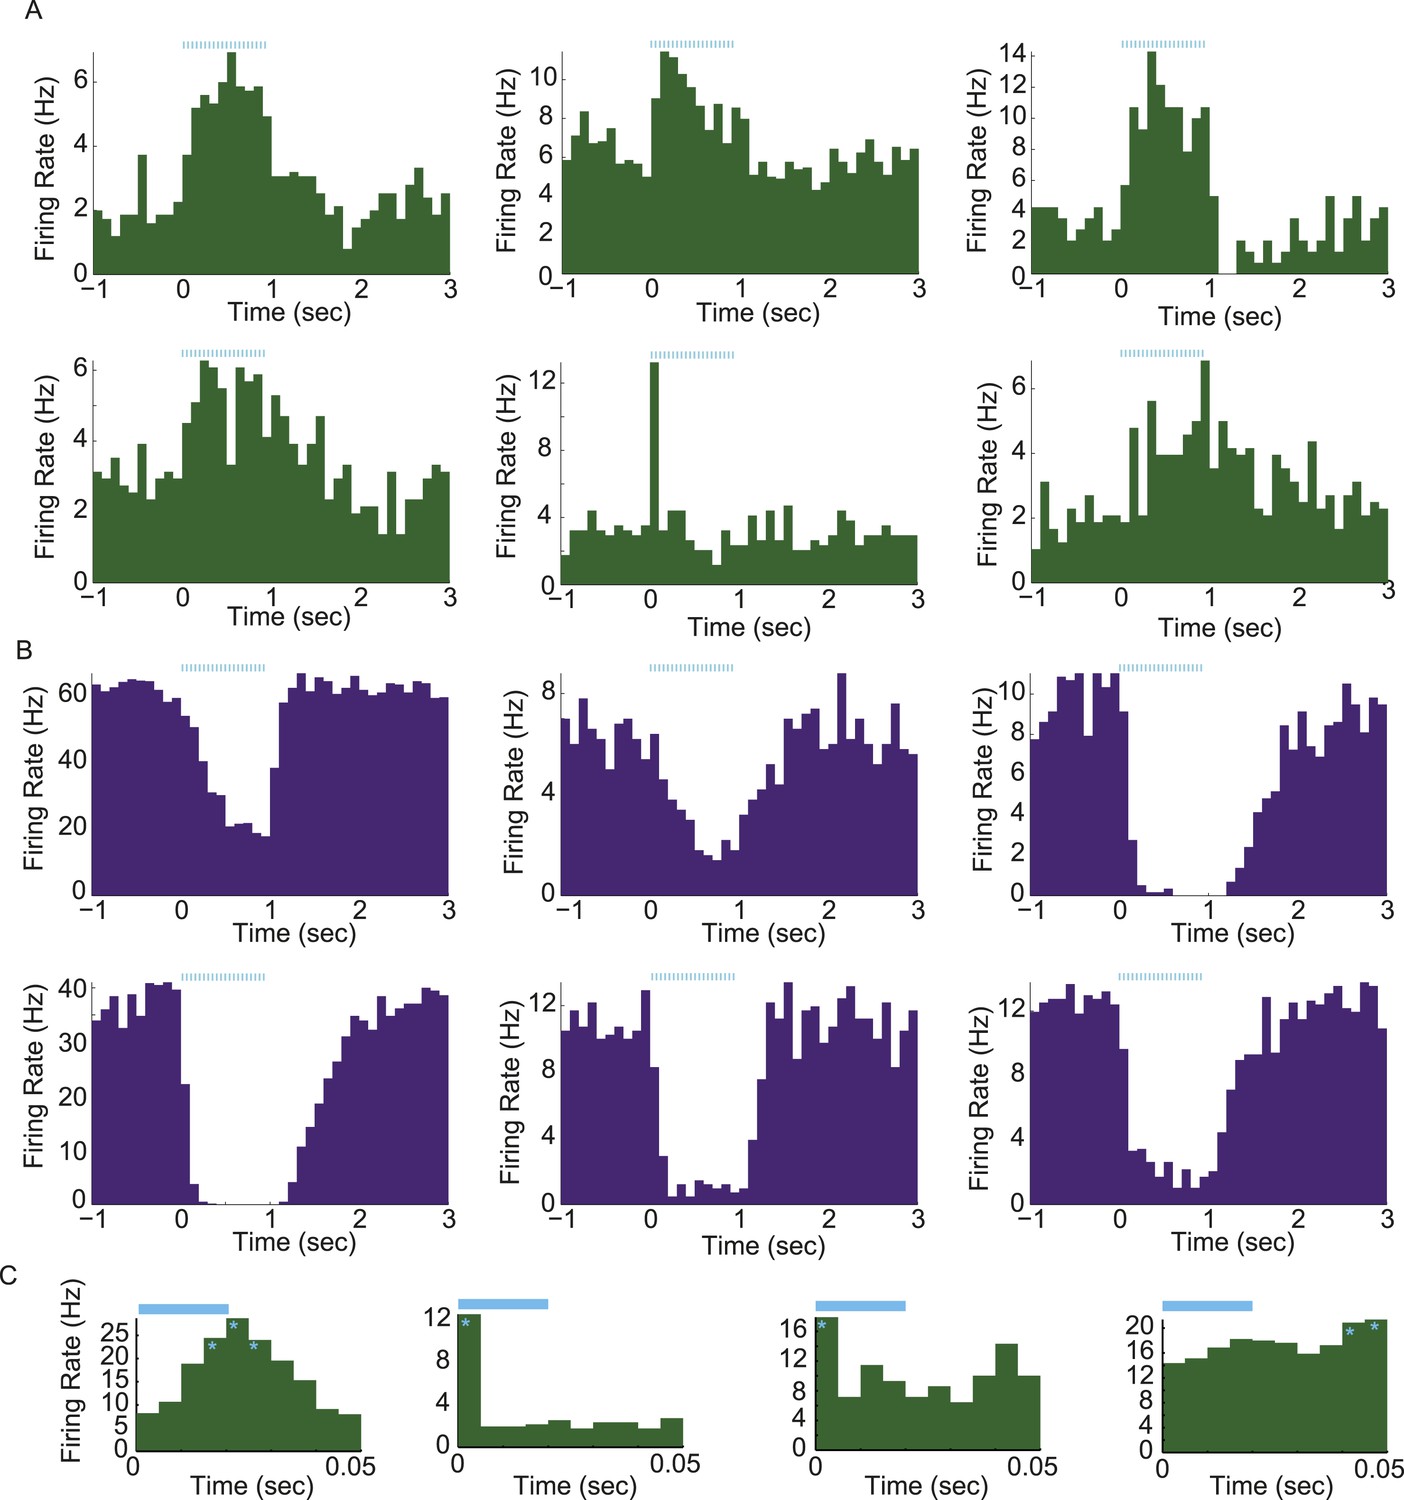
(A and B) Activity aligned to the onset of a train of photostimulation (blue ticks: 20-ms square laser pulses at 20 Hz for 1 s). Examples of PSTHs from 6 putative AgRP neurons (A) and 6 arcuate neurons that were strongly (>20%) and significantly suppressed by AgRP neuron photostimulation (ARCinh; B). (C) Phasic entrainment to individual laser light pulses in AgRP neurons. Examples of cycle histograms (which include firing rates during all pulses from all trials, see ‘Materials and methods’), from four putative AgRP neurons that were phase-locked to light stimulation (light blue). Asterisks denote phases relative to laser pulse onset (time 0) with firing rates that were significantly higher than phase-shuffled control levels (p < 0.0001; see ‘Materials and methods’).
Figure 2 with 1 supplement
Arcuate neurons demonstrate changes in firing rate across the light period.
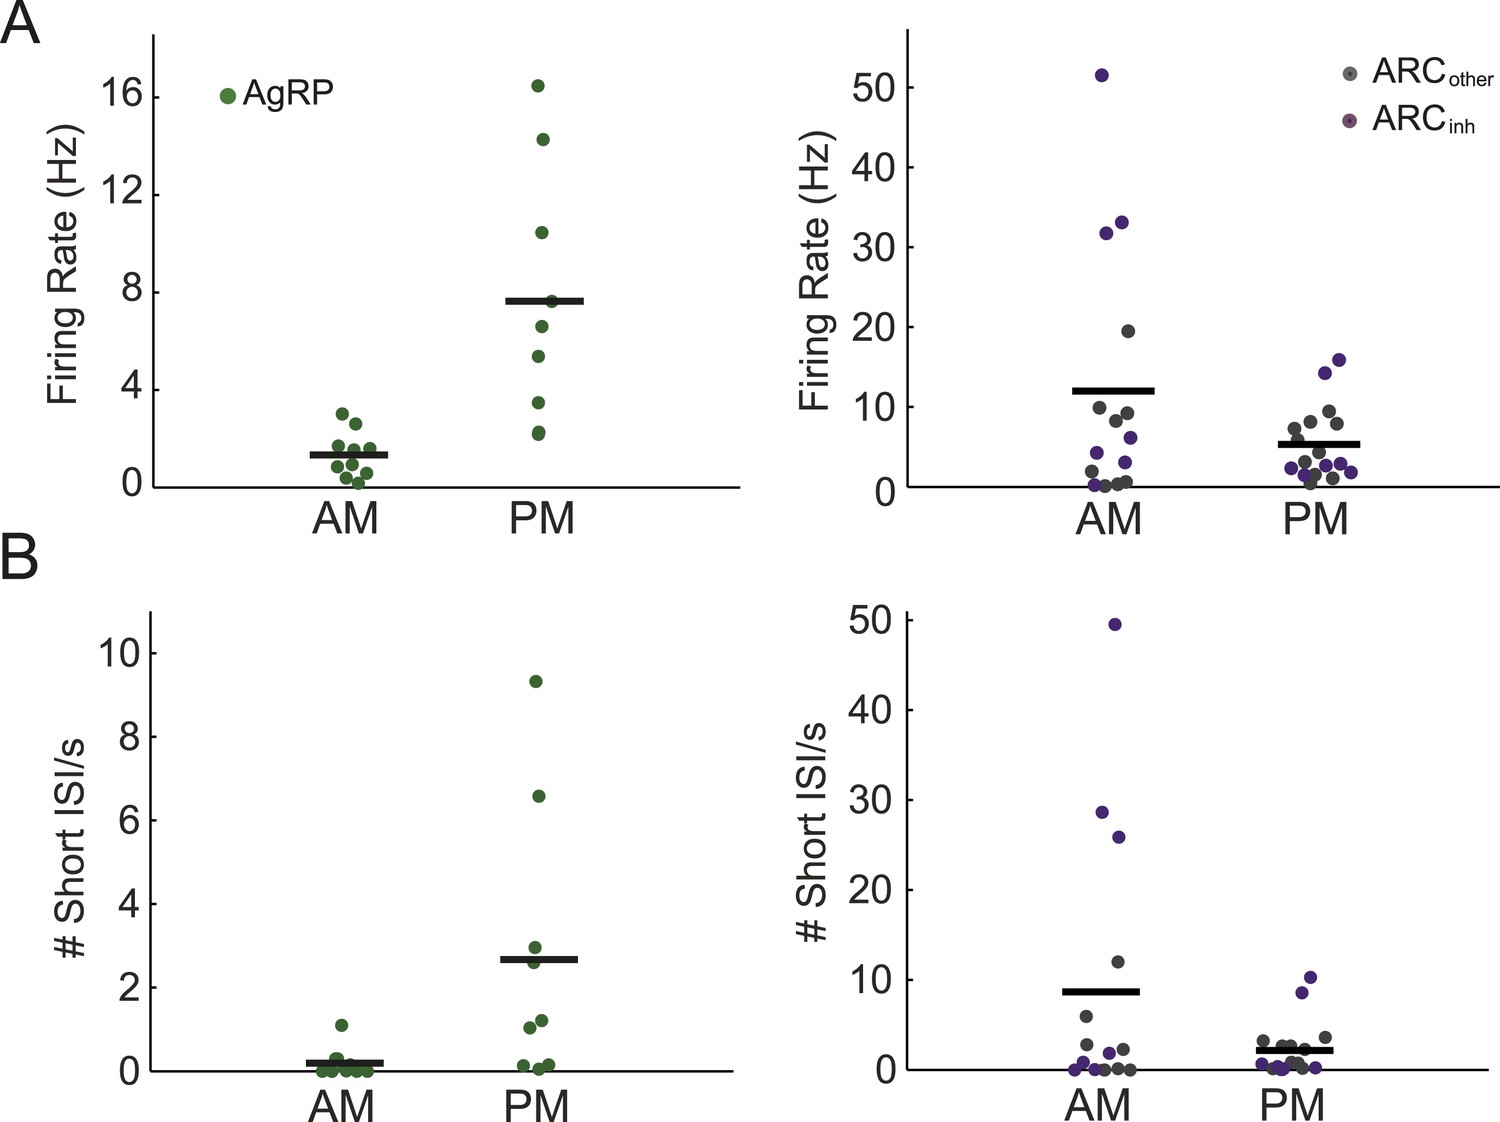
(A) AgRP neurons (green dots) fired significantly more in the afternoon (when caloric deficiency is increased and the dark period is approaching) than in the morning (AM: 1.4 ± 0.3 Hz, n = 10; PM: 7.6 ± 1.7 Hz, n = 9; t-test, p = 0.001), while all other ARC neurons showed the opposite trend (AM: 12.0 ± 4.0 Hz, n = 15; PM: 5.3 ± 1.1 Hz, n = 17; t-test, p = 0.08). ARCinh neurons (purple dots) showed a similar trend (AM: 18.5 ± 7.6 Hz, n = 7; PM: 5.9 ± 2.4 Hz, n = 7; t-test, p = 0.14). Note the presence of ARCinh neurons with very high mean spiking rates above 30 Hz. (B) Same plots as in A, but displaying the rate of short inter-spike interval events (ISI; spikes occurring <50 ms apart) in morning vs afternoon recordings. AgRP neurons showed a 14-fold increase in short ISI events (AM: 0.03 ± 0.11 Hz; PM: 2.7 ± 1.1 Hz; t-test p = 0.02), while non-AgRP ARC neurons showed a trend toward a decrease in short ISI events in the afternoon (AM: 8.7 ± 3.8 Hz; PM: 2.2 ± 0.7 Hz; t-test, p = 0.08); neurons that were inhibited by photostimulation showed a similar trend (AM: 15.3 ± 7.4 Hz; PM: 2.9 ± 1.7 Hz; t-test, p = 0.13).
Figure 2—figure supplement 1
Characterization of ISI statistics in arcuate neurons.
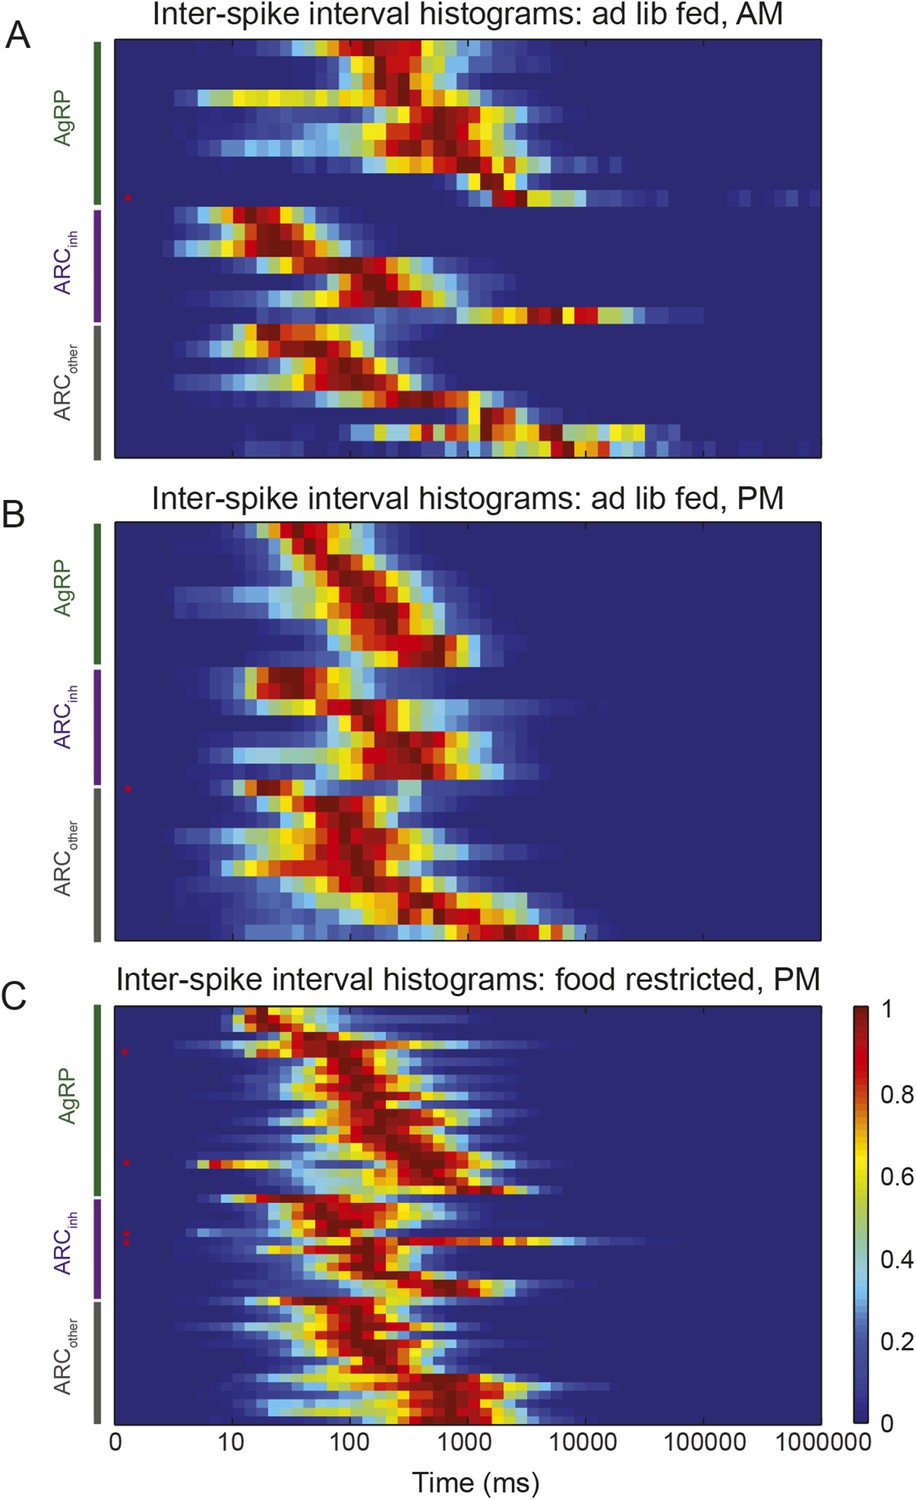
Plot of all ISI distributions (each row depicts one neuron) in the ad libitum feeding experiment (A and B) and in the instrumental conditioning task (C). Distributions were grouped by class (green: AgRP; purple: ARCinh; gray: ARCother). All distributions were normalized by their peak values. Distributions were relatively broad compared to in vitro recordings, as characterized by coefficients of variation (defined as the (mean)/(standard deviation) of the log10(ISI) distribution) greater than 1 (coefficient of variation across all neurons recorded in both experiments: AgRP: 1.21 ± 0.07; ARCinh: 1.64 ± 0.21; ARCiother: 1.51 ± 0.13; all values are mean ± SEM; no significant differences across classes, KS-test, p > 0.05). Firing rate distributions were tested for bimodality using Hartigan's Dip test; in total, 6/100 ARC neurons (red asterisks) had significantly bimodal distributions of ISIs (p < 0.05).
Figure 3 with 2 supplements
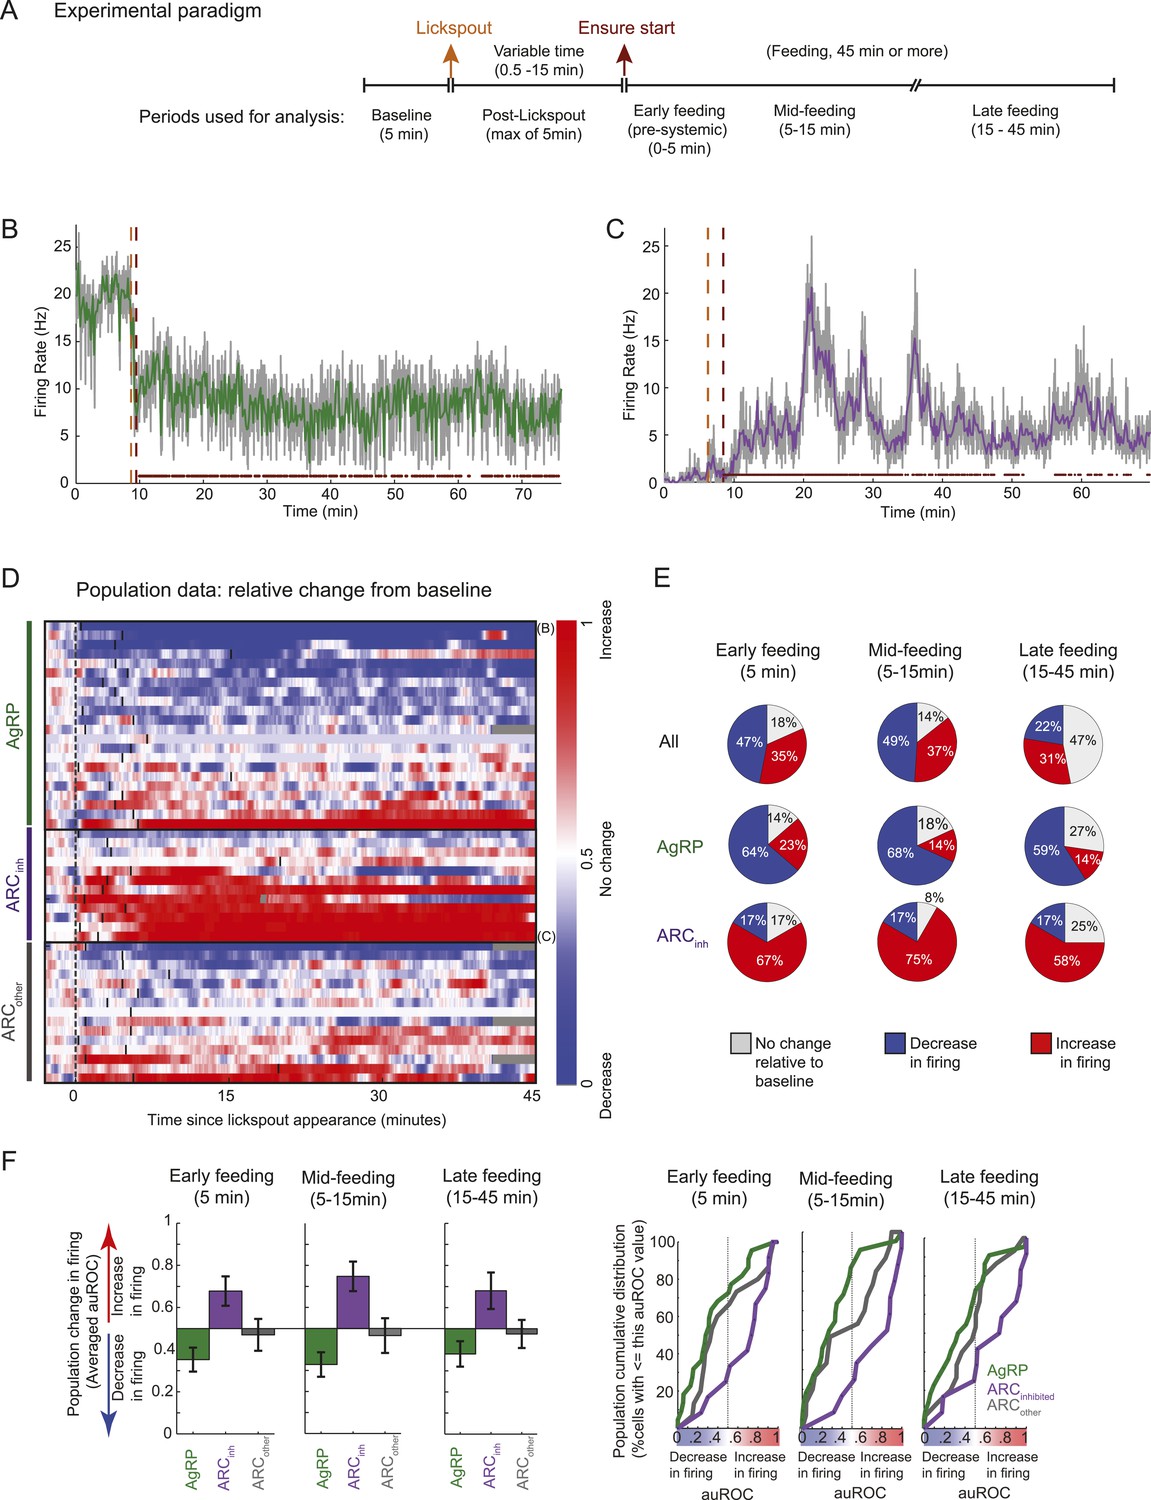
Arcuate neurons are modulated on the timescale of minutes by feeding.
Following instrumental conditioning for liquid food rewards (Ensure) in food-restricted mice, we recorded arcuate neuron changes during feeding. (A) Experimental paradigm. First, baseline spiking was recorded for at least 5 min. A lickspout was then positioned close to the snout. After a variable duration (0.5–15 min), food was made available, at which point licking resulted in a delivery of 10 μl of liquid food. Typically, the mouse continued to eat for at least 45 min, beginning with almost continuous licking and gradually transitioning to sparser feeding bouts (see below). (B) An example AgRP neuron demonstrating a fast and sustained decrease in firing within minutes of presentation of a lickspout (orange vertical dashed line; see also Figure 4A) and access to food (maroon vertical dashed line). Dots above x-axis signify 10-s bins in which licking occurred. Gray trace: firing rate in 2-s bins; colored trace: 10-s bins. Significant decreases in firing were observed from pre-lickspout baseline to the periods following access to food (p < 0.001 for early-, mid-, and late-feeding periods). (C) Similar to B, but for an example ARCinh neuron that demonstrated significant increases in firing post-feeding onset (p < 0.001, for early-, mid-, and late-feeding periods; see also Figure 4A). (D) Timecourses of increases (red), decreases (blue), or no reliable change (white) in firing from pre-lickspout baseline (gray vertical dashed line) for each cell recorded during this task (n = 49). For visualization purposes, this plot employs a normalized index called the area under the Receiver Operating Characteristic Curve (auROC; see ‘Materials and methods’). Short vertical black lines denote the onset of food availability. Example neurons in B and C are denoted by ‘B’ and ‘C’, respectively. (E) Proportion of cells recorded that responded with a significant (two-sample KS-test, p < 0.025) increase (red), decrease (blue), or with no change in firing at 0–5 min (left), 5–15 min (middle), and 15–45 min (right) post-feeding onset. Data include 22 AgRP neurons, 12 ARCinh neurons, and 15 ARCother neurons from 5 mice. (F) Comparison of auROC values, across AgRP, ARCinh, and ARCother (green, purple, and gray, respectively) neurons, during early-, mid-, and late-feeding periods (left, middle, and right panels, respectively). Left: bar plot showing averaged auROC (a value of 0.5 reflects no change in distributions of firing rate). For early-, mid-, and late-feeding periods, mean auROC for ARCinh (early: 0.68, mid: 0.75, late: 0.68) is significantly larger than those of AgRP (early: 0.35, mid: 0.33, late: 0.38; Analysis of variance, p = 0.046, 0.00004, 0.014, respectively). Error bars denote SEM. Right: cumulative distribution of auROC values across neurons in each class, for all feeding periods. The abscissa value at an ordinate of 50% indicates the median auROC for each class.
Figure 3—figure supplement 1
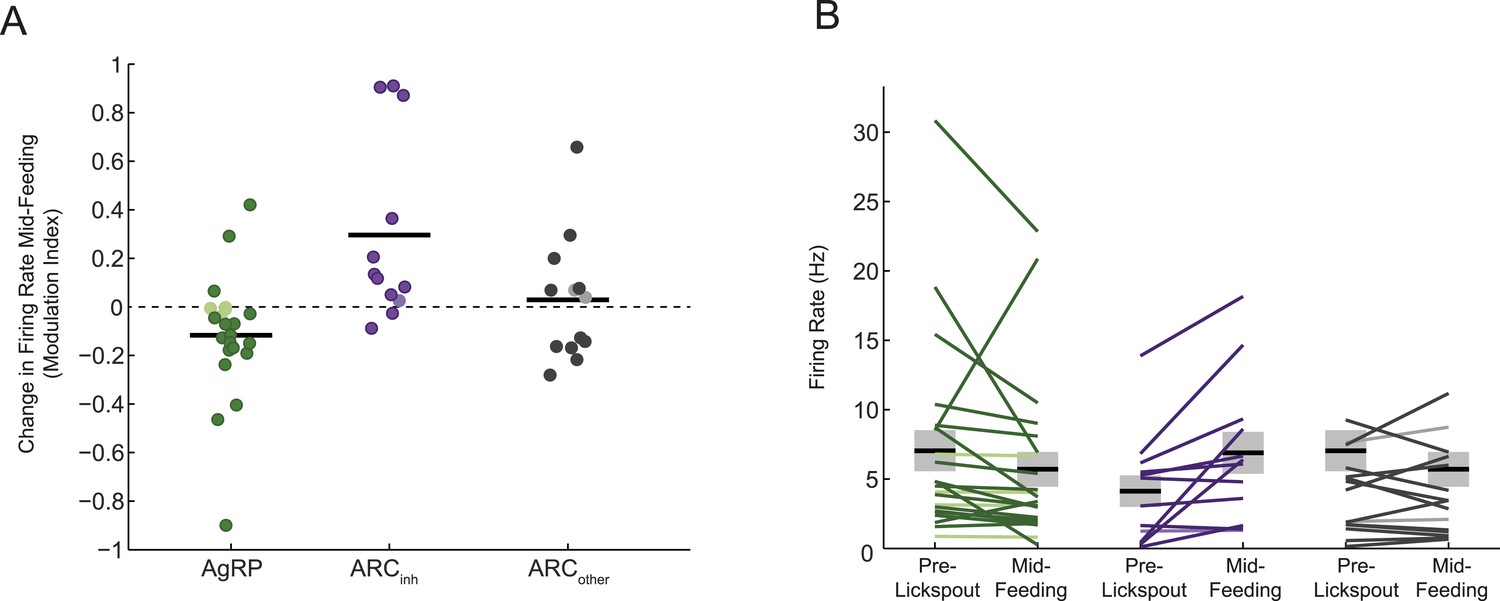
Different feeding effects in separate populations of arcuate neurons.
(A and B) Comparisons of auROC firing modulation index (A; modulation index: (5–15 min post ensure—baseline)/(5–15 min post ensure + baseline)) and firing rate (B) mid feeding (5–15 min post-feeding onset) as compared to baseline, for AgRP neurons (green), ARCinh neurons (purple), and ARCother neurons (gray). More darkly colored lines represent significantly modulated neurons (KS-test; see Figure 2D). Population changes in absolute firing rate (mean: black horizontal bars; SEM: gray) appeared generally consistent with changes at the level of single neurons (Figure 3B,C) but were significant only for the ARCinh class (AgRP neurons: p = 0.16; ARCinh neurons, p = 0.01; ARCother neurons; p = 0.8; paired sample t-test), likely due to the large variability in baseline firing rates (see main text).
Figure 3—figure supplement 2
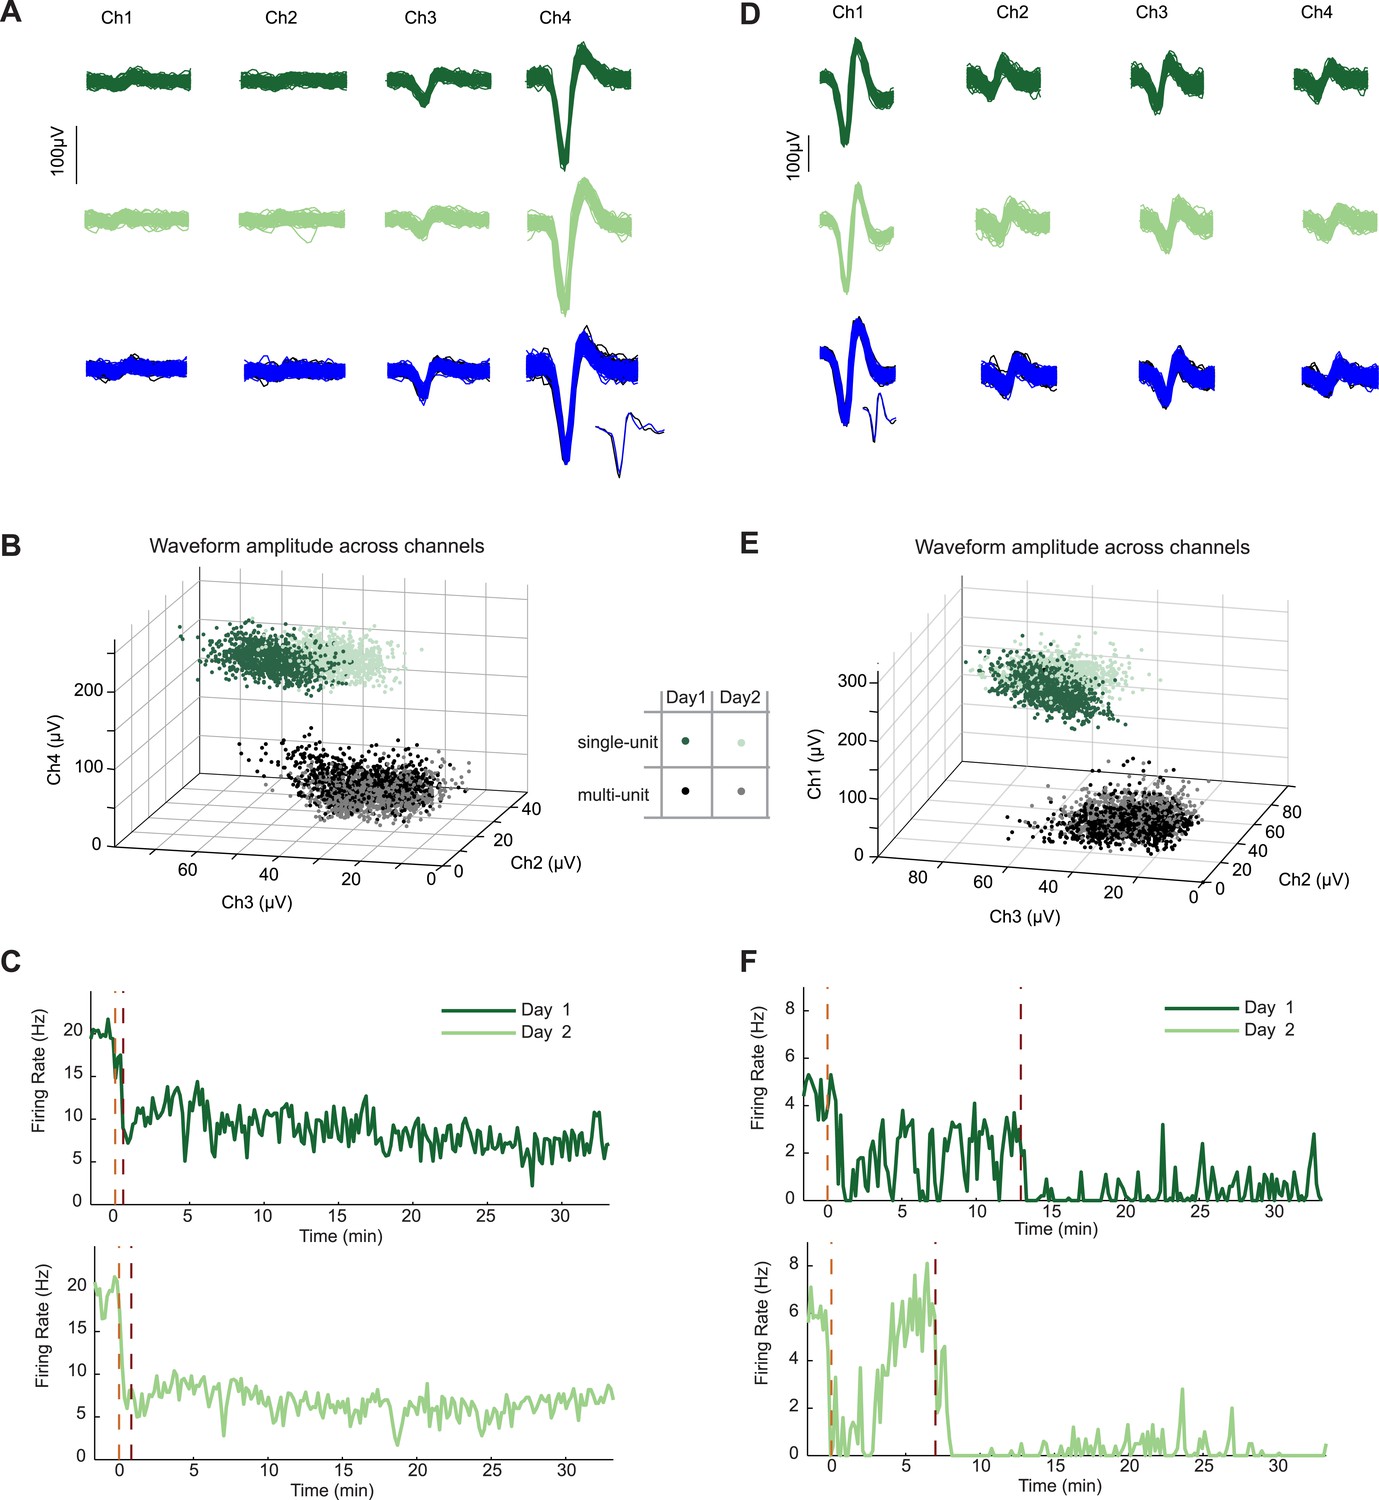
Neurons recorded across multiple days show similar firing changes to food-associated cues and feeding.
In two mice, we recorded the same AgRP neuron in two subsequent sessions during the feeding task. (A) Similarity of spike waveforms in the four recording channels across day 1 (top) and day 2 (middle). Similarity of spike waveforms (bottom) from prior to (black) and during (blue) AgRP photostimulation. Inset, one individual spike waveform from each epoch. (B) Ratio of waveform amplitudes across electrode channels was also similar. (C) Spiking activity during day 1 and 2 of recording from the same AgRP neuron demonstrated strikingly similar responses across days to both lickspout placement (orange dashed line) and to the onset of feeding (maroon dashed line). Clear feeding-related drops in firing occurred that were distinguishable from the earlier drops following lickspout placement. (D–F) Example data from a second AgRP neuron. Same notations as in A–C. Note partial recovery following initial post-lickspout drop in firing, but not following post-feeding drop in firing.
Figure 4
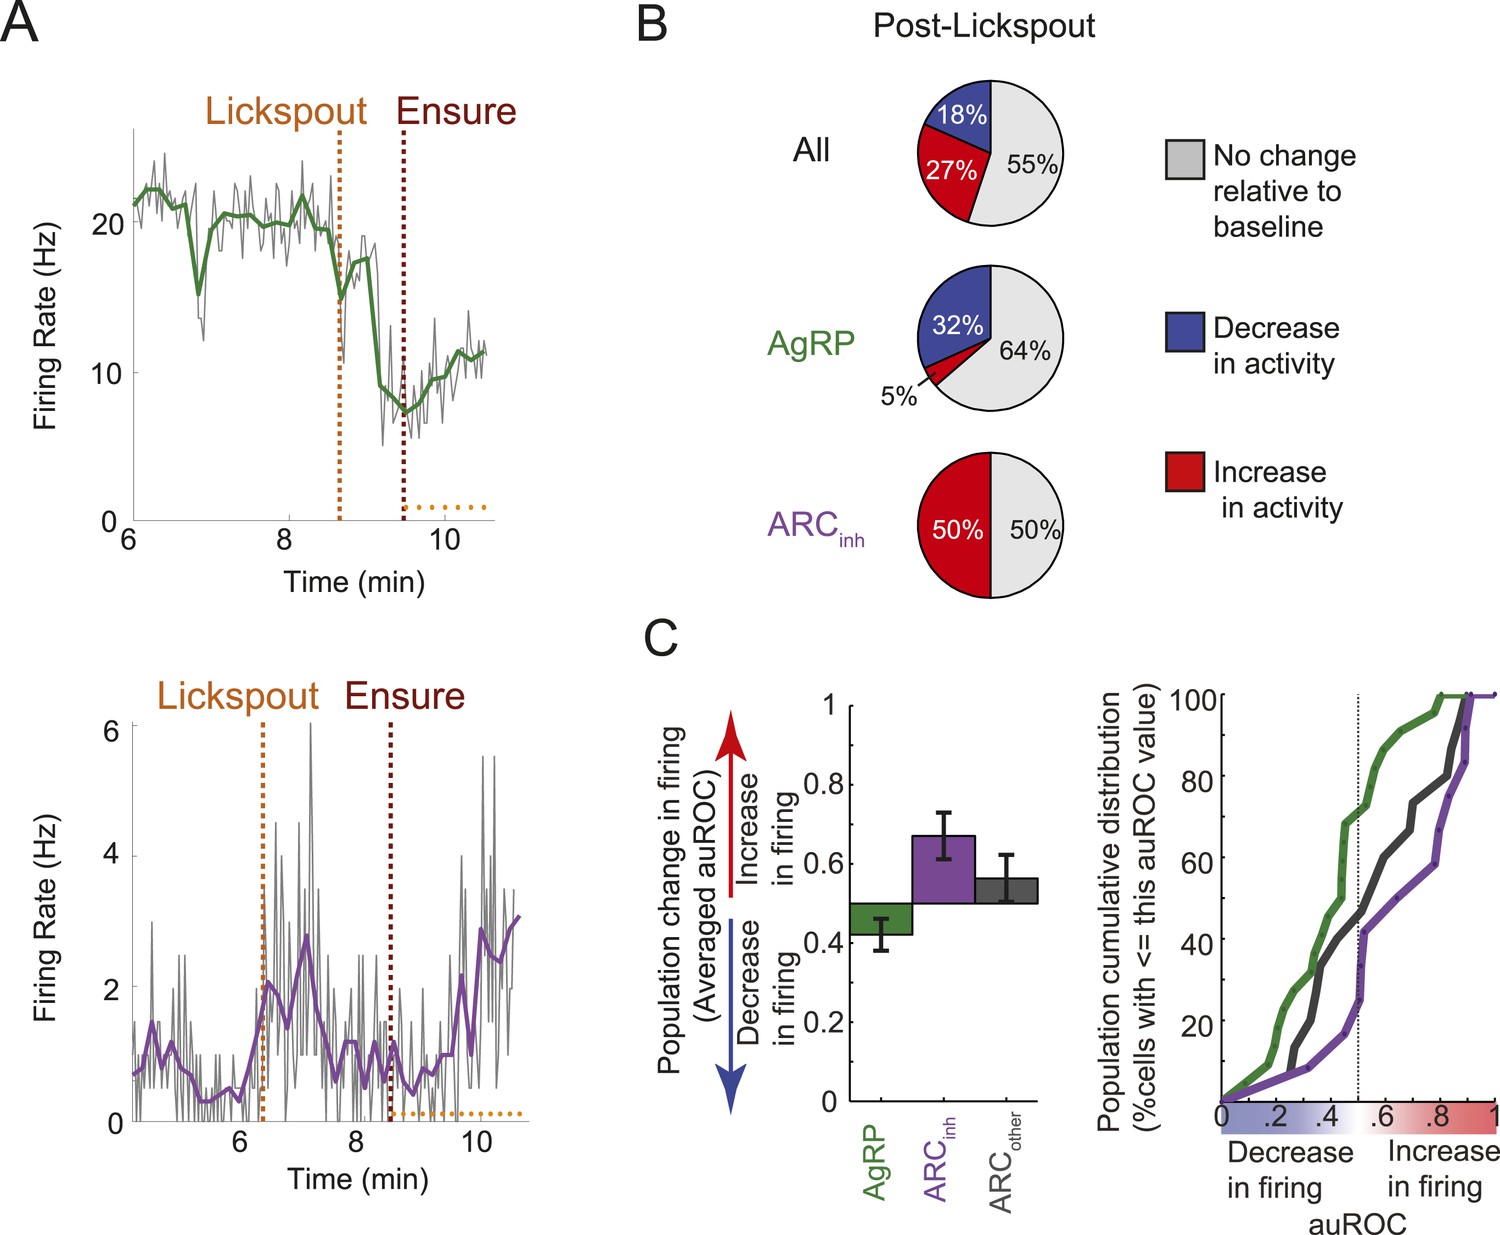
Many ARC neurons are modulated within minutes following food cue presentation, but prior to feeding.
(A) Spiking activity of the same cells shown in Figure 3B,C, zoomed-in to illustrate the drop in spiking in response to presentation of a food cue (lickspout placement near the snout; orange dashed line) but prior to onset of food delivery (maroon dashed line). Top: AgRP neuron showing a significant food cue-induced decrease (two-sample KS-test, p < 0.001); Bottom: ARCinh neuron showing a significant food cue-induced increase (p < 0.001). (B) Proportion of cells recorded that responded with a significant (two-sample KS-test, p < 0.025) increase in firing (red), decrease in firing (blue), or with no change in firing (gray) following lickspout placement but prior to feeding. (C) Comparison between averaged auROCs of AgRP, ARCinh, and ARCother neurons (green, purple, and gray, respectively) for the period between lickspout placement and feeding (cf. Figure 3F). Left: bar plot of mean auROC (0.5 indicates no change in a neuron's distribution of spike rates) across classes. Mean auROC for ARCinh (0.67) is significantly larger than that of AgRP (0.42) (Analysis of variance, p = 0.0046). Error bars denote SEM. Right: cumulative distribution of auROC values for all ARC classes.
Figure 5
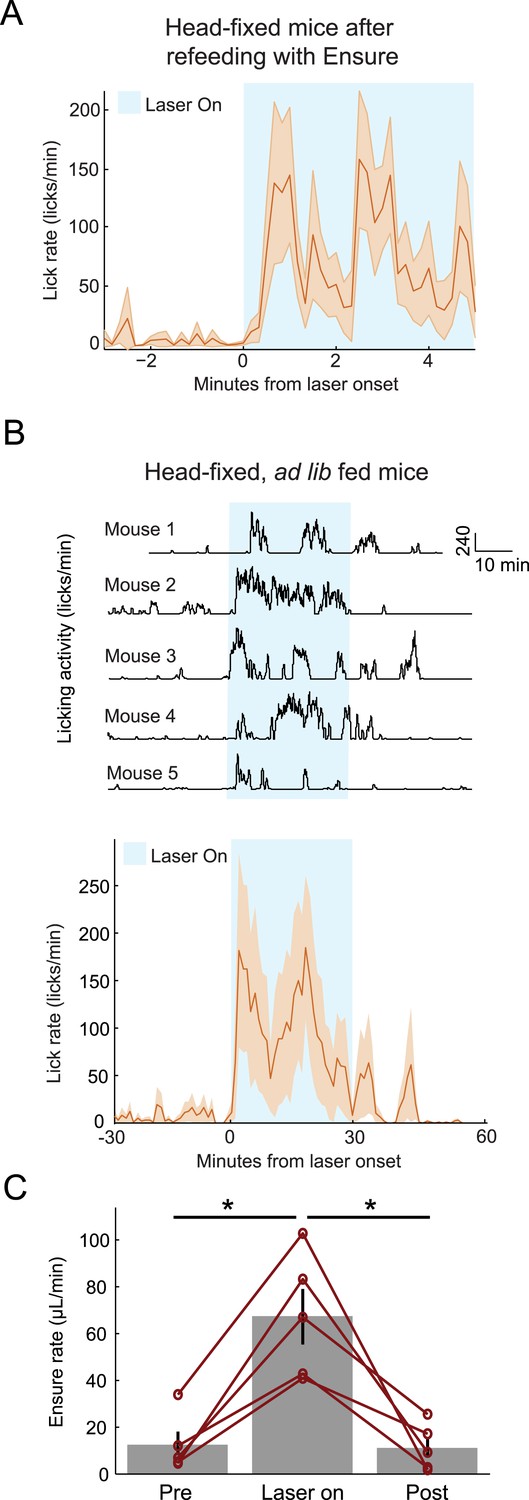
Optogenetic activation of AgRP neurons promotes licking behavior and food consumption in head-restrained mice.
(A) Mice that have been fed Ensure to satiety (see Figures 3, 4) subsequently increased licking for Ensure in response to optogenetic photostimulation of AgRP neurons. (B) Ad libitum-fed mice also increased licking for Ensure in response to optogenetic photostimulation of AgRP neurons, even when head-restrained (Top: individual single-session examples from 5 separate mice; Bottom: mean ± SEM of lick rate from 5 mice). (C) Ad libitum-fed mice increased food consumption in response to optogenetic stimulation of AgRP neurons, even when head-restrained (asterisks indicate paired t-tests, p<0.02).
Figure 6 with 2 supplements
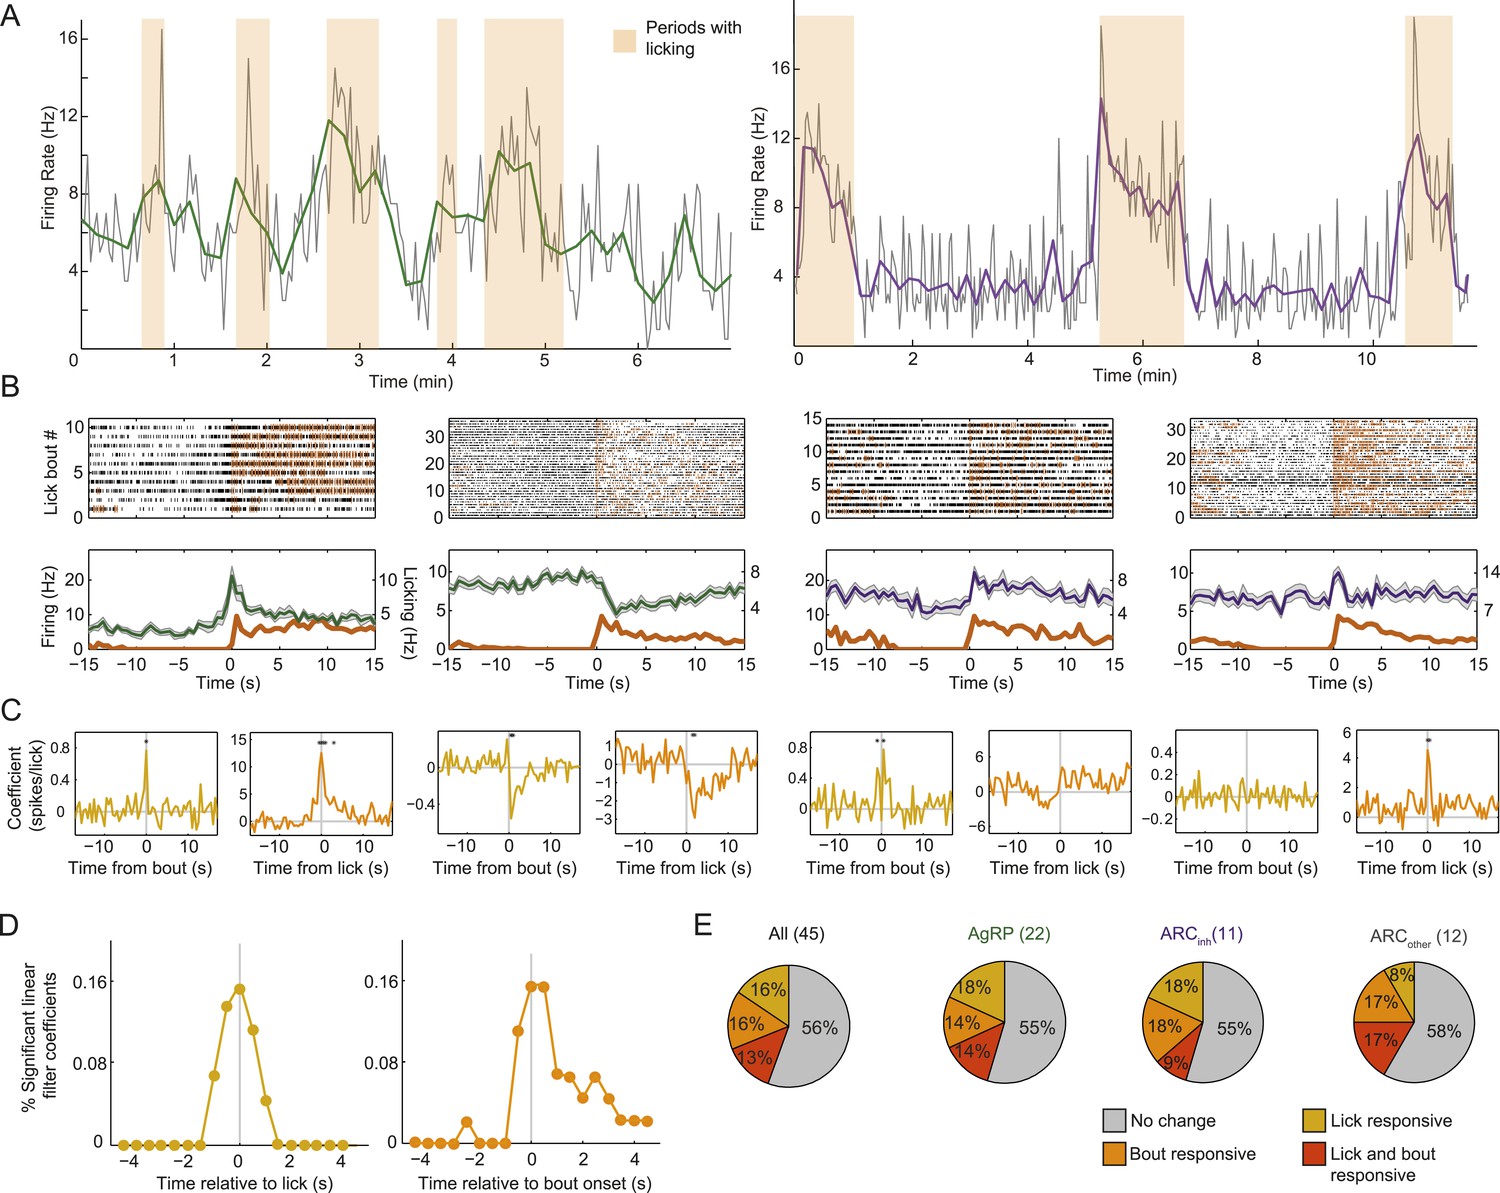
Arcuate neurons are modulated on short timescales by licking activity.
We evaluated whether ARC neuron firing could be modulated by bouts of licking for food (defined by >8 s without licking, followed by a burst of >3 licks) and/or by the occurrence of an individual lick (timescale of <1 s). (A) Example firing rate traces (gray: 2-s bins; green/purple: 10-s bins) and licking (orange) from an AgRP neuron (left) and an ARCinh neuron (right) that both showed positive correlations between firing rate and licking bouts. (B) Top: raster plots of spiking (black ticks) and licking (orange ticks) for four example neurons, aligned to the onset of a licking bout. Bottom: average firing (mean ± SEM) relative to bout onset for AgRP neurons (green) and ARCinh neurons (purple). Dark orange traces are average lick rates. Note that firing of some cells appears linearly related to frequency of individual licks (e.g., third panel from left), while firing in other cells appeared more strongly modulated by bout onset (first and fourth panles from left). Several AgRP neurons (e.g., second panel from left) showed a reliable decrease in firing at bout onset. (C) We estimated the degree of modulation of firing across time relative to an individual lick (gold traces), and relative to an individual bout onset (orange), using multiple linear regression. Asterisks indicate times of significant modulation, relative a lick or lick bout (F-test, p < 0.002, corrected for multiple comparisons; see ‘Materials and methods’). (D) Population distribution of times relative to a single lick (gold) or lick bout (orange) at which significant modulation of firing (asterisks in C) occurred across 44 cells. Note that many neurons began changing their firing before the onset of a lick or lick bout (gray vertical lines), and that modulation mostly occurred within ±1–2 s of onset of a lick or lick bout, demonstrating modulation of ARC neuron firing at a surprisingly fast timescale. (E) Proportions of neurons in each class that were significantly modulated by individual licks (gold), lick bouts (orange), both (red), or neither (gray).
Figure 6—figure supplement 1
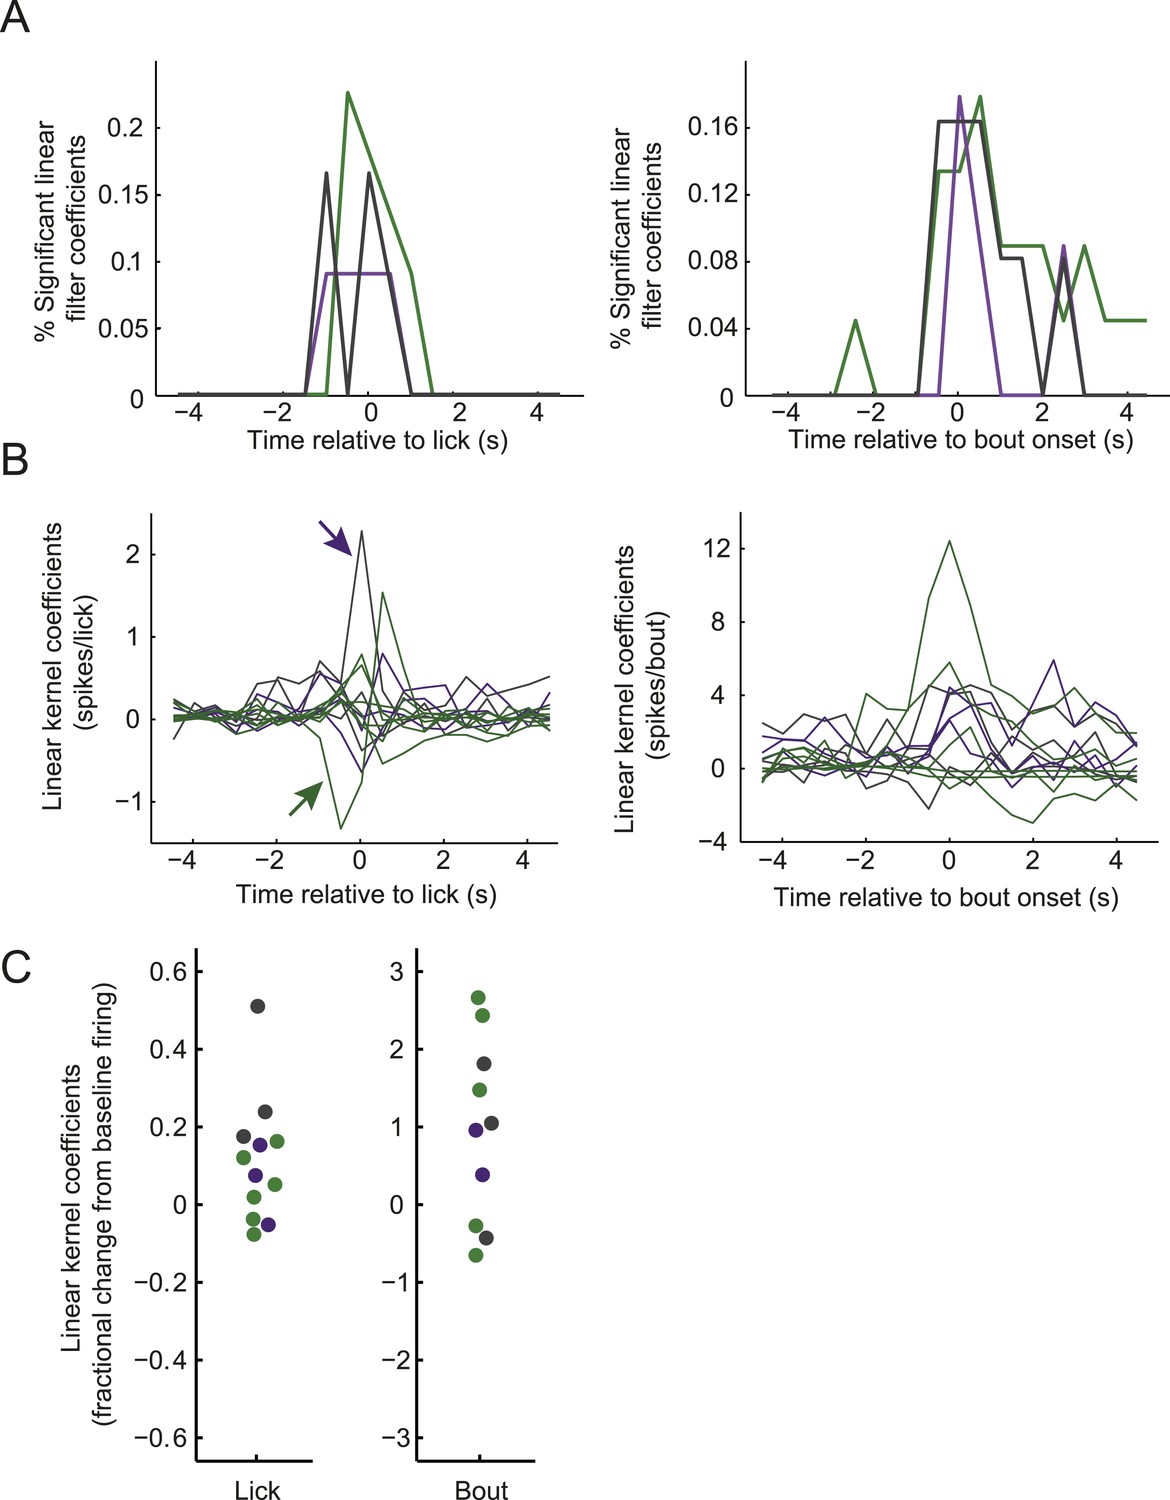
Modulation of firing by licking across classes of arcuate neurons.
(A) Distribution of times relative to lick onset (left) or lick-bout onset (right) where ARC neuron firing was significantly modulated, as in Figure 3D but plotted separately for AgRP neurons (green), ARCinh neurons (purple), and ARCother neurons (gray). (B) Linear relationship (kernel estimate from multiple linear regression, see ‘Materials and methods’) of ARC firing rate modulation (in 0.5-s bins) surrounding lick onset (left) or lick-bout onset (right), as in Figure 3C but plotted for all neurons exhibiting significant modulation for at least one time point (F-statistic for regression, p < 0.002, corrected for multiple comparisons across time points). Colors indicate cell class, as in A. The left panel indicates, for example, that a putative POMC neuron (purple arrow) increased its firing, on average, by approximately 2.4 spikes in the 0.5-s bin at which an individual lick occurs, while an AgRP neuron (green arrow) decreased its firing, on average, by 1.3 spikes in the 0.5 s prior to the occurrence of each individual lick. (C) To provide an estimate of the sign and relative magnitude of the modulation of ARC firing by lick events, we estimated the time point (within ±2 s of the lick or bout onset) with the larger significant modulation coefficient, for all traces in B. We then normalized this coefficient to the mean firing rate of the cell (offset estimate from regression analysis) to provide an estimate of relative modulation of firing by licking for individual cells. The data show that licking and onsets of lick bouts could decrease or, more often, increase ARC neuron firing, with lick bouts increasing firing by up to ∼300% (three fold), and individual licks by up to ∼50%.
Figure 6—figure supplement 2
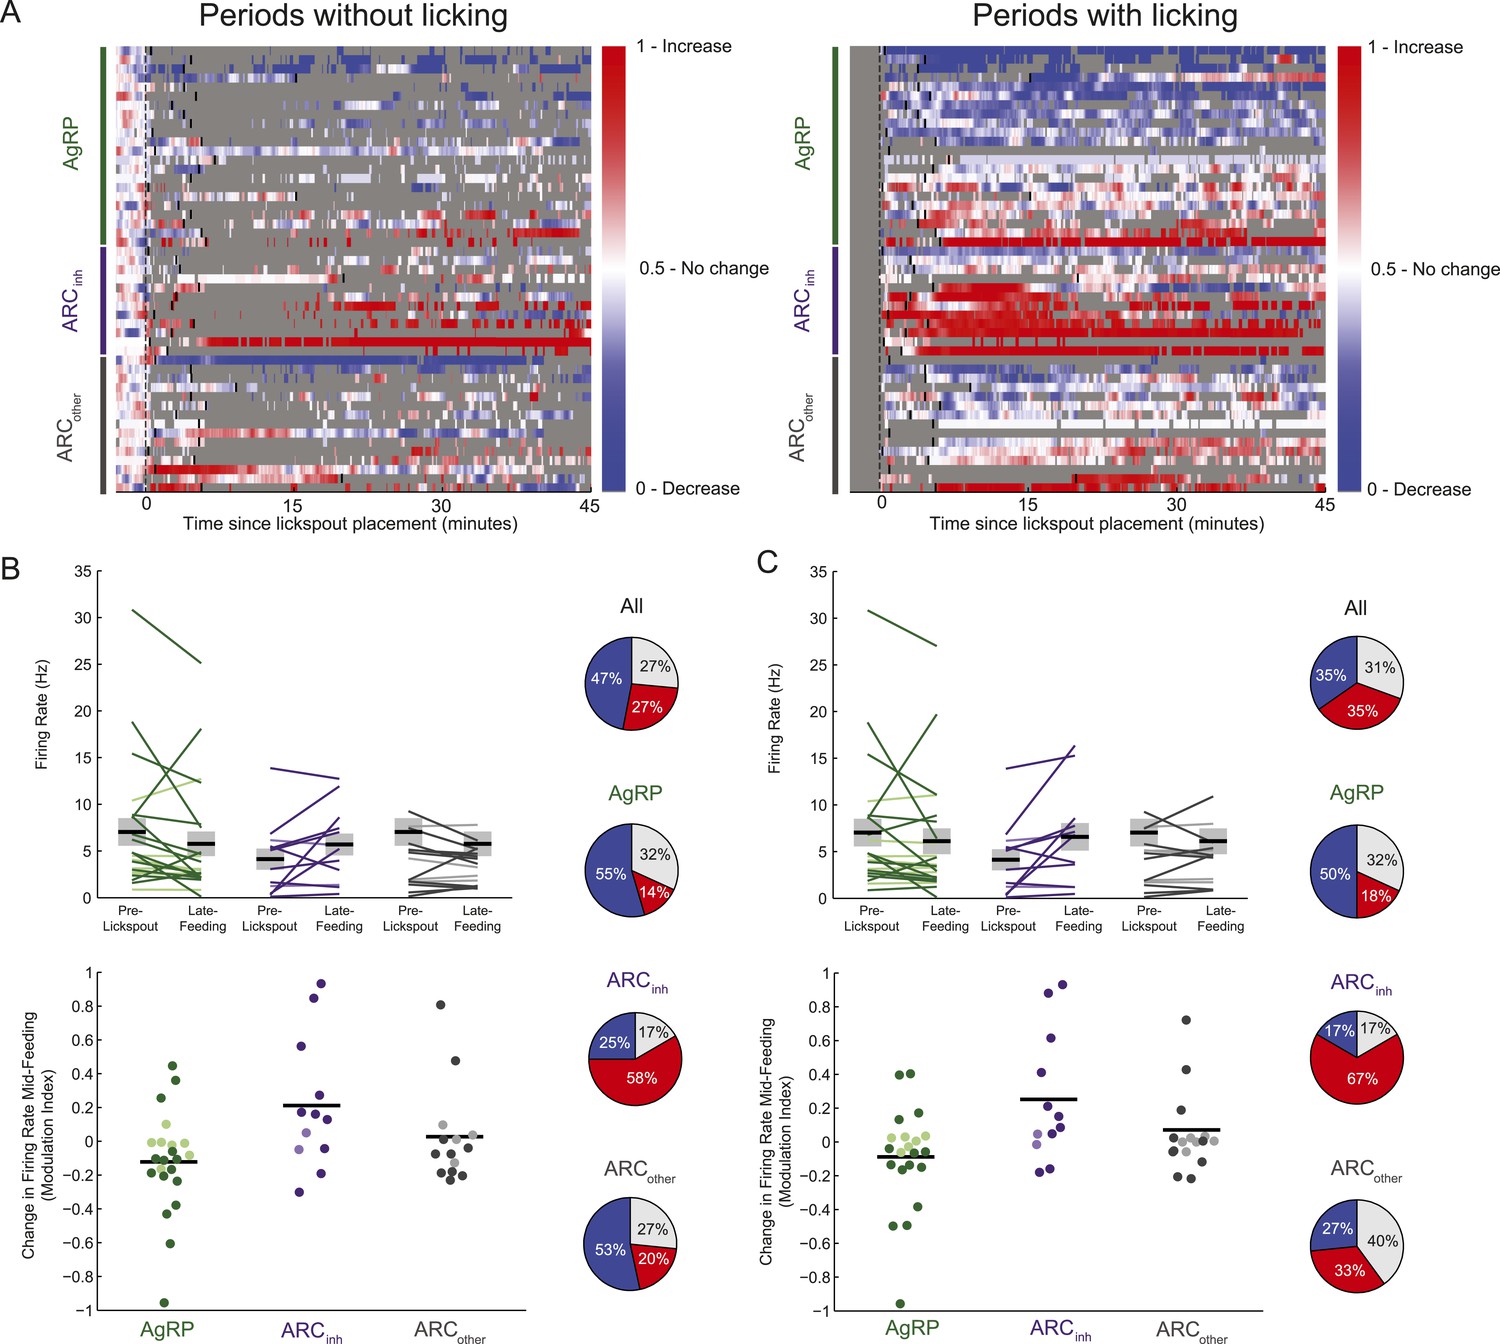
Feeding-related effects are observed independent of licking behavior.
(A) As in Figure 3D, timecourses of increases (red), decreases (blue), or no reliable change (white) in firing from pre-lickspout baseline (gray vertical dashed line) are plotted for each cell recorded during this task. For visualization purposes, this plot employs a normalized firing index called the auROC; see ‘Materials and methods’. Short black lines denote the onset of food availability. In the left panel, all time bins within 5–10 s of any lick are grayed out, to better visualize feeding-related responses not contaminated by licking effects. In the right panel, all firing changes data surrounding any lick events are plotted. Note that sustained decreases (blue) in AgRP neuron firing, and increases (red) in ARCinh firing, appear consistent irrespective of licking behavior. (B) Comparisons of absolute (top) and normalized (bottom) firing rates, in the 5-min pre-lickspout placement, compared to 15–45 min post-feeding onset, calculated using only periods without licking activity. More darkly colored lines and circles represent significantly modulated neurons (KS-test). Population changes in firing (mean: black horizontal bars; SEM: gray) were not significant for any class (AgRP neurons: p = 0.15; ARCinh neurons, p = 0.11; ARCother neurons; p = 0.37), likely due to within-class variability in baseline firing. Pie charts (right) demonstrate the number of neurons with increased (red), decreased (blue), or no significant change (gray) in activity pre-lickspout compared to 15–45 min post-feeding onset including only periods without licking. (C) Same as B, but only including periods containing licking activity. In this case, mean firing was significantly increased in ARCinh neurons (p = 0.04), while mean changes in other cell classes were not significant (AgRP: p = 0.31; ARCother: p = 0.64).
Figure 7
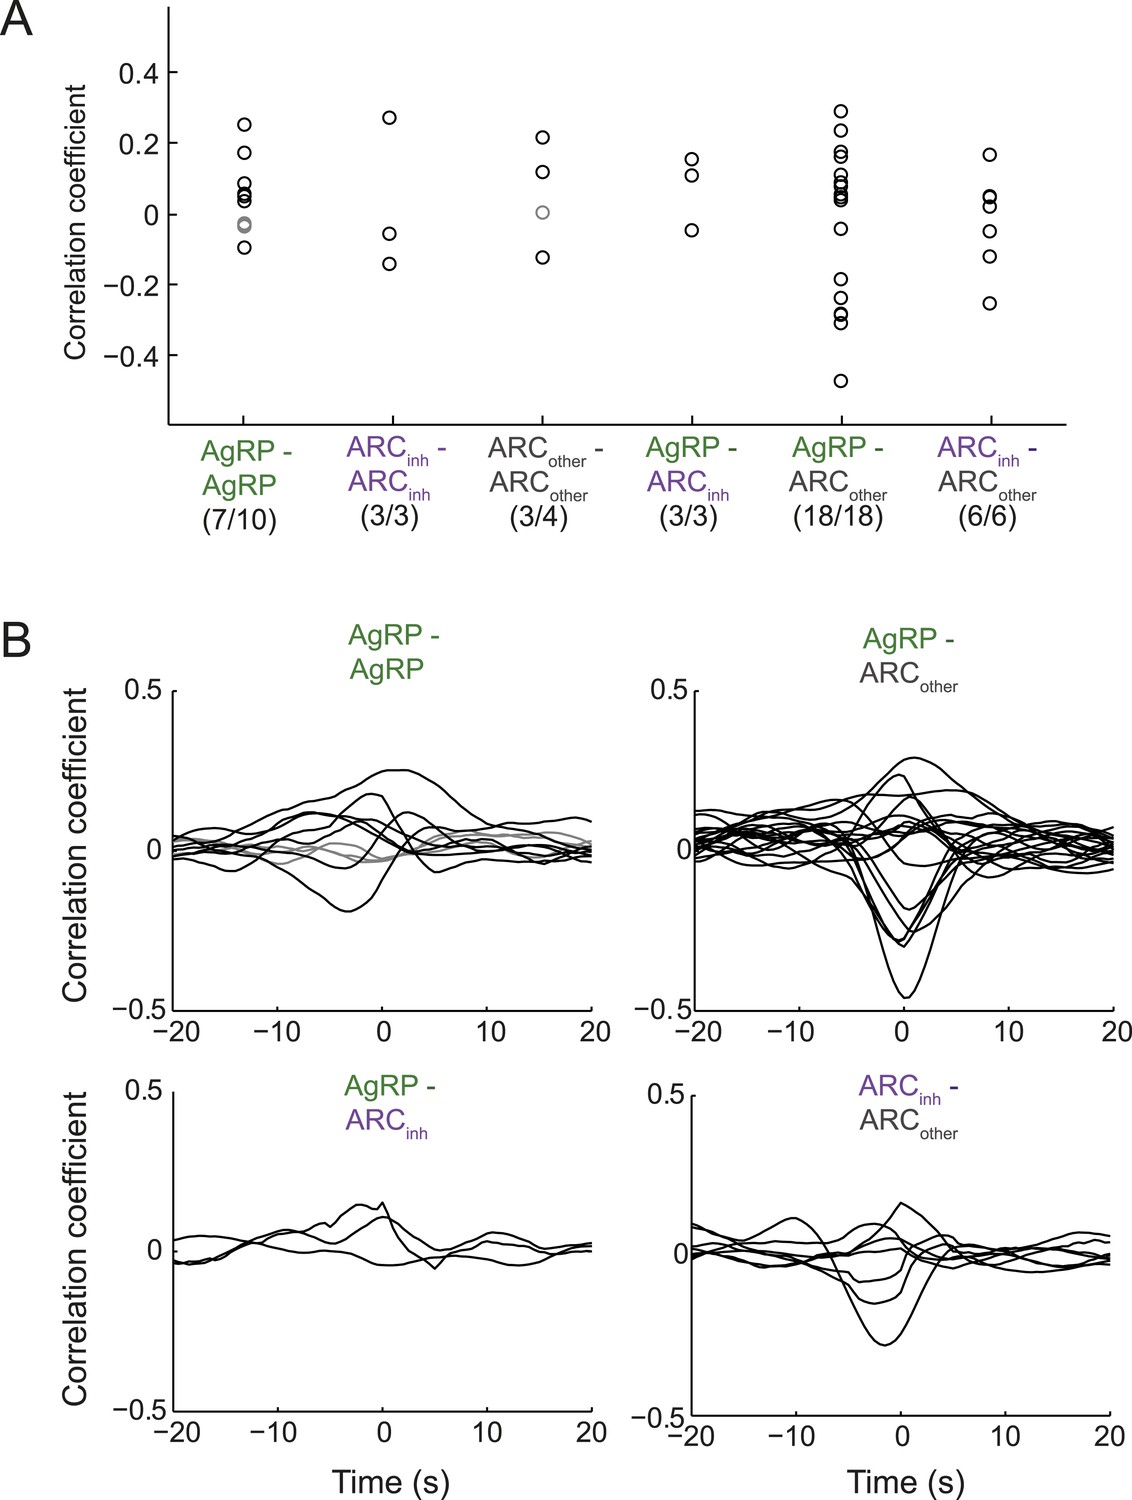
Endogenous correlations between simultaneously recorded pairs of arcuate neurons.
(A) Correlation coefficients (at zero time-lag) across pairs of simultaneously recorded neurons within a class or across classes of ARC neurons. While 7/10 pairs of AgRP neurons showed significant correlation coefficients (p < 0.05), the correlations were modest (all <0.3). Similar results were observed for other pairs. To ensure that correlation coefficients did not simply reflect slow concurrent changes in firing across neurons, we first removed slow trends in firing from each cell's spike-rate timecourse (slower than ∼100 s, by high-pass filtering firing rate timecourses above 0.01 Hz). (B) To examine the timescale of correlation between pairs of neurons, we calculated correlations between pairs at lags up to ±20 s. Most pairs with significant correlations (black lines) peaked near zero time-lag, with correlations falling off by 5 s of lag. These data suggest that pairs of ARC neurons within and across classes can show modest but significant correlations or anti-correlations at the timescale of ∼1 s.
Figure 8

ARC neurons are modulated on multiple timescales.
We observed slow, likely homeostatic, changes in ARC neuron activity, consistent with the established role for ARC AgRP and pro-opiomelanocortin (POMC) neurons in regulating energy balance. However, we also demonstrated fast changes, on the order of minutes and even seconds, in response to feeding, food-associated cues, and licking behavior. Differential modulation of these opposing populations of neurons on these timescales may enable both homeostatic and more rapid adjustment of downstream circuits that underlie complex feeding-related behaviors, including food-seeking and food consumption. PVH: paraventricular hypothalamus; DMH: dorsomedial hypothalamus; LH: lateral hypothalamus.
Download links
A two-part list of links to download the article, or parts of the article, in various formats.
Downloads (link to download the article as PDF)
Open citations (links to open the citations from this article in various online reference manager services)
Cite this article (links to download the citations from this article in formats compatible with various reference manager tools)
Arcuate hypothalamic AgRP and putative POMC neurons show opposite changes in spiking across multiple timescales
eLife 4:e07122.
https://doi.org/10.7554/eLife.07122


