Acoustic duetting in Drosophila virilis relies on the integration of auditory and tactile signals
- Princeton University, United States
Figures
Figure 1 with 3 supplements
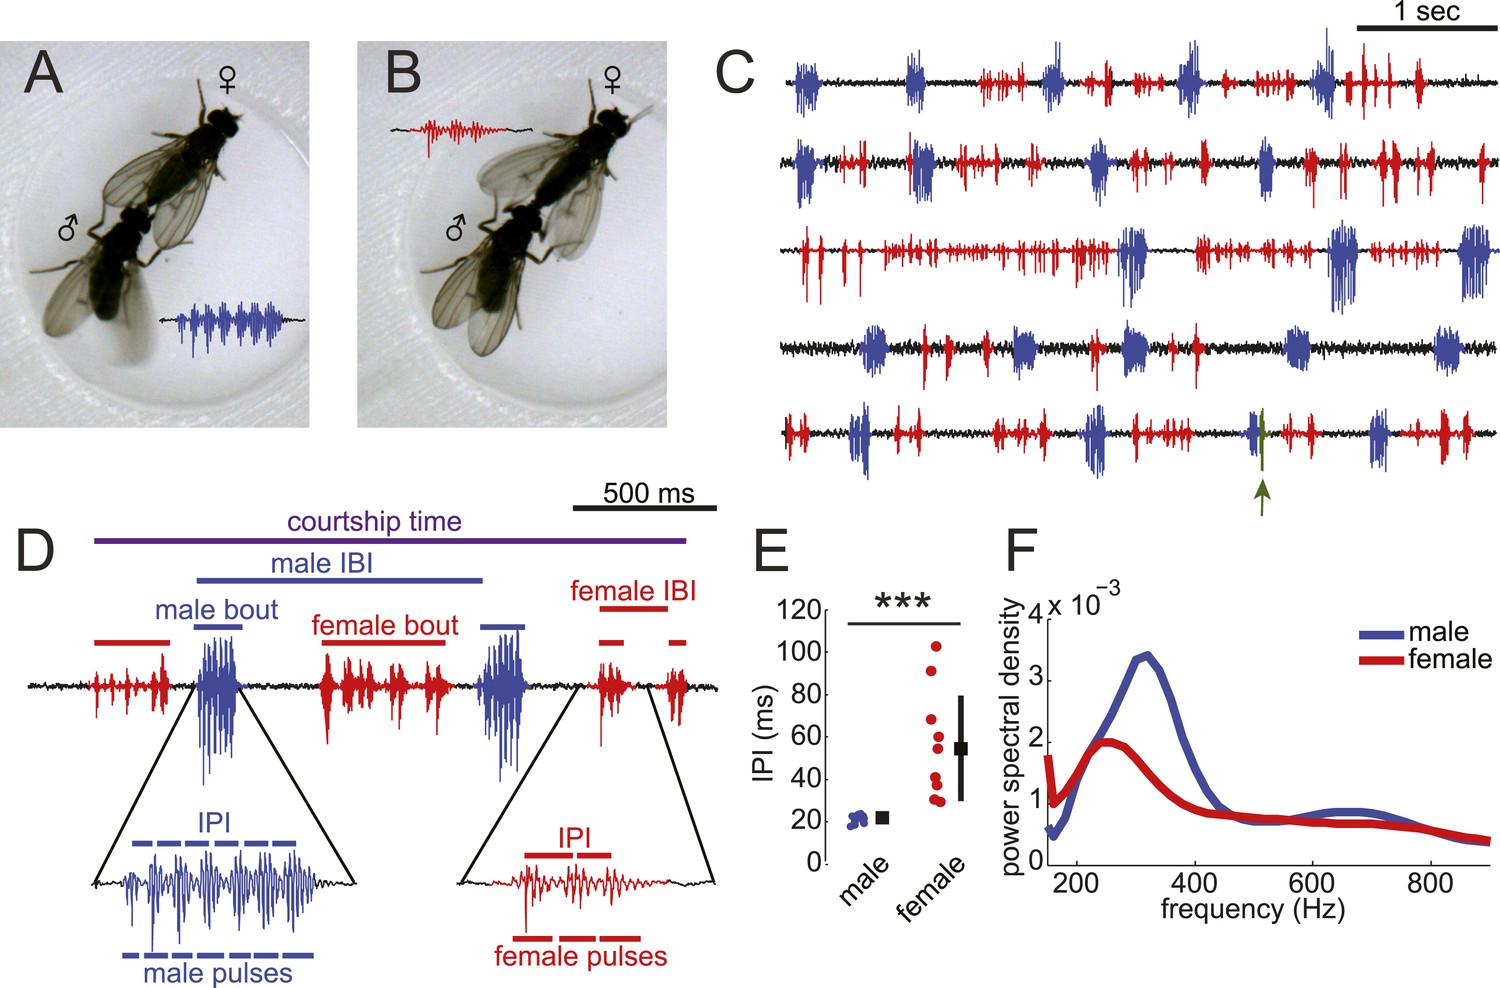
Drosophila virilis males and females produce distinct courtship songs.
Schematic of the wing movement during the production of courtship song in Drosophila virilis male (A) and female (B). (C) Examples of acoustic duets between male (blue) and female (red) in five wild-type (WT) courtships. Regions of song overlap (arrow) are shaded in green. (D) Detailed view of male (blue) and female (red) song produced during courtship. Song parameters described in the ‘Materials and methods’ and used in all analyses are indicated. IBI = inter-bout interval and IPI = inter-pulse interval. (E) The median (per individual) IPI for male (blue) and female (red) song; male and female pulses were identified by matching acoustic and video recordings (Video 1). Black squares show population mean and black bars standard deviation (n = 13 courtships, Student's t-test ***p < 0.001). (F) Power spectral density for pulses from males (n = 3854, blue) and females (n = 497, red). Based on the differences in IPI and pulse frequency between male and female song, we created a semi-automated software pipeline to segment virilis song (Figure 1—figure supplement 2).
Figure 1—figure supplement 1
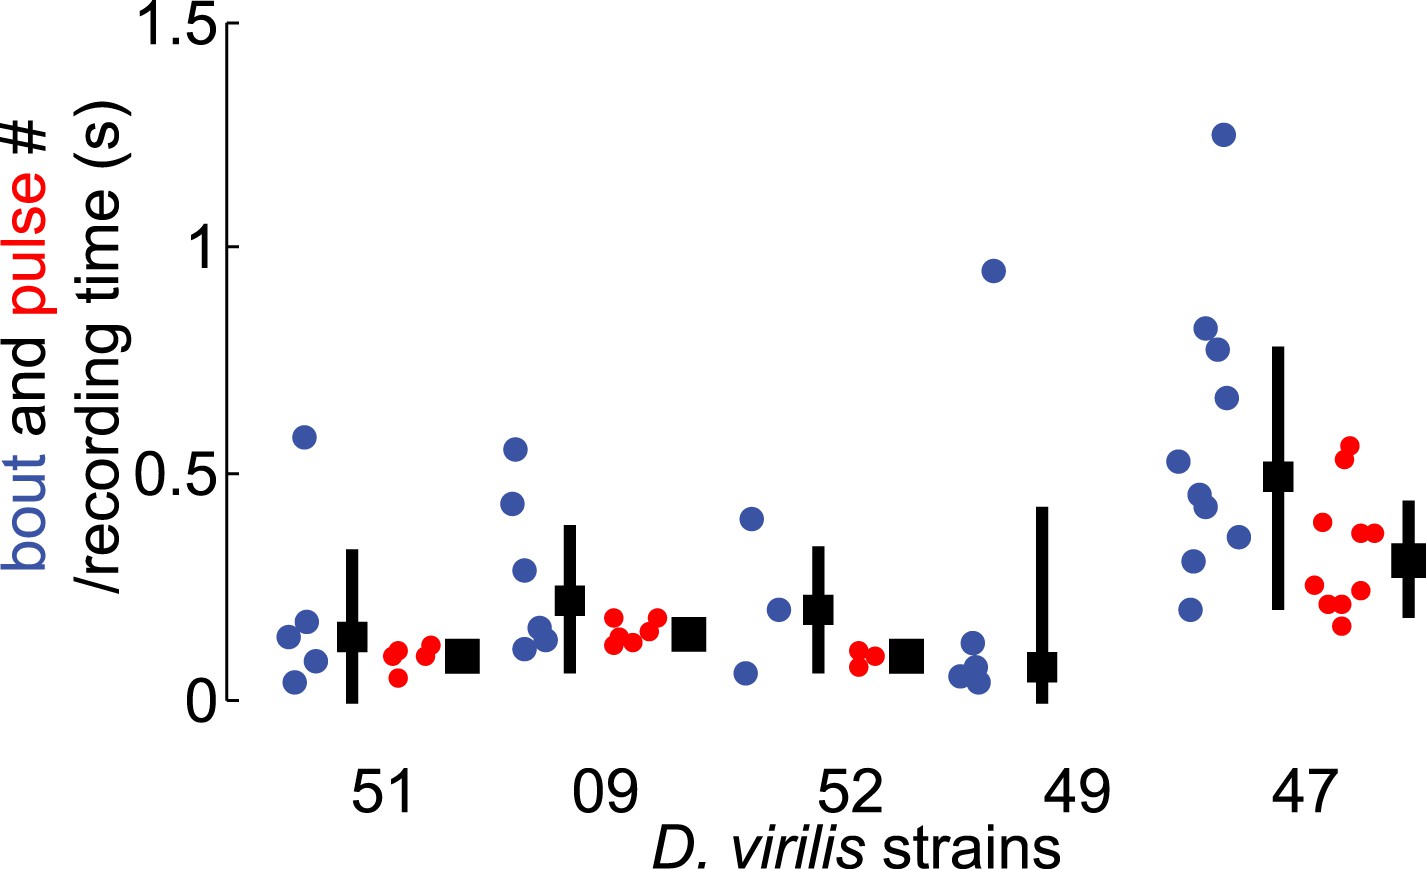
Assessment of song production in D. virilis strains.
We first chose a virilis strain to work with based on male bout (blue) and female pulse (red) rates, comparing five different D. virilis strains (n = 10 recorded courtships each, see ‘Materials and methods’) that produced song in our behavioral chambers. Black squares represent population median and black bars the IQR.
Figure 1—figure supplement 2
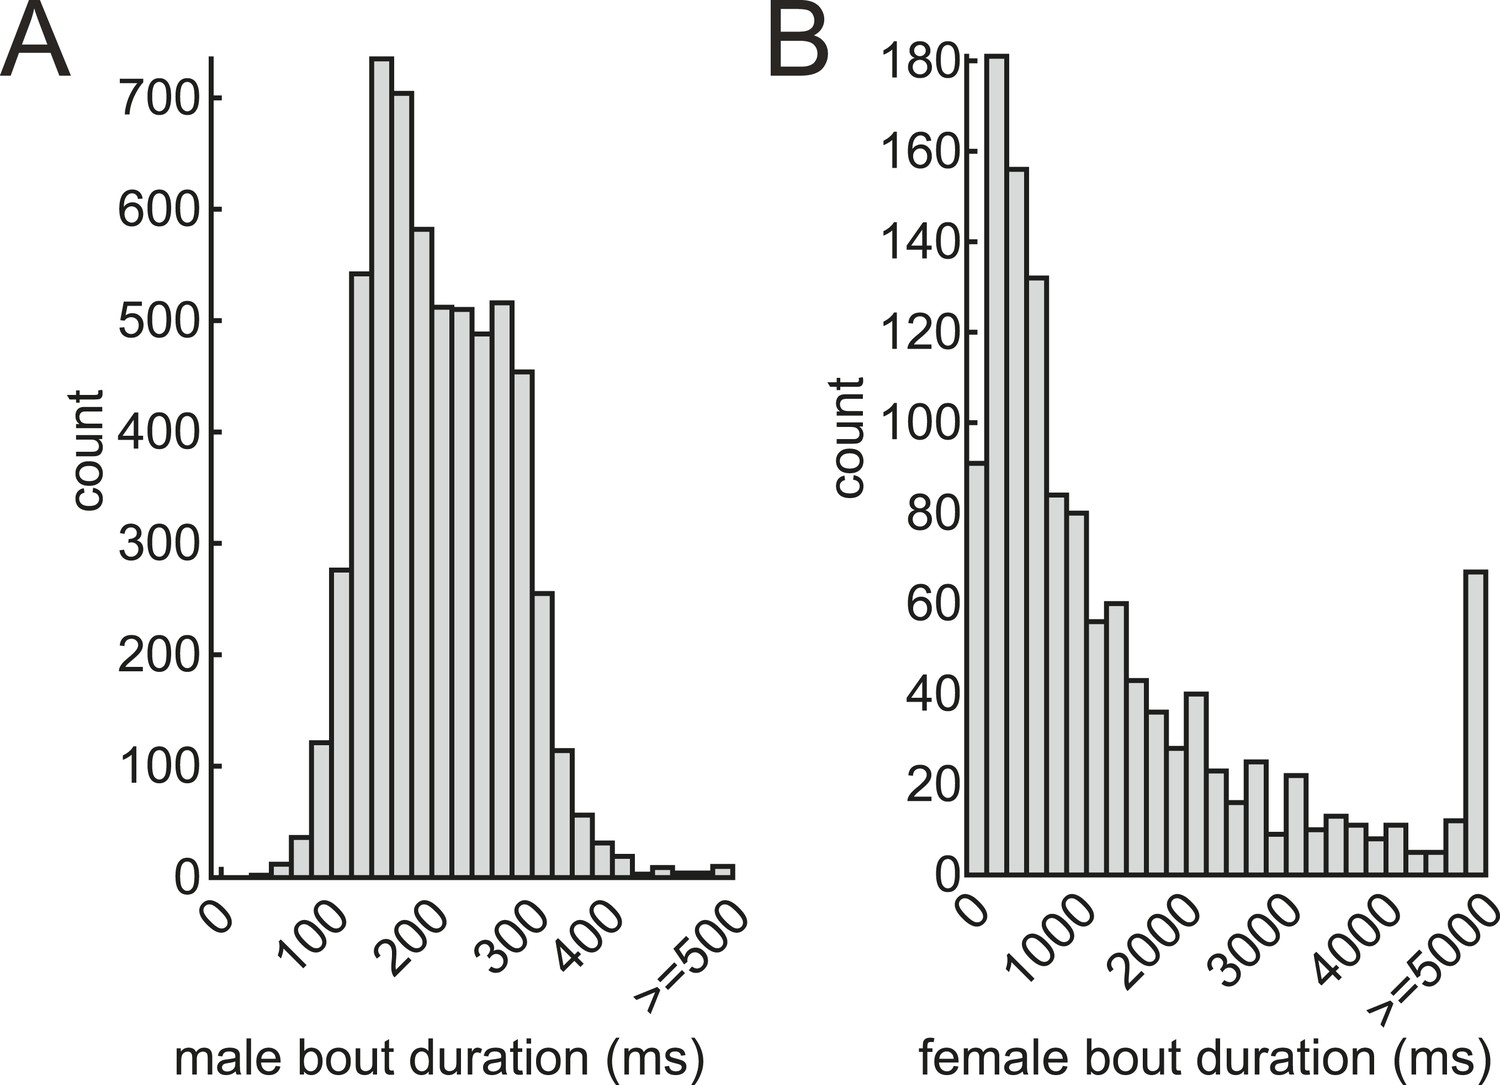
Bout durations of male and female courtship songs.
Histogram of male (A, n = 5995 bouts) and female (B, n = 1224 bouts) bout durations in 67 pairings.
Figure 1—figure supplement 3

Development of song segmentation software for Drosophila virilis.
(A) Diagram of FlySongSegmenter-Virilis, a MatLab-based software for automated song segmentation. The raw microphone signal is transformed by a wavelet basis scaled at frequencies from 100 to 900 Hz. The frequency profile of detected pulses is compared to frequency templates for male (blue) and female (red) pulses, overlapping regions (green), and noise (black). Likelihood values determine the group assignment of each pulse. The sensitivity (B), positive predictive value (PPV, C), and the harmonic mean (D) for male bout (blue) and female pulse (red) calls (n = 15 courtships), calculated by comparing manual versus automated segmentation (see ‘Materials and methods’). (E) The percent overlap (see ‘Materials and methods’) in WT courtships (n = 89 courtships). Black squares represent population median and black bars the IQR.
Figure 2 with 2 supplements
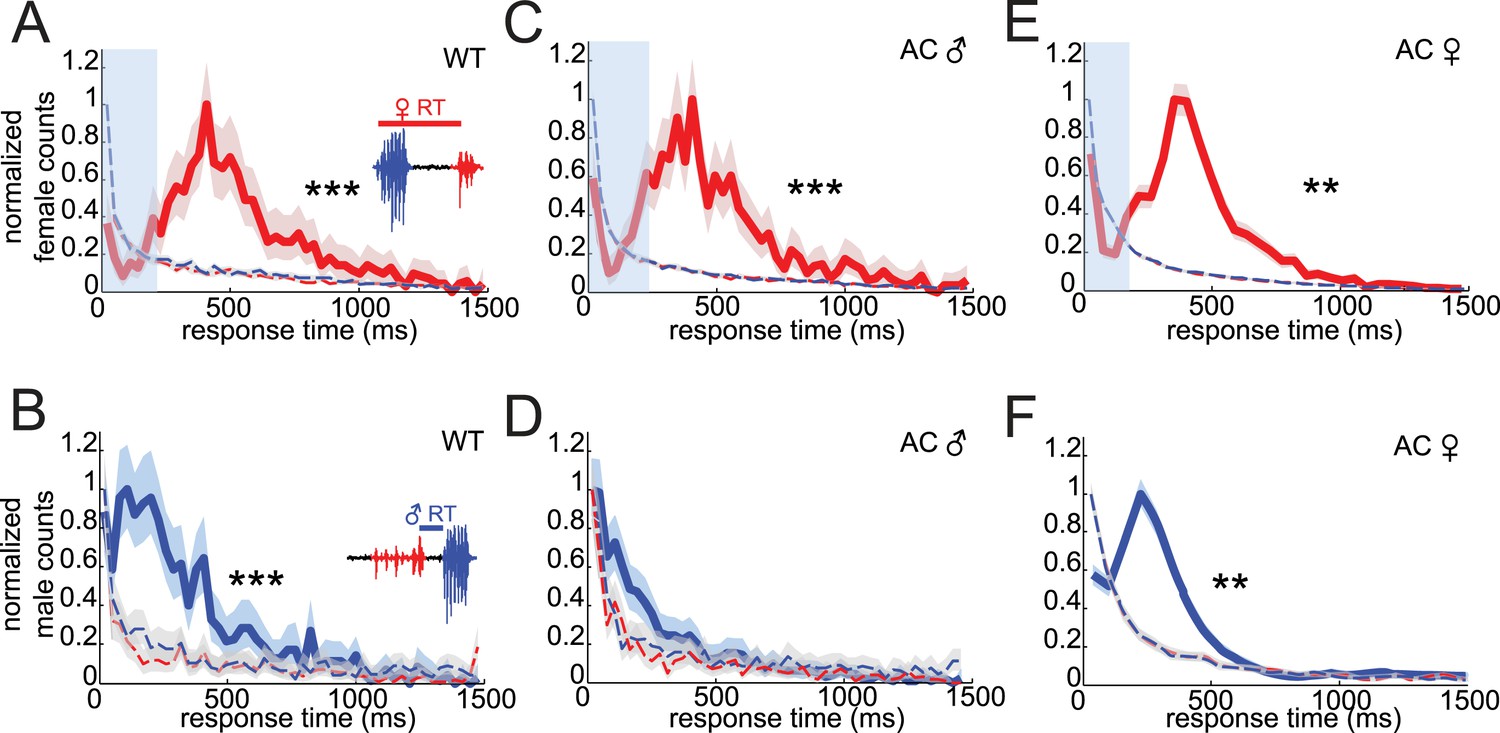
Drosophila virilis courting pairs coordinate song production into an acoustic duet.
(A) Female response times were calculated as the time between male bout onset and the following female pulse (inset). (B) Male response times were calculated as the time between the onset of the male bout and the preceding female pulse (inset). Normalized distributions of female (red, A, C, and E) and male (blue, B, D, and F) response times for: WT females paired with WT males (A, n = 970 response times and B, n = 1031 response times, n = 89 courtships), WT females paired with arista-cut (AC, deaf) males (C, n = 1173 response times and D, n = 1206 response times, n = 124 courtships), and AC (deaf) females paired with WT males (E, n = 3391 response times and F, n = 3948 response times, n = 34 courtships). Response times were also calculated after shuffling either male bout (blue dashed) or female pulse (red dashed) intervals. Comparisons with these null distributions reveal that only removing male hearing impacts response timing (Kolmogorov–Smirnov (K-S) Test ***p < 0.001 **p < 0.01). Basic song structure remains stable for the AC manipulations (Figure 1—figure supplement 2). Transparent blue bar (A, C, and E) indicates average male bout duration. Shading around each response time distribution represents bootstrapped 95% confidence intervals.
Figure 2—figure supplement 1

Quantification of male response times.
(A) Representative female pulse train preceding a male bout, where male response times were calculated from the first pulse forward (cool color scheme, from the same data set, n = 803, 749, 622, and 588, respectively, n = 83 courtships) and the last pulse backward (warm color scheme, from the same data set, n = 1031, 935, 821, 721, respectively, n = 83 courtships). (B) Normalized male response time distributions to the various female pulses within a female pulse train (*p < 0.05 compared to null distribution, Kolmogorov–Smirnov Test). (C) Kullback–Leibler (K-L) divergence values for comparisons between the response time distributions to the first, second, penultimate, and last female pulse within a pulse train, and the same response times following shuffling of male bout intervals. Larger K-L divergence values indicate that response time distributions are more distinct than the corresponding null distribution.
Figure 2—figure supplement 2
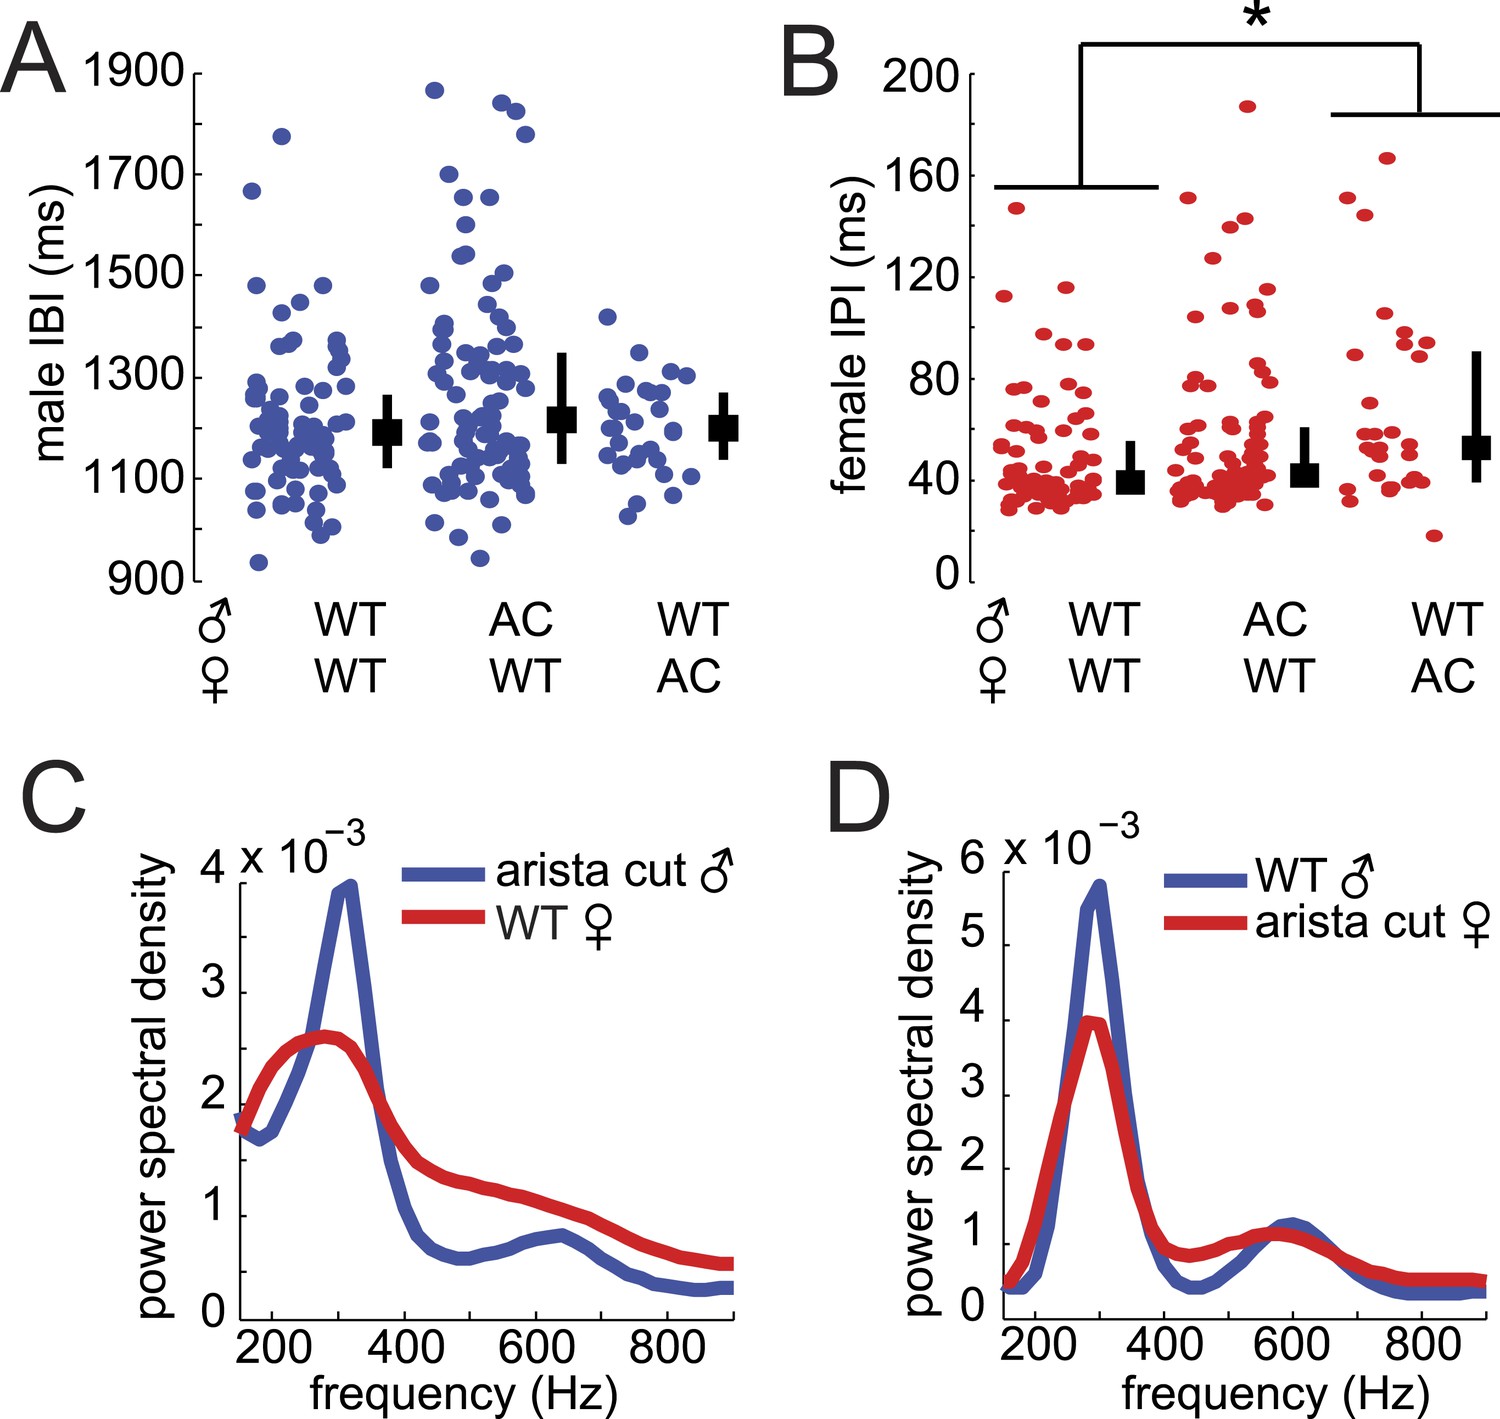
Song parameters of AC flies.
Median individual male IBI (A) and female IPI (B) from songs from WT (WT, n = 83 courtships) or AC males (n = 124 courtships) and females (n = 34 courtships, *p < 0.05 Kruskall–Wallis test). Black squares represent population median and black bars the IQR. The power spectral density of male (blue) and female (red) pulses from AC males paired with WT females (C) and AC females paired with WT males (D).
Figure 3 with 3 supplements
Testing the role of male and female song in courtship success.
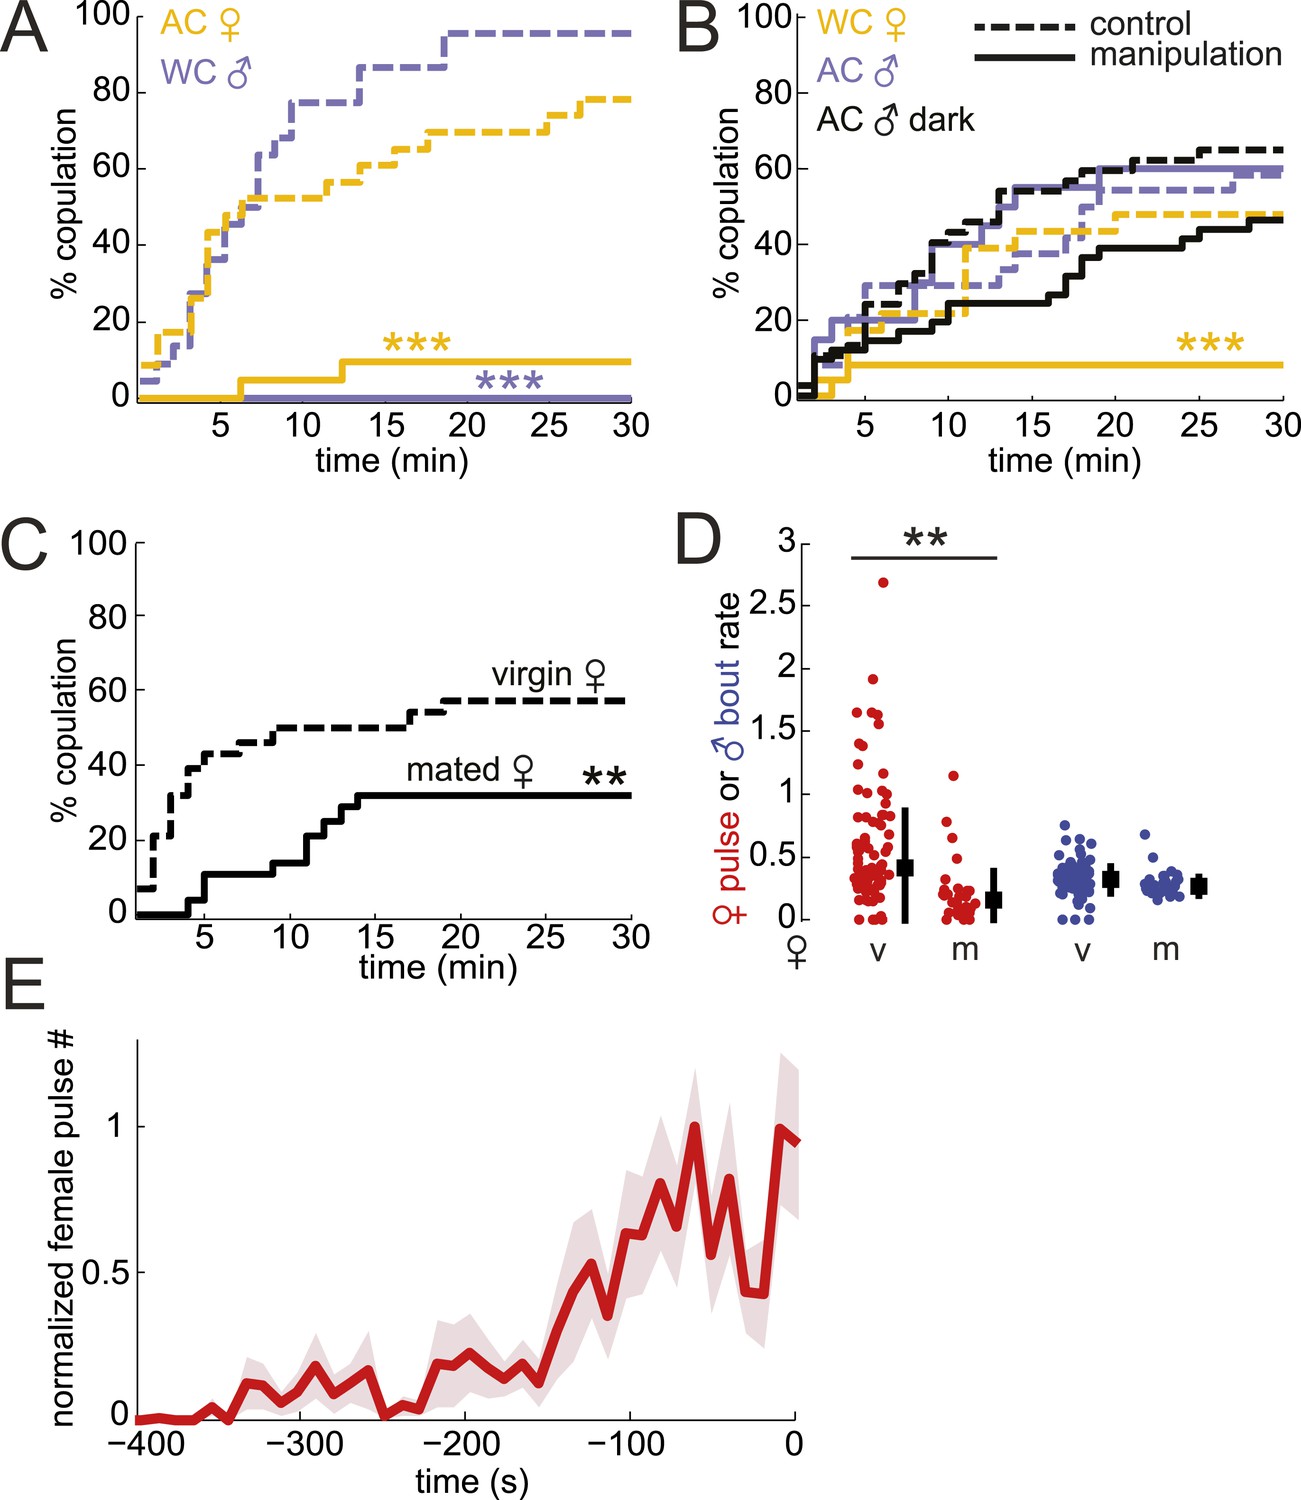
(A and B) Percent copulation over the 30-min observation period for manipulated flies (WC, wing-cut [mute]; AC, dark, lights off [no visual cues]). Each manipulated fly was paired with a WT fly of the opposite sex (solid lines). Latency to mating was compared to WT controls prepared under similar conditions (dashed lines). The numbers of individuals in each experiment were: WC male n = 20, WC male control n = 22, AC female n = 21, AC female control n = 23, WC female n = 24, WC female control n = 23, AC male n = 20, AC male control n = 24, AC male dark n = 41, AC male control dark n = 37 (Mantel–Cox test, ***p < 0.001). Experimental manipulations did not affect courtship rates (Figure 3—figure supplement 1). (C) Percent copulation over the 30-min observation period for mated females paired with virgin males (solid black, n = 28) vs virgin females paired with virgin males (dashed black, n = 28, Mantel–Cox test, **p < 0.01). (D) Median female pulse (red) or male bout (blue) rate (see ‘Materials and methods’) dependent on whether the female is virgin (v, n = 83) or mated (m, n = 26), independent of copulation success (Figure 3—figure supplement 2). Black squares are the population median and black bars the interquartile range (IQR) (generalized linear model [GLM] t statistic **p < 0.01). (E) Mean female pulse number (normalized) in 10-s bins prior to the moment of copulation (n = 8 courtships). Shading represents s.e.m.
Figure 3—figure supplement 1
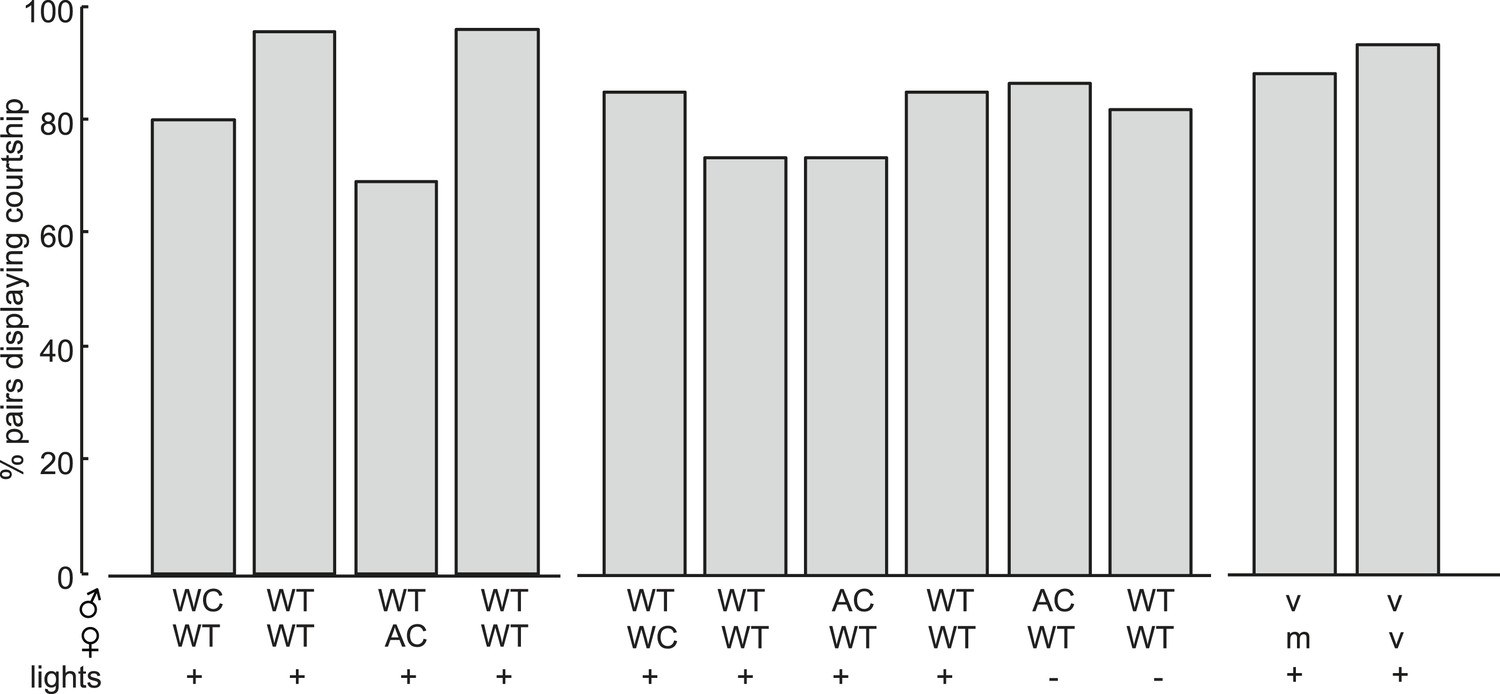
Courtship activity of manipulated flies in latency to mating assays.
Percent of pairs performing courtship behaviors in latency to mating assays in Figure 3: WT—wild type, AC—arista-cut, WC—wing-cut, v—virgin, m—mated, (+)—lights on, (−)—lights off.
Figure 3—figure supplement 2
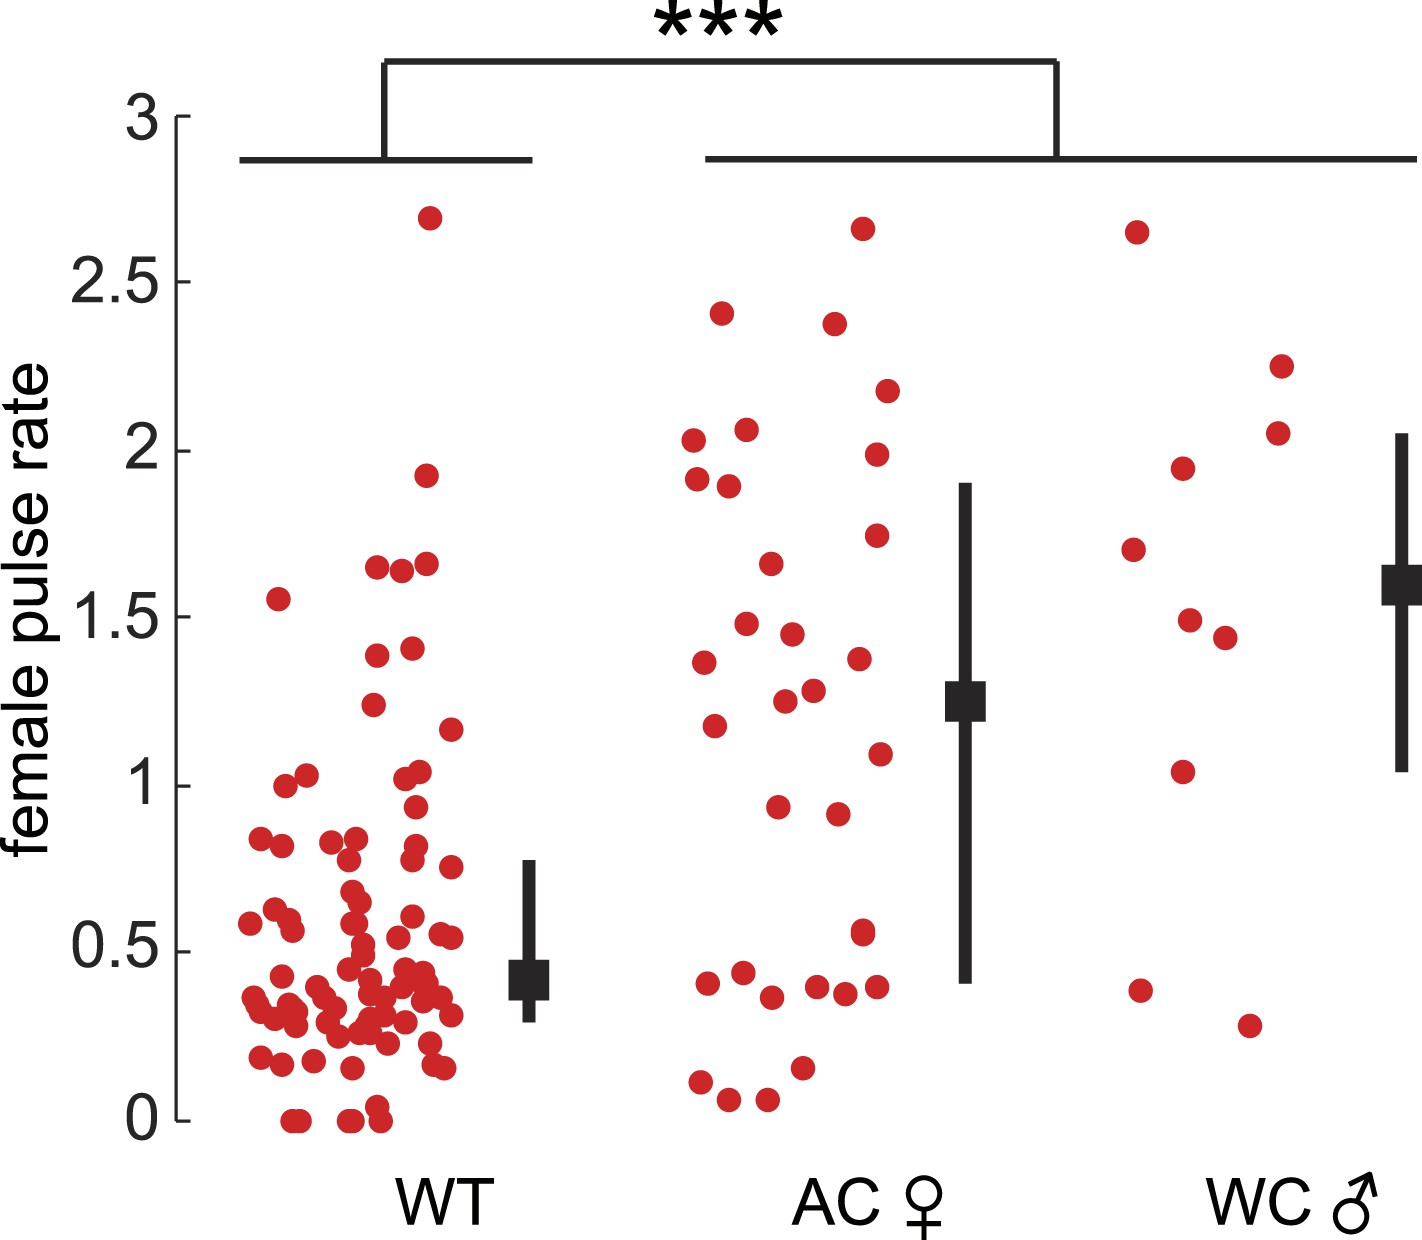
Female pulse rates in the absence of male acoustic cues.
Female pulse rate in the absence of male acoustic cues whether the male is WC (n = 10) or the female is AC (n = 34, ***p < 0.001, Kruskal–Wallis Test). Black squares represent population median and black bars the IQR.
Figure 3—figure supplement 3

Song rates in successful versus unsuccessful courtships.
WT male bout (A) and female pulse (B) rate (see ‘Materials and methods’) dependent on whether the courtship (within 20 minutes) resulted in copulation (cop, n = 33 courtships, filled circle) or was unsuccessful (no cop, n = 44 courtships, open circle, ***p < 0.001 *p < 0.05 Wilcoxon rank-sum test). Black squares represent population median and black bars the IQR.
Figure 4 with 1 supplement
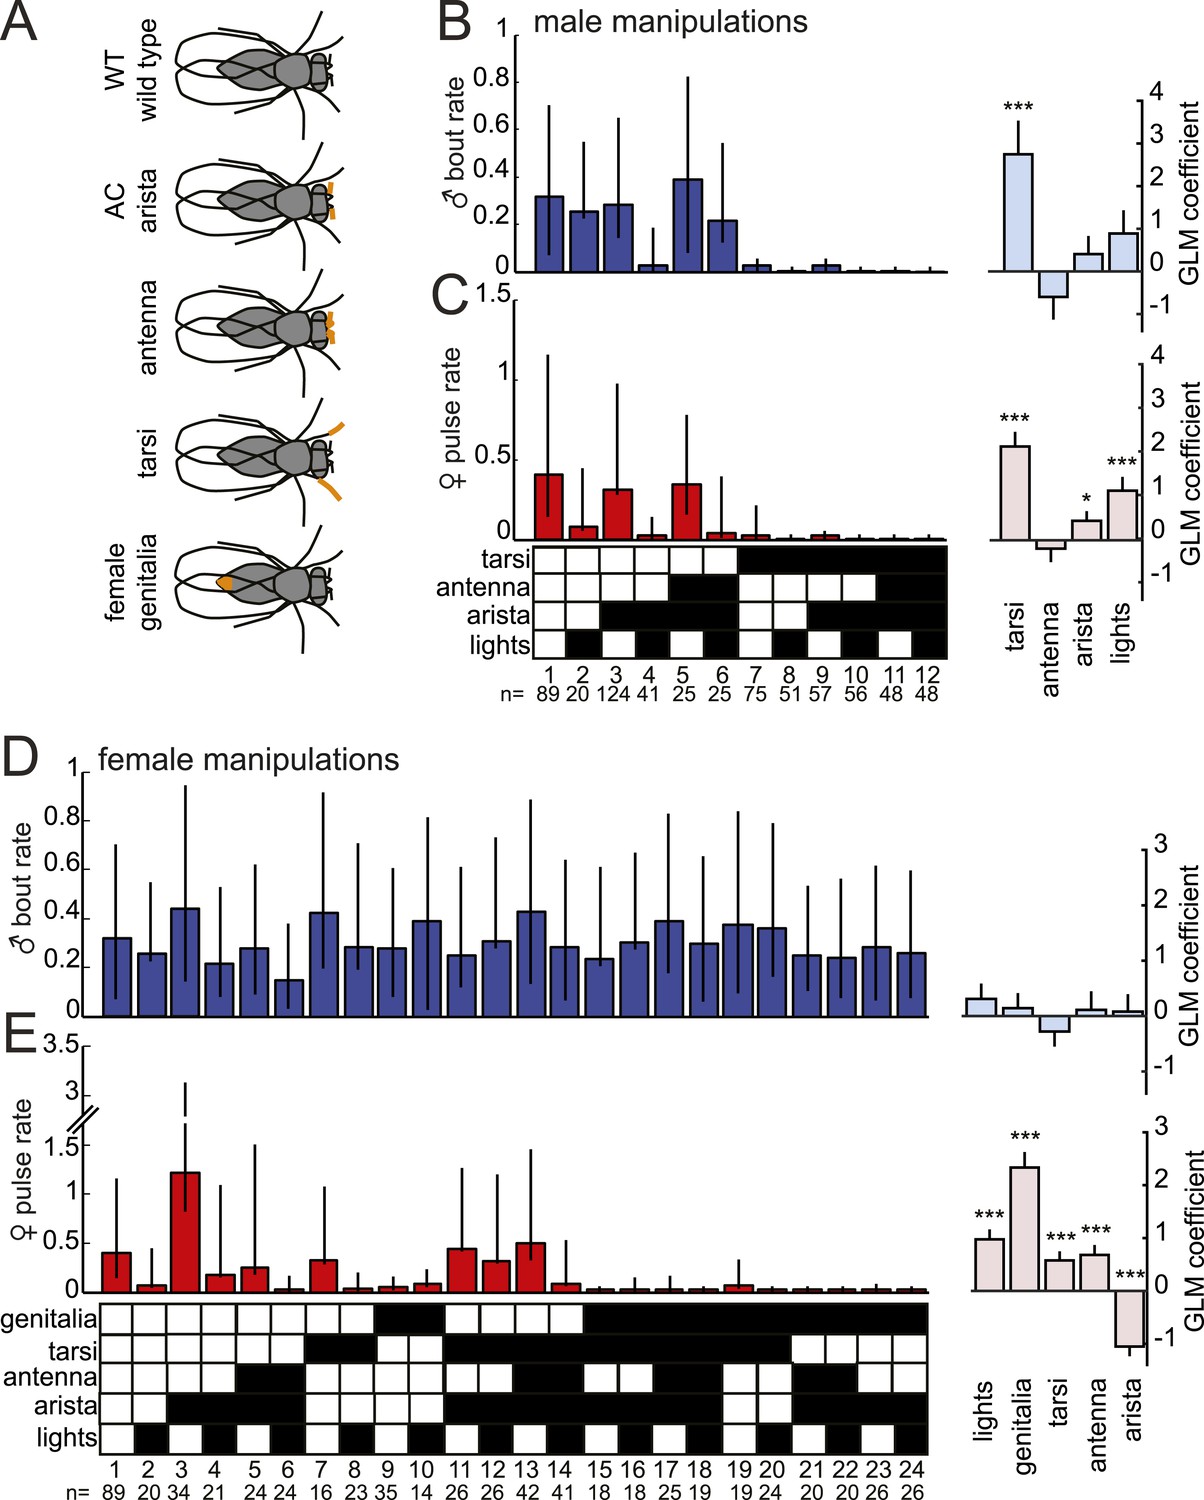
Multiple sensory channels influence song production rates in virilis males and females.
(A) Schematic of sensory organ manipulations. Orange shading indicates the region of organ modification (amputation or blocking). Male bout (blue, B) and female pulse (red, C) rate in pairings between sensory organ manipulated males and WT females. Sensory organ manipulation for each experiment is indicated with a black box. Each colored bar represents the median bout (blue, B) or pulse rate (red, C) and error bars the IQR. The number of pairs examined is listed below the plots. A GLM was used to predict the song rate based on the presence/absence of different sensory channels. GLM coefficients indicate the relative importance of each sensory channel in determining male song production (light blue) and female song production (pink); error bars represent bootstrap estimate of the s.e.m. (***p < 0.001, *p < 0.05). Similarly, male bout (blue, D) and female pulse (red, E) rate, along with GLM coefficients (light blue and light pink, respectively), for pairings between WT males and sensory organ manipulated females.
Figure 4—figure supplement 1
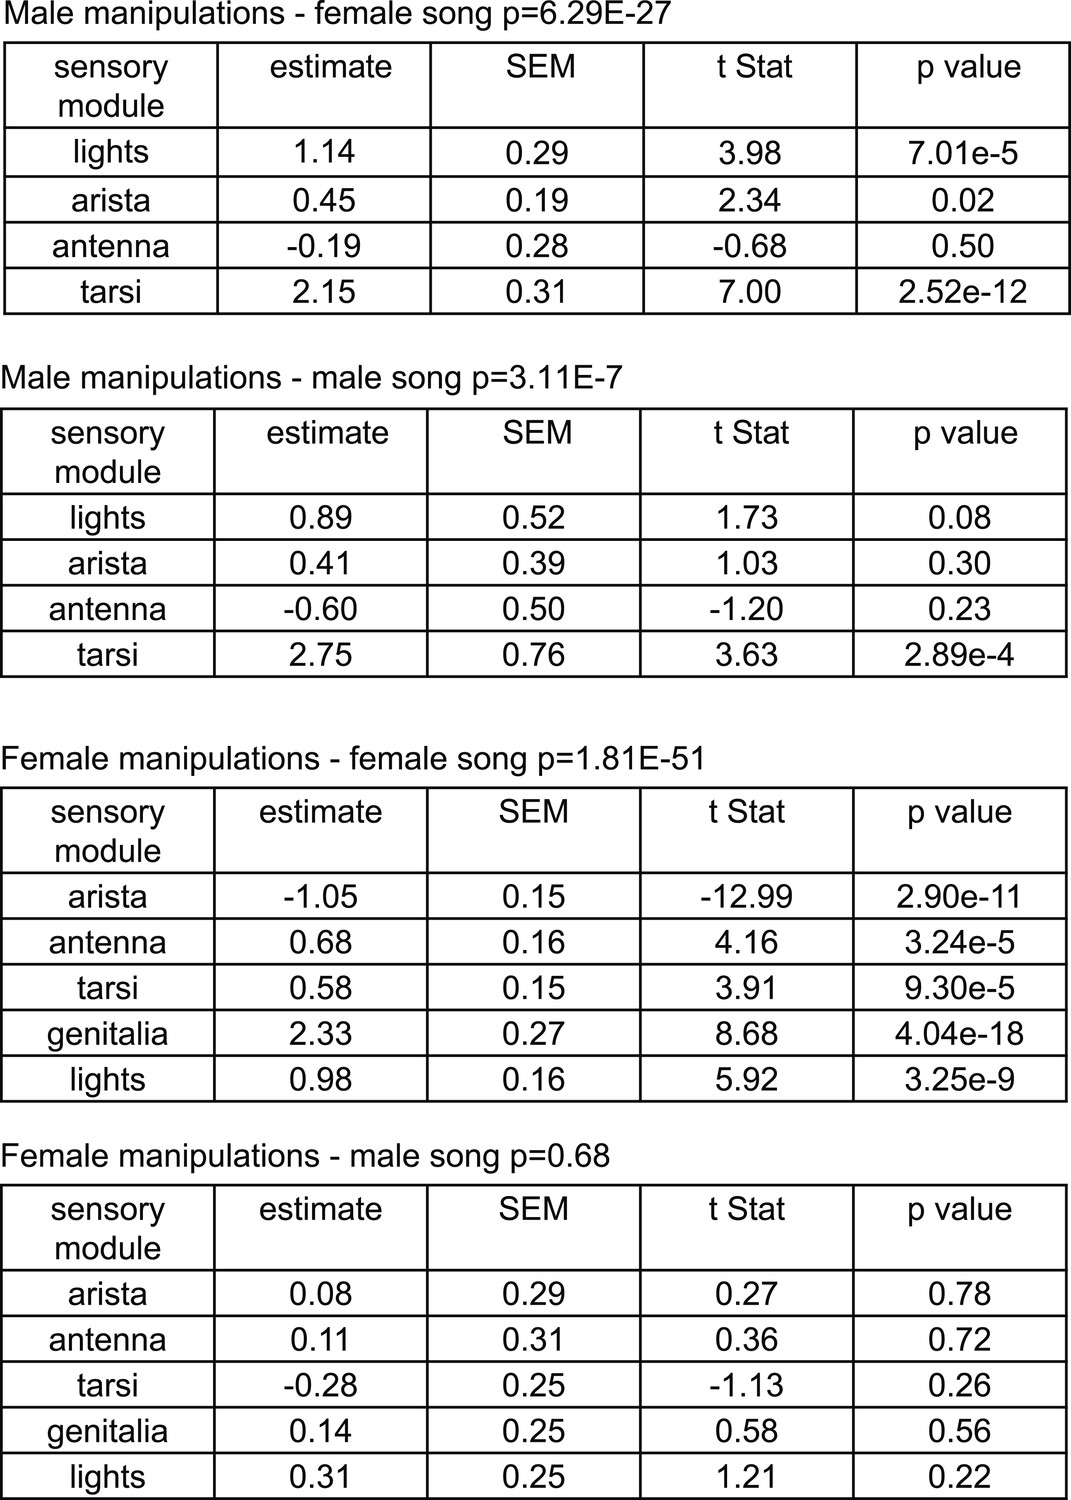
GLM statistics for sensory organ manipulations.
GLM statistics for male manipulations and predictions of female and male song rate and for female manipulations and predictions of female and male song rate.
Figure 5
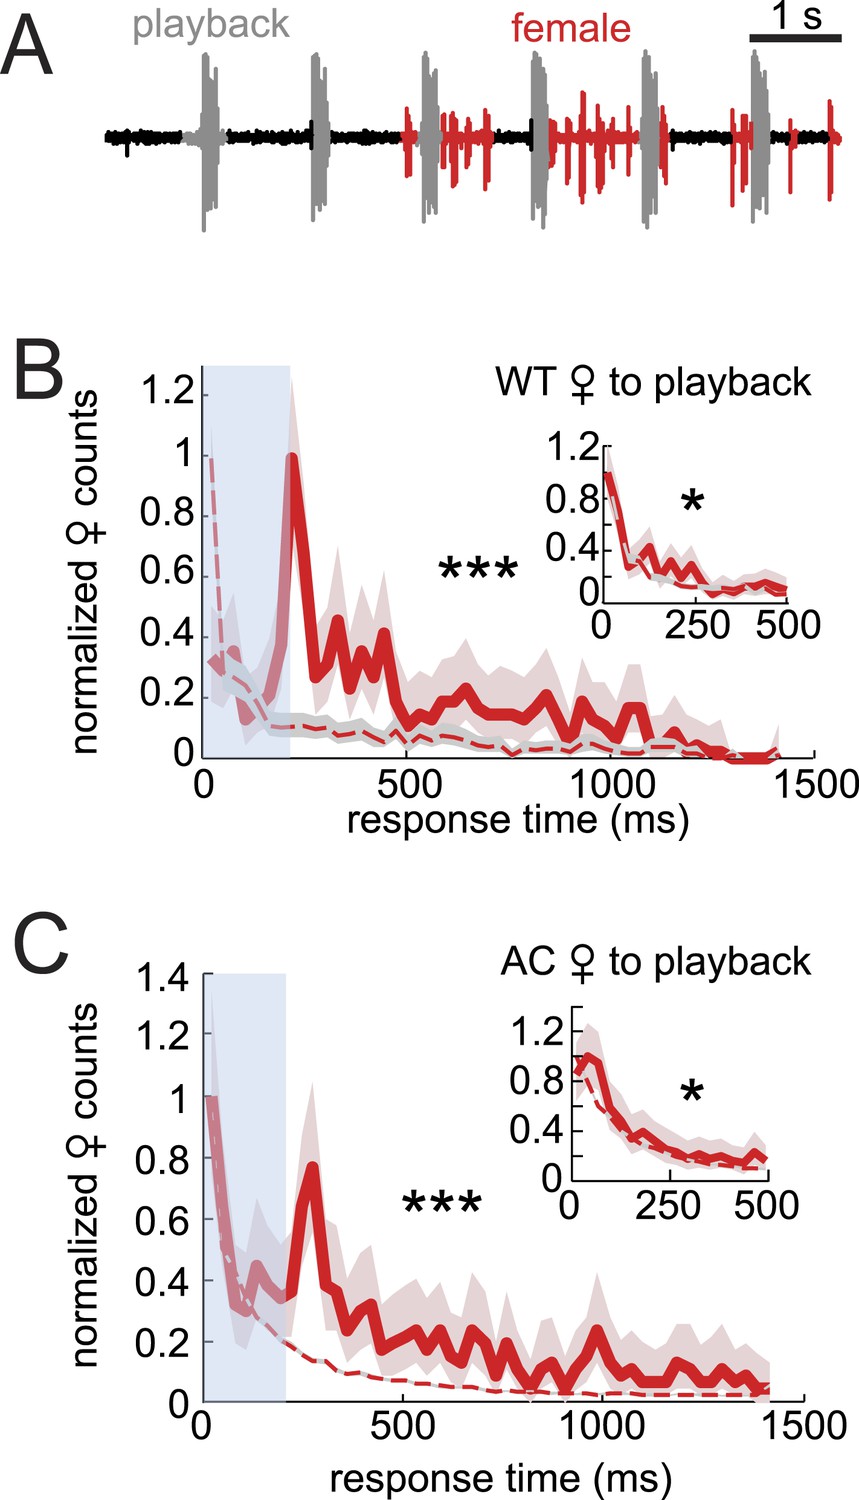
Testing the sufficiency of auditory cues for female song production and timing.
(A) Female pulses (red) produced in response to playback of male song (gray) and in the presence of a WC male. Normalized WT (B, red, n = 451, n = 13 courtships) and AC (C, red, n = 522, n = 16 courtships) female response time distributions to playback compared with response time distributions from shuffled data (red dashed). Inset: the same data, but female response times are calculated from the end of the male bout, therefore, ignoring overlaps (K-S test ***p < 0.001, *p < 0.05).
Figure 6
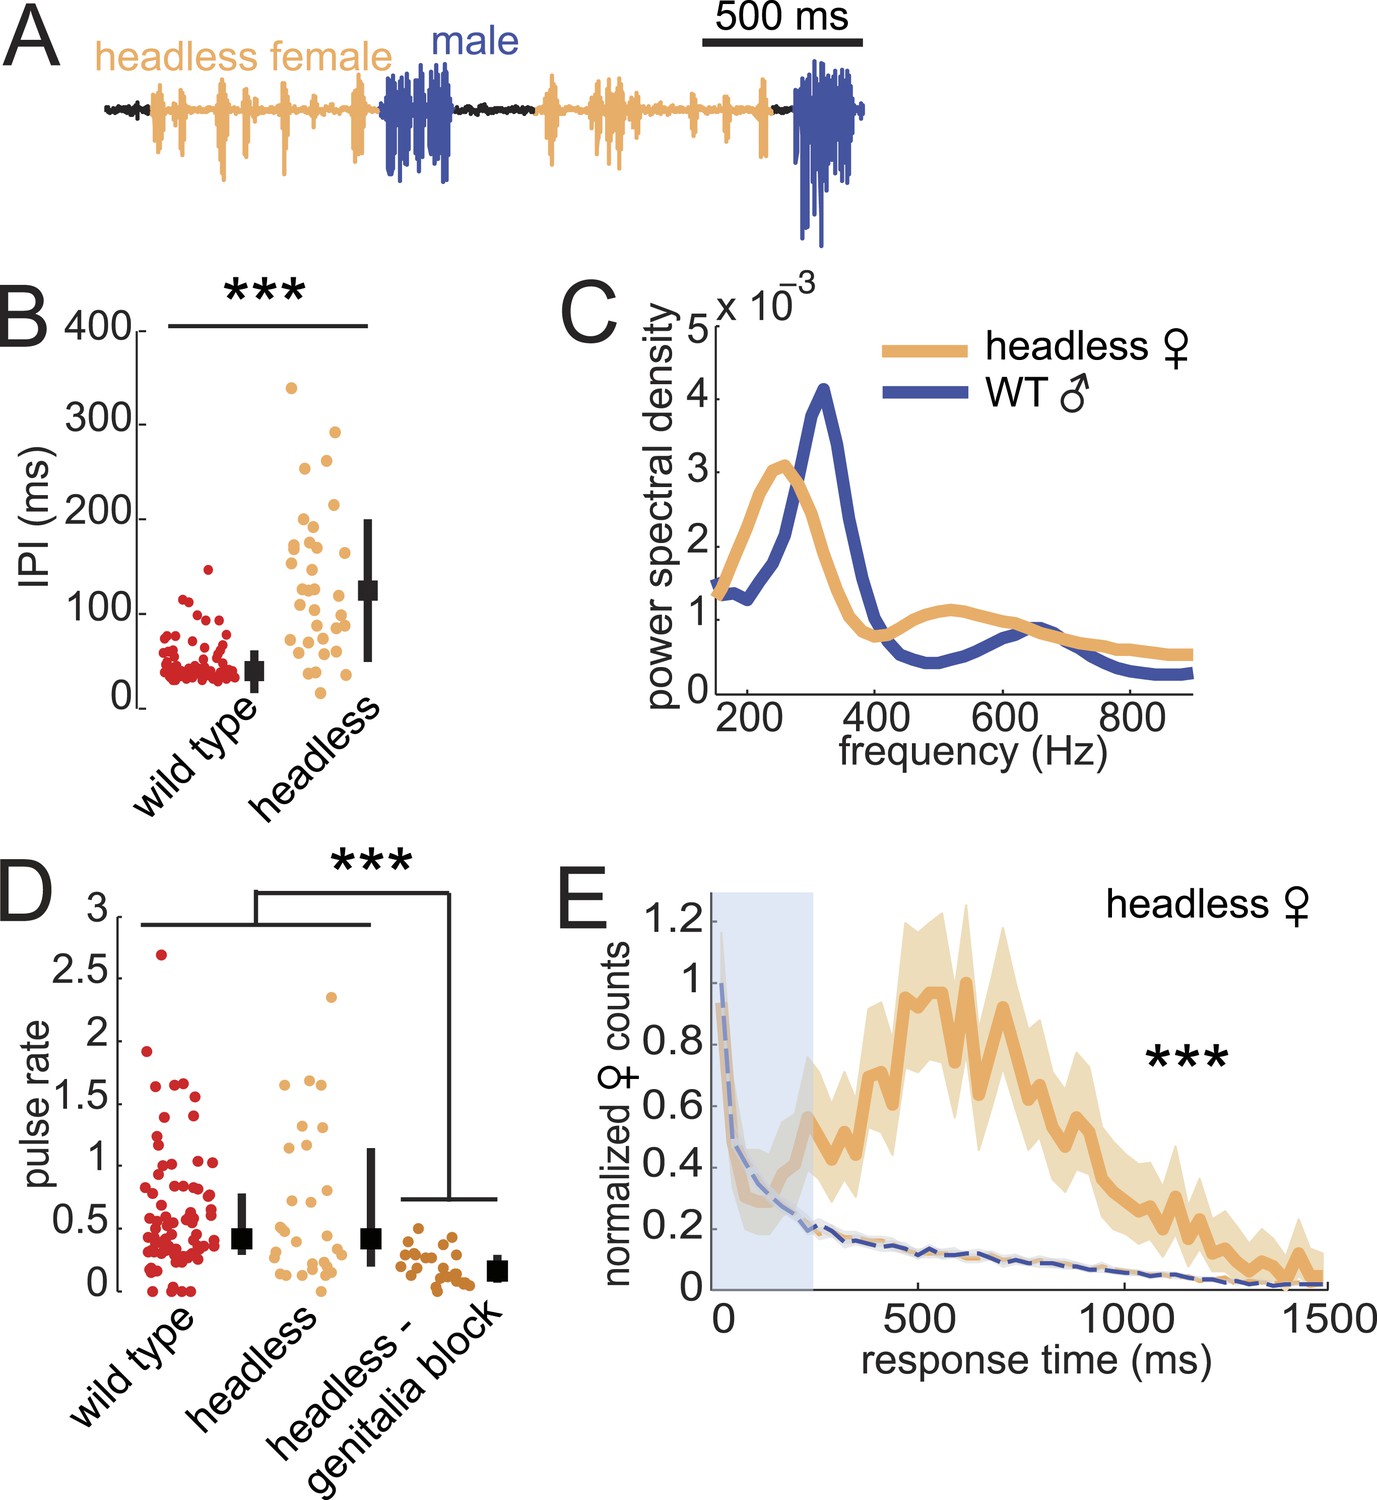
Testing the sufficiency of abdominal sensory inputs for female song production and timing.
(A) Headless female song (orange) and WT male song (blue). (B) Median IPI of headless female song (orange, n = 33) compared with IPI from WT females (red, n = 83). Black squares indicate population mean and black bars s.d. (Student's t-test, ***p < 0.001). (C) Power spectral density of pulses from headless females (orange, n = 21,481 pulses) or their WT male courtship partner (blue, n = 11,136 pulses). (D) Median pulse rate for headless females (orange, n = 33) and headless and genitalia blocked females (dark orange, n = 31), compared to WT females (red, n = 83). Black squares indicate population median and black bars IQR (Kruskall–Wallis test, ***p < 0.001). (E) Normalized female response time distribution for headless females (orange, n = 1430, n = 33 courtships), compared with distributions from shuffled male bout (blue dashed) and female pulse (orange dashed) intervals (***p < 0.001 K-S test). Shading around each response time distribution represents bootstrapped 95% confidence intervals.
Figure 7 with 1 supplement
Male contact with the female abdomen and genitalia predicts song timing.
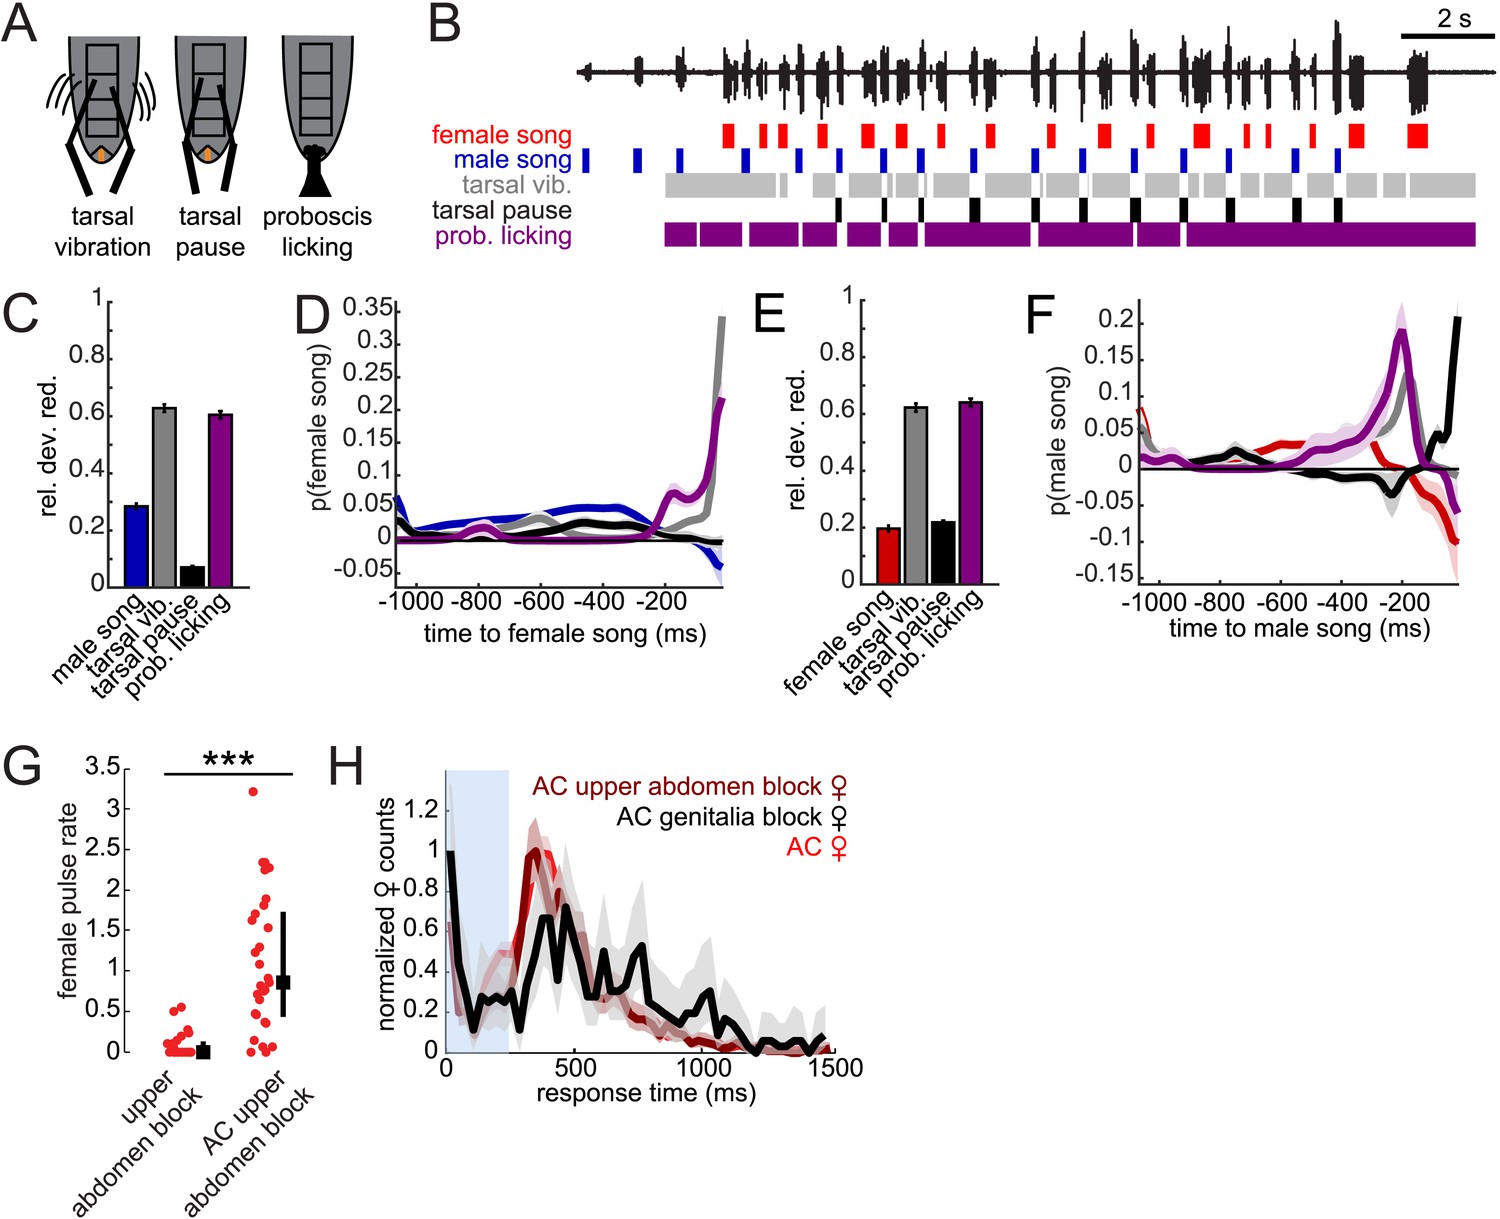
(A) Schematic of annotated male contact behaviors (see also Video 3). (B) Example of a duet between a WT male (blue) and female (red), accompanied by annotation of male tarsal contact with the abdomen (tarsal vibration (gray) and tarsal pause (black); tarsal pause denotes male tarsal contact with the female abdomen, but without vibration) and proboscis licking of the genitalia (purple). GLM analysis was used to predict the presence/absence of male or female song based on the time course of annotated behaviors during courtship interactions. Model performance (indicated by relative deviance reduction) reveals the behaviors most predictive of female song (C) and male song (E) (see ‘Materials and methods’). GLM filters reveal the times at which each behavior is most predictive of female song (D) or male song (F, n = 7 courtships with approximately 200 instances of both male and female song). Error bars and shading represent bootstrapped s.e.m. estimates. (G) Females with their upper abdomens (tergites A3–A5) blocked produce very little song (n = 23 courtships), compared with females whose aristae were additionally cut (n = 29 courtships, ***p < 0.001 Wilcoxon rank-sum test). Black squares represent median and black bars the IQR. (H) Normalized female response time distributions for AC females (red, reproduced from Figure 1H), AC-upper abdomen blocked females (dark red, n = 1892, n = 29 courtships, Kullback–Leibler (K-L) Divergence = 0.12 between AC and AC-upper abdomen block curves) and AC-genitalia blocked females (black, n = 483, n = 18 courtships, K-L Divergence = 0.36 between AC and AC genitalia block curves); all females were paired with WT males. Shading around each response time distribution represents bootstrapped 95% confidence intervals.
Figure 7—figure supplement 1
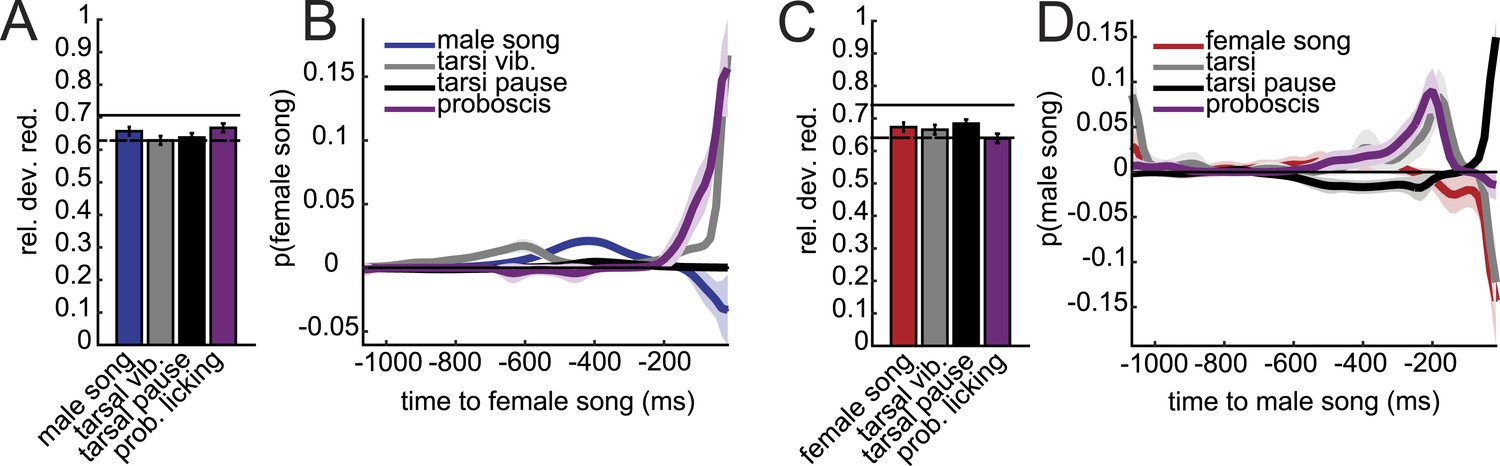
Two-variable GLM for male–female pairings.
Relative deviance reduction and linear filter values for prediction of female song (A and B) or male song (C and D). Error bars and shaded regions around linear filters represent bootstrapped s.e.m. estimates. Relative deviance reduction of best single variable model is indicated by dashed horizontal line (associated with Figure 7C, E, respectively).
Figure 8
When courted by another male, males can produce female-like duets.
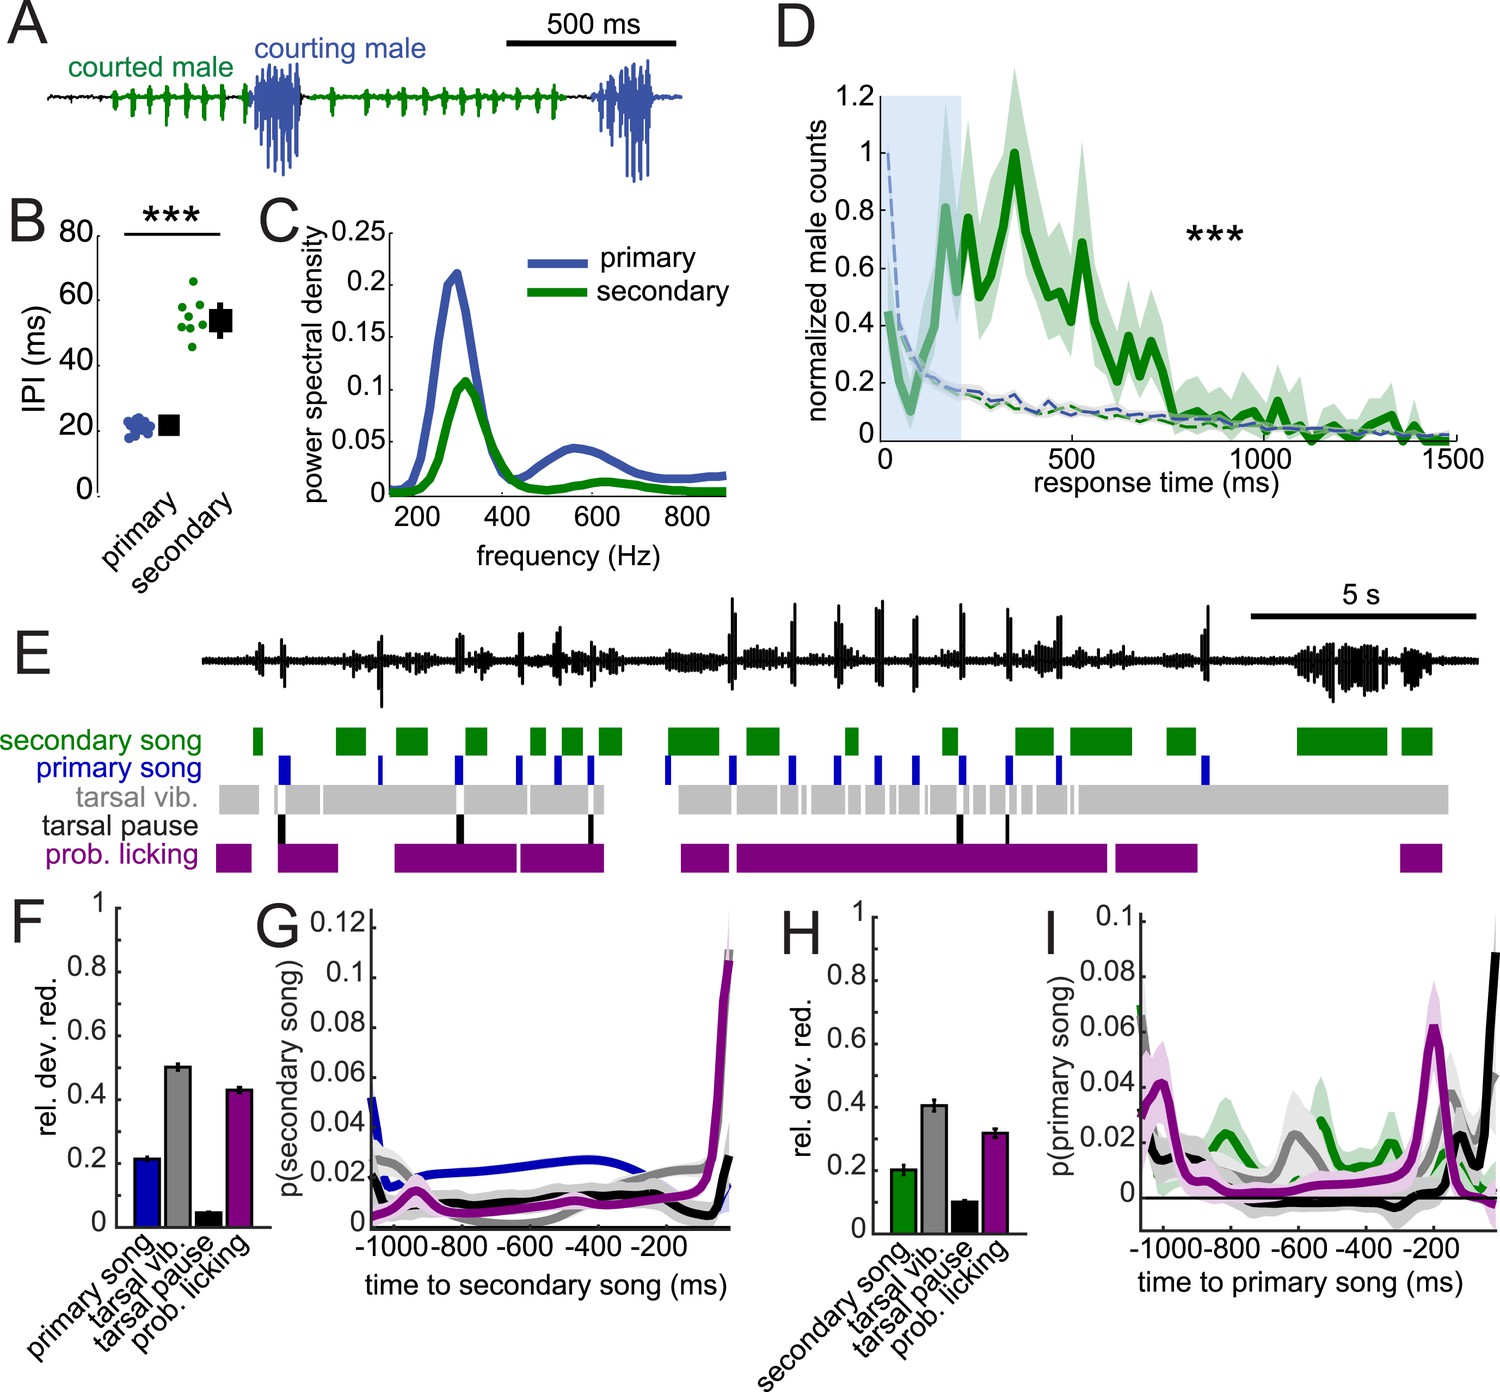
(A) Song produced in pairings between two WT males. Combining video and acoustic recording (Video 4) reveals that male primary song is produced by the courting male (blue), and male secondary song is produced by the courted male (green). (B) IPI of male secondary song (green, n = 8) compared with the IPI of male primary song (blue, n = 13, Wilcoxon rank-sum Test, ***p < 0.001). (C) Power spectral density of pulses from male secondary song (n = 6349, green) and male primary song (n = 1309 bouts, dark blue). (D) Normalized distribution of courted male response times to male primary song (green, n = 766, n = 53 courtships) compared to response times from shuffled data (K-S Test, ***p < 0.001). (E) Example of a male–male duet, accompanied with video annotation of tarsal and proboscis movements of the courting male. GLMs were used to predict the presence/absence of male secondary song and male primary song from the temporal pattern of annotated behaviors preceding each time point during courtship interactions. GLM performance indicates the male behaviors most predictive about male secondary song (F) and male primary song (H). GLM filters reveal the times at which each behavior is most predictive of male secondary song (G) or male primary song (I). (n = 7 courtships with 107 and 127 instances of male secondary and primary song, respectively). Error bars and shading in F-I represent bootstrap estimates of the s.e.m.
Videos
Video 1
D. virilis duetting behavior.
Representative example of courtship between a naive D. virilis male and female pair. Shown in the video is one channel/chamber of a multi-channel song recording system. Video is acquired at 15 Hz.
Video 2
D. virilis headless female duetting behavior.
Representative example of a naive male paired with a naive decapitated female in one channel/chamber of the multi-channel song recording system. Video is acquired at 15 Hz.
Video 3
High-speed video of D. virilis duetting behavior.
Representative example of courtship between a naive D. virilis male and female pair in a 1 × 1 × 0.5 cm clear plastic chamber, with microphone placed adjacent to the chamber. Video is acquired at 60 Hz.
Video 4
High-speed video of male–male behavior.
Representative example of an interaction between two naive D. virilis males in a 1 × 1 × 0.5 cm clear plastic chamber, with microphone placed adjacent to the chamber. Video is acquired at 60 Hz.
Video 5
High-speed video of male–male behavior.
Another example of an interaction between two naive D. virilis males, showing role-switching behavior between courting and being courted.
Download links
A two-part list of links to download the article, or parts of the article, in various formats.
Downloads (link to download the article as PDF)
Open citations (links to open the citations from this article in various online reference manager services)
Cite this article (links to download the citations from this article in formats compatible with various reference manager tools)
Acoustic duetting in Drosophila virilis relies on the integration of auditory and tactile signals
eLife 4:e07277.
https://doi.org/10.7554/eLife.07277


