Thermal fluctuations of immature SOD1 lead to separate folding and misfolding pathways
- University of Toronto, Canada
- University of Waterloo, Canada
- Université Grenoble Alpes, France
- Centre National de la Recherche Scientifique, France
- Commissariat à l'énergie atomique, France
- Hospital for Sick Children, Canada
Figures
Figure 1
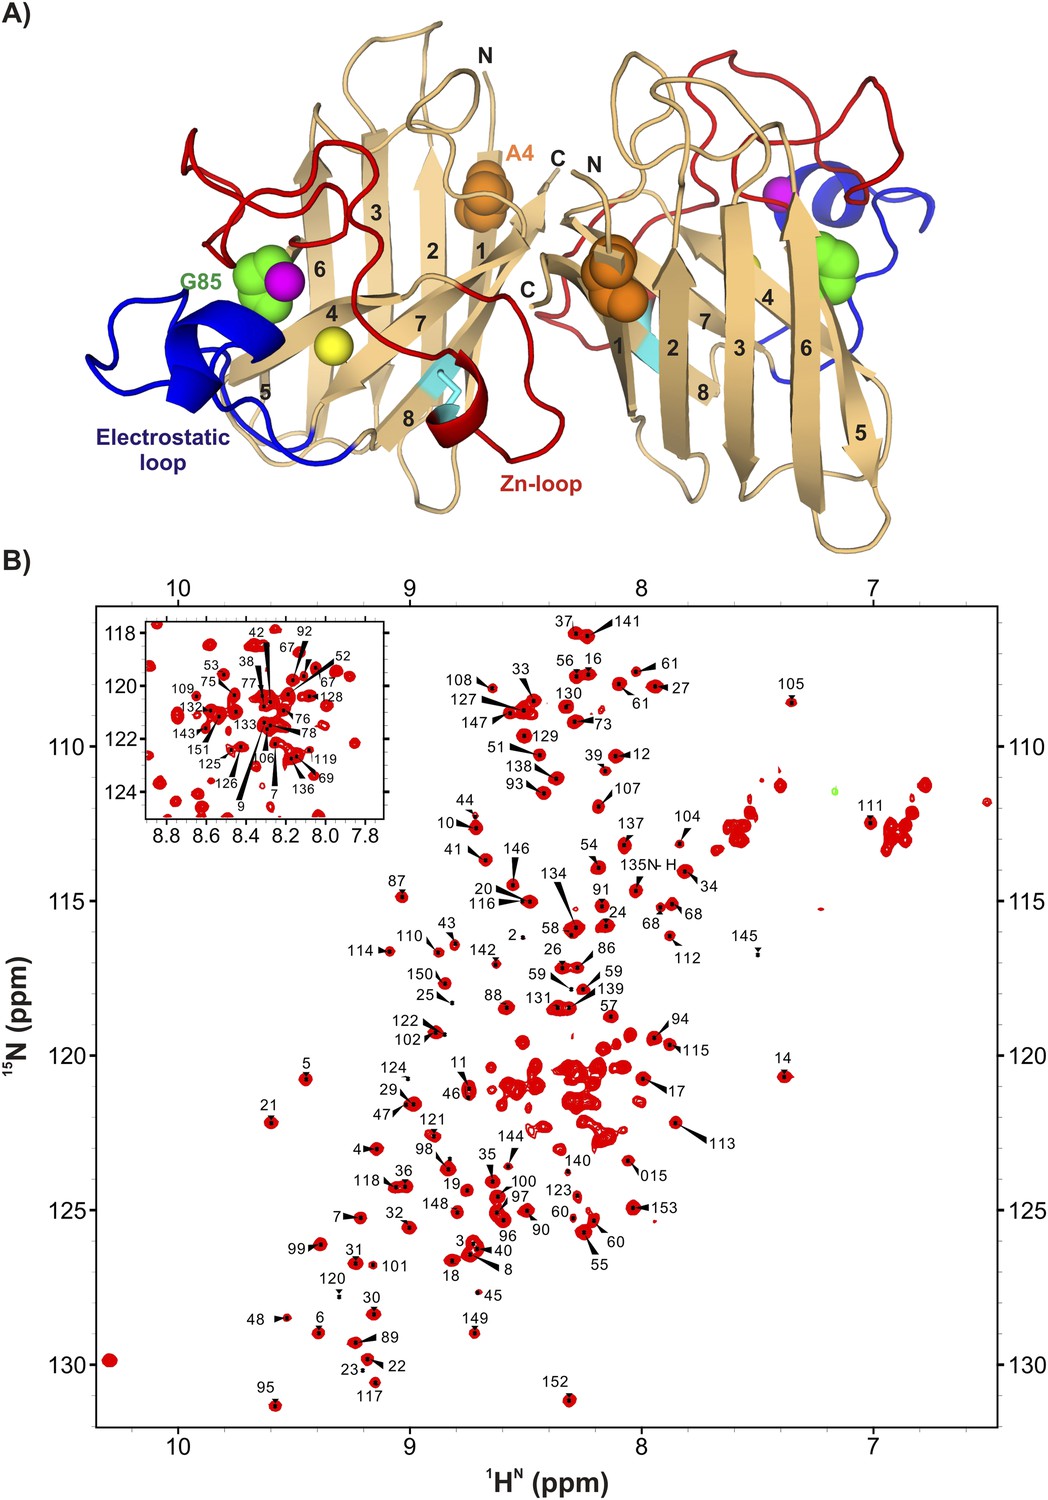
ApoSOD12SH is folded in solution.
(A) Structure of the mature homodimeric form of SOD1 (Cu2Zn2SOD1S–S) (pdb code: 1hl5) (Strange et al., 2003). Each monomer comprises an 8-stranded β-barrel with two long loops, the Zn-loop (red) and the electrostatic loop (blue), an intra-subunit disulfide bond (cyan), and one bound Cu (yellow) and Zn (magenta) ion. Each of the two long loops contains a short helix. Highlighted are positions 85 (green) and 4 (orange) that are sites of mutations discussed in the text. (B) 1H-15N HSQC correlation map of pWT apoSOD12SH, 25°C (600 MHz 1H frequency). Chemical shift assignments of backbone amides are indicated on the plot.
Figure 2

Structural features of the ground state of immature apoSOD12SH.
(A) Chemical shift-derived order parameters squared (Berjanskii and Wishart, 2005), S2, for the mature Cu2Zn2SOD1S–S (red; based on published chemical shifts [Banci et al., 2002a]) and the immature apoSOD12SH (green) forms. Secondary structural elements of Cu2Zn2SOD1S–S are depicted above the plot, with the electrostatic loop shown in blue and the Zn-loop in red. (B) Correlation between inter-strand NOE pairs observed experimentally for apoSOD12SH (red) and predicted based on the crystal structure of Cu2Zn2SOD1S–S (Strange et al., 2003) (blue). The secondary structure of Cu2Zn2SOD1S–S is indicated on the sides of the plot. (C) Temperature coefficients of amide protons of apoSOD12SH known to be involved in inter-strand hydrogen bonds in the crystal structure of Cu2Zn2SOD1S–S (Strange et al., 2003). A cutoff of −4.6 ppb/K, often used to distinguish between protected and unprotected amides, is shown in red (Cierpicki and Otlewski, 2001). (D) Correlation between 15N R1ρ values of apoSOD12SH at 3.5 mM (x-axis) and 2.0 mM (red) or 0.8 mM (green) (y-axis). Only 15N nuclei in ordered regions of apoSOD12SH with Rex values smaller than 2 s−1 in CPMG measurements (600 MHz, 3.5 mM protein concentration) were chosen for this analysis. Solid lines represent best fits of the data to an equation of the form y = mx + c and the slope in each case is indicated on the plot. Ratios of translational diffusion coefficients, D, of apoSOD12SH at the indicated concentrations, that report on differences in sample viscosities with protein concentration, are also indicated.
Figure 3 with 3 supplements
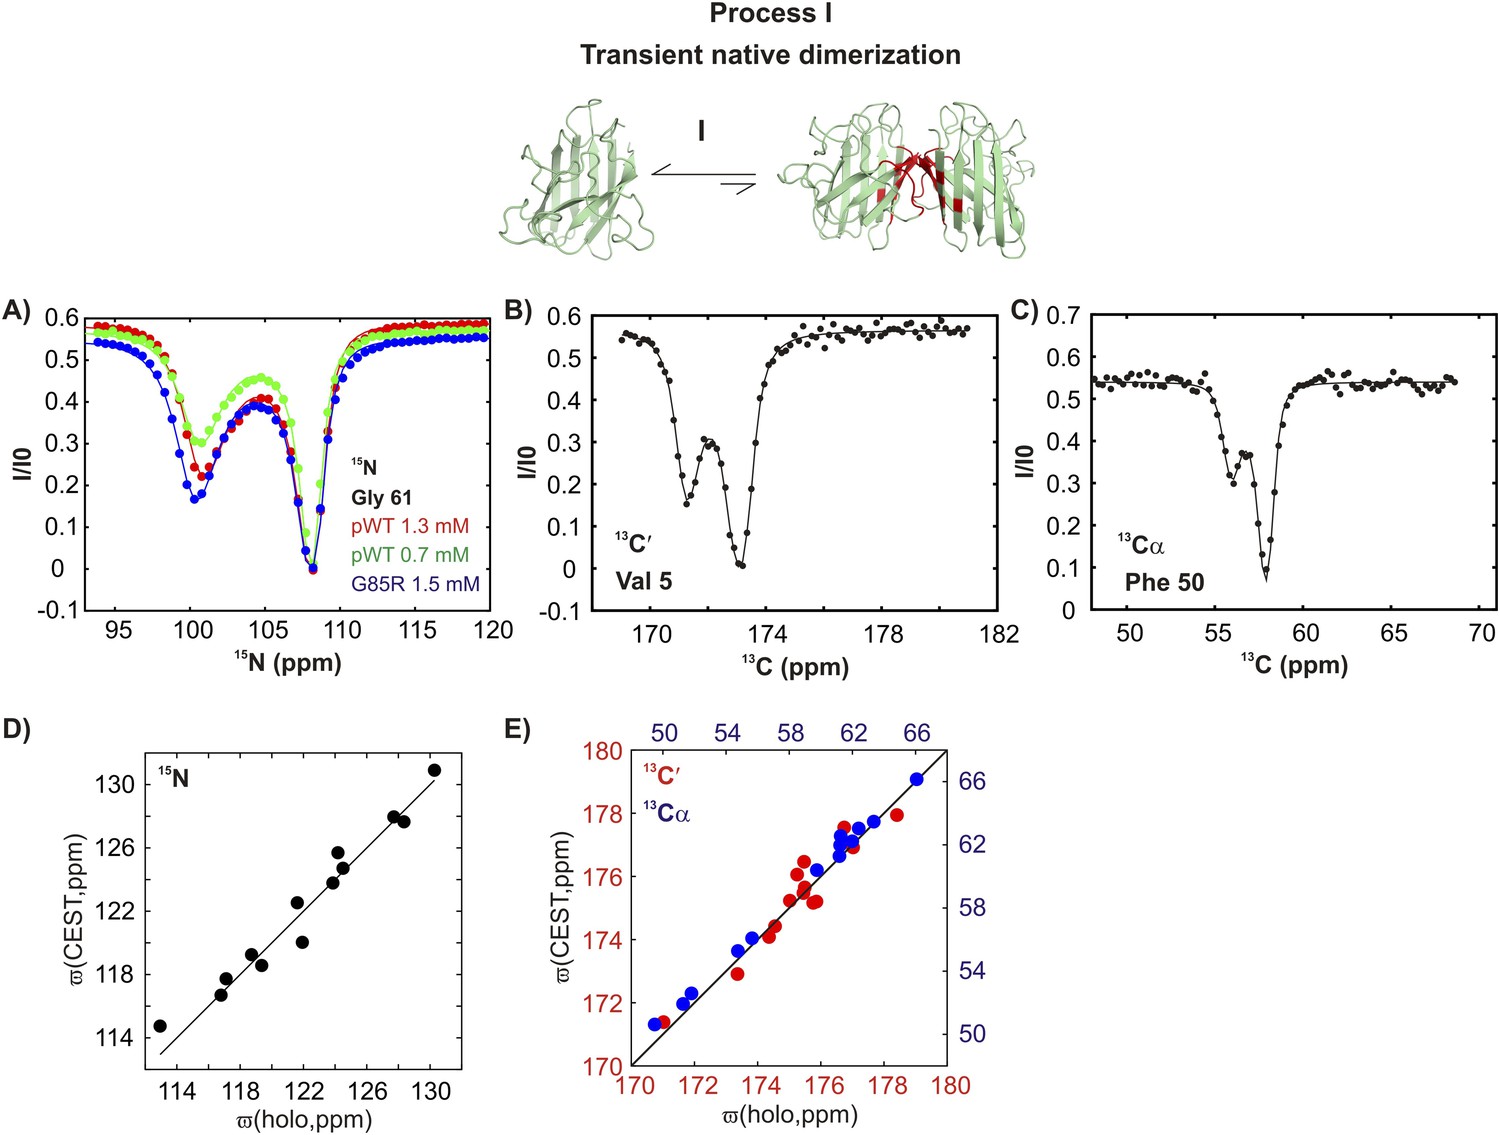
pWT apoSOD12SH transiently samples a native dimer conformation.
(A) 15N-CEST profiles for G61 of pWT apoSOD12SH that reports on the dimerization process, red: 1.3 mM, green: 0.7 mM and G85R apoSOD12SH (blue: 1.5 mM). The G85R mutation does not interfere with transient native dimer formation as indicated by the large minor state dip. Profiles plot the intensity of the ground state peak (I) as a function of the position of the perturbing B1 field (31 Hz), normalized to the corresponding intensity obtained from a spectrum recorded without the CEST element (I0) (Vallurupalli et al., 2012). 13C′- (B) and 13Cα- (C) CEST profiles for residues V5 and F50, respectively. Correlations of 15N (D), 13C′ (E, red) and 13Cα (E, blue) CEST-derived excited state chemical shifts, (ϖ, ppm, y-axis) of apoSOD12SH with the ground state shifts (Banci et al., 2002a) of Cu2Zn2SOD1S–S (x-axis) for residues localized to regions involved in transient dimerization.
Figure 3—figure supplement 1
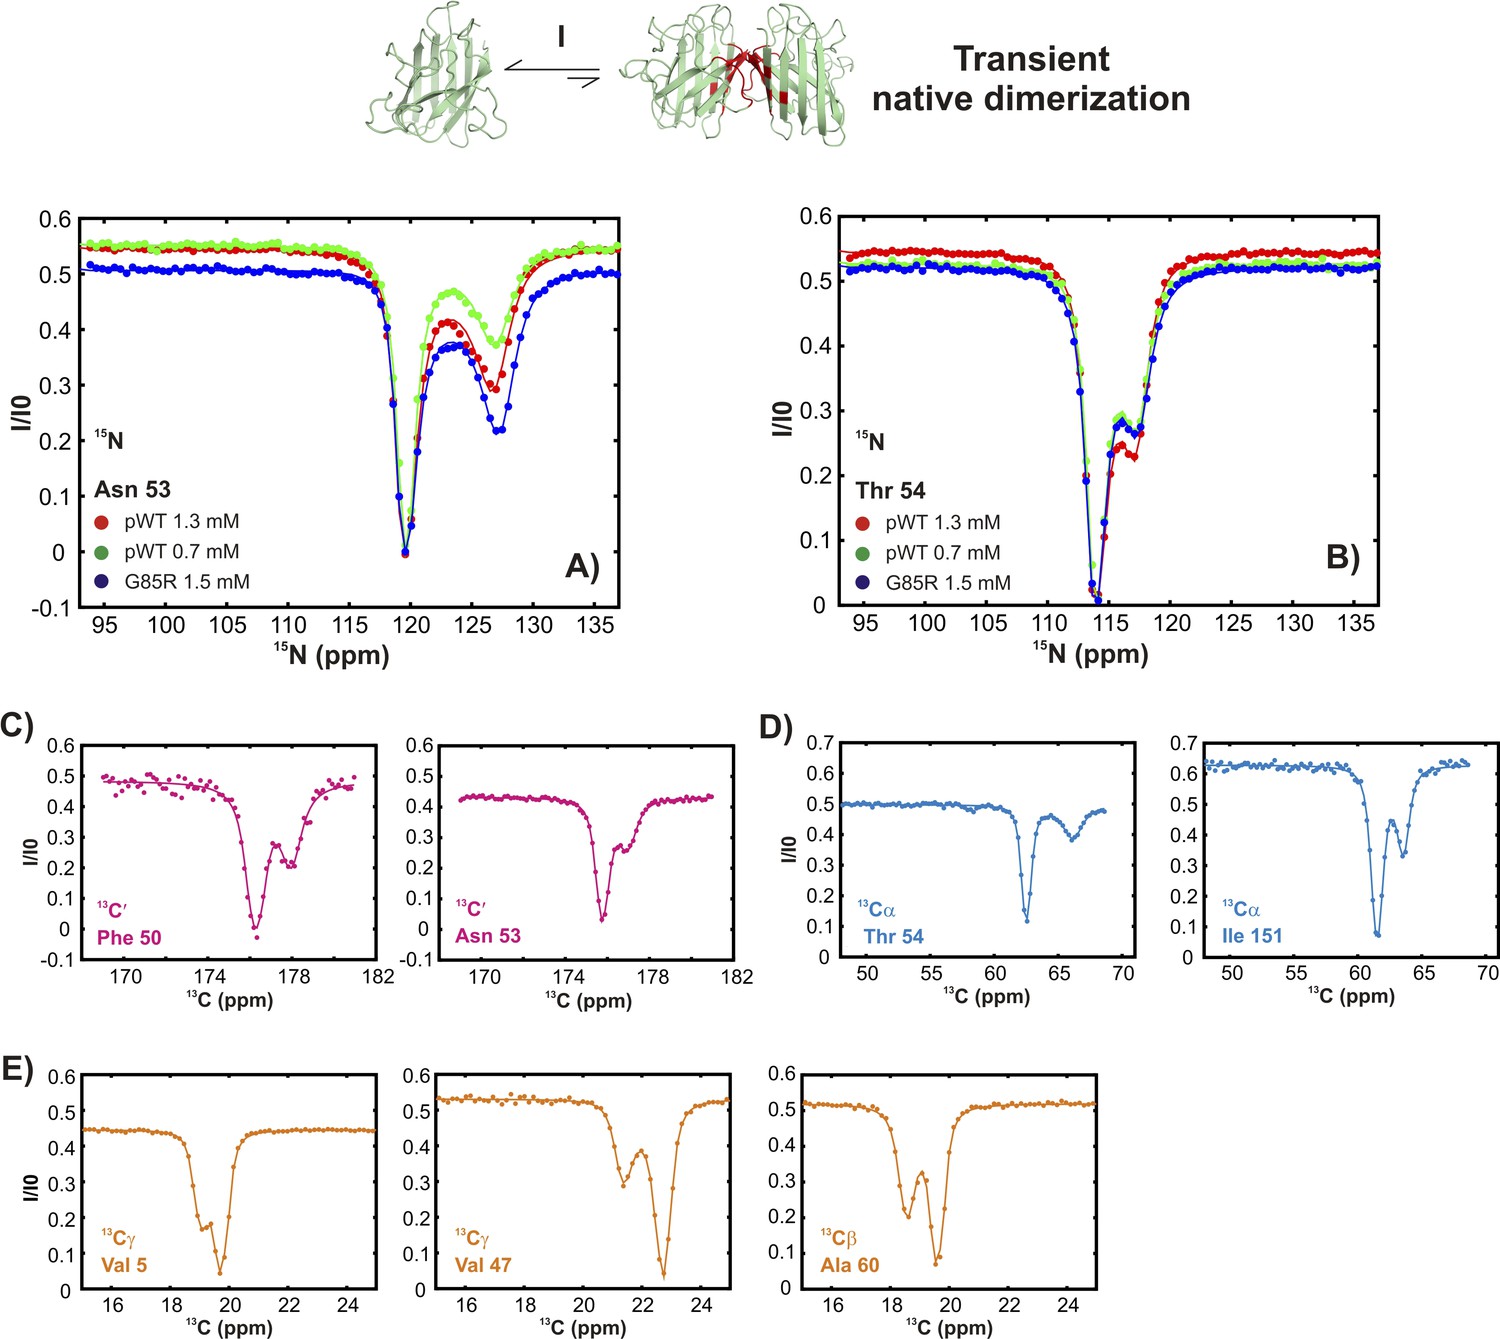
Conformationally excited states of apoSOD12SH containing ‘native’ features as studied by 15N (Vallurupalli et al., 2012), 13C′ (Vallurupalli and Kay, 2013), 13Cα (Long et al., 2014), and 13CH3 (Bouvignies et al., 2014) CEST—process I.
(A, B) 15N CEST profiles of residues reporting on transient native-like dimerization at two different concentrations of pWT apoSOD12SH (red: 1.3 mM, green: 0.7 mM). Also shown are corresponding profiles from G85R apoSOD12SH (blue, 1.5 mM), establishing that the mutation has little effect on process I. 13C′, 13Cα and methyl-13C (13CH3) CEST profiles for pWT residues reporting on transient dimerization (C–E).
Figure 3—figure supplement 2
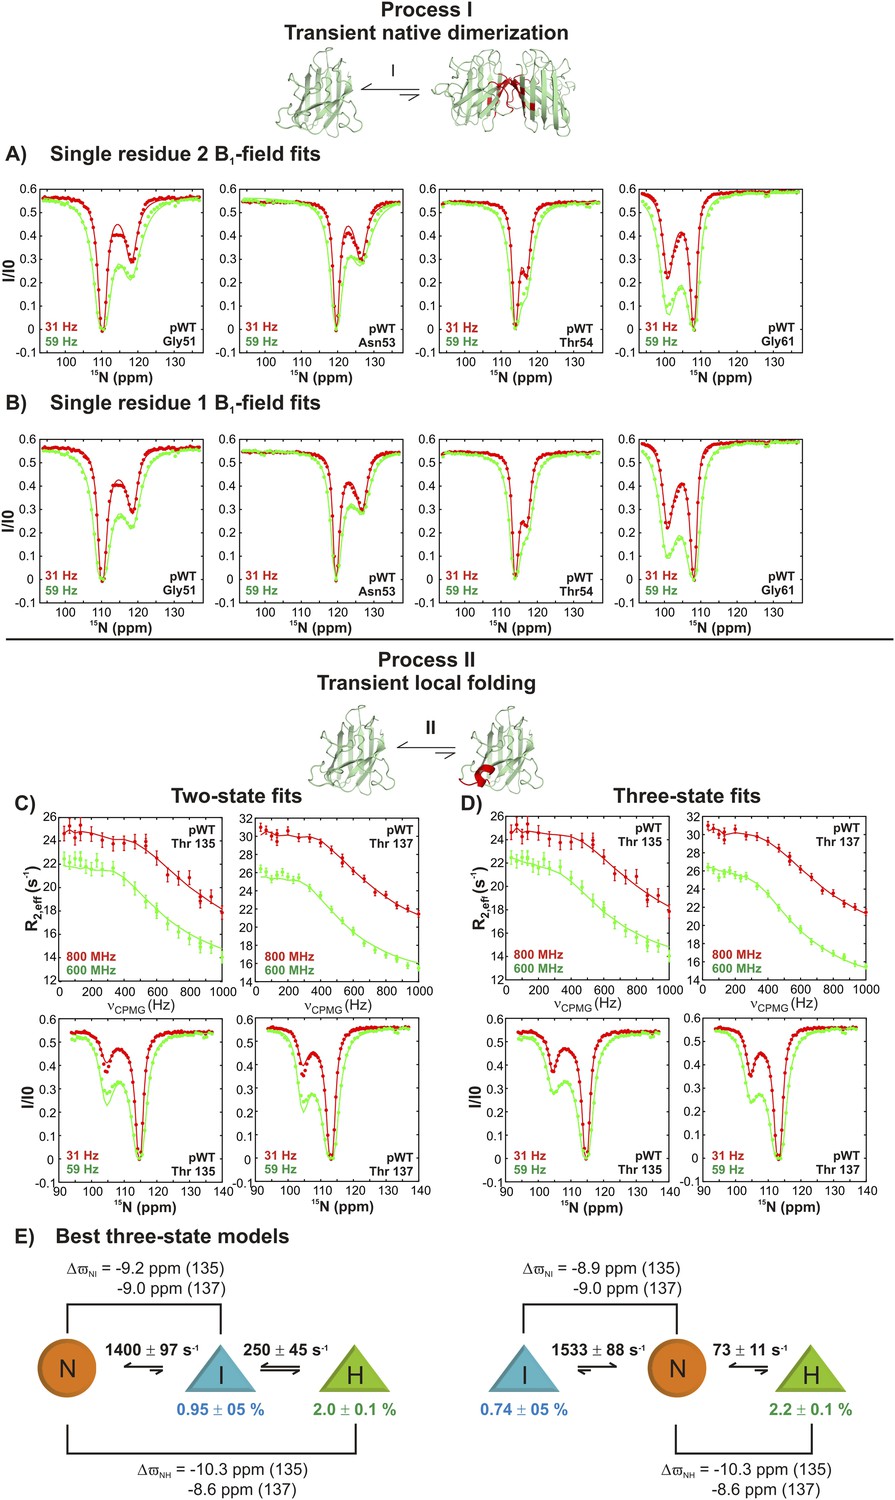
Estimating excited state lifetimes and populations for processes I and II.
(A, B) CEST profiles (circles) of G51, N53, T54, and G61 reporting on the transient native dimerization process (I) measured at 2 B1 fields (31 and 59 Hz). Solid lines are fits of CEST data for each residue independently to a two-state model of exchange, including profiles from both B1 fields (A) or for each B1 field separately (B). A range of excited state populations and lifetimes from 1.5–4.5% and 2.2–4.3 ms is obtained. (C, D) CEST profiles at 2 B1 fields (31 and 59 Hz) and CPMG profiles at two static magnetic fields (corresponding to 1H resonance frequencies of 600 and 800 MHz) for T135 and T137 reporting on the local folding process (II). Solid lines are fits of both CEST and CPMG data to a two-state model (C) or to a three-state model (D) of conformational exchange. (E) Lowest energy ( ∼2) physically meaningful three-state models describing process II, where N is the native state of apoSOD12SH, H is the transiently populated helical state and I is an intermediate not directly visible in CEST measurements, but required for data fitting. Each of the shapes is meant to represent the absence (circle) or presence of the helix (triangle) that is formed via process II, as established on the basis of 15N chemical shifts; note that very large 15N chemical shift changes (∼10 ppm) are observed for helix formation for both T135 and T137 so that these shifts can be used as direct reporters of structure. Exchange parameters for each model are indicated on the plot, where listed exchange rates refer to the sums of forward and backwards processes (for example, 1400 s−1 = kIN + kNI in the model on the left). Lifetimes (τH) of the excited state H, corresponding to the conformer with the native-like electrostatic loop helix, were calculated according to the relations τH = 1/koff,H, where koff,H = kHI = kex,HI × (pI/(pH + pI)) for the on-pathway model (left) and koff,H = kHN = kex,HN × (pN/(pH + pN)) for the off-pathway model (right). Values of τH ranged between 12–14 ms, depending on the model used and are reported in the text (Figure 9) as an average over the two models. Note that the on-pathway and off-pathway model above cannot be distinguished, as both models fit the data equally well.
Figure 3—figure supplement 3
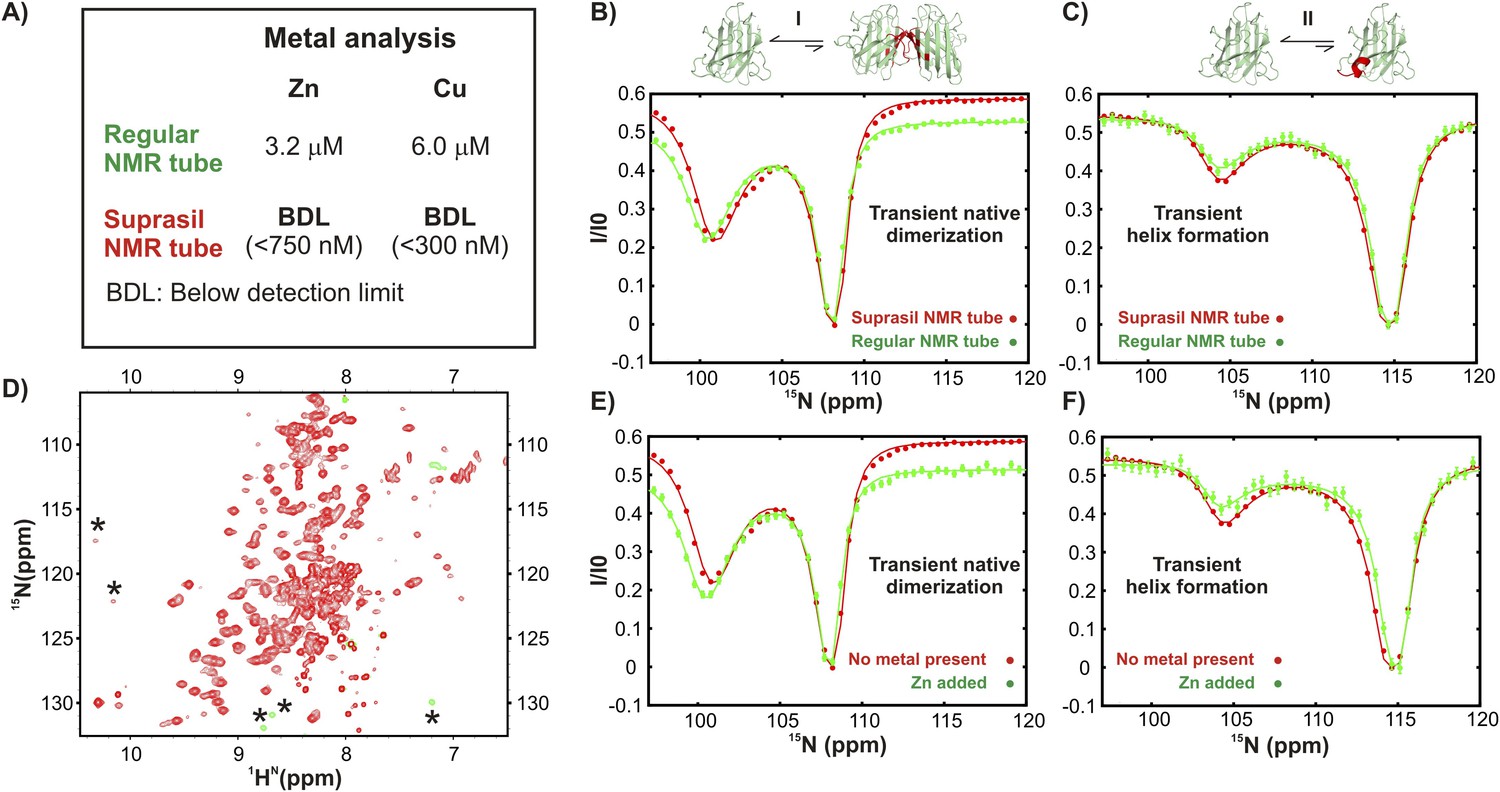
Excited state apoSOD12SH conformations that are observed in ground state, mature Cu2Zn2SOD1S–S are generated via metal-independent processes.
(A) Results of metal analysis of NMR samples of apoSOD12SH in regular and Suprasil NMR tubes (Wilmad Lab-glass catalogue number 535-PP-7SUP, synthetic glass without transition metals) performed immediately after CEST measurements were completed. A comparison of CEST profiles for residues belonging to transient dimerization (B) and local folding (C) measured on samples in a regular NMR tube known from metal analysis to have traces of Zn and Cu (green) and in a Suprasil tube (red) devoid of metal. No differences were noted, suggesting that the processes are not affected by trace metal. (D) 1H-15N HSQC spectrum of apoSOD12SH (∼700 μM) containing externally added Zn (∼140 μM). The resonances of the Zn-bound form (asterisk) are in slow exchange with apoSOD12SH. CEST profiles of apoSOD12SH nuclei reporting on transient dimerization (E) or local folding (F) derived from experiments recorded using Suprasil tubes with either no added metal (red, ∼700 µM protein) or added Zn (green, ∼700 µM protein, ∼140 µM Zn). The close similarities of the profiles provide strong evidence that the processes are metal independent.
Figure 4 with 1 supplement
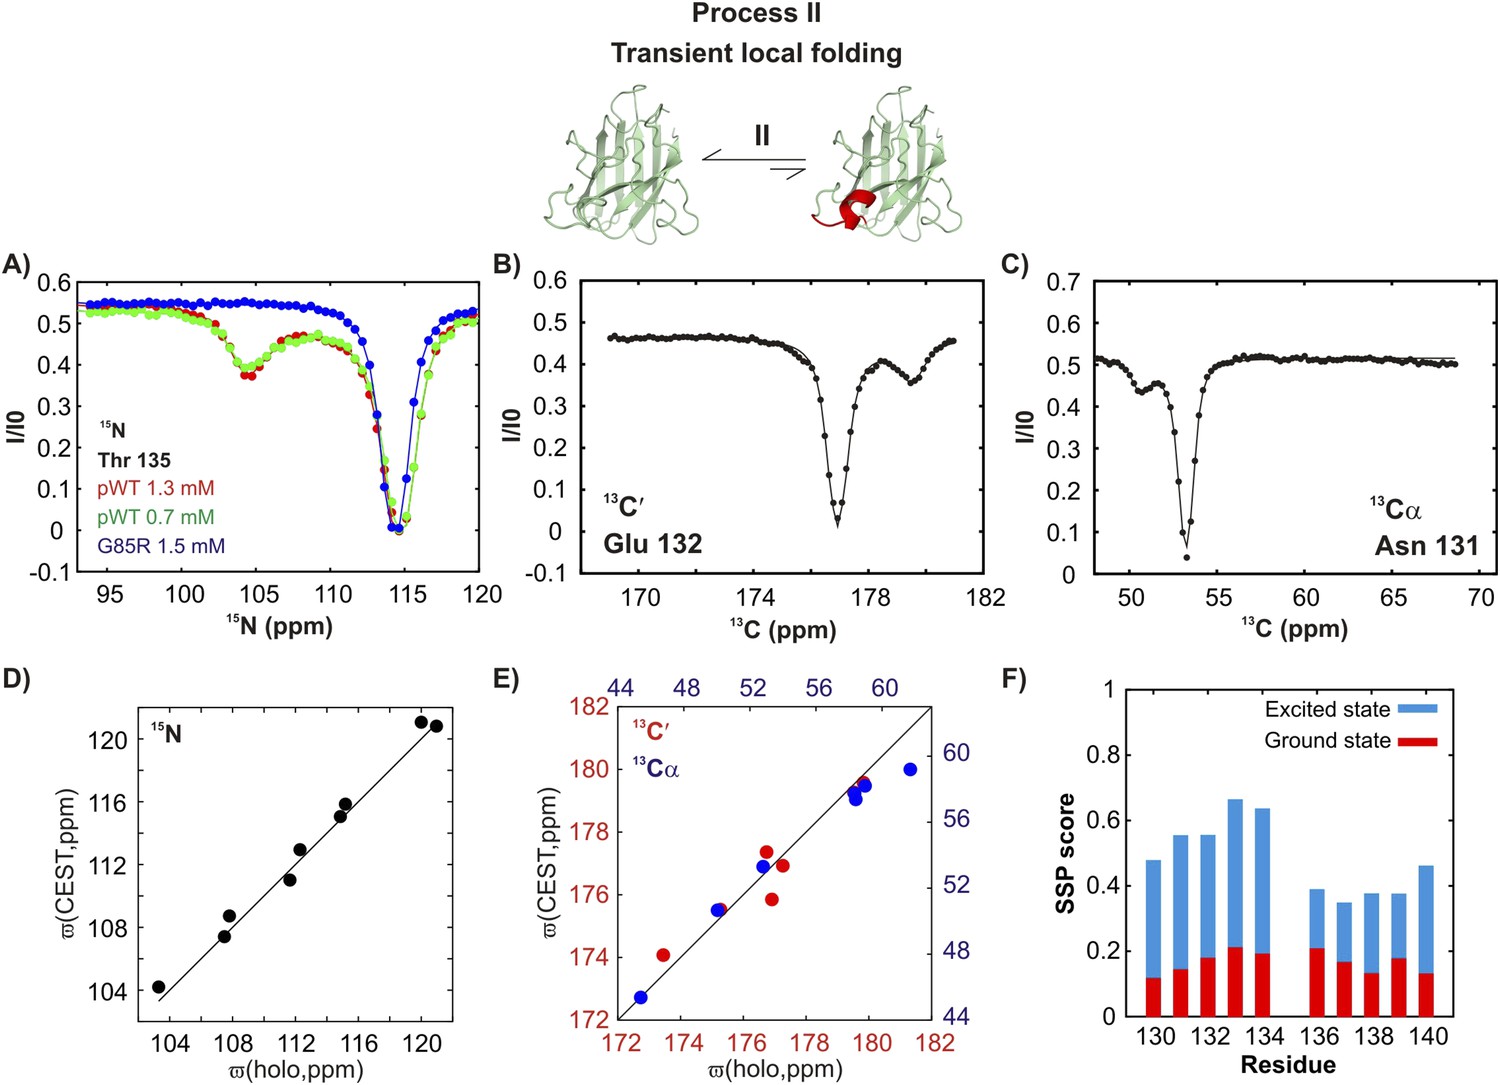
An excited state of pWT apoSOD12SH with a native-like helix in the electrostatic loop.
15N- (A), 13C′- (B) and 13Cα- (C) CEST profiles for T135, E132 and N131 that report on transient helix folding. Correlations of 15N (D), 13C′ (E, red) and 13Cα (E, blue) CEST-derived excited state chemical shifts, (ϖ, ppm, y-axis) of apoSOD12SH with the ground state shifts (Banci et al., 2002a) of Cu2Zn2SOD1S–S (x-axis) for residues localized to regions involved in transient helix formation. Helix formation is eliminated by the G85R mutation (A, blue). (F) Secondary Structural Propensity (SSP) (Marsh et al., 2006) scores computed from chemical shifts of nuclei in the ground and excited states and localized to residues 130–140 that are sensitive to process II. A value of 0 indicates a random coil conformation and a value of +1 corresponds to a fully formed helix. The helicity increases by up to ∼50% in the excited state, showing that process II involves local folding.
Figure 4—figure supplement 1
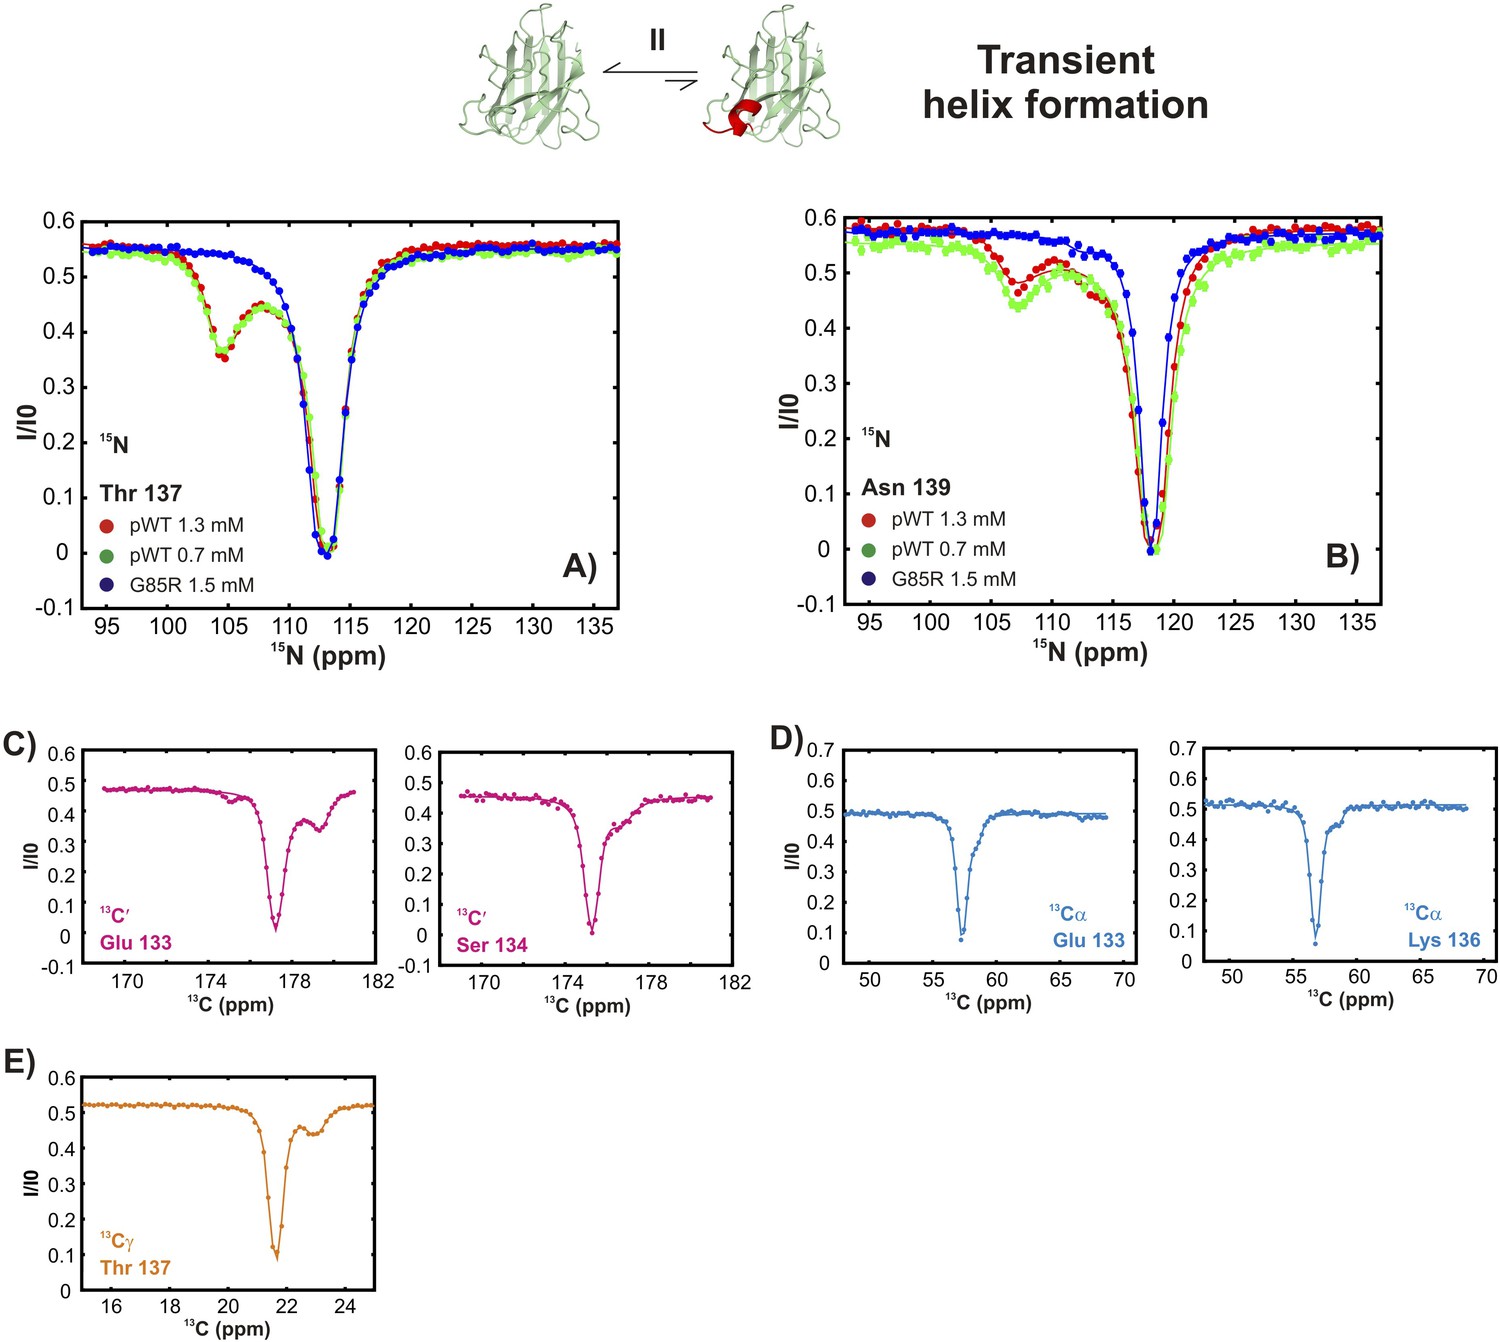
Conformationally excited states of apoSOD12SH containing ‘native’ features as studied by 15N (Vallurupalli et al., 2012), 13C′ (Vallurupalli and Kay, 2013), 13Cα (Long et al., 2014), and 13CH3 (Bouvignies et al., 2014) CEST—process II.
(A, B) 15N CEST profiles of residues reporting on transient local folding at two different concentrations of pWT apoSOD12SH (red: 1.3 mM, green: 0.7 mM). Also shown are corresponding profiles from G85R apoSOD12SH (blue, 1.5 mM), establishing that the mutation eliminates process II. 13C′, 13Cα and methyl-13C (13CH3) CEST profiles for pWT residues reporting on transient local folding (C–E).
Figure 5 with 1 supplement
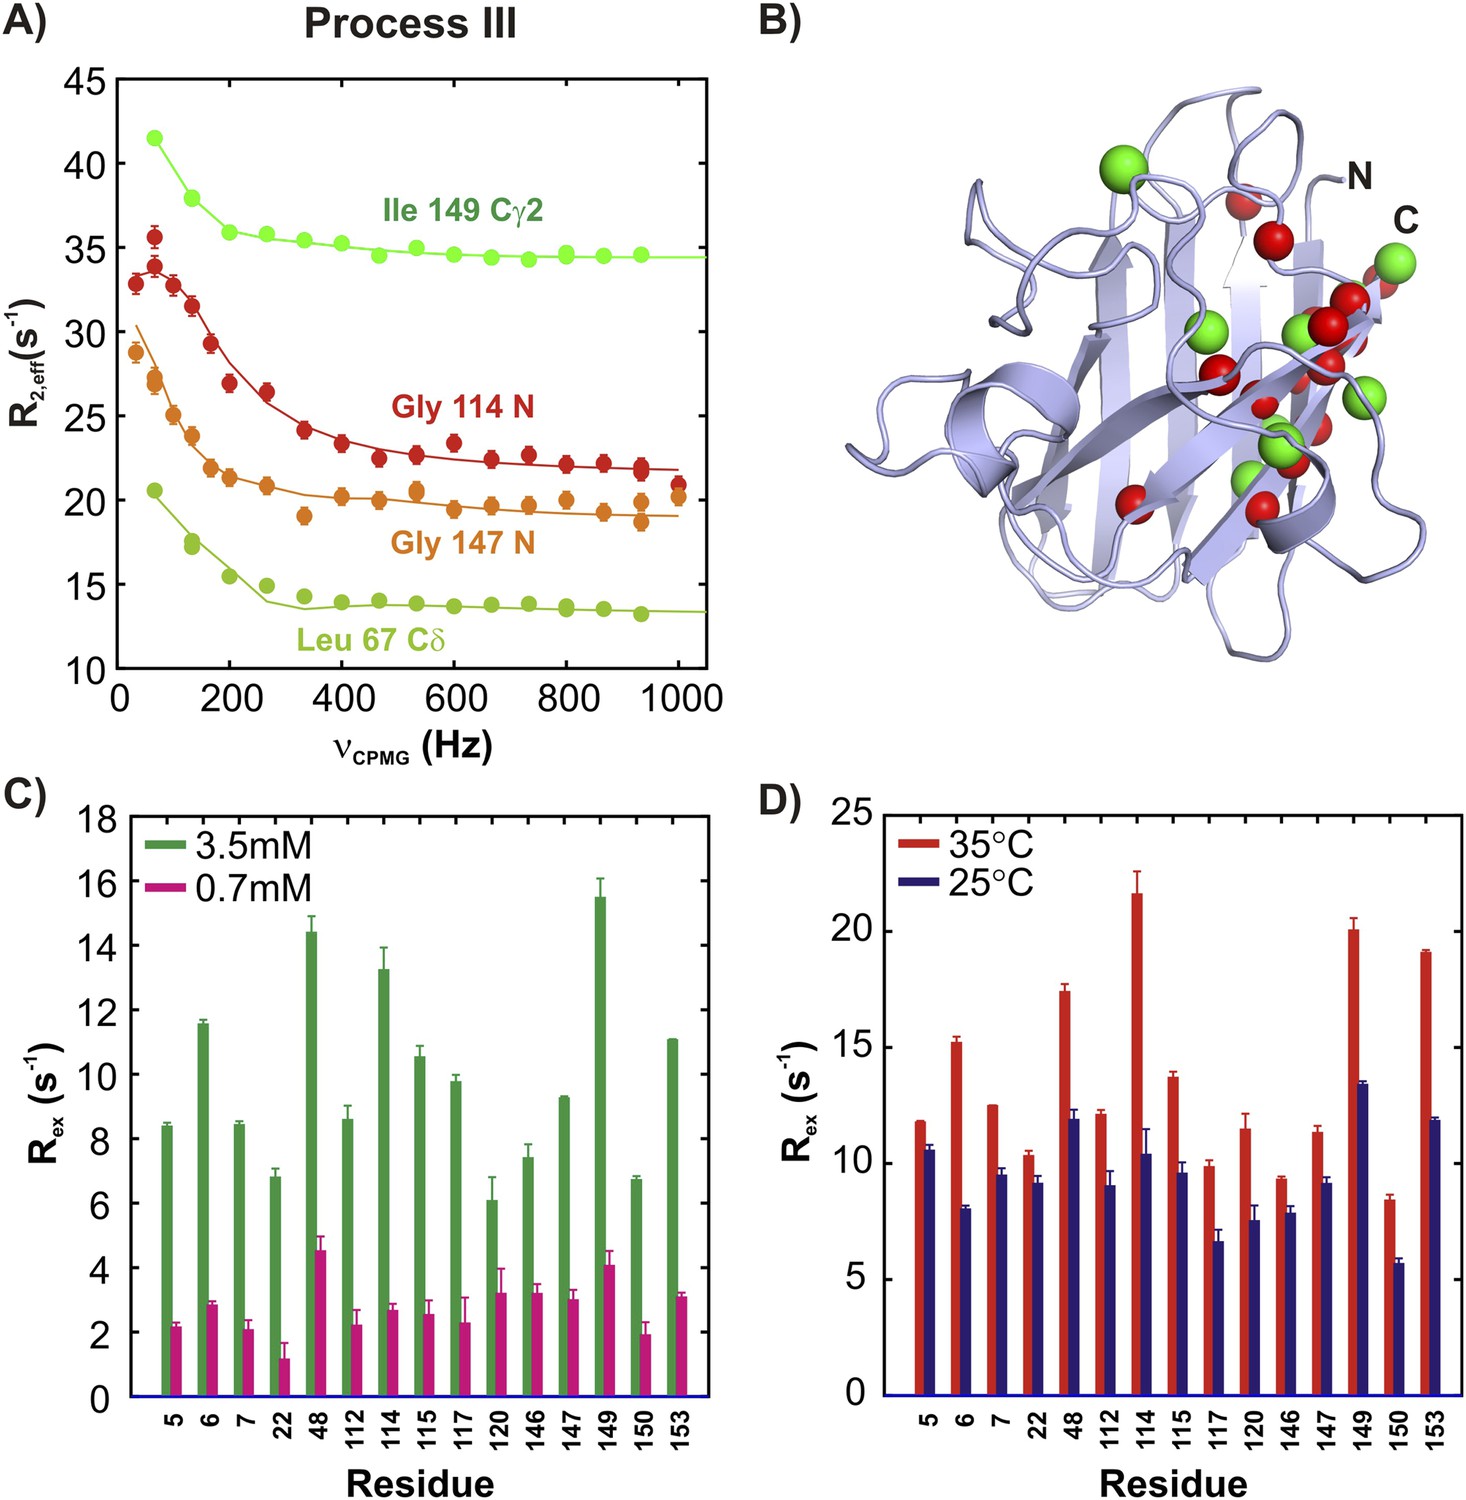
ApoSOD12SH transiently forms distinct non-native oligomers—Process III.
Representative 15N (red, orange) and 13CH3 (green) CPMG profiles for residues belonging to processes III (A). Each curve shows the effective 15N or 13C transverse relaxation rate, R2,eff, plotted as a function of the rate of pulsing in CPMG trains (Palmer et al., 2000). (B) Residues identified as reporting on process III via CPMG experiments (see ‘Materials and methods’) are highlighted on the structure of a monomer of Cu2Zn2SOD1S–S. Concentration (C, 25°C) and temperature-dependence (D, 2 mM protein concentration) of Rex values (the difference in relaxation rates recorded at the lowest and highest CPMG field strengths [Palmer et al., 2000]) obtained from 15N CPMG measurements on pWT apoSOD12SH.
Figure 5—figure supplement 1
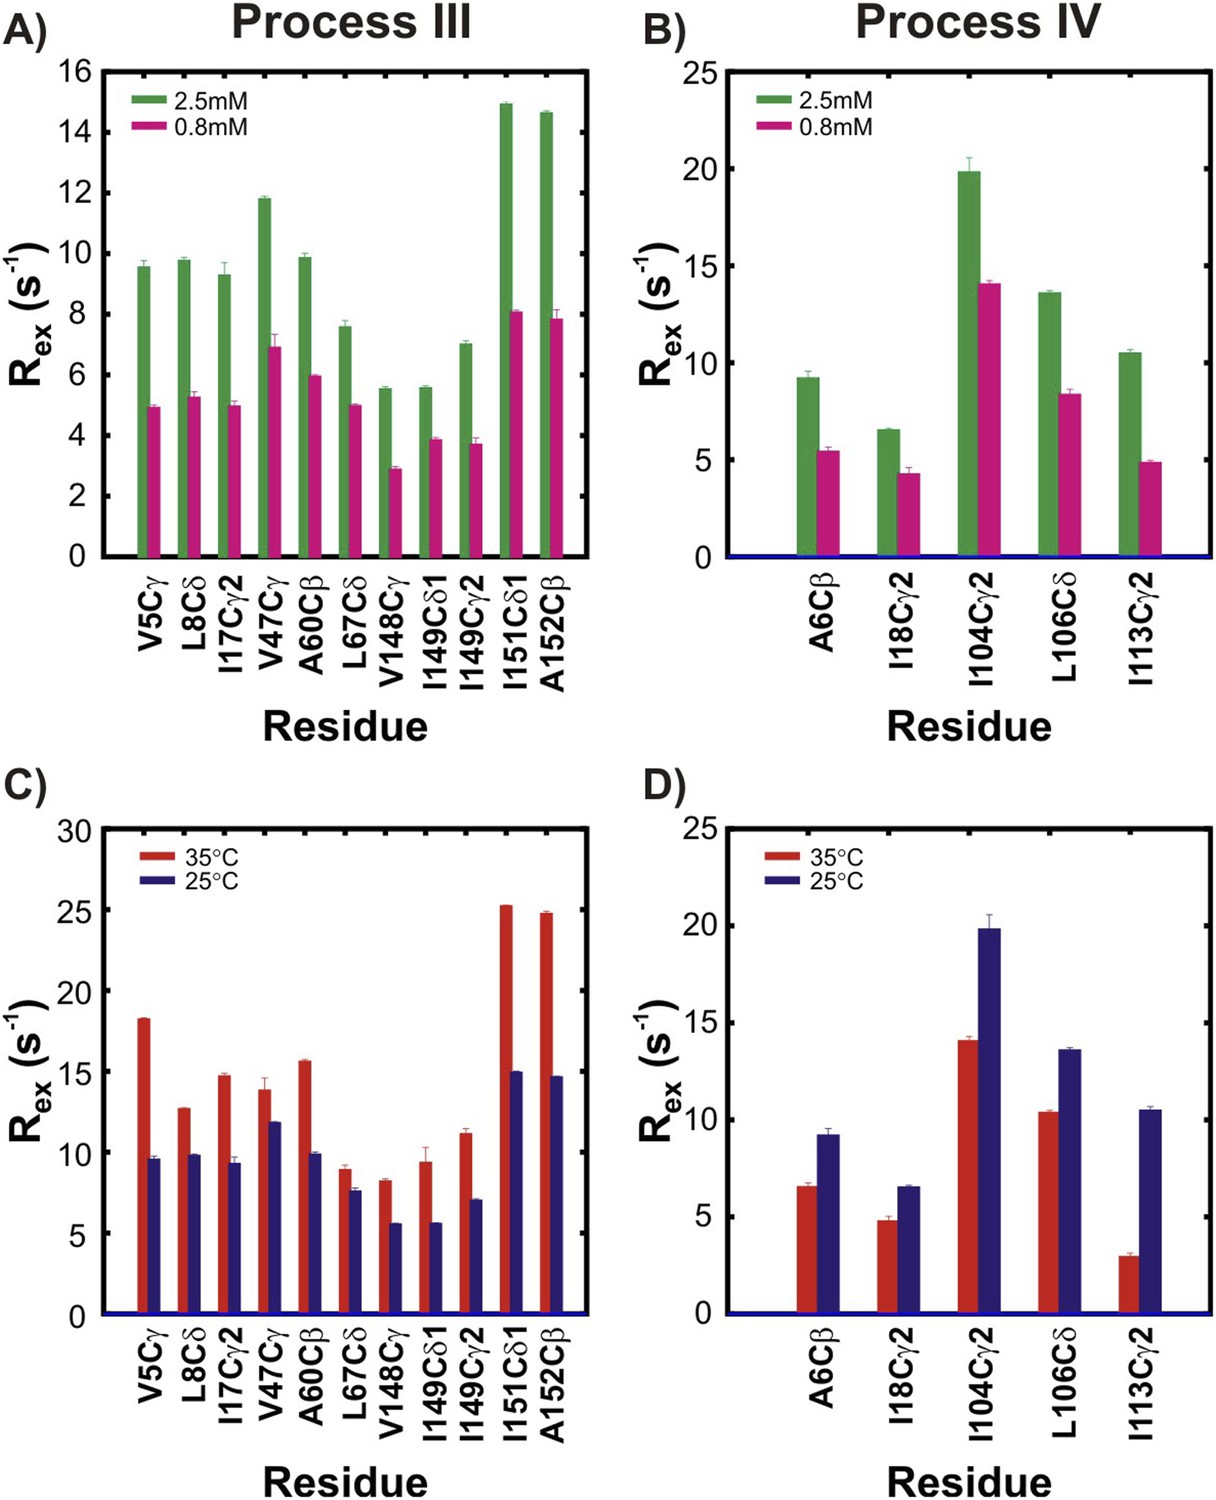
The two non-native oligomerization processes (III and IV) are distinct from one another.
Rex values, corresponding to the differences in effective methyl 13C transverse relaxation rates measured at the lowest and highest CPMG pulsing frequencies (Palmer et al., 2000), for residues in pWT apoSOD12SH reporting on process III (A, C) or process IV (B, D). Two different concentrations (panels A, B; green: 2.5 mM, magenta: 0.8 mM, 25°C) or two different temperatures (panels C, D; red: 35°C, blue: 25°C, 2.5 mM protein concentration) are shown. Stereospecific assignments are not available for Leu or Val prochiral methyl groups.
Figure 6
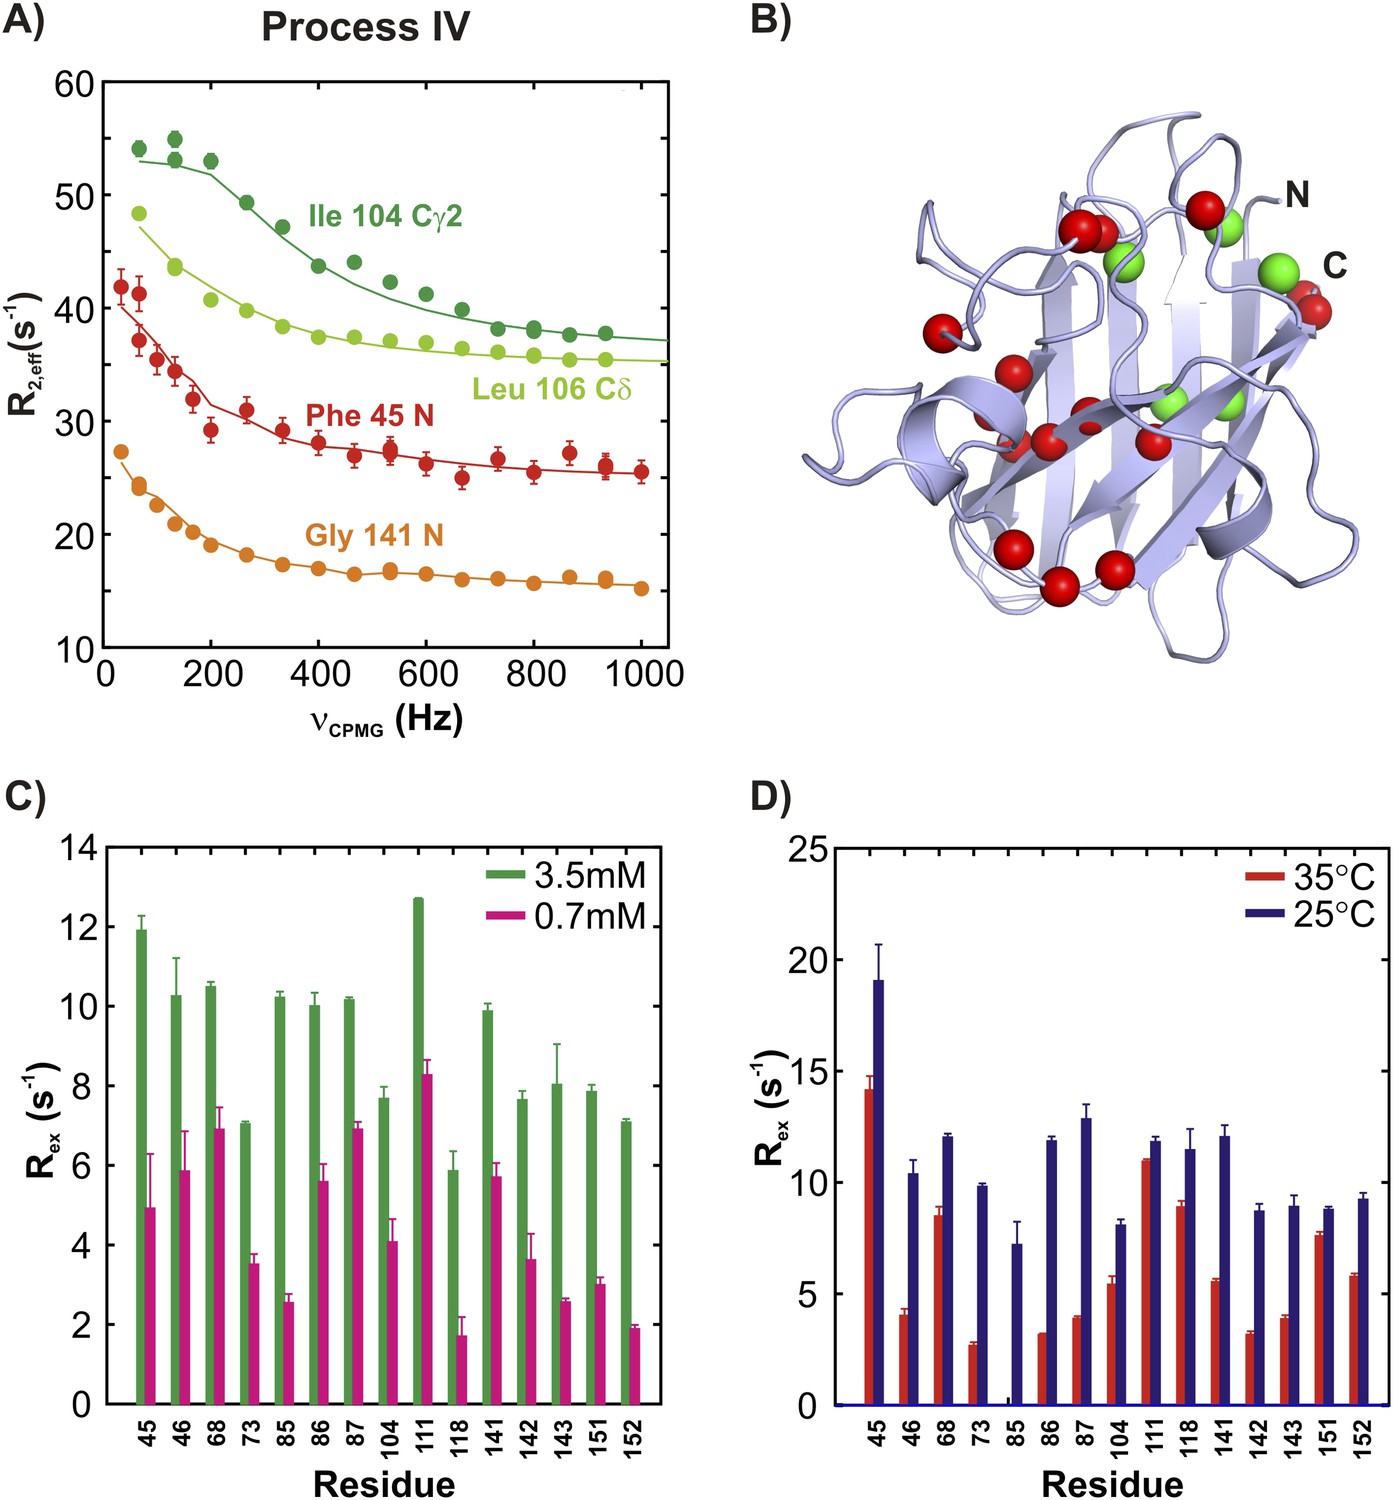
ApoSOD12SH transiently forms distinct non-native oligomers—Process IV.
(A–D) As Figure 5 with the exception that the residues selected are those probing process IV.
Figure 7 with 1 supplement
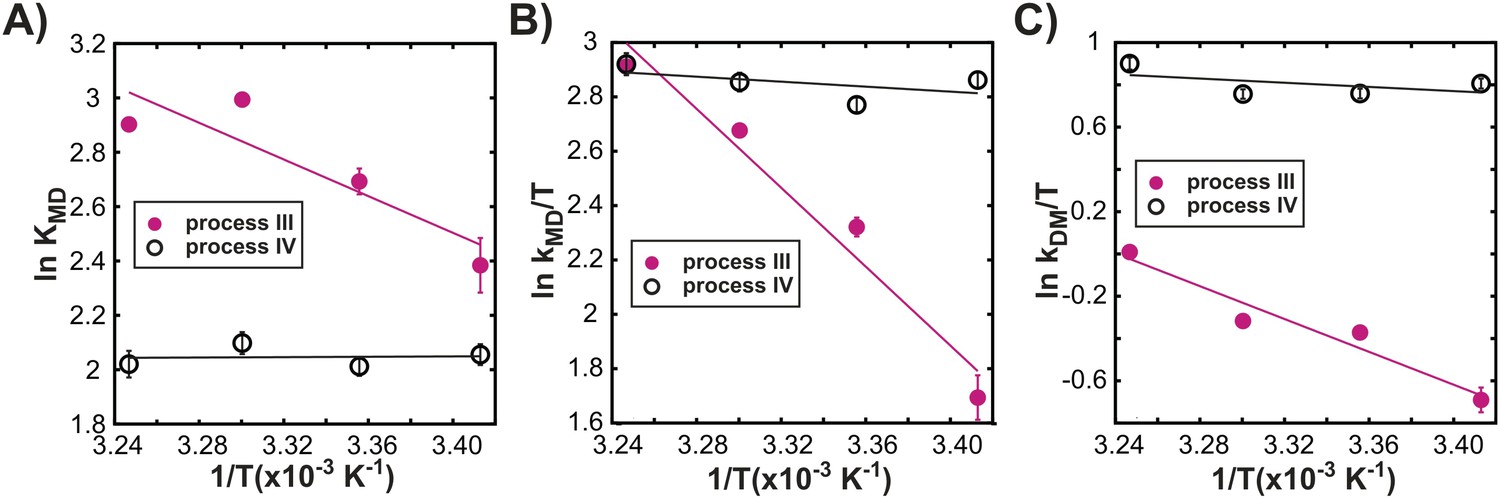
Processes III and IV are distinct.
Variation in the logarithms of the equilibrium constant for dimer formation (A, KMD), as well as the association (B, kMD) and dissociation (C, kDM) rate constants with inverse temperature for processes III (closed magenta circles) and IV (open black circles) obtained as described in ‘Materials and methods’, ‘Separating probes of processes I–IV’.
Figure 7—figure supplement 1
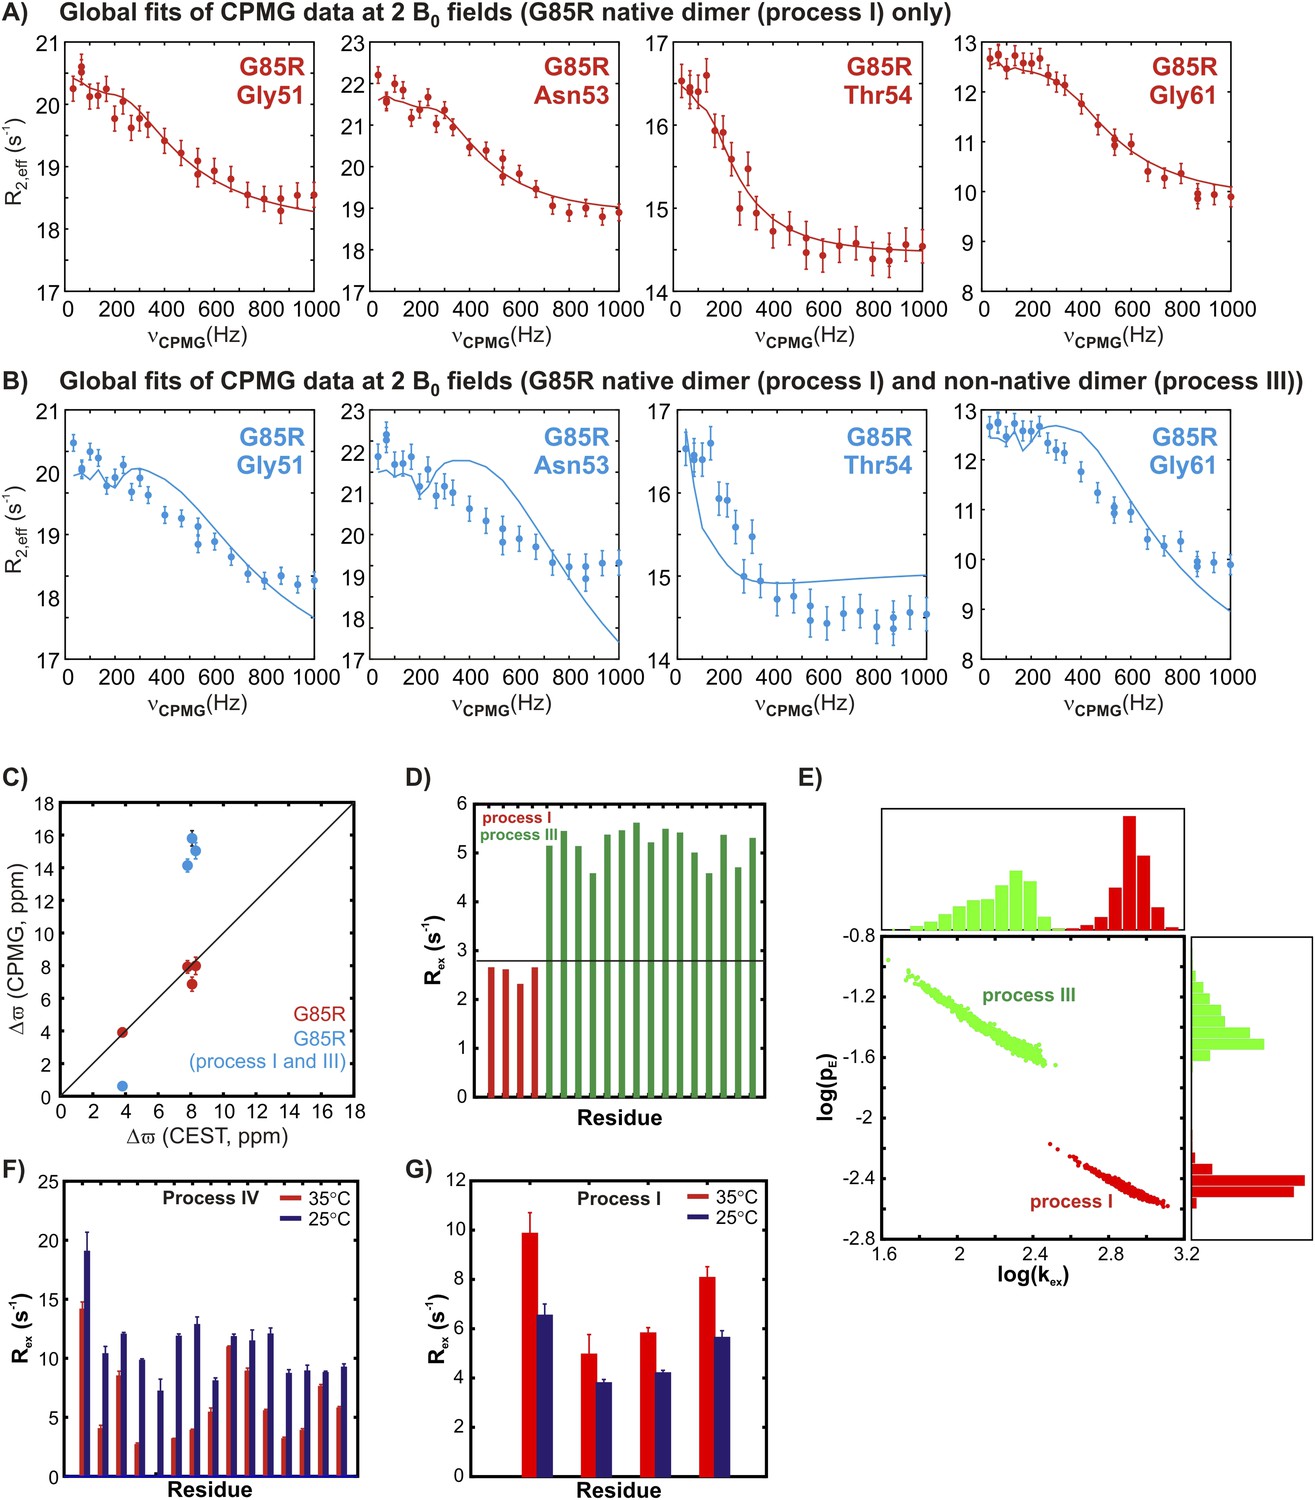
The two transient non-native oligomerization processes (III and IV) observed in apoSOD12SH are distinct from native dimerization (process I).
(A) 15N CPMG profiles of G85R apoSOD12SH (600 MHz, 1.5 mM protein concentration, 25°C) for residues reporting on native dimerization (process I) can be fit together to extract chemical shift differences, Δϖ, between the ground state (monomer) and the excited conformer (native dimer), that correlate well with the values obtained from CEST measurements on the same mutant (C, red). (B) These dispersion profiles cannot be fit together with those from residues reporting on non-native oligomerization process III and the resulting Δϖ values are in error (C, blue). Thus, processes I and III are distinct from each other. (D) This is illustrated further by comparing calculated Rex values for residues selected as reporting on processes III (green) and I (red) using Equation 1 of ‘Materials and methods’ and the best fit exchange values and chemical shift differences. Note that a maximum Rex value of 2.8 s−1 can be obtained for a reporter of process I (red) (see ‘Materials and methods’ ‘Separating probes of processes I–IV’, black horizontal line), based on fits of 15N CPMG dispersion profiles recorded on 1.5 mMG85R apoSOD12SH (600 + 800 MHz, 25°C). This value is clearly much smaller than those calculated and measured for residues reporting on process III. (E) Comparison of pE (fractional population of the excited state) and kex (sum of forward and reverse exchange rates) values obtained from separate two-state fits of dispersion profiles reporting on processes I (red) or III (green) (1.5 mM G85R apoSOD12SH, 600 + 800 MHz, 25°C) showing that each process can be well fit to distinct exchange parameters. The distributions shown were obtained from a bootstrap analysis, as described previously (Efron and Tibshirani, 1986; Sekhar et al., 2012). (F, G) Variation of measured Rex values corresponding to the differences in effective 15N transverse relaxation rates measured at the lowest and highest CPMG pulsing rates for 2 mM pWT apoSOD12SH for residues sensitive to process IV (panel F, repeated from Figure 6 for ease of comparison) and process I (G) at 35°C (red) and 25°C (blue). The temperature dependencies of processes I and IV unequivocally distinguish them.
Figure 8
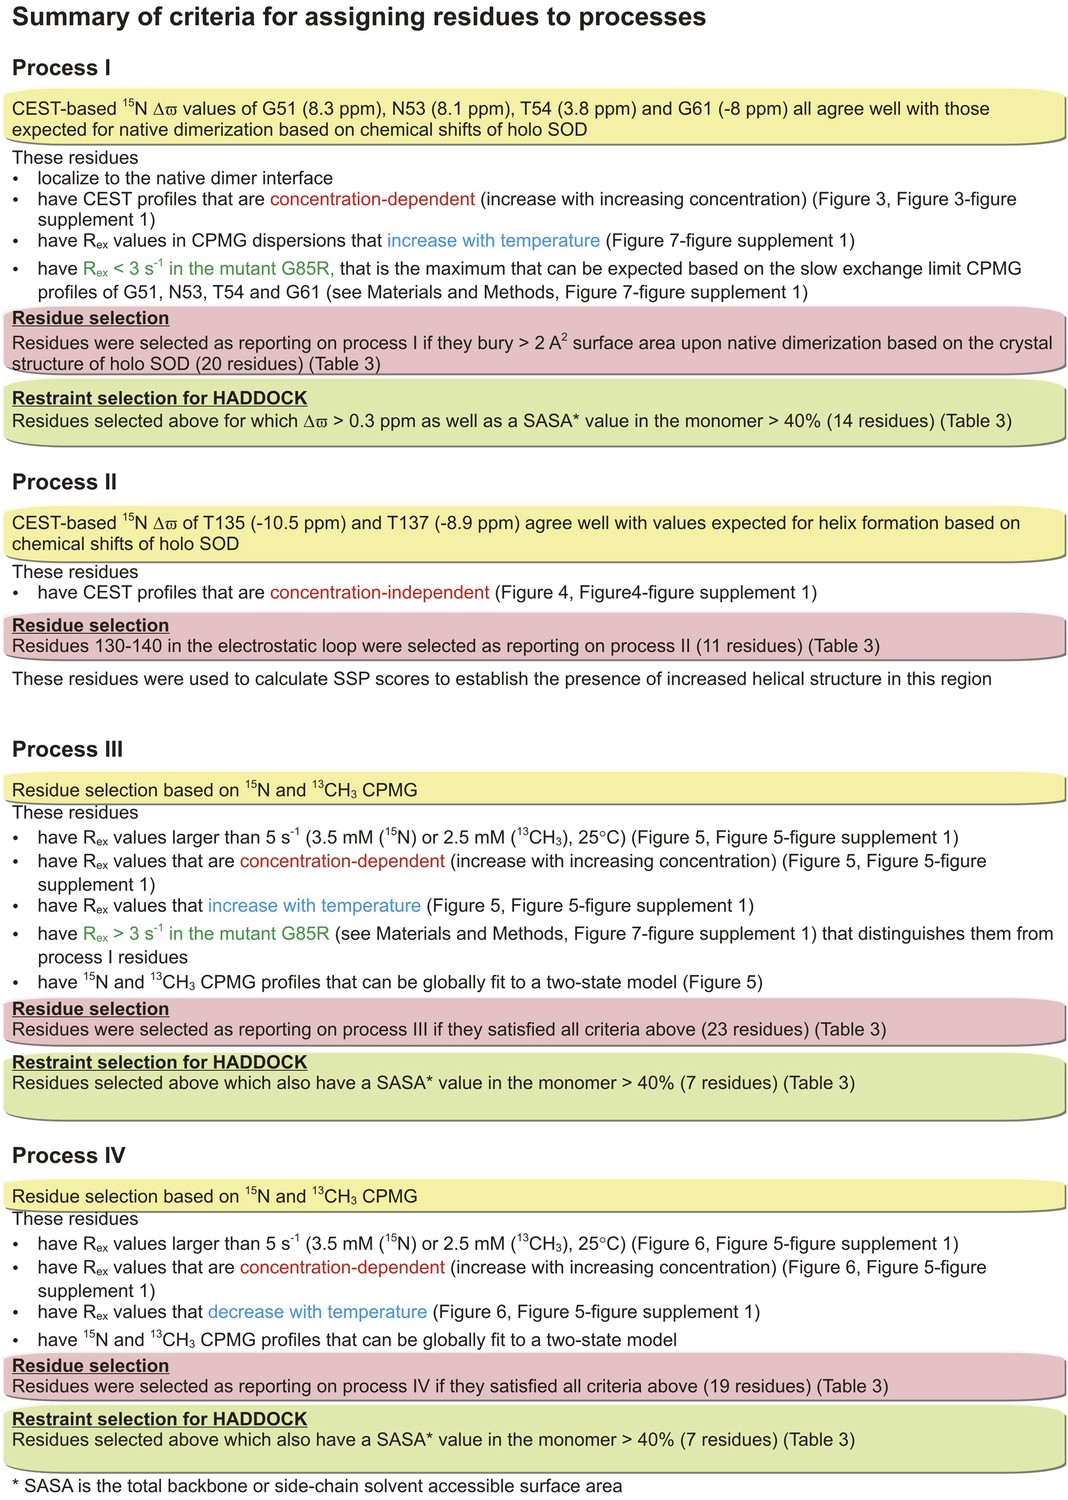
Summary of the criteria used for assigning exchange processes I–IV.
More details can be found in ‘Materials and methods’, ‘Separating probes of processes I–IV’.
Figure 9 with 2 supplements
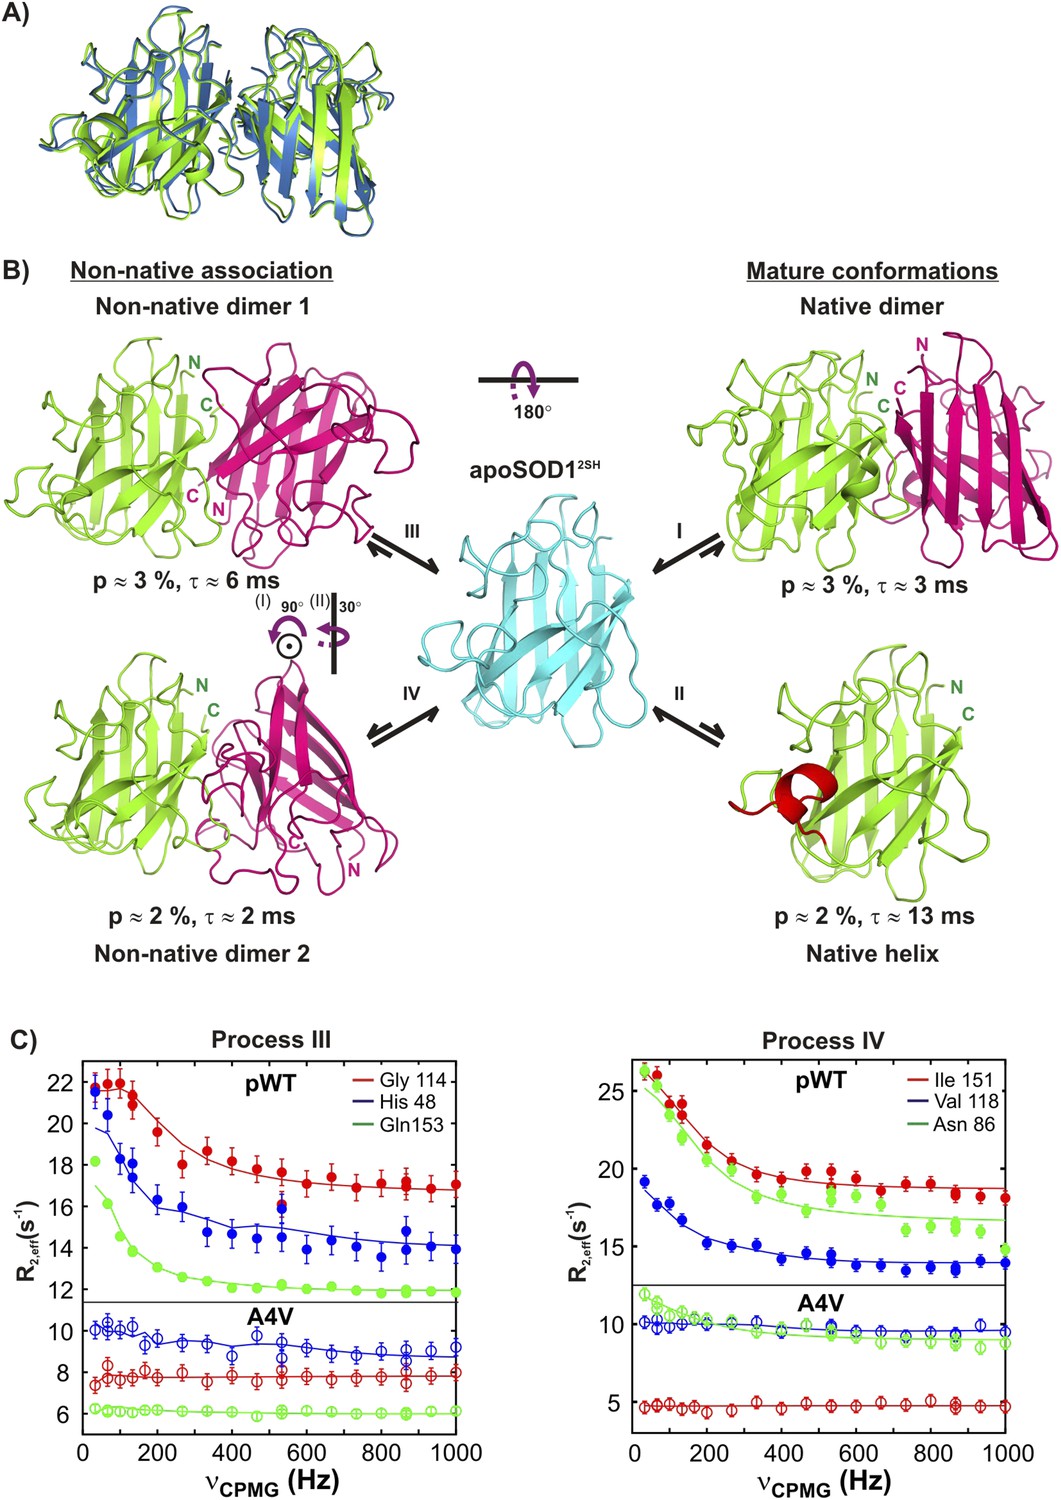
Monomeric apoSOD12SH is in equilibrium with mature and aberrantly associated conformations.
(A) Superposition of ribbon diagrams of the lowest energy HADDOCK model of the native dimer excited state of pWT apoSOD12SH (process I, blue) and the X-ray structure of Cu2Zn2SOD1S–S (pdb code: 1hl5, green) (Strange et al., 2003). (B) Conformations transiently populated by apoSOD12SH (blue), including states with structural features similar to the ground state of Cu2Zn2SOD1S–S (‘Mature conformations’) and aberrant oligomers (‘Non-native association’). Structural models for the native dimer (I) and the symmetric (III) and asymmetric (IV) non-native dimers populated by apoSOD12SH as determined from the HADDOCK program (Dominguez et al., 2003) are shown along with the model that includes helix folding (II) taken directly as a monomer from the crystal structure of Cu2Zn2SOD1S–S (Strange et al., 2003). The purple arrows indicate approximate rotations needed to transform magenta monomers of non-native dimer 1 to corresponding monomers of either the native dimer or non-native dimer 2. In the latter case, two successive rotations about (i) an axis perpendicular to the plane of the paper and subsequently about (ii) a vertical axis are required. Note that the scheme shown here is the simplest one consistent with the spin relaxation data (see ‘Discussion’). (C) The A4V mutant severely reduces association via processes III and IV, as established by the significant decrease in the sizes of CPMG dispersion profiles. The top part of each panel shows CPMG profiles for pWT apoSOD12SH, with the corresponding curves for the A4V mutant indicated in the bottom. A small constant y-offset has been applied to some of the curves for clarity.
Figure 9—figure supplement 1
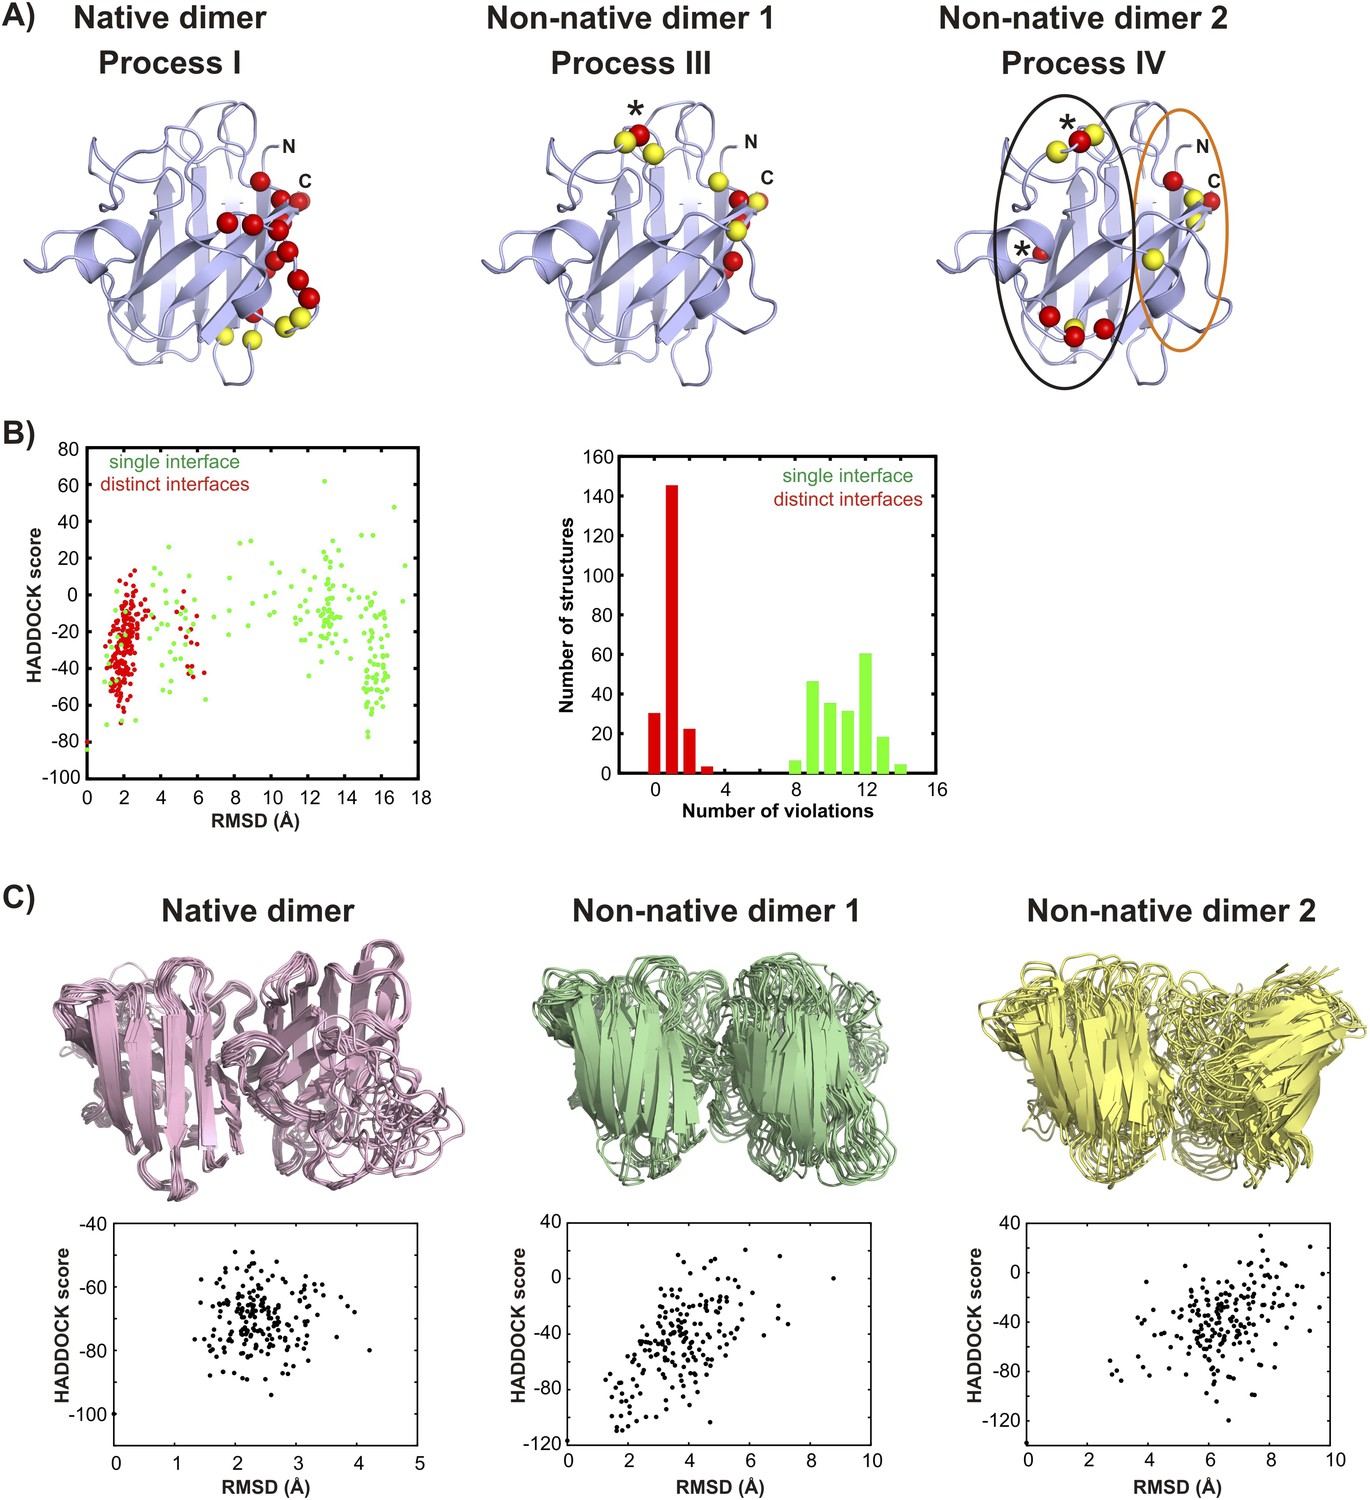
Structural models for the oligomeric excited states of pWT apoSOD12SH from the biomolecular docking program HADDOCK (Dominguez et al., 2003).
(A) Active (red) and passive (yellow) residue restraints used to generate structural models of the native and non-native transiently formed dimers. The active residues are a subset of those with Rex (15N (3.5 mM) or methyl-13C (2.5 mM)) > 5 s−1, 800 MHz, 25°C for which main-chain or sidechain relative solvent accessibility values are larger than 40%. Passive residues are solvent accessible surface neighbours of the active residues. The active residues used to generate the native dimer (process I) in HADDOCK calculations are localized to a single region of pWT apoSOD12SH, as are those for non-native dimer 1 (process III). L67, indicated by * was consistently violated in docking calculations for non-native dimer 1 and was removed from the active restraint list. It appears that spin probes from L67 are not localized to the non-native dimer interface but rather report on a secondary process that depends on dimerization, such as a change in conformation. In contrast to residues associated with process III, active residues for process IV (non-native dimer 2) do not cluster and can roughly be divided between a pair of sites, denoted by black and orange circles in (A). (B) HADDOCK calculations for non-native dimer 2 converged well when the interface was enforced to derive from active residues in the ‘black’ circle in one monomer and from active residues from the ‘orange’ circle for the second, leading to an asymmetric dimer (red, denoted by ‘distinct interfaces’ in the figure panel B). Notably, restraints from residues S68 and N86 (residues indicated by * in A) were consistently violated and these were subsequently removed from further calculations. Convergence was not achieved when the restraints derived from all active residues for each of the monomers were enforced without first separating them as described above and shown in the circles in A (green, denoted by ‘single interface’), with on average ∼80% of the restraints violated over the 200 final calculated structures and an average violation of 4.7 Å. By contrast, modelling Process IV as involving distinct interfaces (i.e., asymmetric dimer) leads to less than 1 restraint violated on average, per structure, with an average distance of 0.4 Å per violation. Plots of the HADDOCK score vs RMSD (to the lowest scored structure, left) and a histogram of restraint violations (right) illustrate this. In these initial simulations both electrostatic and Zn-loops were kept fixed to the X-ray coordinates (Strange et al., 2003), but were allowed to move in further calculations to generate the final set of structures, as described in ‘Materials and methods’. (C) Ensembles of the native and non-native dimers including structures with the 10 lowest HADDOCK scores. Corresponding plots of HADDOCK score vs RMSD (to the lowest scored structure) for each of the dimers are shown below the structures. The larger RMSD spreads for the non-native dimers reflect to a large extent the fact that both electrostatic and Zn-loops were allowed to be flexible in the final set of calculations while the Zn-loop was fixed for the native dimer. Averaged over the lowest 10 members of the ensemble, 4 restraints were violated per structure with an average violation of 0.5 Å for the native dimer, 1.5 restraints per structure with an average violation of 0.7 Å for non-native dimer 1 and 1 restraint per structure with an average violation of 0.8 Å for non-native dimer 2.
Figure 9—figure supplement 2
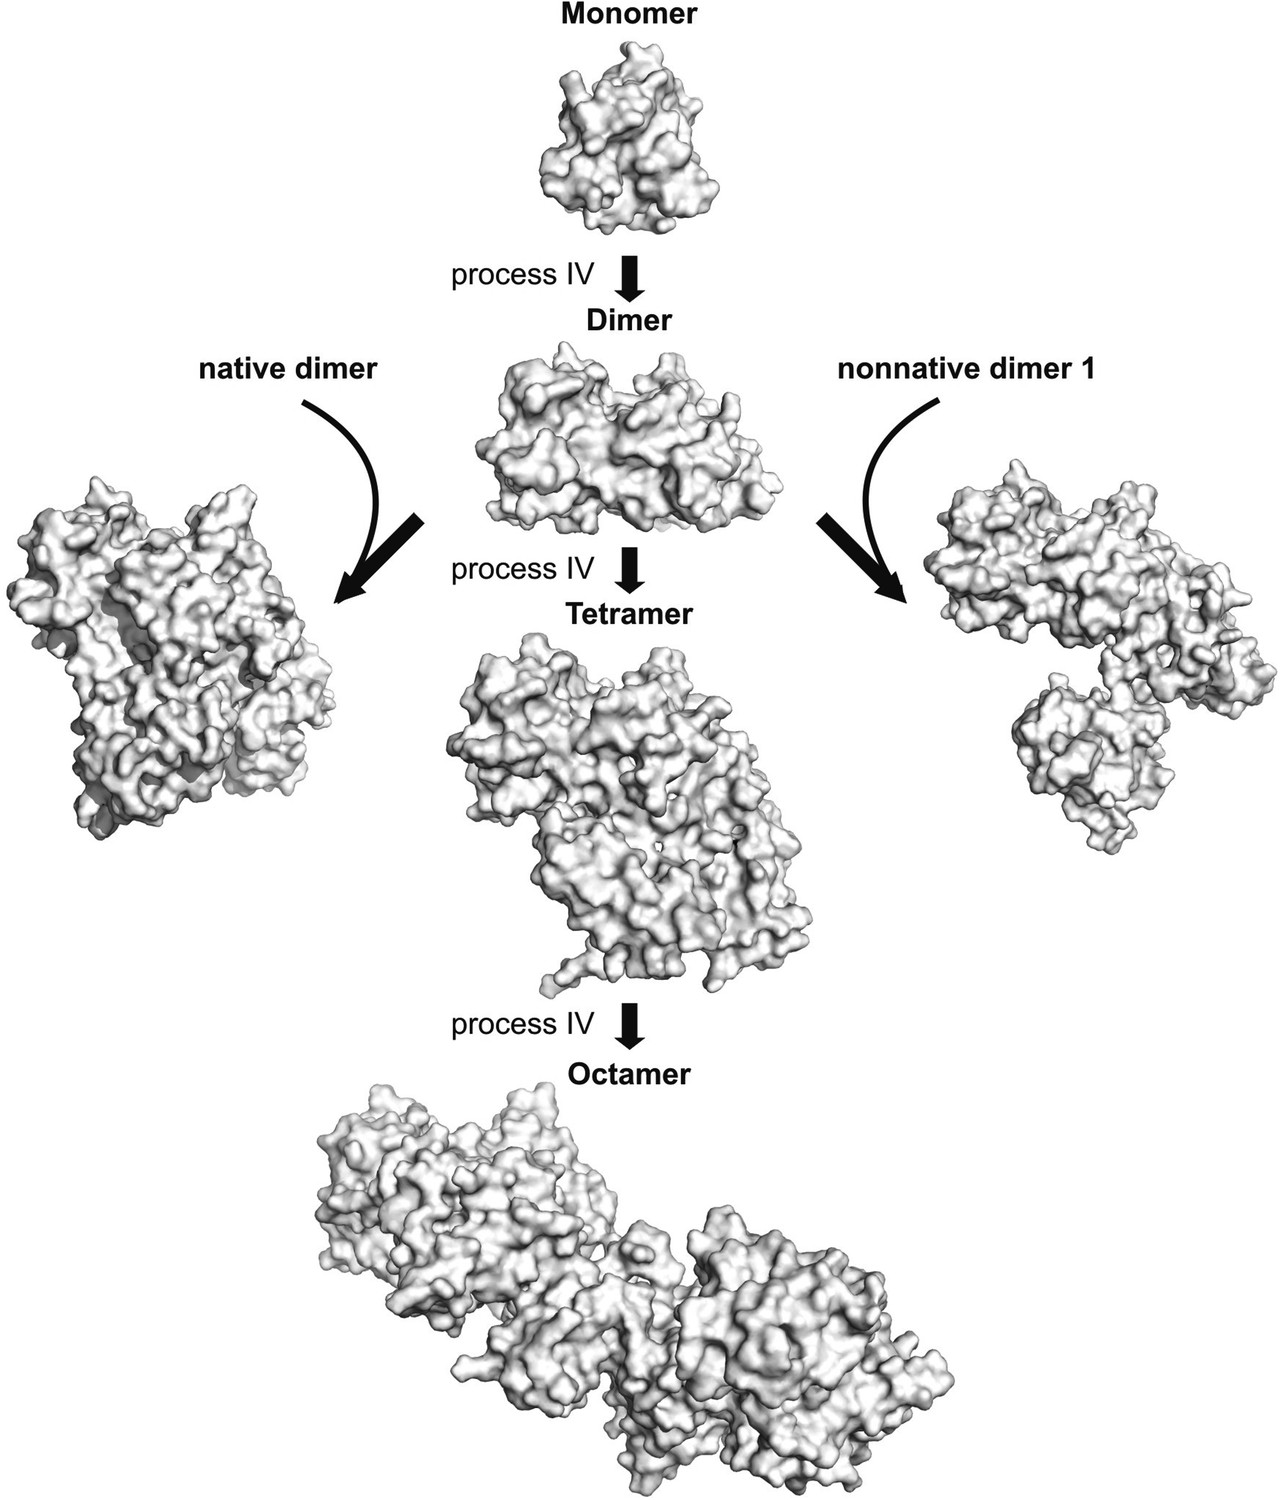
The asymmetric dimer from process IV can serve as a hub for the formation of larger oligomers.
A pair of low energy dimers formed via process IV was docked via HADDOCK as described in ‘Materials and methods’ using restraints from process IV (listed in Table 3) to form tetramers and the process repeated with the resulting tetramers to form octamers (Monomer–Dimer—Tetramer–Octamer pathway). Alternatively, non-native dimer 2 from process IV can also recruit a native dimer (left) or a non-native dimer generated from process III to form tetrameric aggregates, as shown. These structures were generated from HADDOCK calculations where non-native dimer 2 was docked on to a native dimer molecule or a non-native dimer 1 molecule using restraints from process IV.
Figure 10
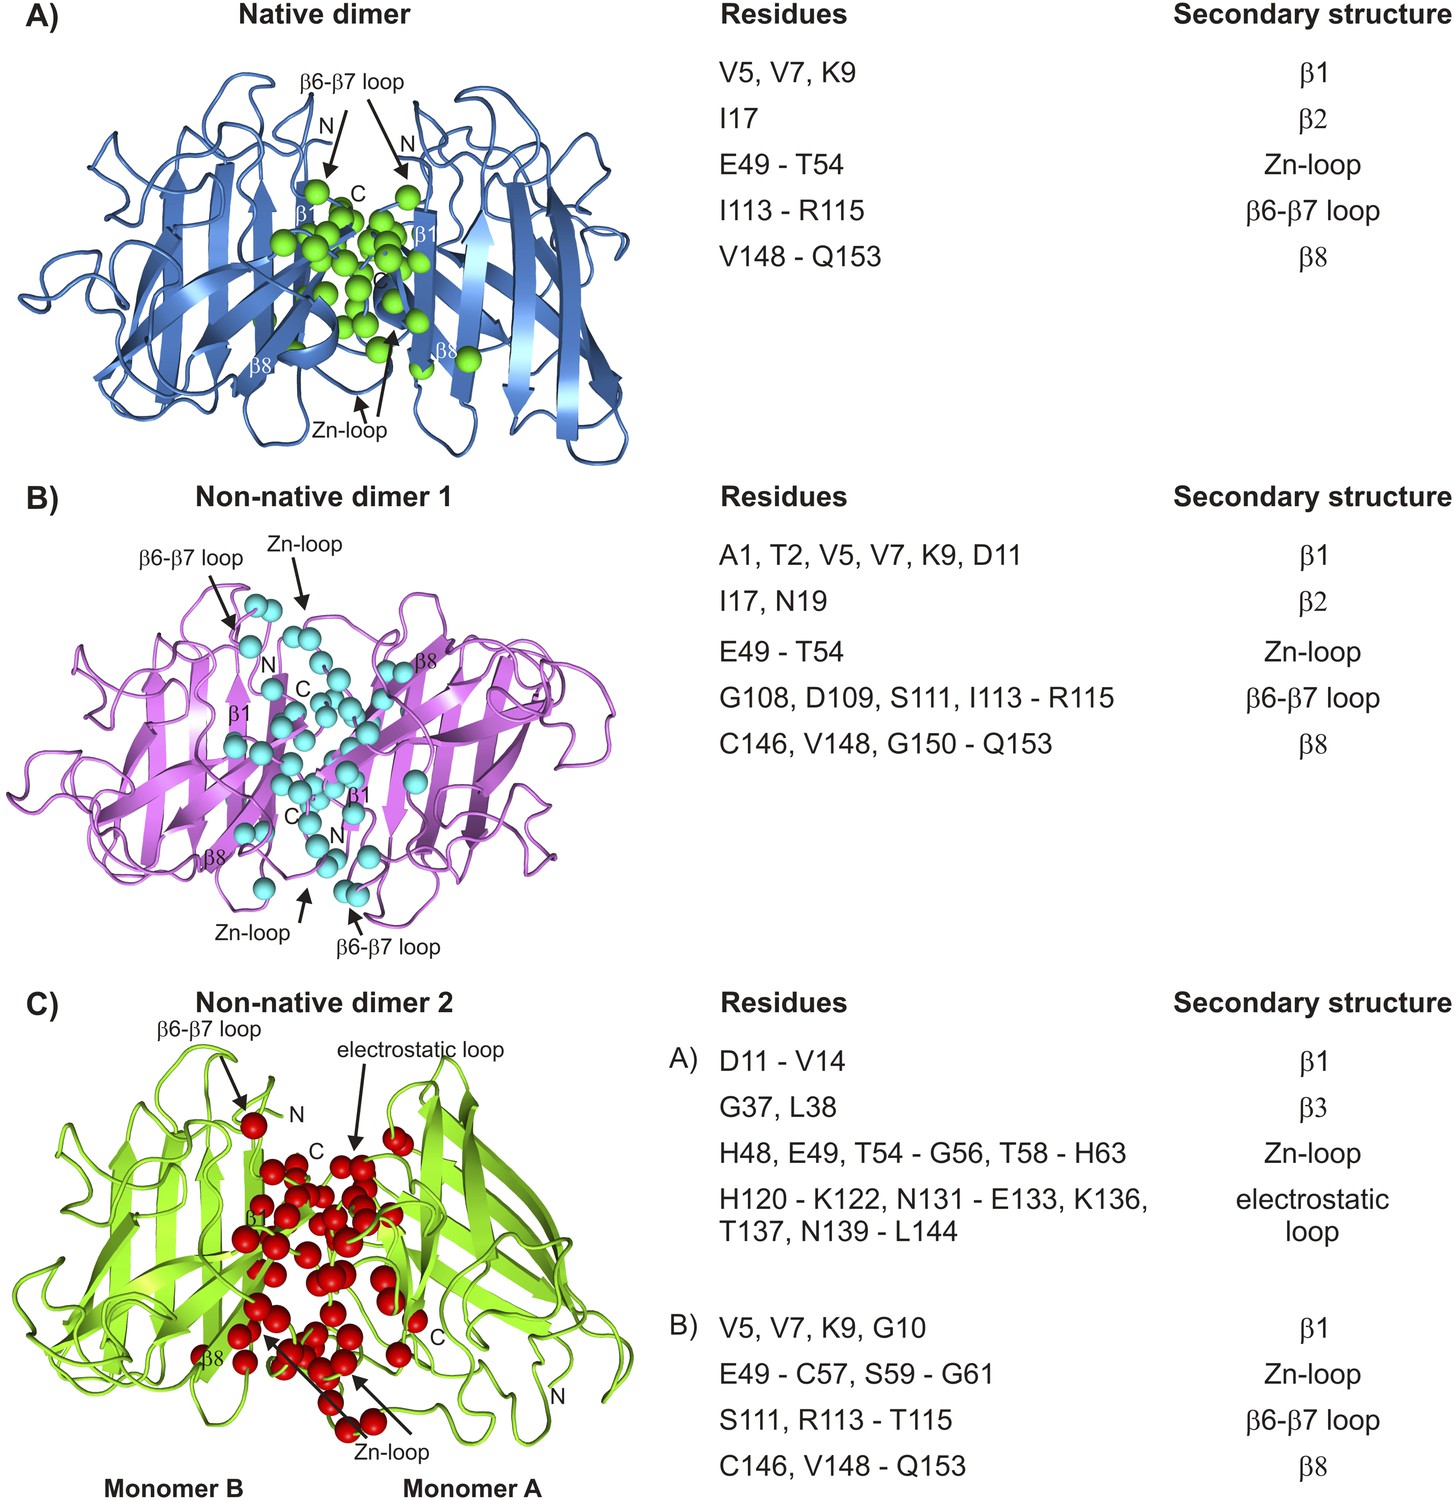
Interfaces of pWT apoSOD12SH excited state dimers.
The electrostatic and Zn-loops as well as strands β1 and β8 are key motifs in forming intermolecular interactions—both native and aberrant, as illustrated by the lowest energy structures for the native (A) and the two non-native dimers (B, C). Residues at the interface of the monomer units in each case were identified using a cutoff value of 2 Å2 for the surface area buried upon dimerization and are shown as spheres and indicated in tabular form on the right. Note that the native dimer and the non-native dimer 1 are symmetric (axes of symmetry in the plane of the paper and perpendicular to the plane of the paper, respectively), while the non-native dimer 2 is not.
Tables
Table 1
Excited state populations (pE) and lifetimes (τE) for processes I–IV
| Process | I | II | III | IV |
|---|---|---|---|---|
| pE (%) | 3 ± 1 | 2.1 ± 0.1 | 3.3 ± 0.2 | 2.1 ± 0.1 |
| τE (ms) | 3.0 ± 0.6 | 13 ± 1 | 6.0 ± 0.6 | 1.6 ± 0.1 |
-
Uncertainties for process I are calculated as ±1 s.d. of the values obtained from single B1 field fits of 15N CEST profiles of G51, N53, T54, and G61 (Figure 3—figure supplement 2B). Values for process II are the mean and standard deviation of pE and τE obtained from the two best three-state models (Figure 3—figure supplement 2E). The equations for calculating these values are listed in the legend for Figure 3—figure supplement 2. Note that very similar values of pE and τE are obtained from the two models (on- and off-pathway) and it is not possible to distinguish between them on the basis of the NMR data. Uncertainties for exchange parameters describing processes III and IV are obtained from global two-state fits of CPMG profiles reporting on each process. All values are relevant for a 1.3 mM protein concentration, 25°C.
Table 2
Distinguishing between exchange processes I–IV
| I (native dimer) | II (local folding) | III (non-native dimer 1) | IV (non-native dimer 2) | |
|---|---|---|---|---|
| I (Native dimer) | – | – | – | – |
| II (Local folding) | Concentration dependence* | – | – | – |
| III (Non-native dimer 1) | Rex values in G85R and pE/τE values from G85R† | Concentration dependence§ | – | – |
| IV (Non-native dimer 2) | Temperature dependence of CPMG Rex values‡ | Concentration dependence# | Temperature dependence of CPMG Rexvalues¶ | – |
-
*
-
†
-
‡
-
§
-
#
-
¶
Table 3
Residues reporting on processes I–IV†
| Process I‡ | Process II‡ | Process III§ | Process IV§ |
|---|---|---|---|
| V5* | G130 | V5 | A6 |
| V7 | N131* | A6 | I18 |
| K9 | E132* | V7 | F45 |
| I17 | E133* | L8 | V46 |
| E49 | S134* | I17 | S68 |
| F50* | T135* | Q22 | G73 |
| G51* | K136* | V47 | G85 |
| D52* | T137* | H48 | N86 |
| N53* | G138 | A60 | V87 |
| T54* | N139* | L67 | I104 |
| G61* | A140* | I112 | L106 |
| I113 | – | G114 | S111 |
| G114 | – | R115 | I113 |
| R115 | – | L117 | V118 |
| V148 | – | H120 | G141 |
| I149* | – | C146 | S142 |
| G150* | – | G147 | R143 |
| I151* | – | V148 | I151 |
| A152* | – | I149 | A152 |
| Q153 | – | G150 | – |
| – | – | I151 | – |
| – | – | A152 | – |
| – | – | Q153 | – |
-
†
Residues selected according to the criteria outlined in ‘Materials and methods’ ‘Separating probes of processes I–IV’. Active residues used in the molecular docking program HADDOCK (Dominguez et al., 2003) are indicated in bold. A total of 28 and 14 restraints were used in structure calculations of symmetric dimers corresponding to excited states derived from processes I and III, respectively (these numbers are doubled to indicate that a restraint from monomer A to B also pertains from B to A), with 7 restraints for the calculation of the excited state from process IV (asymmetric). The energy funnels obtained in the structure calculations (Figure 9—figure supplement 1) support the view that the structures have converged. For the non-native dimers, we have further evaluated the robustness of the calculations by repeating them after first removing 1 restraint at a time. Very similar ensembles to those illustrated in Figure 9—figure supplement 1 were obtained indicating that the structure calculation is not driven merely by a single restraint. For process III, we also obtain very similar structures if only restraints from 15N CPMG data are included. Moreover, we have run additional calculations for process IV starting with the NMR derived structure of monomeric C6A/C111S/Q133E/F50E/G51E apoSOD1S–S (PDB accession code 1RK7 [Banci et al., 2003]), in which the electrostatic and Zn-binding loops are disordered, rather than from a monomer of the native dimer X-ray structure (PDB accession code 1HL5 [Strange et al., 2003]). Very similar structures are obtained in all cases.
-
‡
Residues labeled with * are those for which separate dips or shoulders corresponding to an excited state were observed in 15N, 13C′ or 13Cα CEST profiles. Recall that relatively small Δϖ values precluded the use of CEST for the study of processes III and IV. Note that a number of active residues are classified as reporting on both processes I and III; these correspond to residues that are at the native dimer interface (and hence classified as reporters of process I, see ‘Separating probes of processes I–IV, Process I: Transient native-like dimerization’) and that have dispersion profiles and Rex values that are clearly sensitive to process III.
-
§
Rex > 5 s−1 (800 MHz) for 15N (3.5 mM) and/or 13C-methyl (2.5 mM) CPMG relaxation dispersion profiles.
Additional files
-
Supplementary file 1
Coordinates for the conformationally excited state corresponding to the native dimer (process I); ten structural models with the lowest HADDOCK scores.
- https://doi.org/10.7554/eLife.07296.024
-
Supplementary file 2
Coordinates for the conformationally excited state corresponding to the symmetric non-native dimer 1 (process III); ten structural models with the lowest HADDOCK scores.
- https://doi.org/10.7554/eLife.07296.025
-
Supplementary file 3
Coordinates for the conformationally excited state corresponding to the asymmetric non-native dimer 2 (process IV); ten structural models with the lowest HADDOCK scores.
- https://doi.org/10.7554/eLife.07296.026
Download links
A two-part list of links to download the article, or parts of the article, in various formats.
Downloads (link to download the article as PDF)
Open citations (links to open the citations from this article in various online reference manager services)
Cite this article (links to download the citations from this article in formats compatible with various reference manager tools)
Thermal fluctuations of immature SOD1 lead to separate folding and misfolding pathways
eLife 4:e07296.
https://doi.org/10.7554/eLife.07296


