Parental effects alter the adaptive value of an adult behavioural trait
- University of Cambridge, United Kingdom
- Australian National University, Australia
- Polish Academy of Sciences, Poland
- University of Zürich, Switzerland
Figures
Figure 1 with 2 supplements
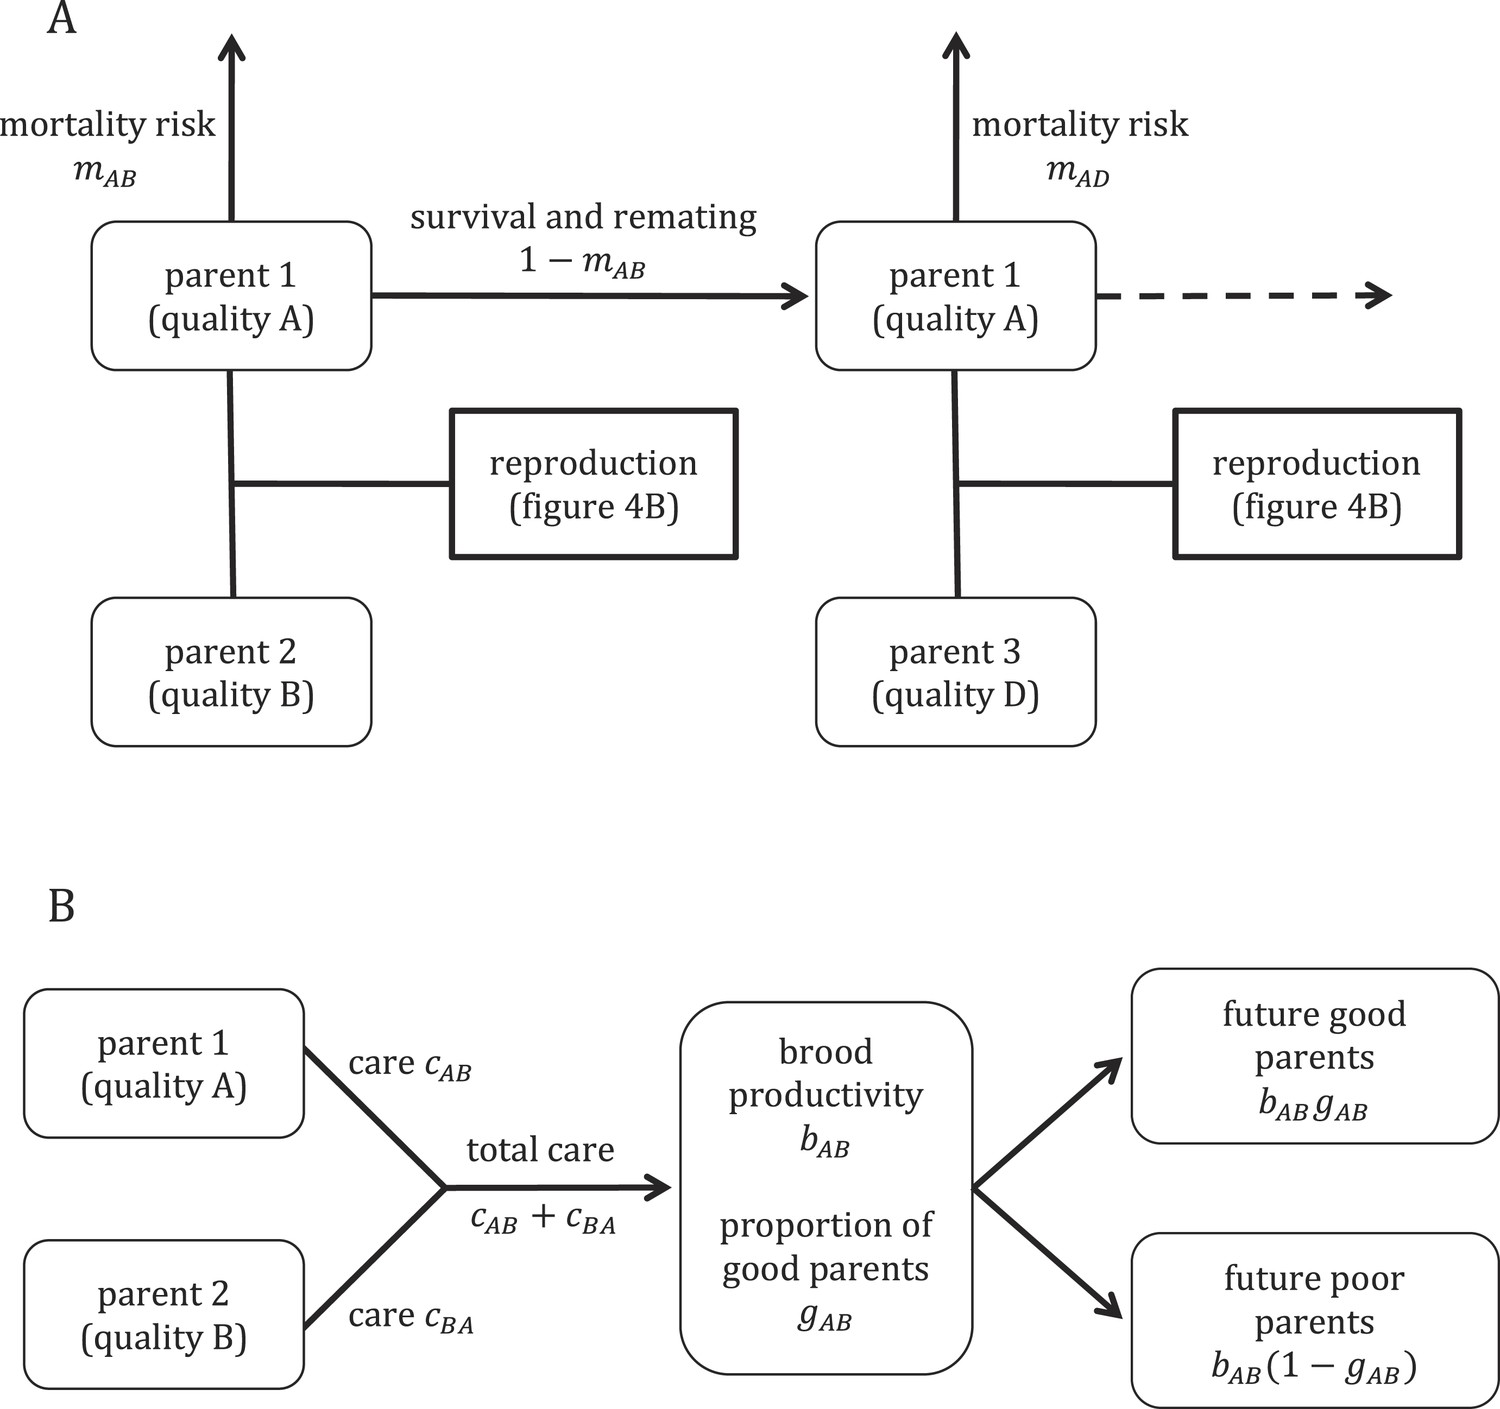
Overview of the model structure, including mortality and survival (A) and reproduction (B).
https://doi.org/10.7554/eLife.07340.003
Figure 1—figure supplement 1

Longevity of adult virgin males (n = 43) and females (n = 50) (A) shown as a cumulative survival plot and (B) comparing mean ± S.E.M lifespan for each sex.
The rate at which the beetles died was not significantly different, nor was there a difference in their mean lifespan (X2 = 0.69, d.f. = 1, p = 0.41). These data were collected from an experiment in which individuals were removed at eclosion from 13 different families at random, with each family contributing between 2 and 13 experimental subjects. The experimental subjects were weighed and kept under standard conditions (see ‘Materials and methods’) until they died. The population was censused twice a week. In the statistical analyses reported above, body mass at eclosion and sex were fixed terms and family of origin was a random term, using the R package coxme (see ‘Materials and methods’).
Figure 1—figure supplement 2
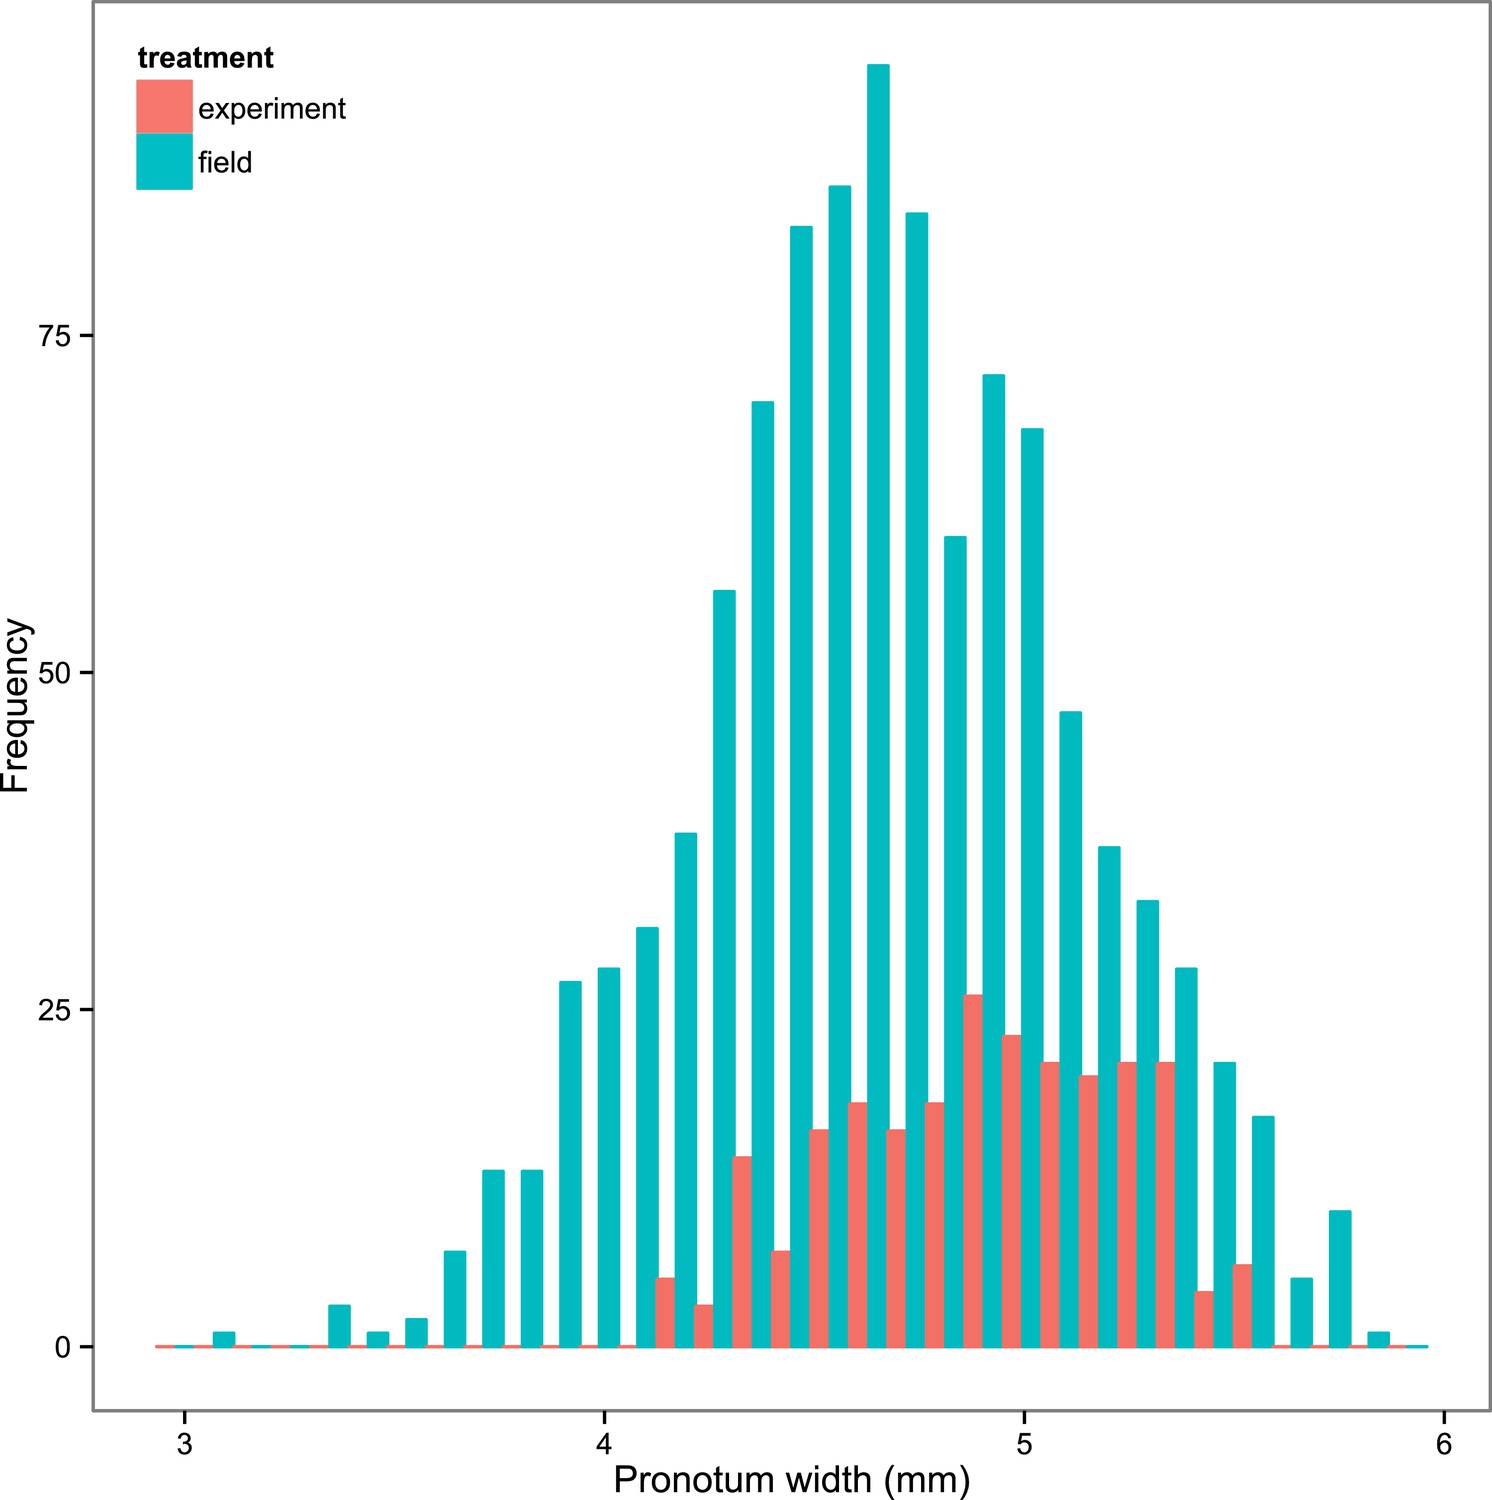
Frequency distribution of the size of field-caught N. vespilloides (shown in blue) and the experimental N. vespilloides described in this study (shown in red).
The size of the beetle is given by its pronotum width. There is no sexual size dimorphism, so the data for males and females have been pooled. Our experimental treatments generated beetles that were well within the range of size of beetles that occur naturally.
Figure 2
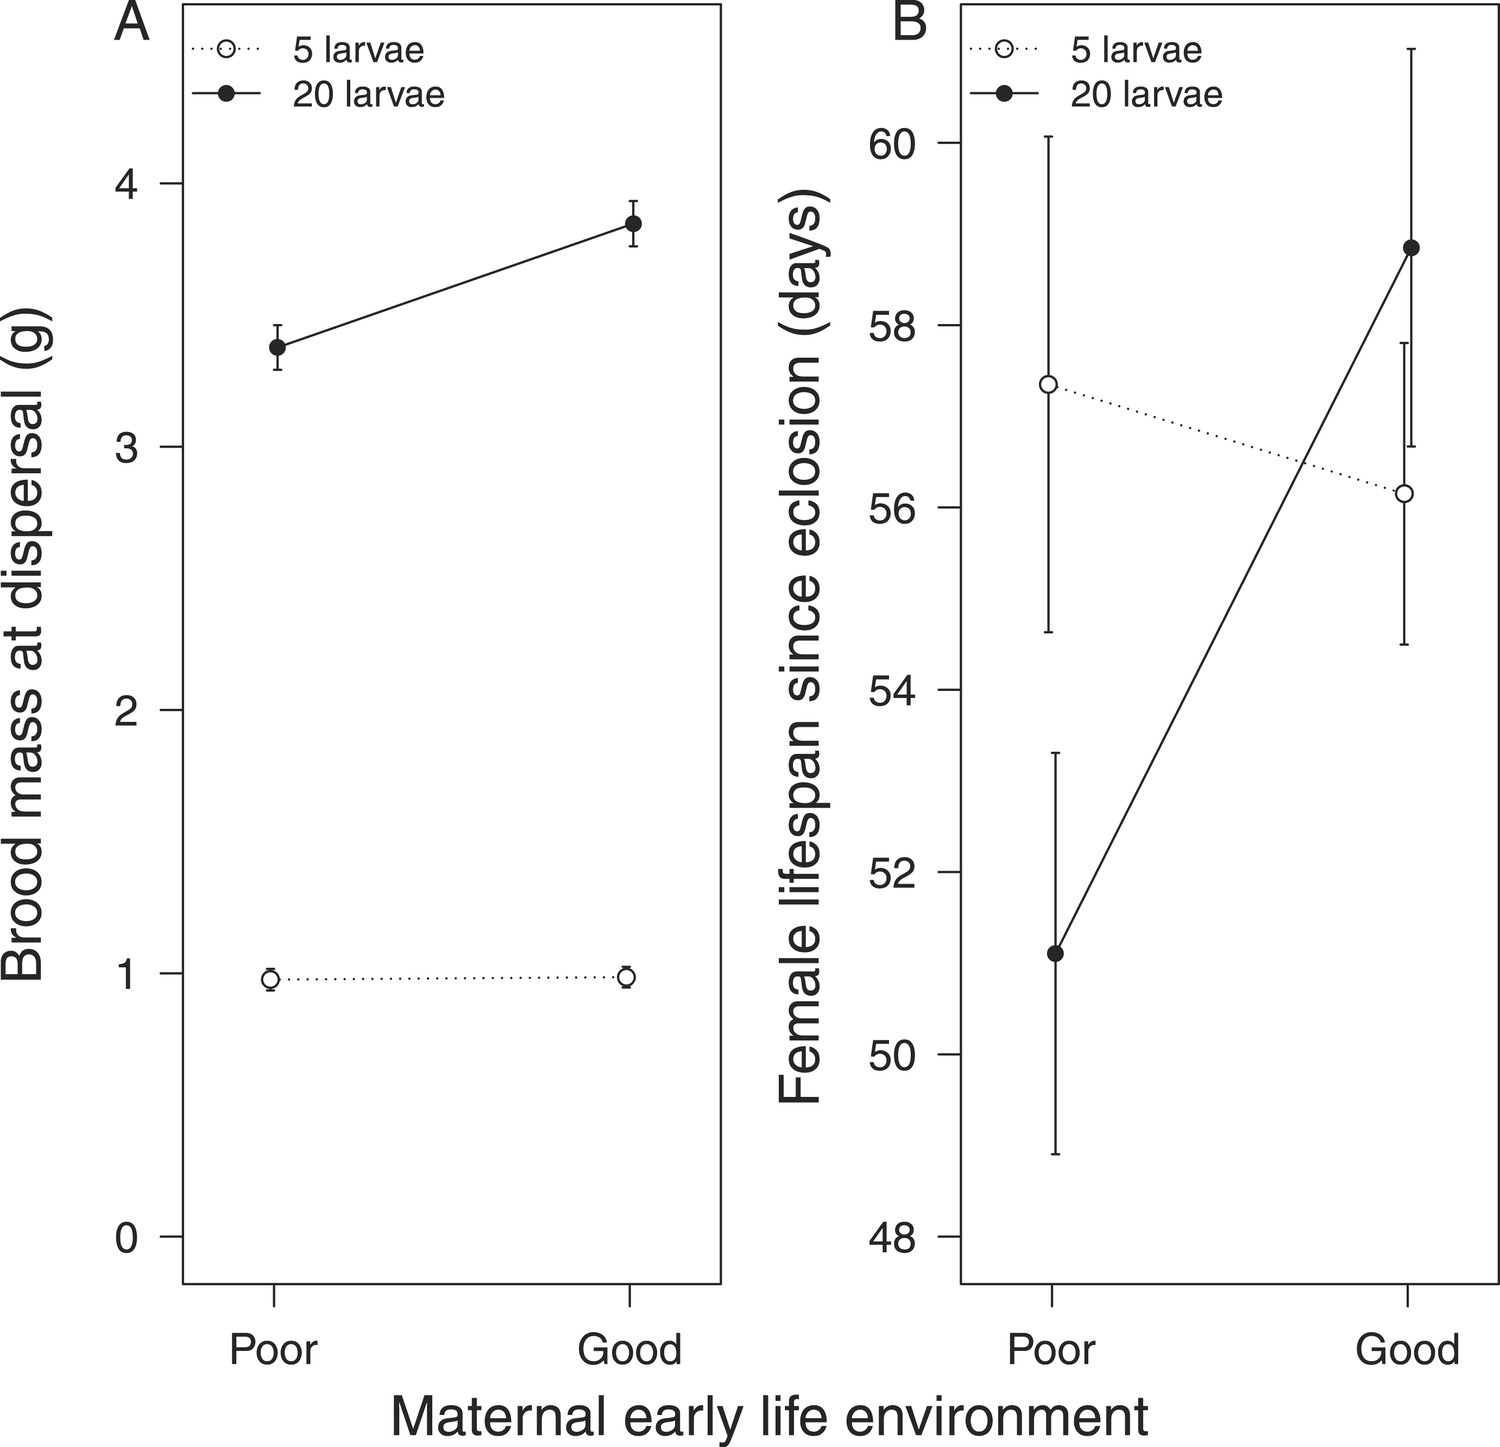
The effect of the mother's early-life environment on (A) brood mass at the dispersal stage of development and (B) her lifespan after reproduction.
Mothers raised cross-fostered broods of either 5 (white circles) or 20 larvae (black circles), singlehandedly. A poor quality environment in early life generates mothers that (A) are less effective at raising broods of 20 cross-fostered larvae and (B) exhibit lower subsequent survival than mothers raised in a good quality early-life environment. Mean values with standard error bars are shown.
Figure 3
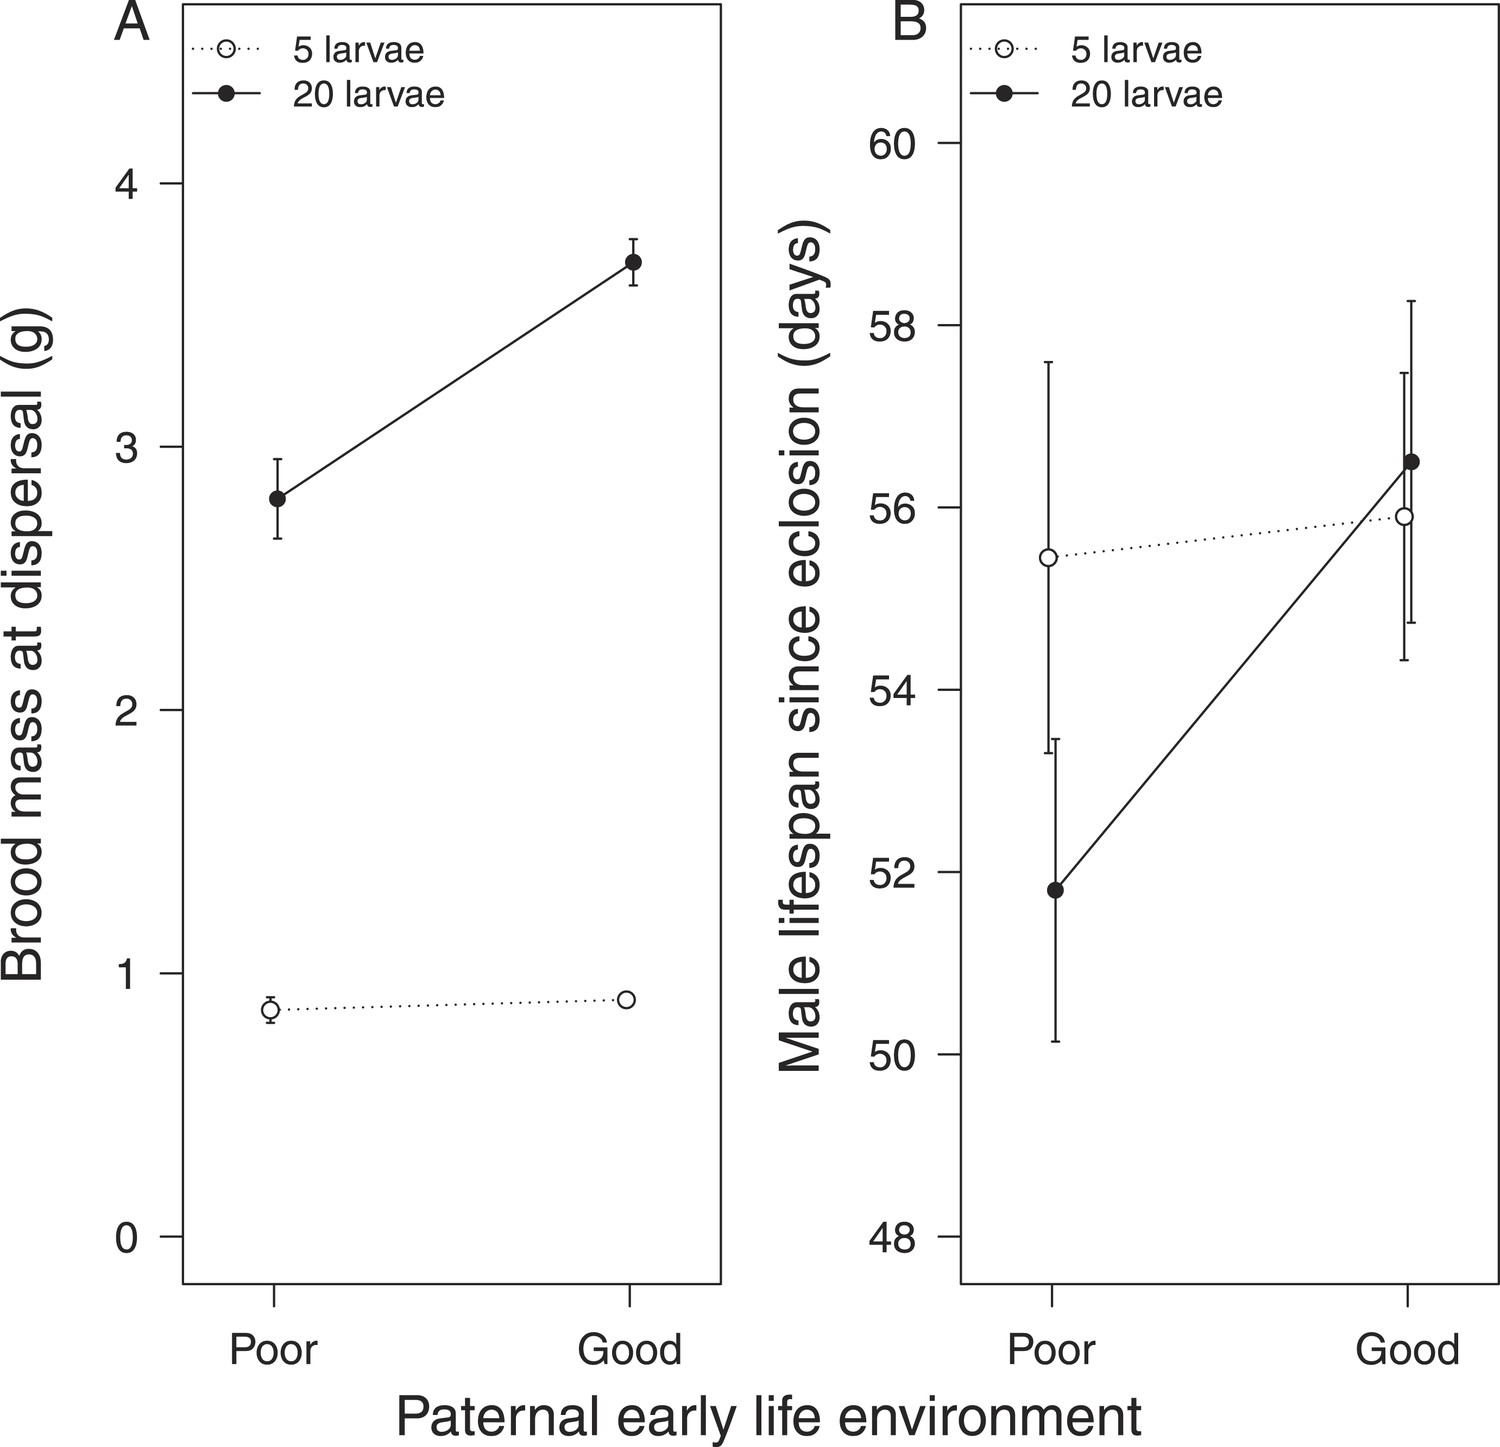
The effect of the father's early-life environment on (A) brood mass at the dispersal stage of development and (B) his lifespan after reproduction.
Fathers raised cross-fostered broods of either 5 (white circles) or 20 larvae (black circles), singlehandedly. A poor quality environment in early life generates fathers that (A) are less effective at raising broods of 20 cross-fostered larvae and (B) tend to exhibit lower subsequent survival than fathers raised in a good quality early-life environment. Mean values with standard error bars are shown.
Figure 4
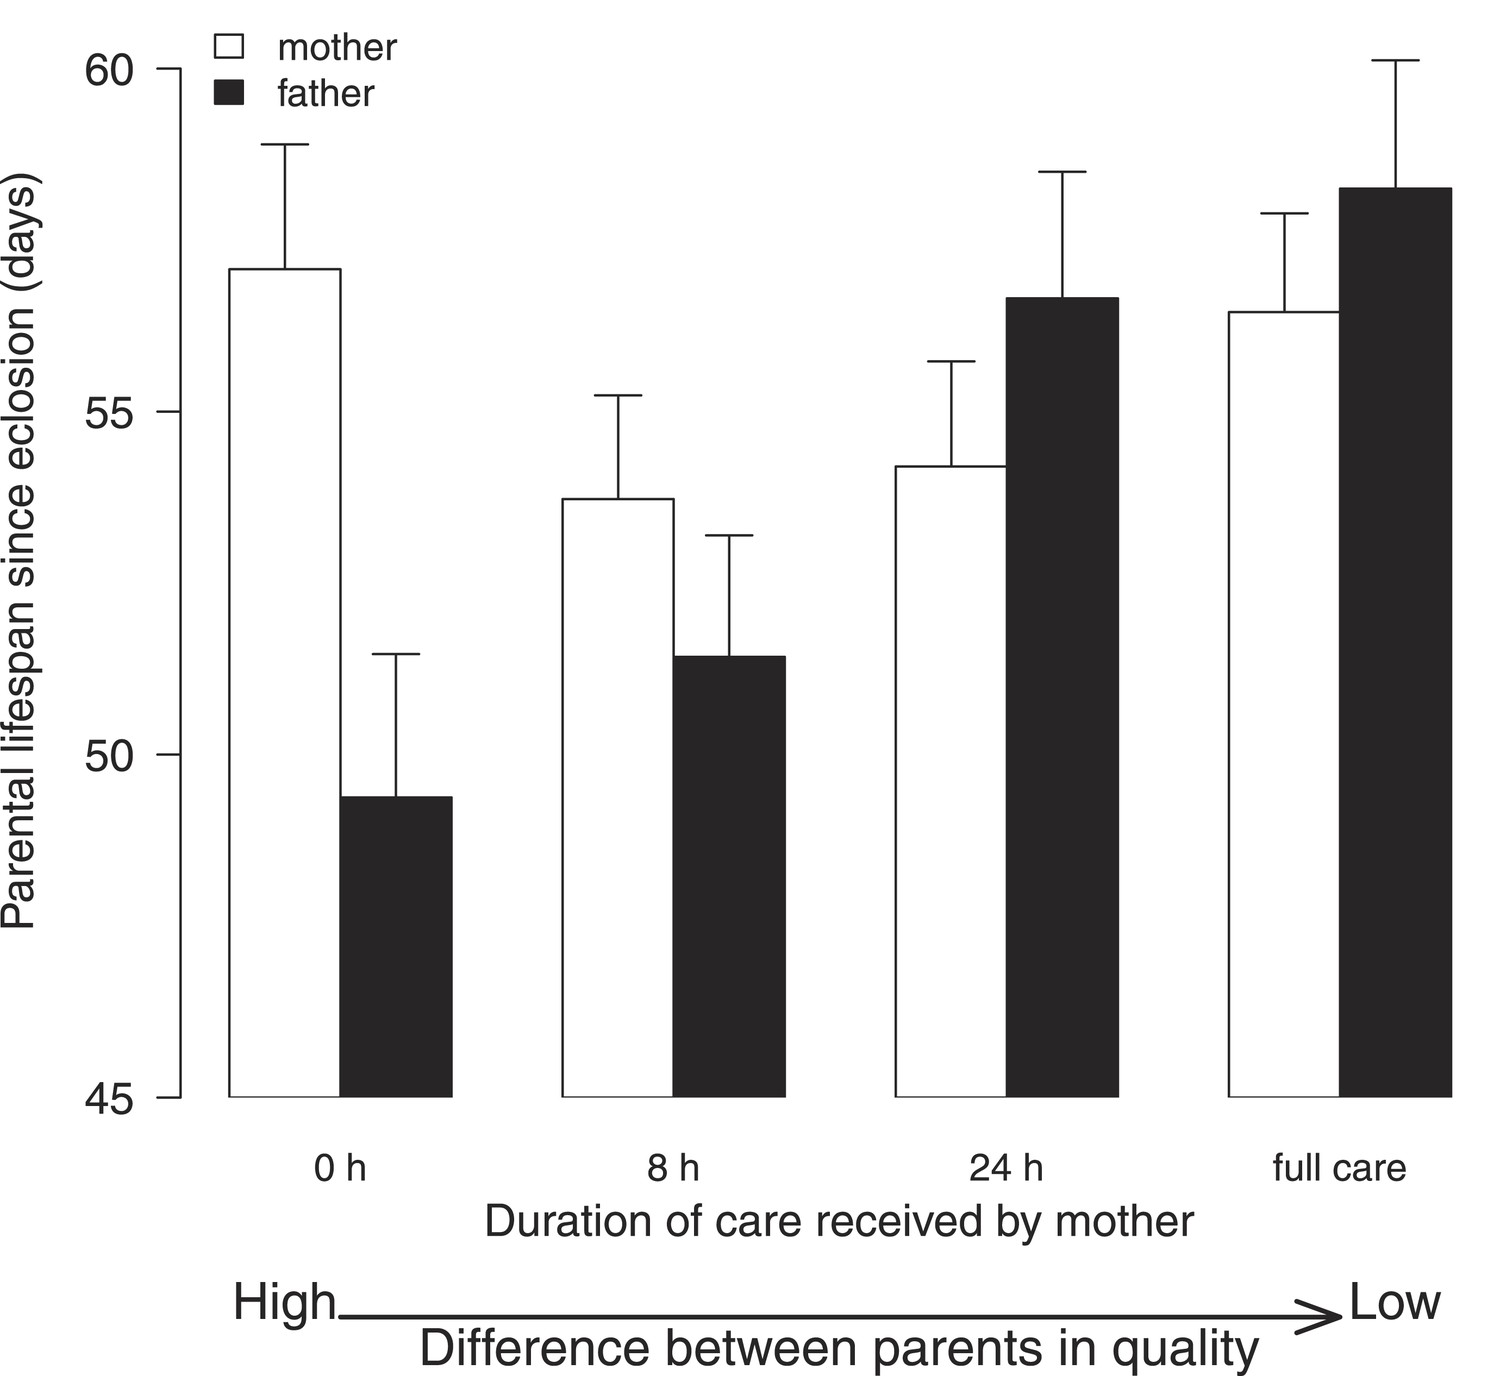
The effect of the female's early-life environment (i.e., the duration of care she received as a larva) on her lifespan after reproduction (white bars), and on the lifespan of the male with whom she raised offspring (black bars).
All males developed in a high-quality environment. The greater the difference within the pair in the environment they each experienced during development, the greater the difference in their subsequent lifespan. Low-quality mothers thus exploit high-quality fathers. Mean values with standard error bars are shown.
Figure 5
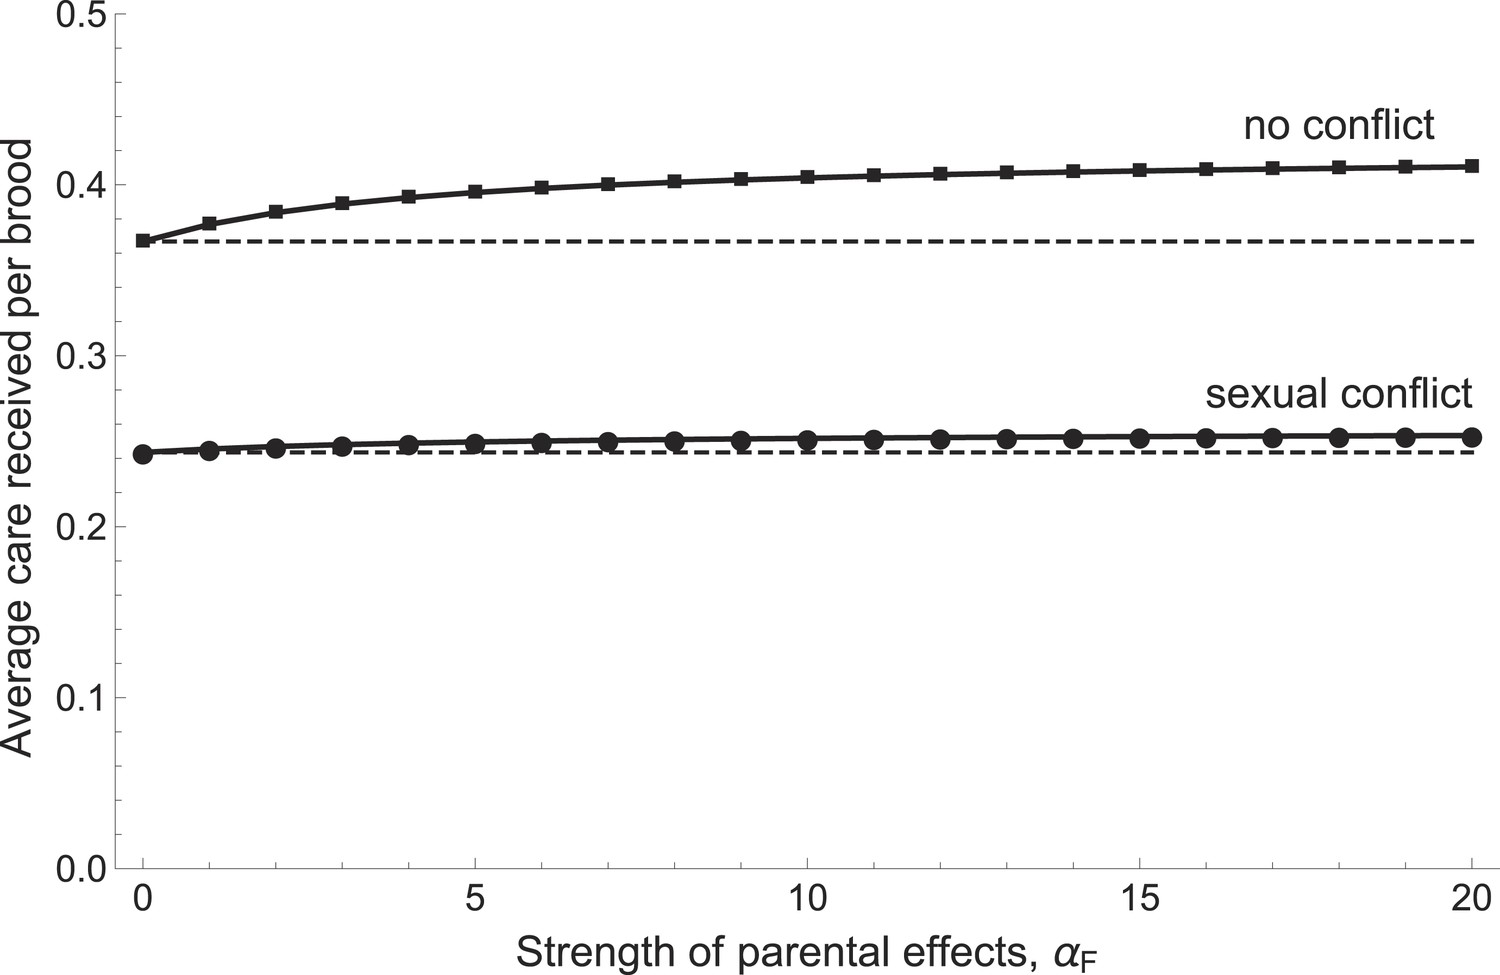
The relationship between the average care received by a brood and the strength of parental effects αF (i.e., the extent to which care received affects the future parental quality of offspring).
Average care levels increase with the strength of parental effects both when sexual conflict is present (circles) and when it is absent (squares). When there is no sexual conflict, parents provide more care in absolute terms and also increase their care more steeply with increasing parental effects. Shown with g1 = 0.5, bmin = fmin = 1, αB = 5, βG = 5, βP = 5, and mmin = 0.25 (see Appendix 1 for details of function shapes).
Tables
Table 1
Results from Experiment 1: the influence of parental effects on the costs and benefits of parental care provided in adult life
| Female-only care | ||||
|---|---|---|---|---|
| Estimate | Standard error | t value | p value | |
| a. Effect on brood mass (benefit of care) | ||||
| Intercept | 0.07294 | 0.70654 | 0.103 | – |
| Duration of care as larva | −0.01430 | 0.09597 | −0.149 | 0.010 |
| Brood size raised as adult | 2.41542 | 0.08689 | 27.797 | <0.0001 |
| Carcass mass | 0.01451 | 0.01609 | 0.902 | 0.345 |
| Female pronotum | 0.12663 | 0.12270 | 1.032 | 0.282 |
| Duration of care as larva x brood size raised as adult | 0.44623 | 0.12150 | 3.673 | 0.0004 |
| Coefficient | Standard error | z value | p value | |
|---|---|---|---|---|
| b. Effect on maternal survival (cost of care) | ||||
| Duration of care as larva | 0.359 | 0.342 | 1.05 | 0.290 |
| Brood size raised as adult | 0.853 | 0.354 | 2.41 | 0.016 |
| Carcass mass | 0.059 | 0.059 | 1.00 | 0.320 |
| Female pronotum | 0.135 | 0.453 | 0.30 | 0.770 |
| Duration of care as larva x brood size raised as adult | −1.286 | 0.507 | −2.54 | 0.011 |
| Male-only care | ||||
|---|---|---|---|---|
| Estimate | Standard error | t value | p value | |
| c. Effect on brood mass (benefit of care) | ||||
| Intercept | 0.60553 | 0.25415 | 2.383 | – |
| Duration of care as larva | 0.04445 | 0.04307 | 1.032 | 0.0002 |
| Brood size raised as adult | 0.75672 | 0.03818 | 19.820 | <0.0001 |
| Carcass mass | 0.01880 | 0.00572 | 3.287 | 0.001 |
| Male pronotum | −0.01450 | 0.04675 | −0.310 | 0.785 |
| Duration of care as larva x brood size raised as adult | 0.20190 | 0.05406 | 3.735 | 0.0002 |
| Coefficient | Standard error | z value | p value | |
|---|---|---|---|---|
| d. Effect on paternal survival (cost of care) | ||||
| Duration of care as larva | 0.183 | 0.352 | 0.52 | 0.600 |
| Brood size raised as adult | 0.686 | 0.334 | 2.05 | 0.040 |
| Carcass mass | 0.076 | 0.053 | 1.42 | 0.160 |
| Male pronotum | −0.448 | 0.385 | −0.12 | 0.910 |
| Duration of care as larva x brood size raised as adult | −0.856 | 0.474 | −1.81 | 0.071 |
-
Parental effects were created experimentally by exposing experimental subjects to either 0 hr or 24 hr of post-hatching care as larvae. They were then kept until adulthood and given broods of either 5 or 20 cross-fostered larvae to raise as a single parent. Their lifespan thereafter was recorded. Further details are given in the ‘Materials and methods’.
Table 2
Results from Experiment 2: the influence of parental effects on the outcome of a social interaction
| NB parental effect experienced by female | Coefficient | Standard error | z value | p value |
|---|---|---|---|---|
| a. Female lifespan | ||||
| Parental effect: 8 hr vs 0 hr | 0.427 | 0.228 | 1.88 | 0.061 |
| Parental effect: 24 hr vs 0 hr | 0.216 | 0.236 | 0.92 | 0.360 |
| Parental effect: 192 hr vs 0 hr | −0.073 | 0.254 | −0.29 | 0.770 |
| Total carcass mass | 0.017 | 0.016 | 1.06 | 0.290 |
| Total brood mass | 0.004 | 0.029 | 0.16 | 0.870 |
| Female pronotum | 0.522 | 0.322 | 1.62 | 0.110 |
| NB parental effect experienced by male's partner | Coefficient | Standard error | z value | p value |
|---|---|---|---|---|
| b. Male lifespan | ||||
| Parental effect: 8 hr vs 0 hr | −0.109 | 0.235 | −0.47 | 0.640 |
| Parental effect: 24 hr vs 0 hr | −0.664 | 0.252 | −2.63 | 0.008 |
| Parental effect: 192 hr vs 0 hr | −1.033 | 0.291 | −3.55 | 0.0003 |
| Total carcass mass | −0.027 | 0.023 | −1.17 | 0.240 |
| Total brood mass | −0.094 | 0.032 | −2.87 | 0.004 |
| Male pronotum | 0.915 | 0.366 | 2.50 | 0.012 |
| NB parental effect experienced by brood's mother | Estimate | Standard error | z value | p value |
|---|---|---|---|---|
| c. Brood size | ||||
| Intercept | 1.35776 | 0.39286 | 3.456 | 0.0005 |
| Parental effect: 8 hr vs 0 hr | 0.02350 | 0.03295 | 0.713 | 0.476 |
| Parental effect: 24 hr vs 0 hr | 0.16261 | 0.03453 | 4.710 | <0.0001 |
| Parental effect: 192 hr vs 0 hr | 0.14641 | 0.03676 | 3.983 | <0.0001 |
| Total carcass mass | 0.00765 | 0.00308 | 2.485 | 0.013 |
| Female pronotum | 0.31190 | 0.05133 | 6.076 | <0.0001 |
| Male pronotum | 0.12973 | 0.05729 | 2.265 | 0.024 |
-
Parental effects were created experimentally by exposing females to 0 hr, 8 hr, 24 hr, or 192 hr of post-hatching care as larvae. They were then kept until adulthood and allowed to breed twice with a male who had received 192 hr of care as larva. The two parents raised offspring together. Each parent's lifespan thereafter was recorded, as was the mass of their brood at dispersal. Further details are given in the ‘Materials methods’.
Download links
A two-part list of links to download the article, or parts of the article, in various formats.
Downloads (link to download the article as PDF)
Open citations (links to open the citations from this article in various online reference manager services)
Cite this article (links to download the citations from this article in formats compatible with various reference manager tools)
Parental effects alter the adaptive value of an adult behavioural trait
eLife 4:e07340.
https://doi.org/10.7554/eLife.07340


