Stem cells and fluid flow drive cyst formation in an invertebrate excretory organ
- Stowers Institute for Medical Research, United States
- University of Utah, United States
- Max Planck Institute of Molecular Cell Biology and Genetics, Germany
- Howard Hughes Medical Institute, Stowers Institute for Medical Research, United States
Figures
Figure 1
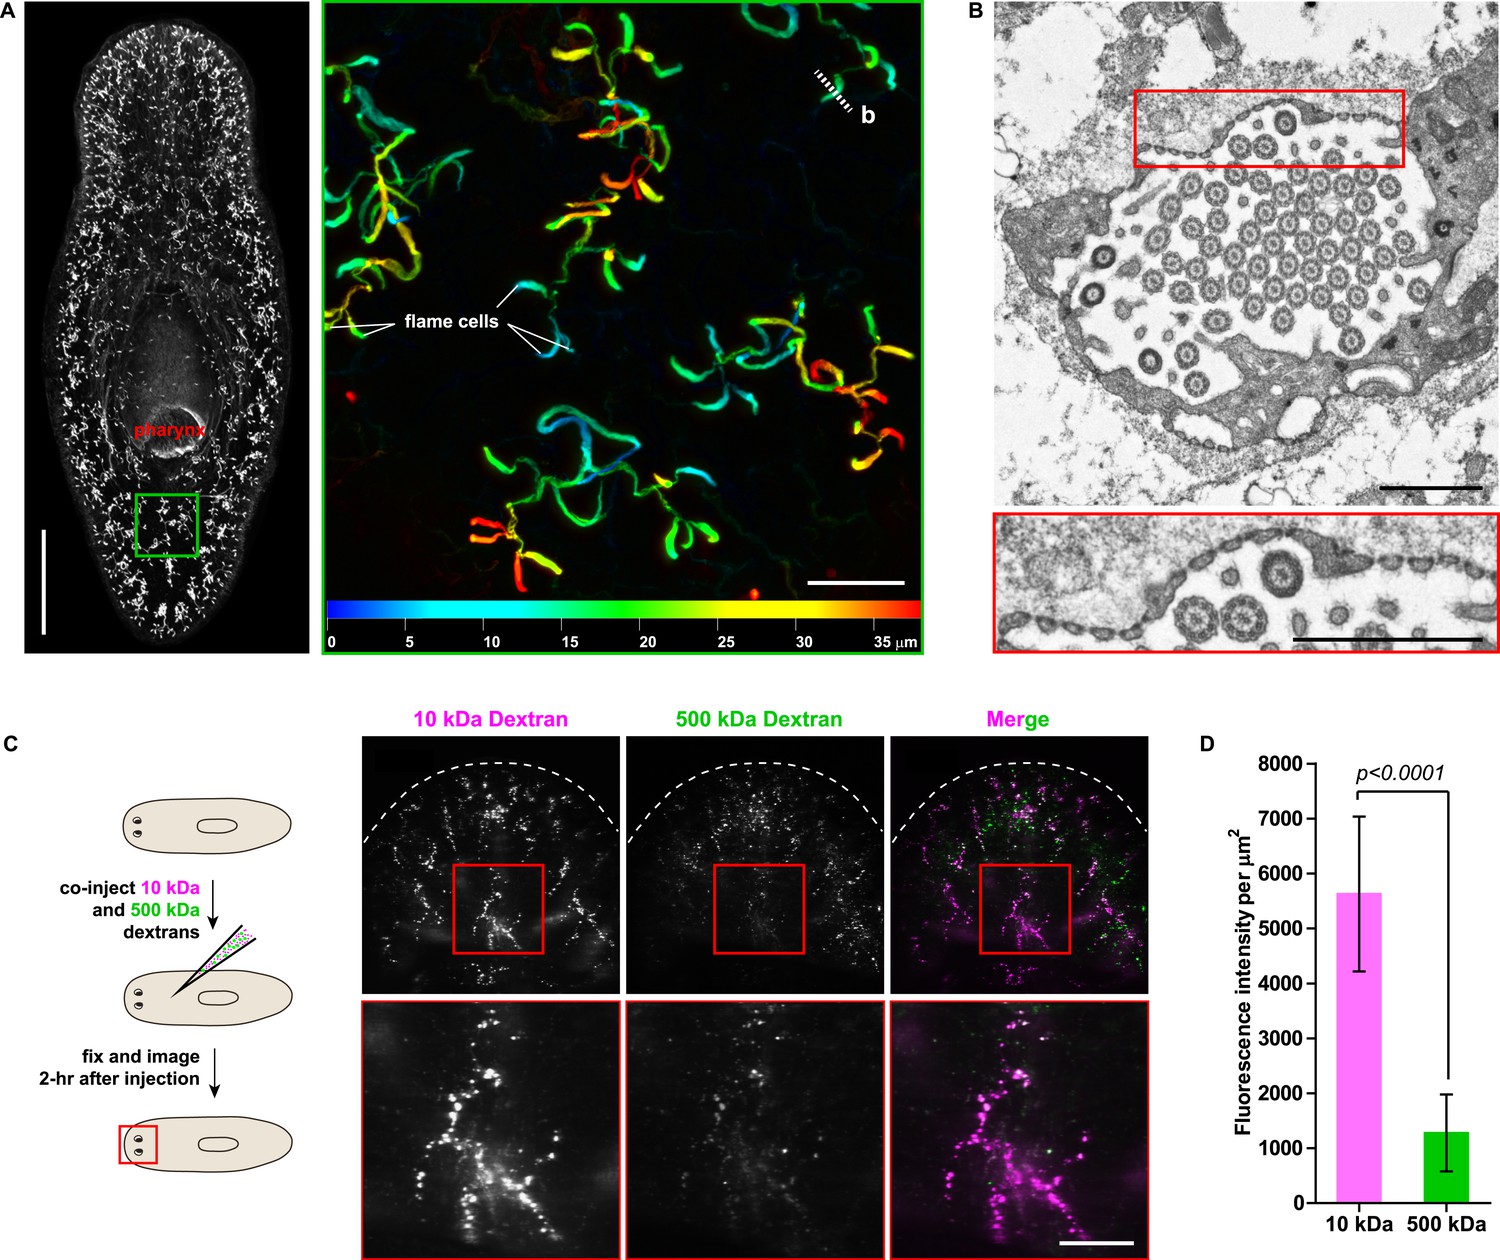
Protonephridia are ultrafiltration devices in planarians.
(A) Whole-mount acetylated tubulin (AcTub) staining. Scale bars: 500 μm. Inset shows depth-coded projection of AcTub staining. Superficial structures are in blue and deeper structures are in red. Scale bars: 50 μm. (B) Cross-section through a flame cell. Inset shows a high magnification of filtration diaphragm. Scale bar: 1 μm. (C, D) Ultrafiltration assay assessing ultrafiltration capacity in the planarian protonephridia. (C) Fluorescent overlay showing dextran uptake in the animals that co-injected with 10 kDa and 500 kDa fluorescently labeled dextran. Inset showing a high magnification of tubule structure labeled by dextran. Scale bar: 100 μm. (D) Quantification of small and large dextran uptake.
Figure 2 with 20 supplements

Unexpected complexity of protonephridial tubules is revealed by systematic gene expression mapping of slc genes along the protonephridial tubules.
(A) Cartoon shows previous segmentation model of the protonephridial tubule and expression map of slc genes along the protonephridial tubule. (B–G) Representative images show expression domains of selected slc genes in (B) PT1, PT2 and PT3, (C) PT2 and PT3, (D) PT3, (E) DT1, DT2 and CD, (F) DT2 and CD and (G) CD. Fluorescent overlay of the indicated gene (red) with PT marker (AcTub) and distal tubule (DT) marker (CAVII-1). A color-coded scheme of the protonephridial tubule at the end of each panel represents the expression domain of the indicated gene. Images are maximum projections of confocal Z-sections. Scale bars: 50 μm. (H) Longitudinal-section through a worm shows a dorsal-bias expression of slc12a-1. Fluorescent overlay of slc12a-1 with DT marker (CAVII-1) and streptavidin (which labels the basement membrane of several planarian epithelial structures, including the outer epithelium). Inset shows a magnification of CD, visualized by slc12a-1, crossing the basement membrane of the dorsal epithelia. Yellow arrowhead, exterior opening of the CD. Scale bars: 200 μm. (I) TEM image shows CD connected to the dorsal epithelia. Inset shows a magnification of CD connected to the dorsal epithelia. e, epithelia; bm, basement membrane; m, mesenchyme; sj, septate junction; l, lumen; ms, muscle. Scale bars: 5 μm.
Figure 2—figure supplement 1
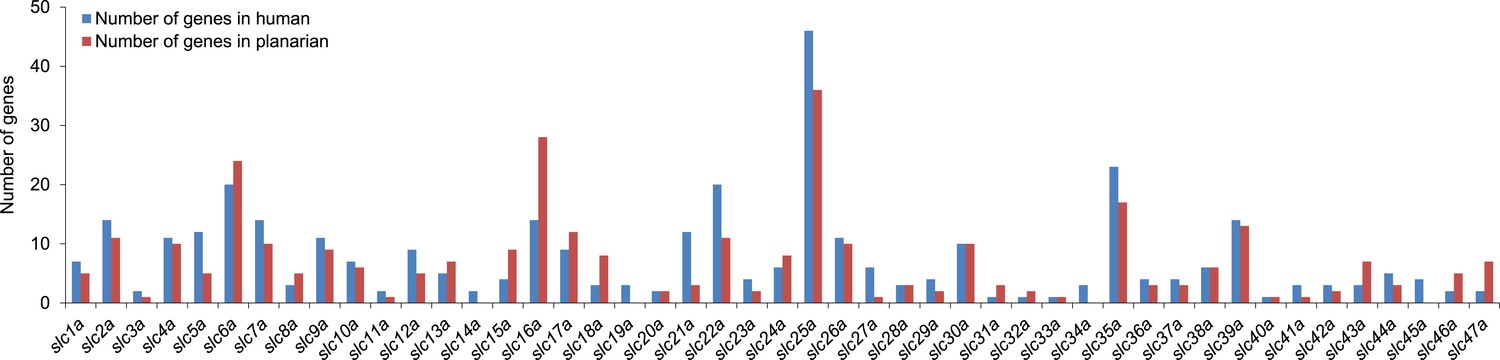
Solute carrier gene families in the planarian Schmidtea mediterranea.
https://doi.org/10.7554/eLife.07405.005
Figure 2—figure supplement 2

Schematic representation of phylogenetic clusters of γ- (A), δ- (B) groups of slcs and the Tim barrel- (C), IT- (D), Drug/Metabolite (E) transporter clans of slcs.
Planarian homologs are colored in red.
Figure 2—figure supplement 3
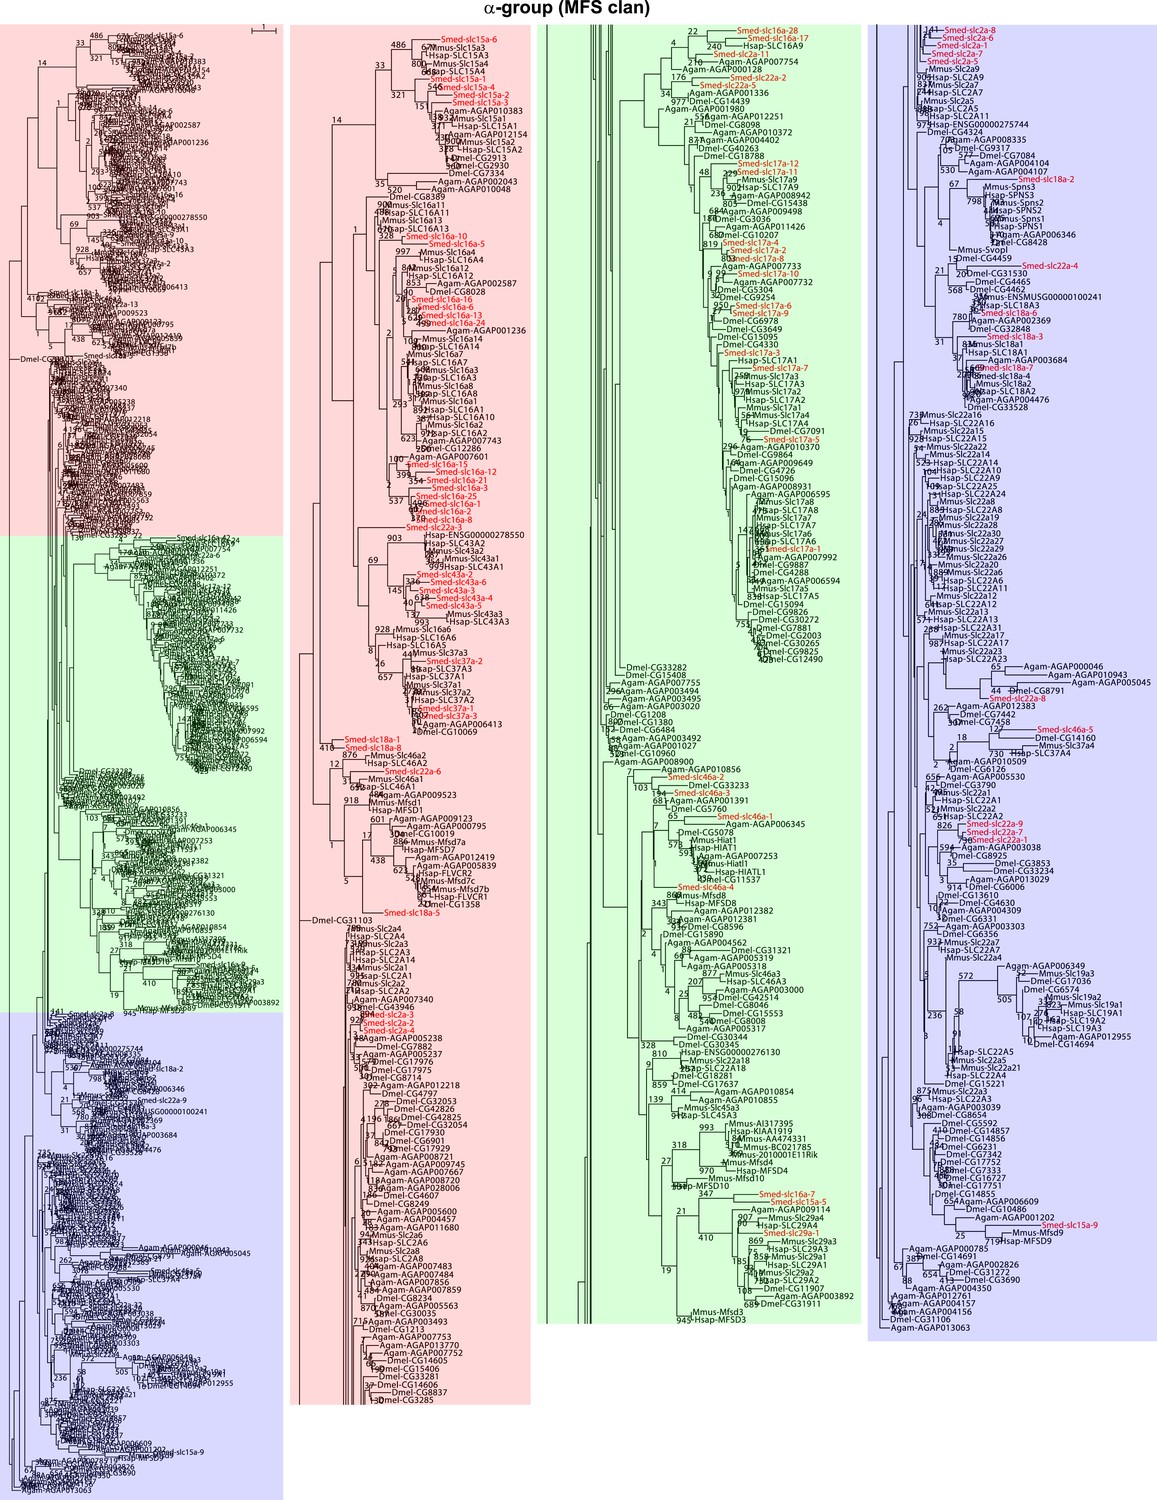
Schematic representation of phylogenetic clusters of α-groups of slcs.
Planarian homologs are colored in red.
Figure 2—figure supplement 4

Schematic representation of phylogenetic clusters of β-groups of slcs.
Planarian homologs are colored in red.
Figure 2—figure supplement 5
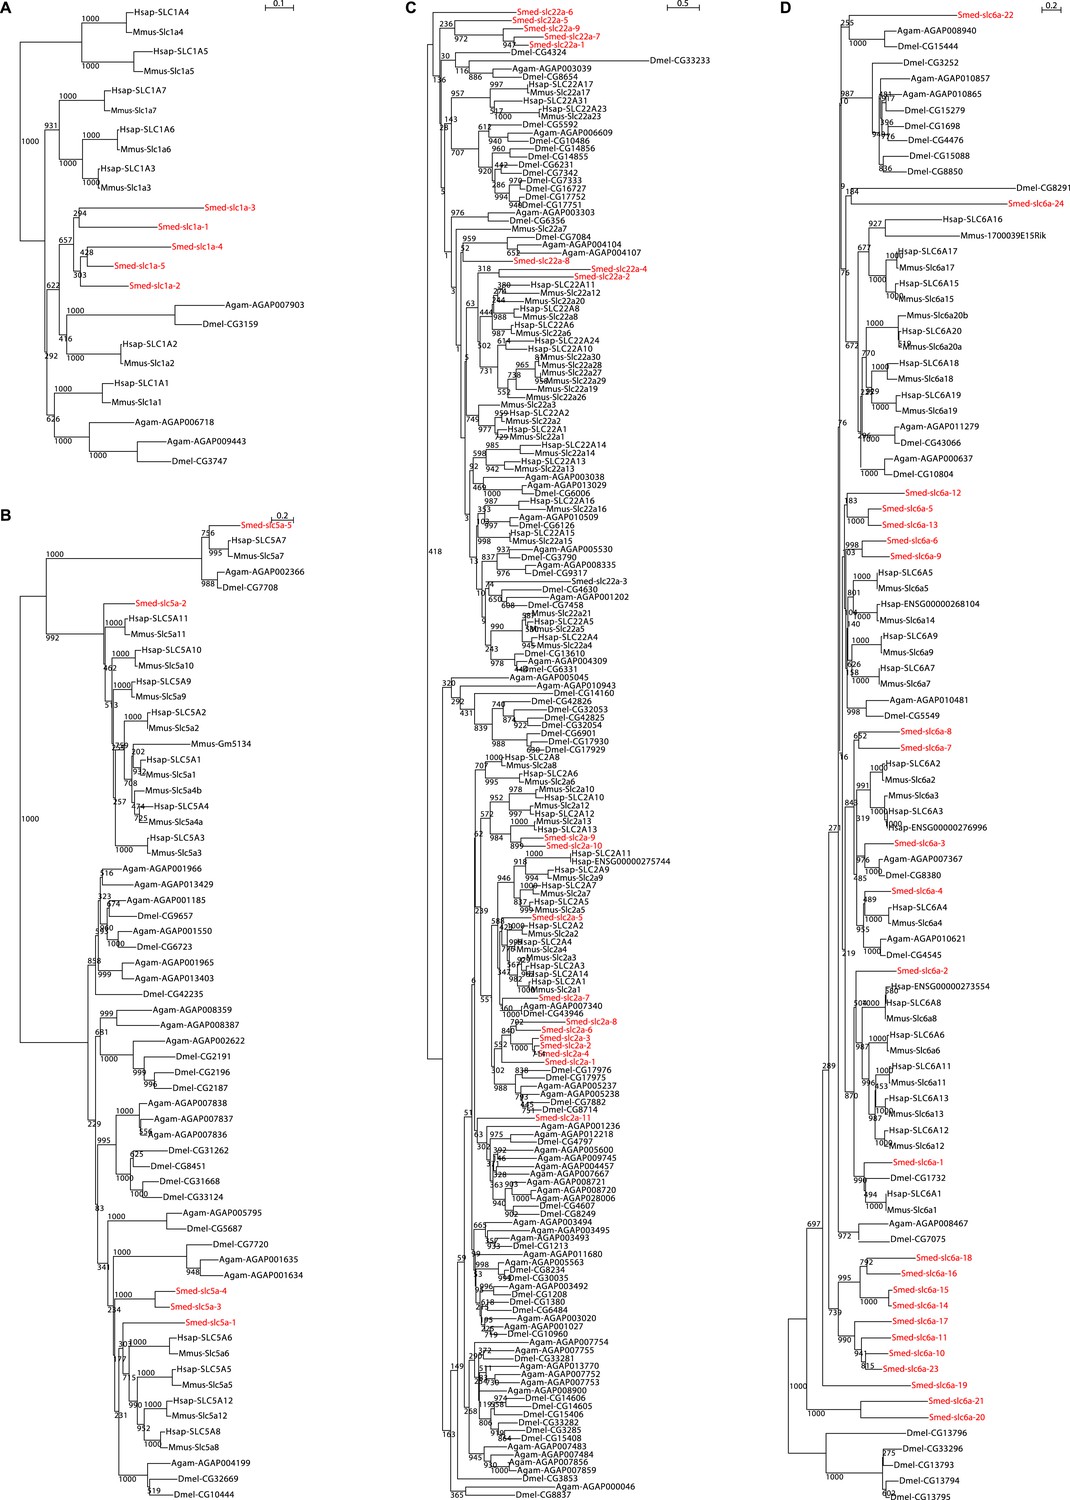
Schematic representation of phylogenetic clusters of Smed-slc1a (A), Smed-slc5a (B), Smed-slc22a (C), Smed-slc6a (D).
Planarian homologs are colored in red.
Figure 2—figure supplement 6

Schematic representation of phylogenetic clusters of Smed-slc4a (A), Smed-slc7a (B), Smed-slc12 (C), Smed-slc15 (D), Smed-slc20 (E), Smed-slc23 (F), Smed-slc26 (G).
Planarian homologs are colored in red.
Figure 2—figure supplement 7
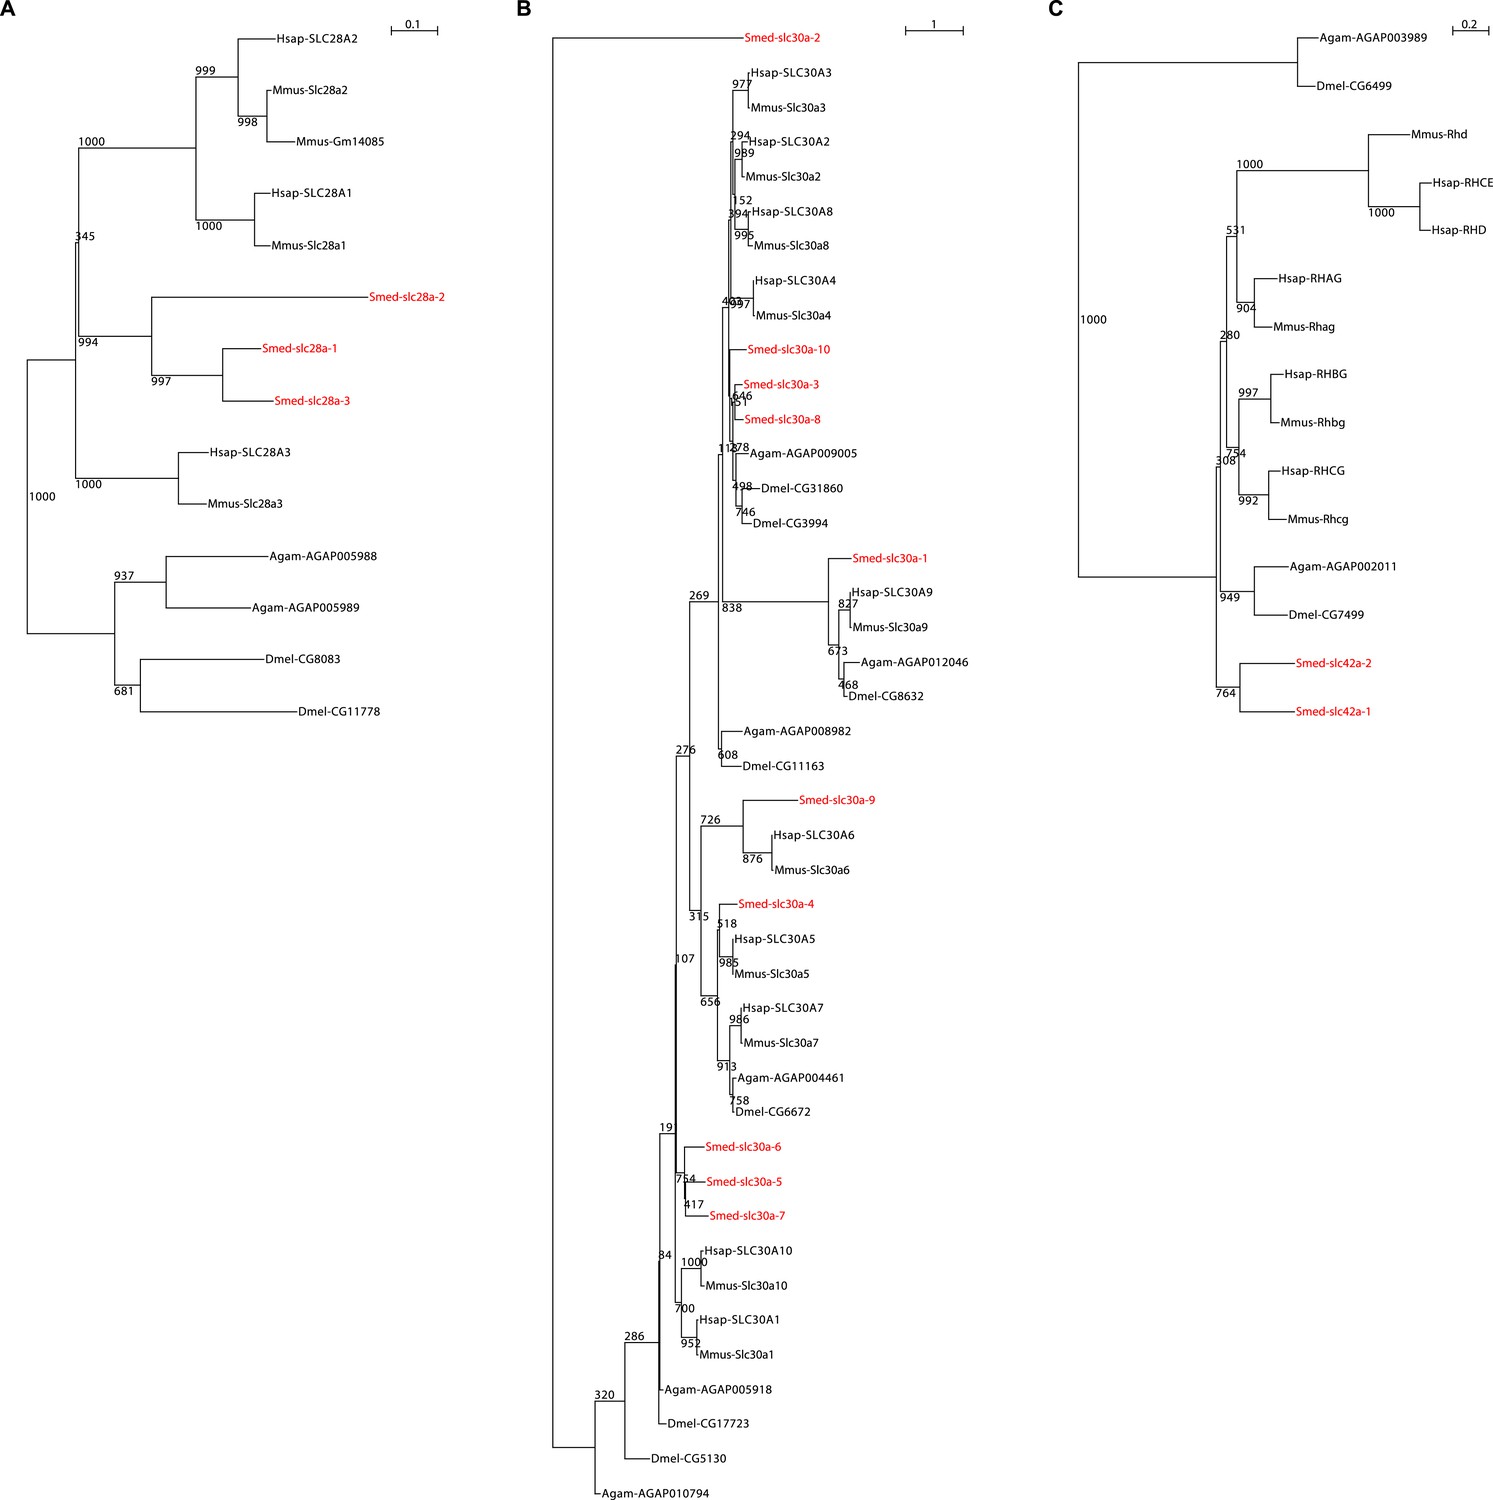
Schematic representation of phylogenetic clusters of Smed-slc28 (A), Smed-slc30 (B), and Smed-slc42 (C).
Planarian homologs are colored in red.
Figure 2—figure supplement 8
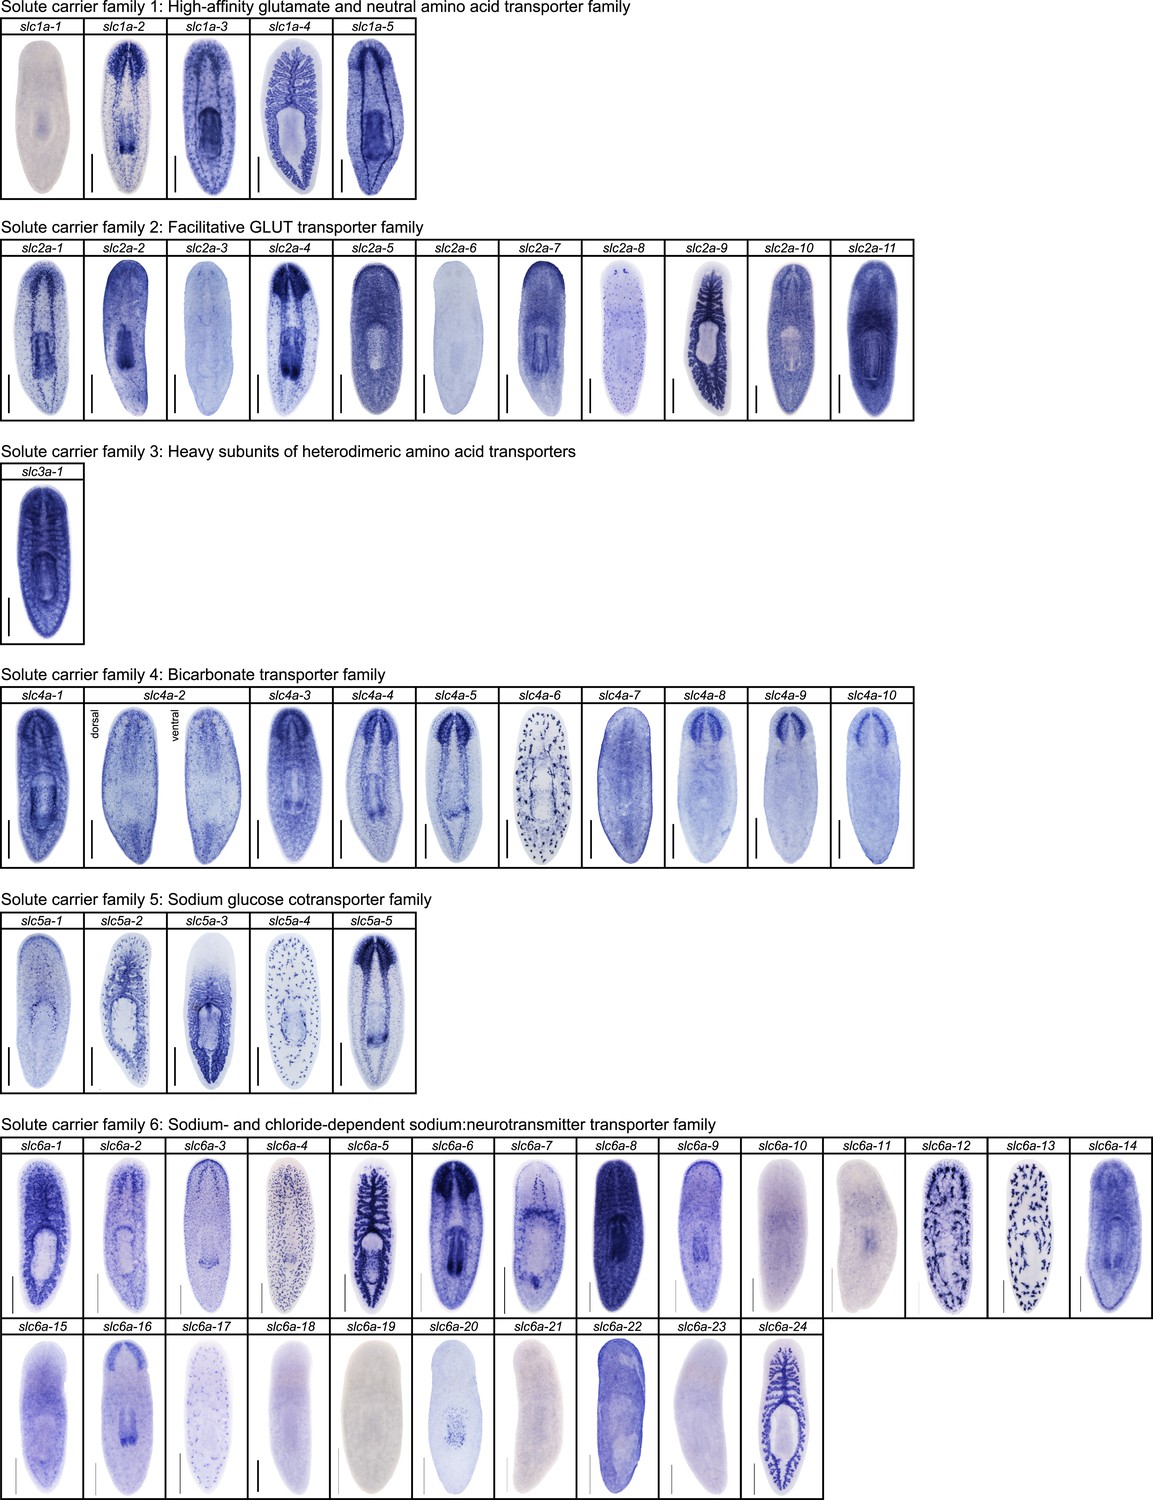
Expression patterns of slc genes that belong to solute carrier families 1–6 in an asexual strain of the planarian S. mediterranea.
Whole-mount expression patterns of slc genes by in situ hybridization (NBT/BCIP development). Scale bars: 500 μm.
Figure 2—figure supplement 9

Expression patterns of slc genes that belong to solute carrier families 7–15 in an asexual strain of the planarian S. mediterranea.
Whole-mount expression patterns of slc genes by in situ hybridization (NBT/BCIP development). Scale bars: 500 μm.
Figure 2—figure supplement 10
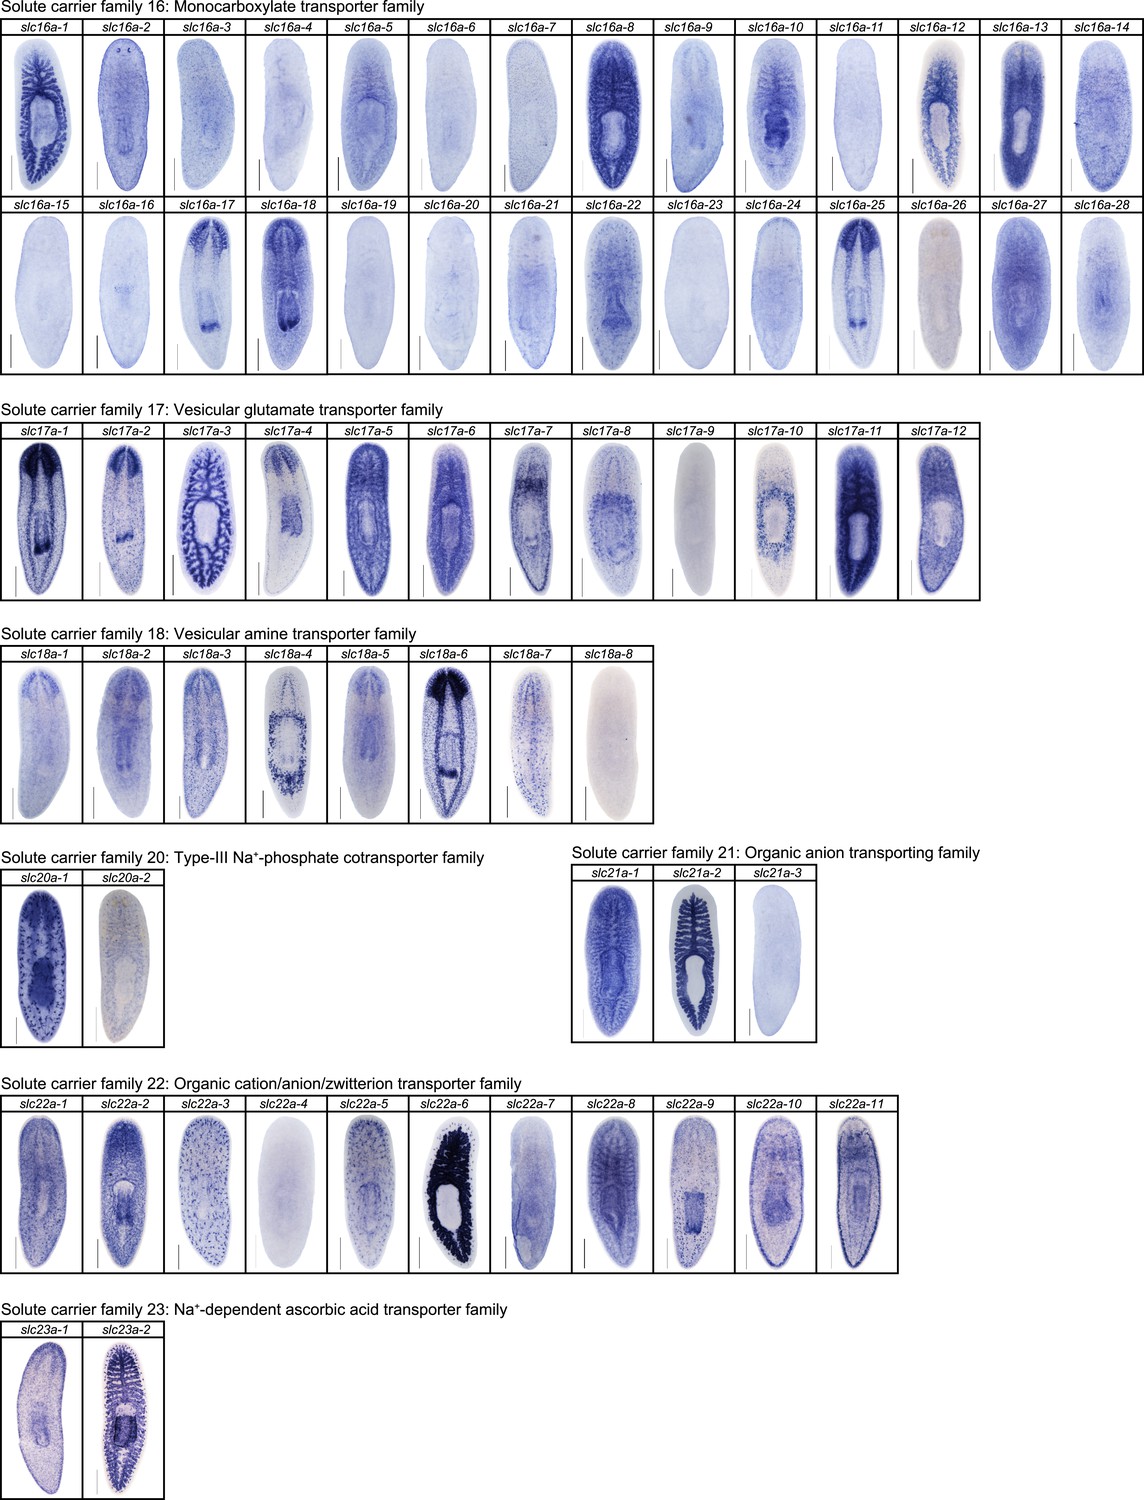
Expression patterns of slc genes that belong to solute carrier families 16–23 in an asexual strain of the planarian S. mediterranea.
Whole-mount expression patterns of slc genes by in situ hybridization (NBT/BCIP development). Scale bars: 500 μm.
Figure 2—figure supplement 11
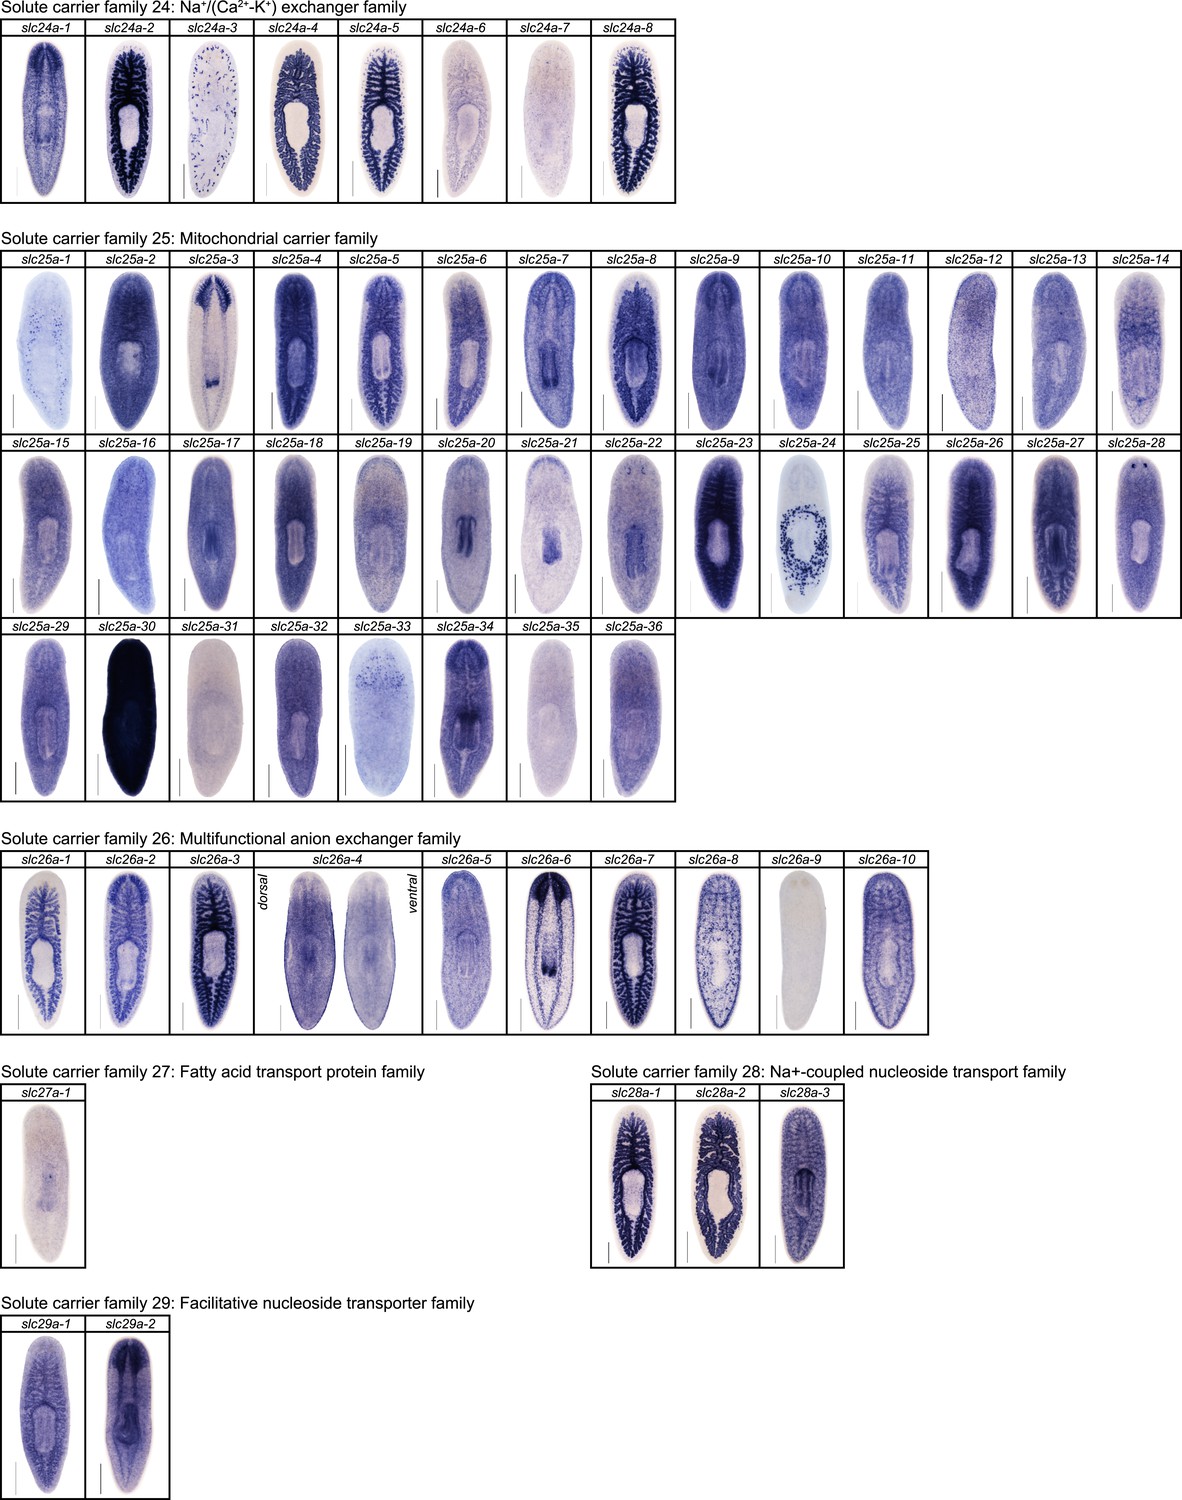
Expression patterns of slc genes that belong to solute carrier families 24–29 in an asexual strain of the planarian S. mediterranea.
Whole-mount expression patterns of slc genes by in situ hybridization (NBT/BCIP development). Scale bars: 500 μm.
Figure 2—figure supplement 12
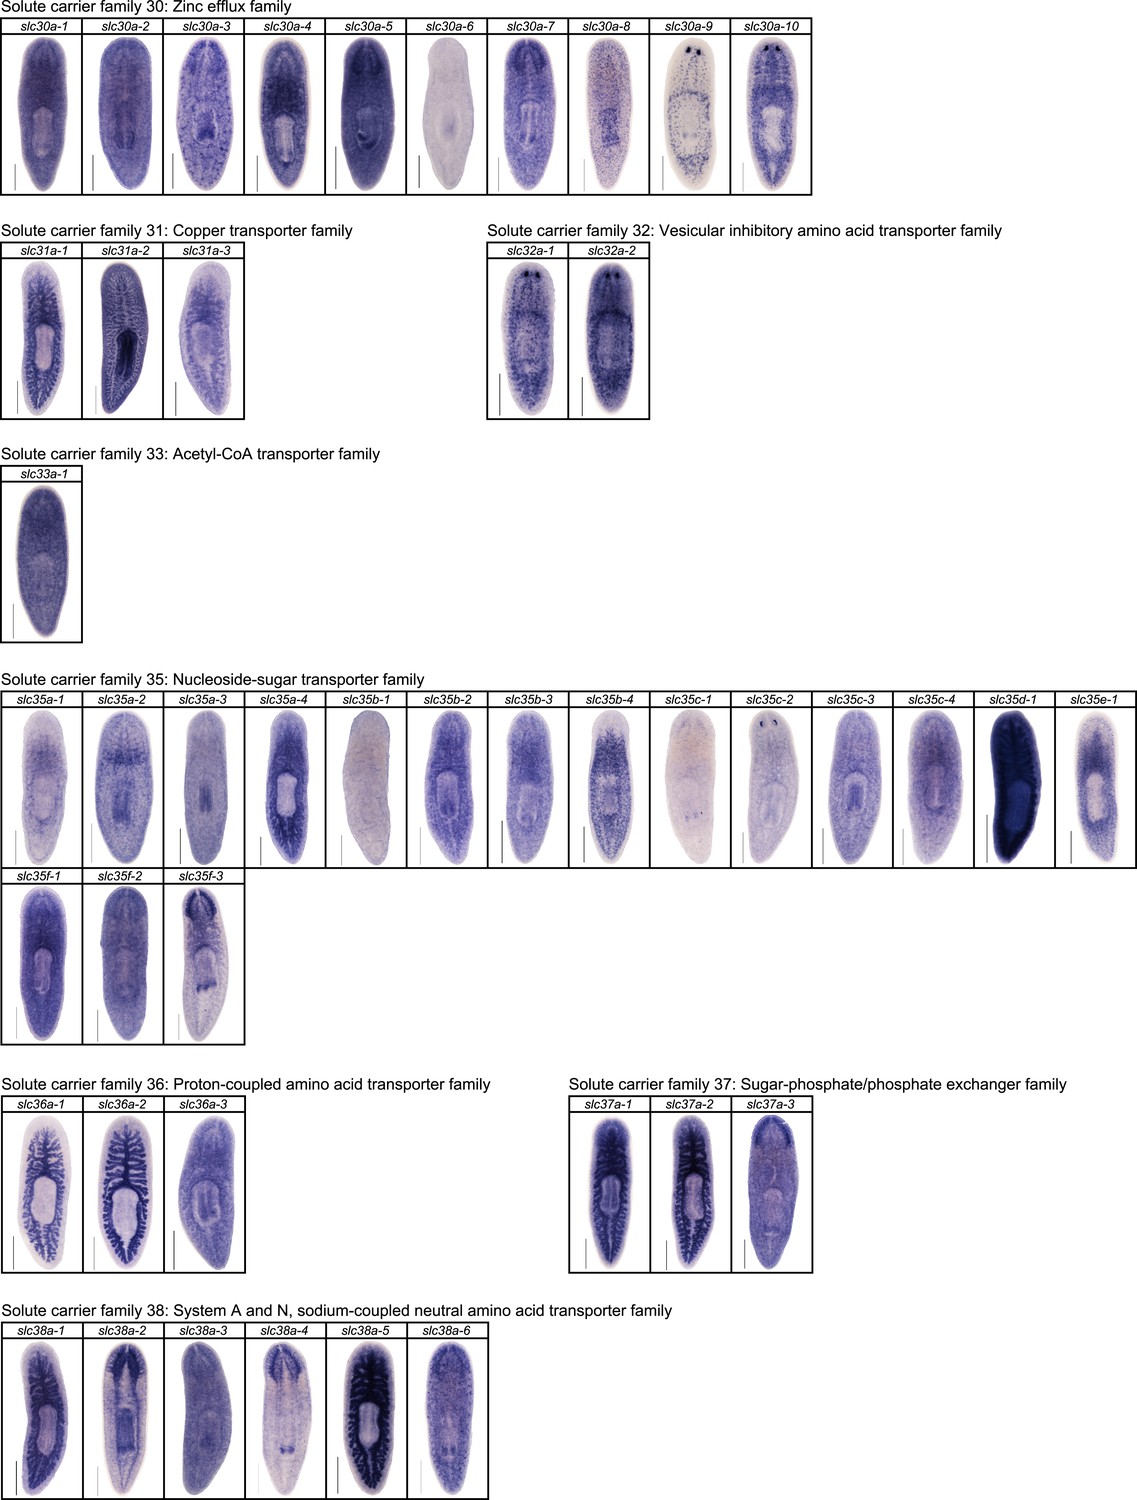
Expression patterns of slc genes that belong to solute carrier families 30–38 in an asexual strain of the planarian S. mediterranea.
Whole-mount expression patterns of slc genes by in situ hybridization (NBT/BCIP development). Scale bars: 500 μm.
Figure 2—figure supplement 13
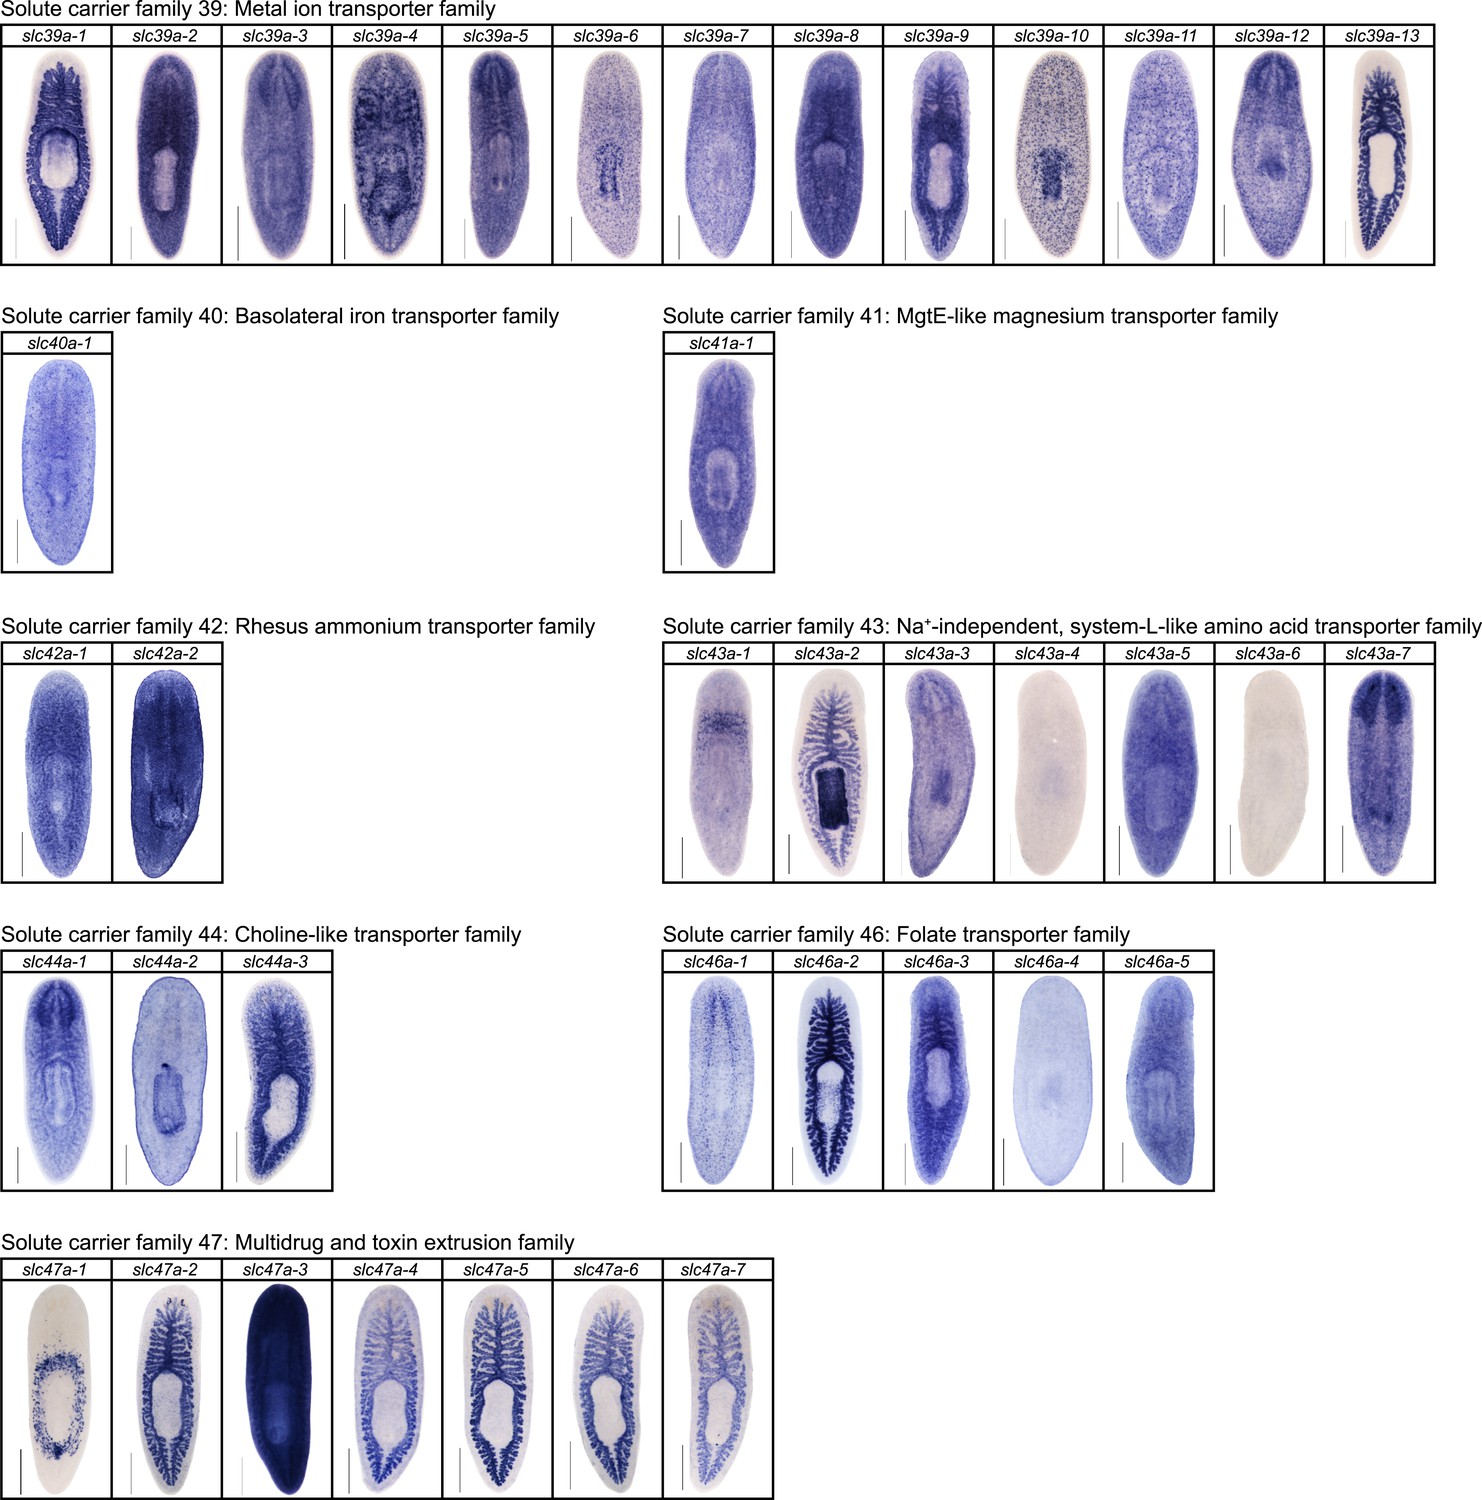
Expression patterns of slc genes that belong to solute carrier families 40–47 in an asexual strain of the planarian S. mediterranea.
Whole-mount expression patterns of slc genes by in situ hybridization (NBT/BCIP development). Scale bars: 500 μm.
Figure 2—figure supplement 14
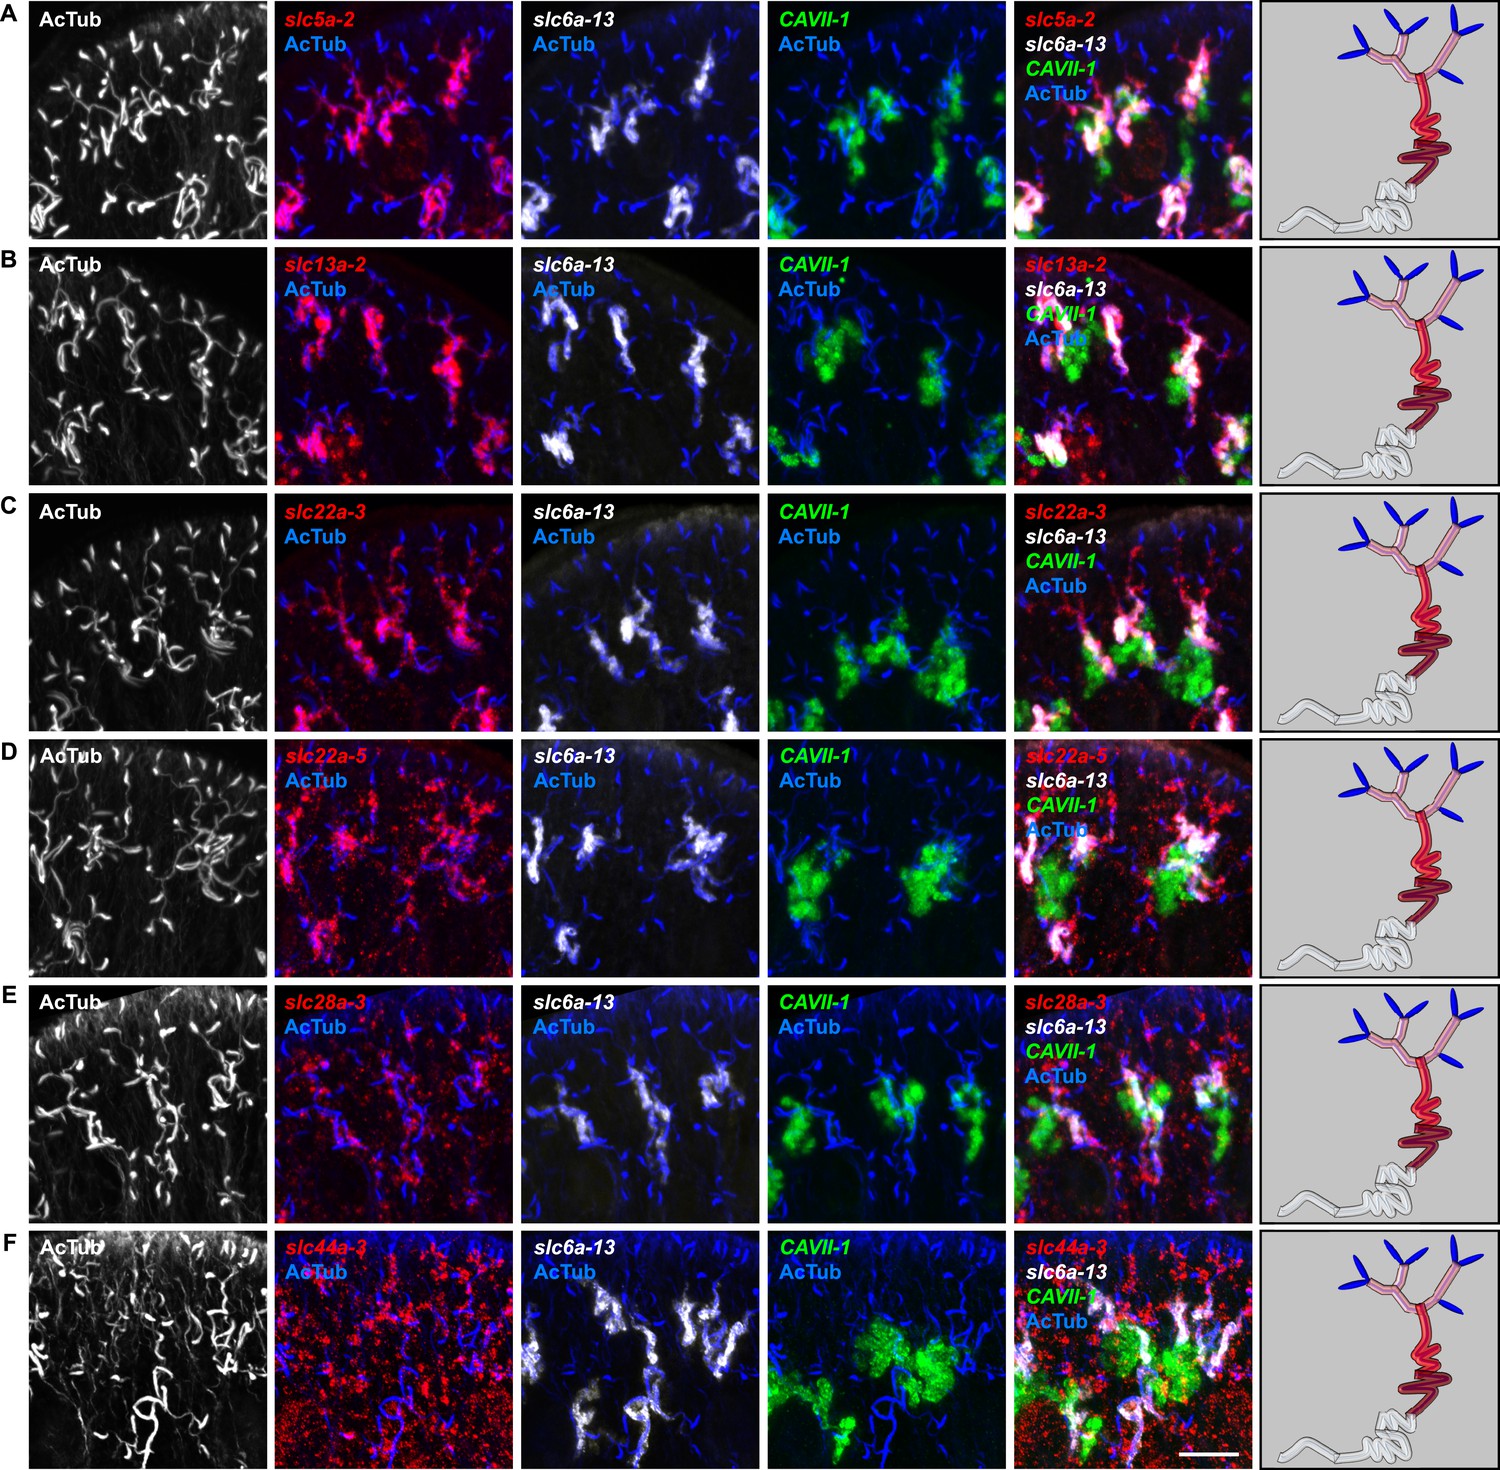
Expression of slc genes in the PT.
Fluorescent overlay of indicated gene (in red) (A-F) with PT2 and PT3 marker (slc6a-13), DT marker (CAVII-1) and AcTub staining. Images are maximum projections of confocal Z-sections. Scale bars: 50 μm. A color-coded scheme of protonephridial tubule at the end of each panel represents the expression domain of the indicated gene.
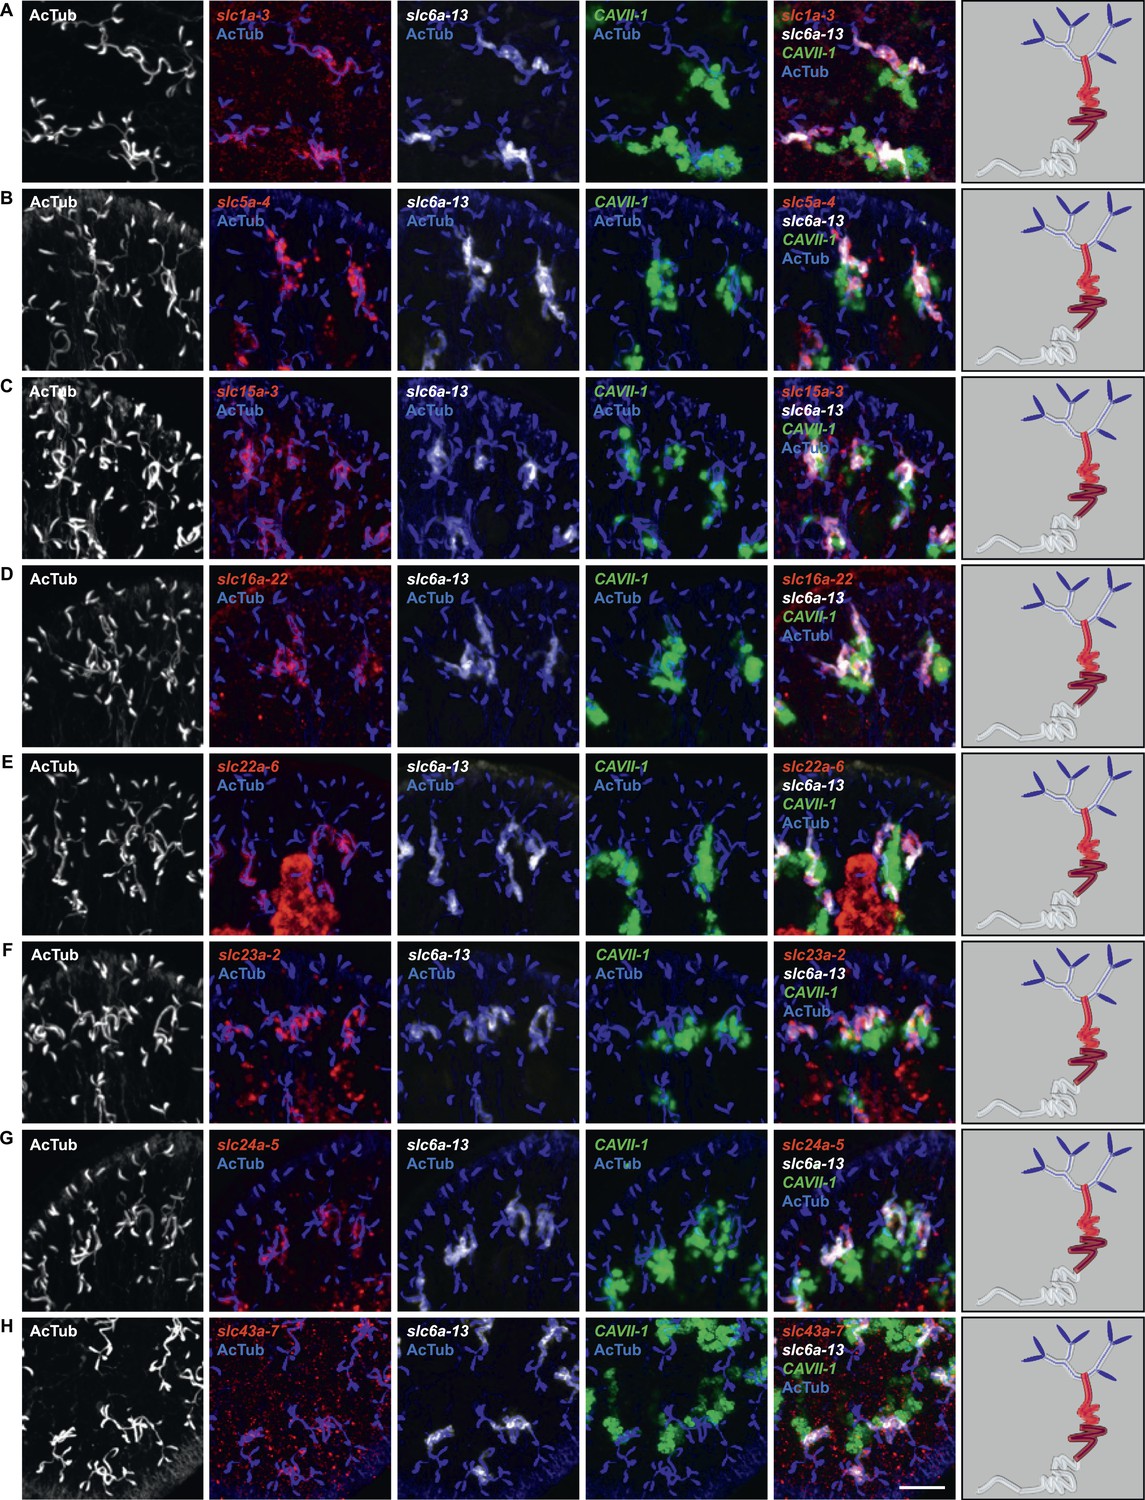
Figure 2—figure supplement 15
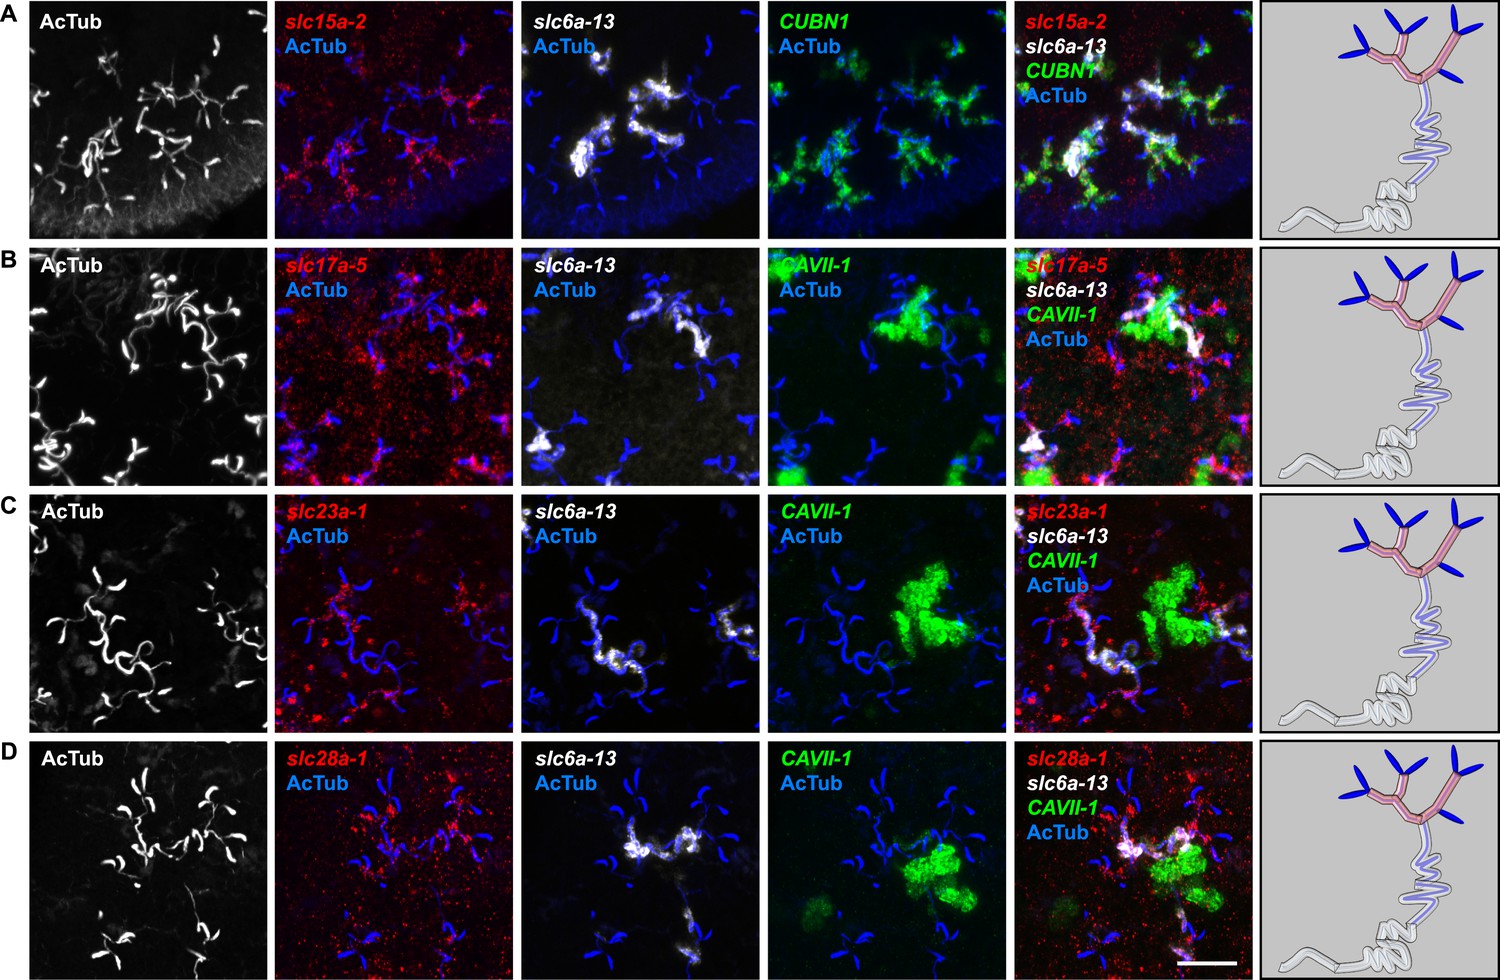
Expression of slc genes in the PT1 segment of the PT.
(A) Fluorescent overlay of indicated gene (in red) with PT1 and PT2 marker (CUBN1), PT2 and PT3 marker (slc6a-13) and AcTub staining. (B–D) Fluorescent overlay of indicated gene (in red) with PT2 and PT3 marker (slc6a-13), DT marker (CAVII-1) and AcTub staining. Images are maximum projections of confocal Z-sections. Scale bars: 50 μm. A color-coded scheme of protonephridial tubule at the end of each panel represents the expression domain of the indicated gene.
Figure 2—figure supplement 16
Expression of slc genes in the PT2 and PT3 segments of the PT.
Fluorescent overlay of indicated gene (in red) with PT2 and PT3 marker (slc6a-13), DT marker (CAVII-1) and AcTub staining. Images are maximum projections of confocal Z-sections. Scale bars: 50 μm. A color-coded scheme of protonephridial tubule at the end of each panel represents the expression domain of the indicated gene.
Figure 2—figure supplement 17
Expression of slc genes in PT3 segment of the PT.
Fluorescent overlay of indicated gene (in red) (A-C) with PT2 and PT3 marker (slc6a-13), DT marker (CAVII-1) and AcTub staining. Images are maximum projections of confocal Z-sections. Scale bars: 50 μm. A color-coded scheme of protonephridial tubule at the end of each panel represents the expression domain of the indicated gene.
Figure 2—figure supplement 18
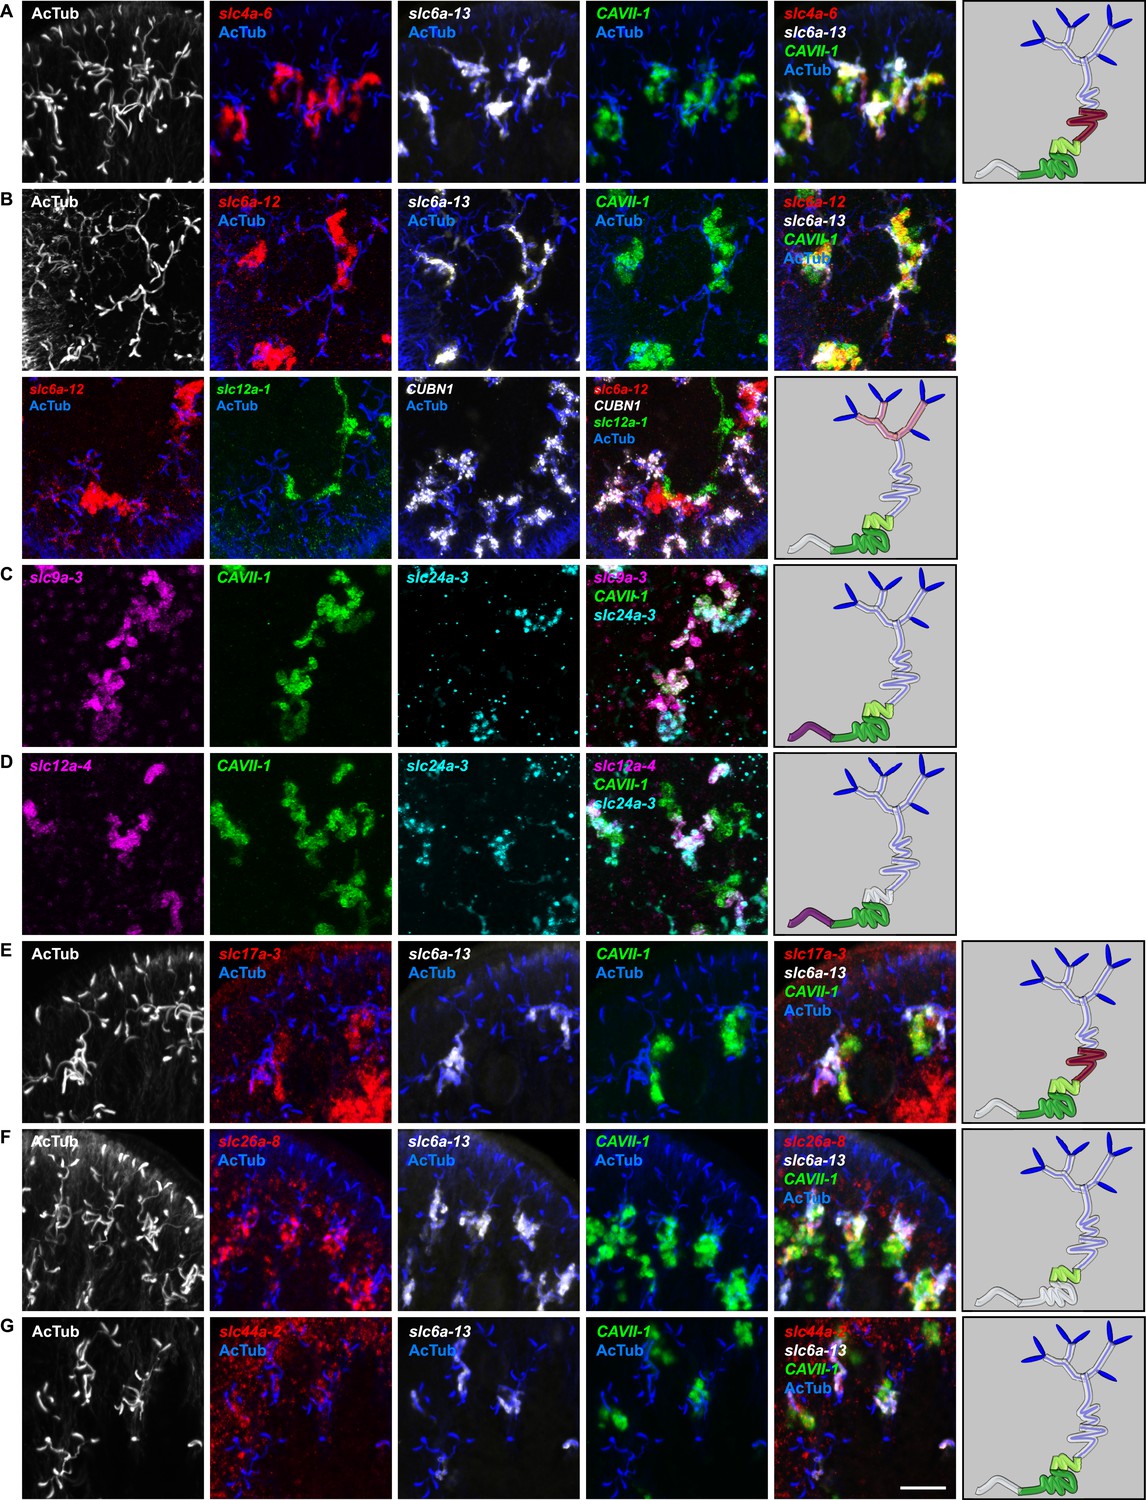
Expression of slc genes in the DT.
Fluorescent overlay of indicated gene (in red) (A-G) with PT marker (slc6a-13 or CUBN1), DT marker (CAVII-1) or CD marker (slc12a-1 or slc24a-9) together with AcTub staining. Images are maximum projections of confocal Z-sections. Scale bars: 50 μm. A color-coded scheme of protonephridial tubule at the end of each panel represents the expression domain of the indicated gene.
Figure 2—figure supplement 19
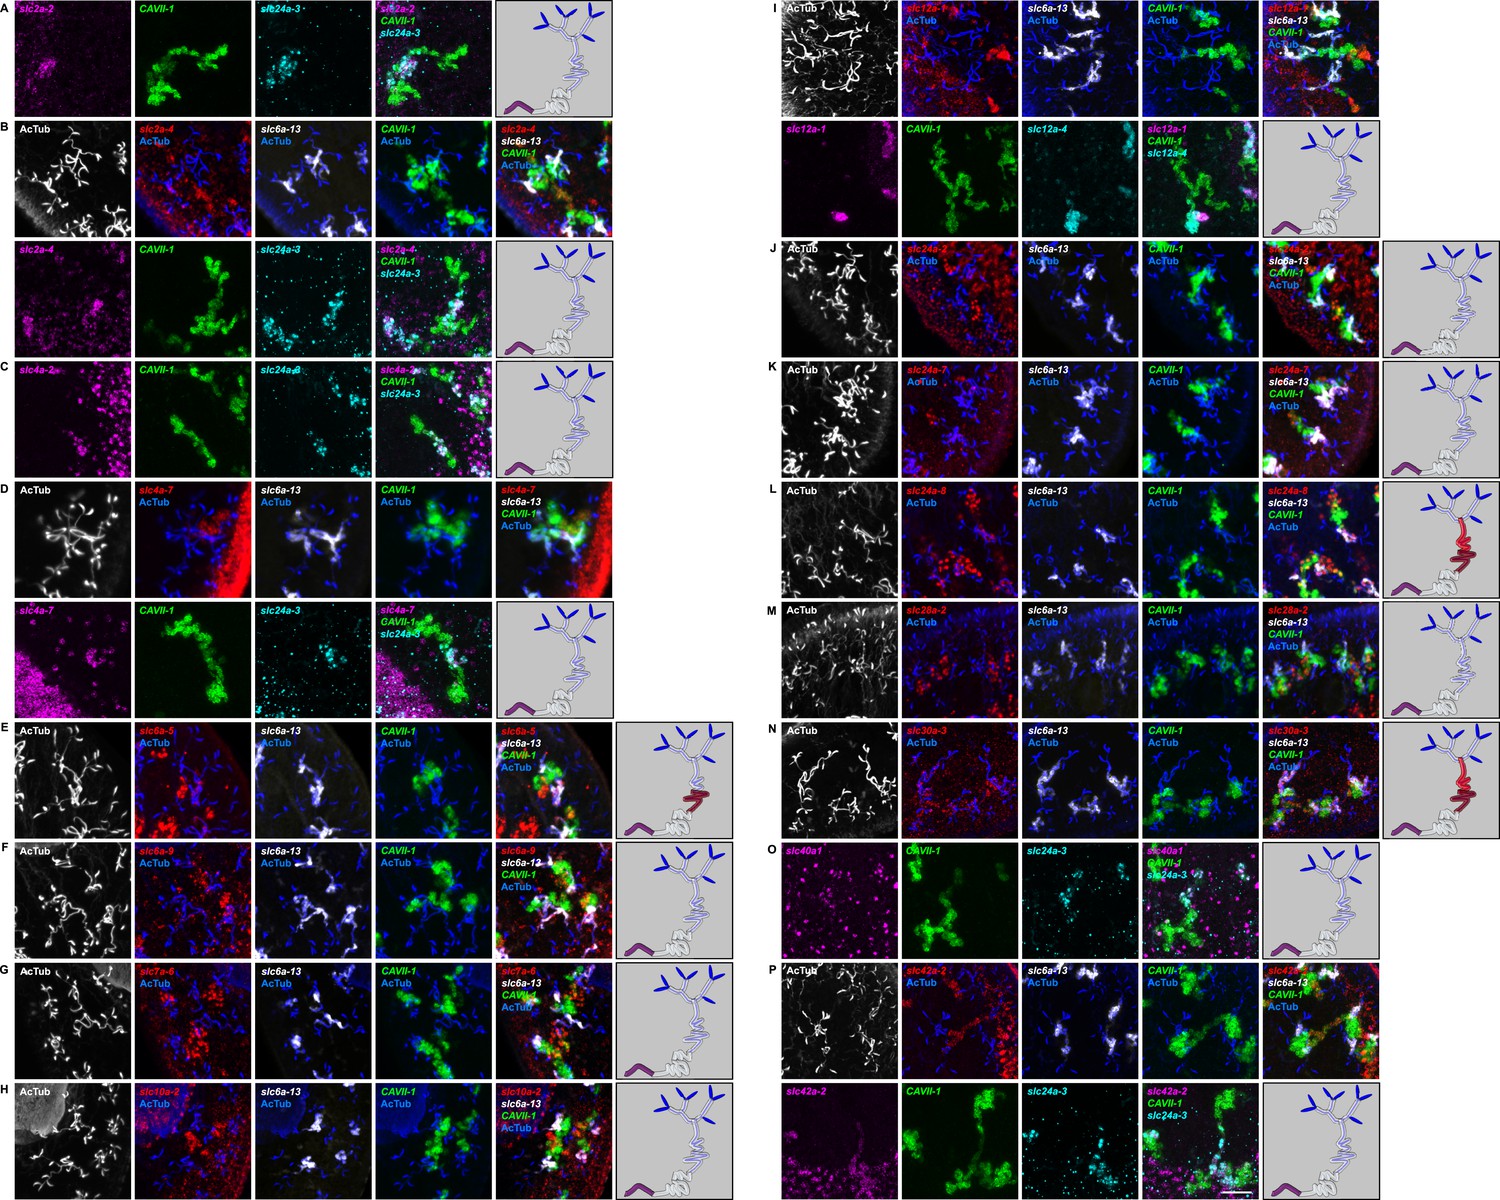
Expression of slc genes in the collecting duct.
Fluorescent overlay of indicated gene (in red) (A-P) with PT2 and PT3 marker (slc6a-13), DT marker (CAVII-1) or CD marker (slc24a-9) together with AcTub staining. Images are maximum projections of confocal Z-sections. Scale bars: 50 μm. A color-coded scheme of protonephridial tubule at the end of each panel represents the expression domain of the indicated gene.
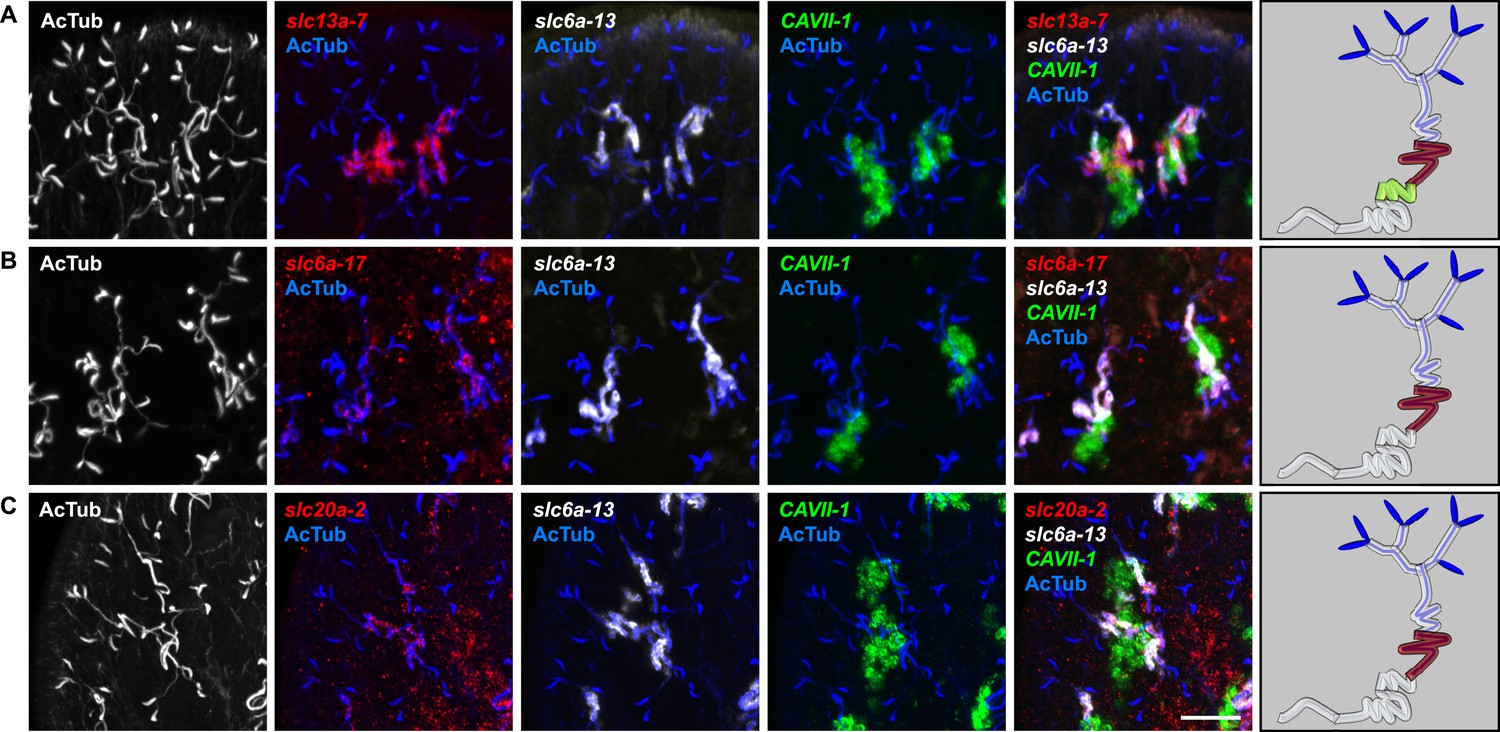
Figure 2—figure supplement 20

Expression of slc genes weakly expressed in both proximal and DTs.
Fluorescent overlay of indicated gene (in red) (A-B) with PT2 and PT3 marker (slc6a-13), DT marker (CAVII-1) and AcTub staining. Images are maximum projections of confocal Z-sections. Scale bars: 50 μm. A color-coded scheme of protonephridial tubule at the end of each panel represents the expression domain of the indicated gene.
Figure 3

Extensive structural and functional homology between planarian protonephridia and vertebrate nephrons.
(A) Tables summarize expression domains of selected slc genes in planarian protonephridia and rodent metanephros. Cartoons showing segmental organization of planarian protonephridia and rodent metanephros are on the left. Gray color in the tables indicates expression domain of slc in planarian protonephridia and rodent metanephros. Planarian slc sequence nomenclature (e.g., slc1a-3) doesn't reflect direct orthology to the mammalian counterparts. Abbreviations for segments of protonephridia are as follows: PT1, PT2, and PT3, segments of the proximal tubule (PT); DT1 and DT2, segments of the DT; CD, the collecting duct. Abbreviations for segments of the metanephros are as follows: S1, S2, and S3, segments of the PT; DTL, descending thin limb; ATL, ascending thin limb; TAL, thick ascending limb; DCT, distal convoluted tubules; CNT, connecting tubule; CD, collecting duct. (B) Fluorescent overlay of reabsorbed dextran with PT marker (AcTub). (C) pHi reporter assay using SNARF-5F-AM in Control(RNAi) and slc4a-6(RNAi).
Figure 4 with 3 supplements
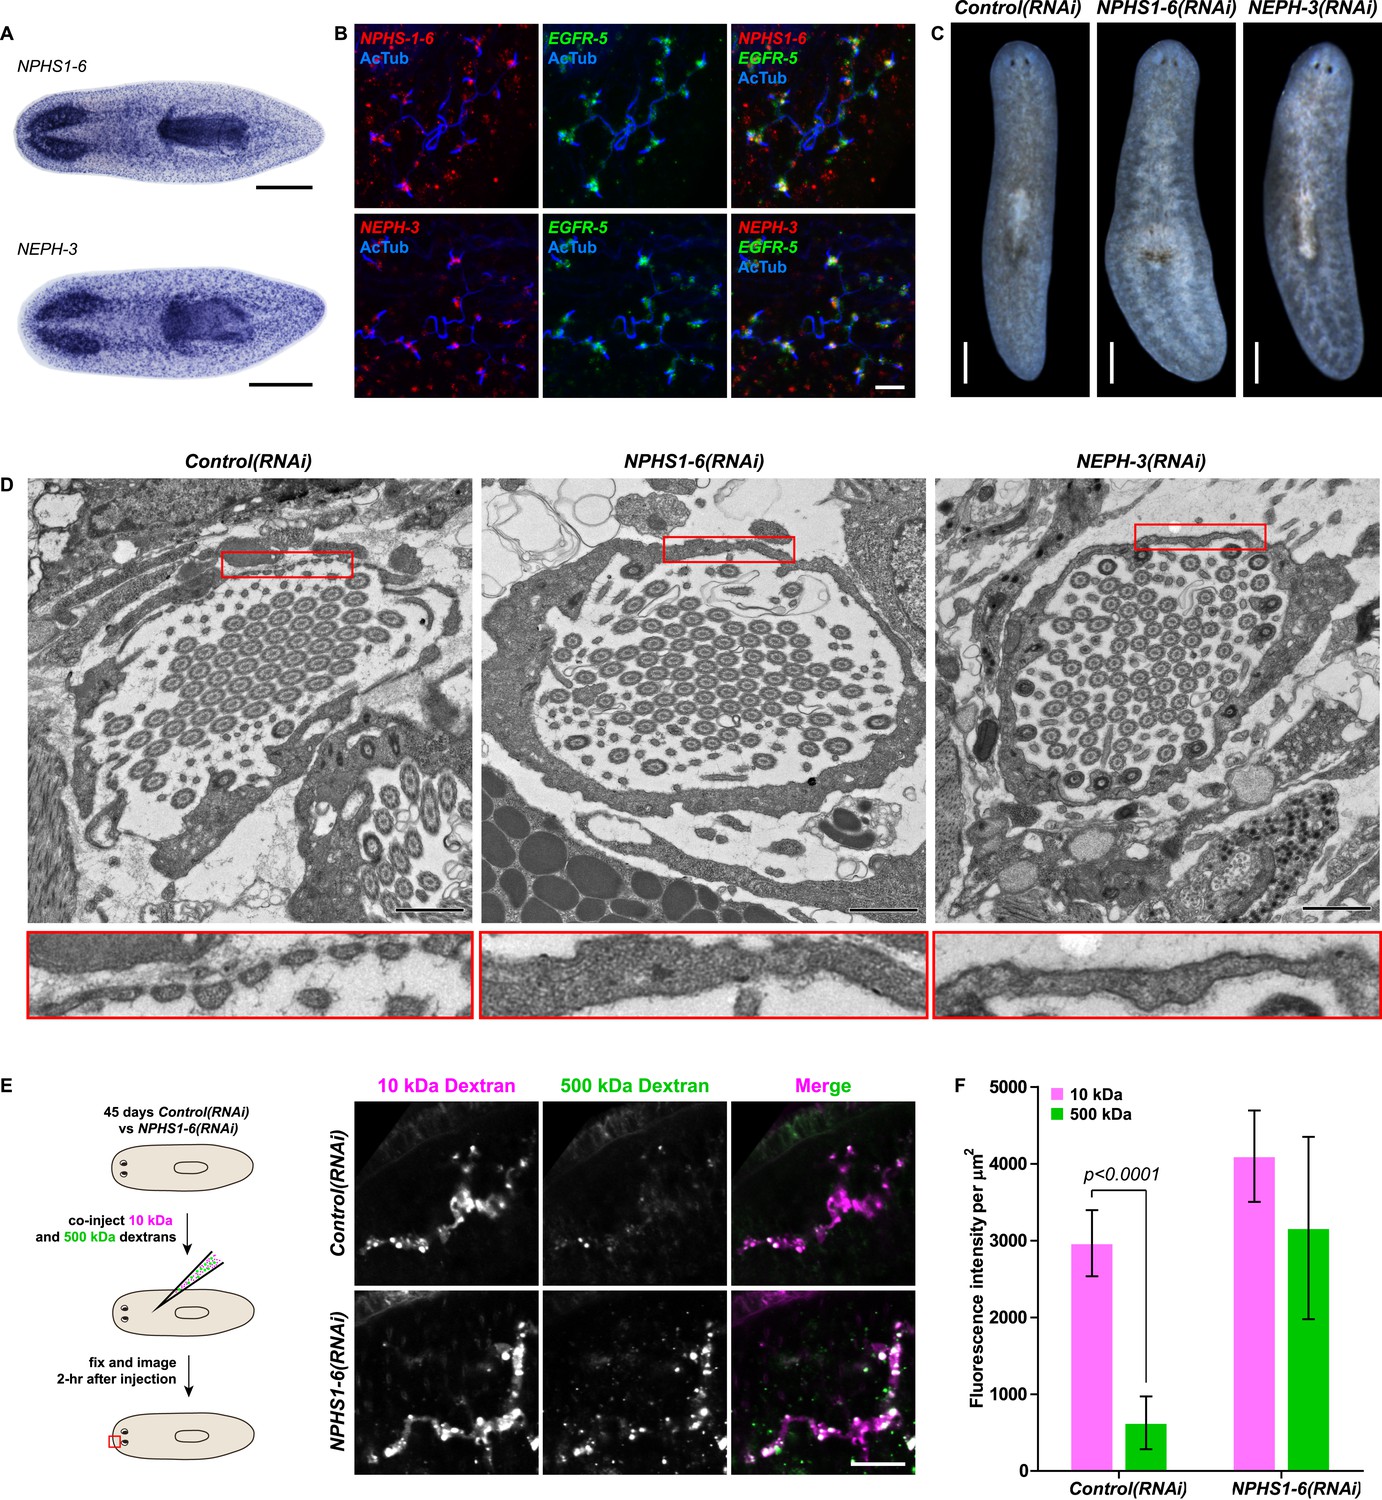
Vertebrate slit-diaphragm components are expressed in planarian flame cells and are required for the maintenance of their filtration diaphragm.
(A) Whole-mount expression patterns of indicated marker genes by in situ hybridization (NBT/BCIP development). Scale bars: 500 μm. (B) Fluorescent overlay of indicated gene (red) with flame cell marker EGFR-5 and AcTub staining. Images are maximum projections of confocal Z-sections. Scale bars: 50 μm. (C) Live images show edema in intact NPHS1-6(RNAi) and NEPH-3(RNAi) animals. Scale bars: 500 μm. (D) TEM images show cross-section through a flame cell in intact Control(RNAi), NPHS1-6(RNAi) and NEPH-3(RNAi) animals. Inset shows a high magnification of the filtration diaphragm. Scale bar: 1 μm. (E, F) Ultrafiltration assay assesses the ultrafiltration capacity in NPHS1-6(RNAi) animals. (E) Representative images show dextran uptake in the animals that co-injected with 10 kDa and 500 kDa fluorescently labeled dextran. Scale bar: 50 μm. (F) Quantification of small and large dextran uptake.
Figure 4—figure supplement 1
Slit-diaphragm components in the planarian S. mediterranea.
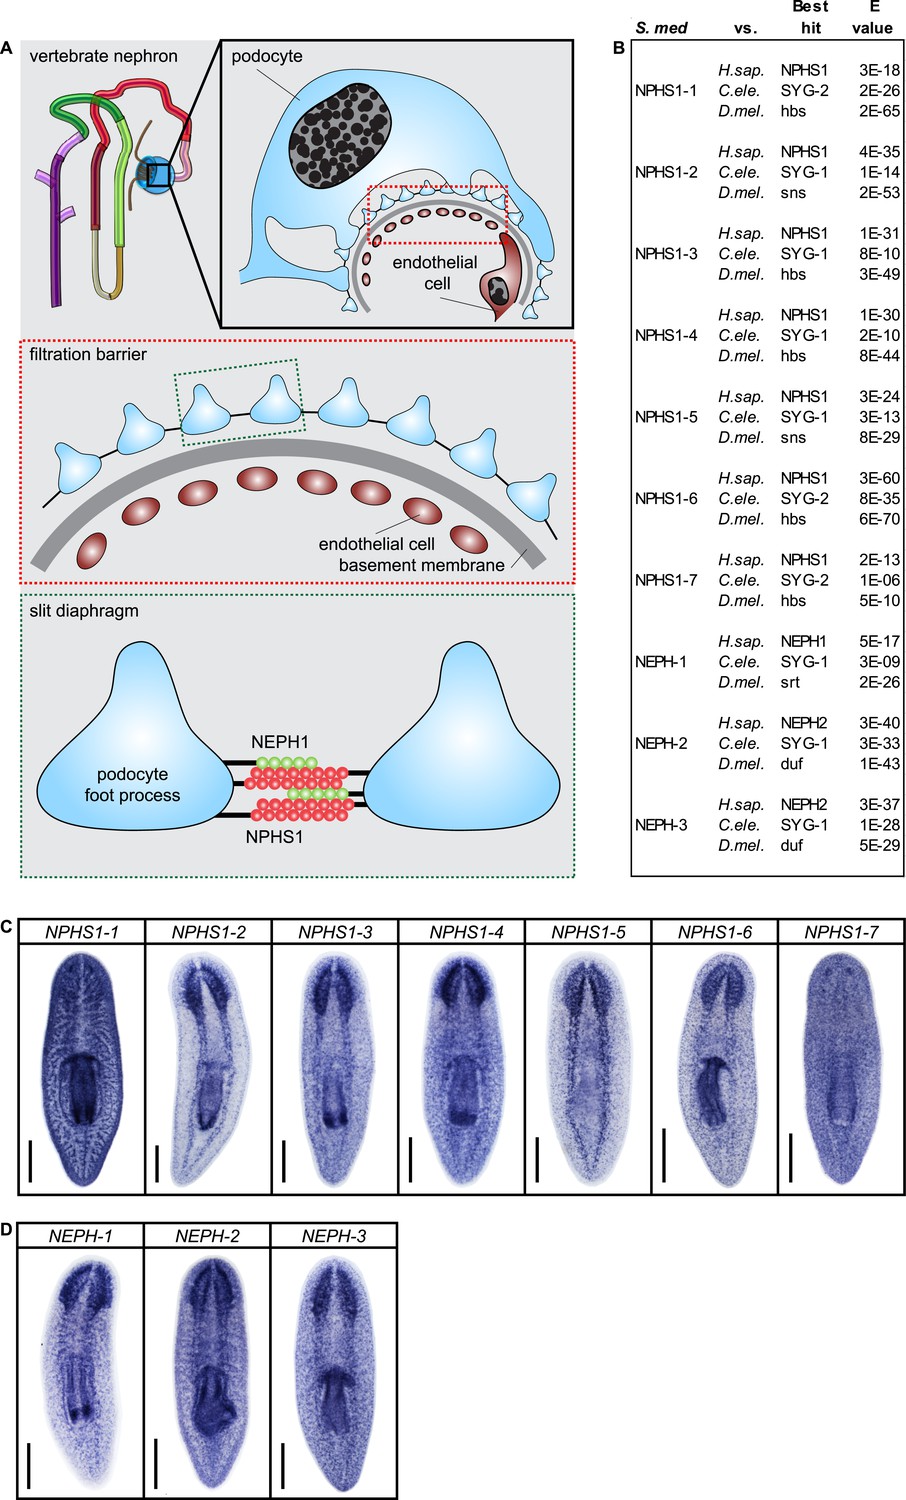
(A) Cartoon showing the glomerular filtration barrier. Top: A schematic view of the podocyte. The podocyte wraps around the capillary wall on the outer surface of the glomerular basement membrane with its extended inter-digitating foot processes. Podocyte foot processes are then bridged by a slit diaphragm. Middle: A close-up view of the glomerular filtration barrier consisting of three components: porous endothelium, glomerular basement membrane, and podocyte foot processes with the interposed slit diaphragm. The endothelial pores are not bridged by a diaphragm. Bottom: Schematic drawing of the molecular equipment of slit diaphragm. NPHS1 undergoes homophilic interaction on neighboring podocyte foot processes. The intercellular junction also contains the adhesion molecule NEPH-1. (B) Homology analysis of the planarian homologs of NPHS1 and NEPH. Domains predicted by SMART for planarian and human proteins. Best reciprocal BLAST hits in human, C. elegans, and fly refseq protein database. (C) Whole-mount expression patterns of NPHS1 and (D) NEPH by in situ hybridization. Scale bars: 500 μm.
Figure 4—figure supplement 2
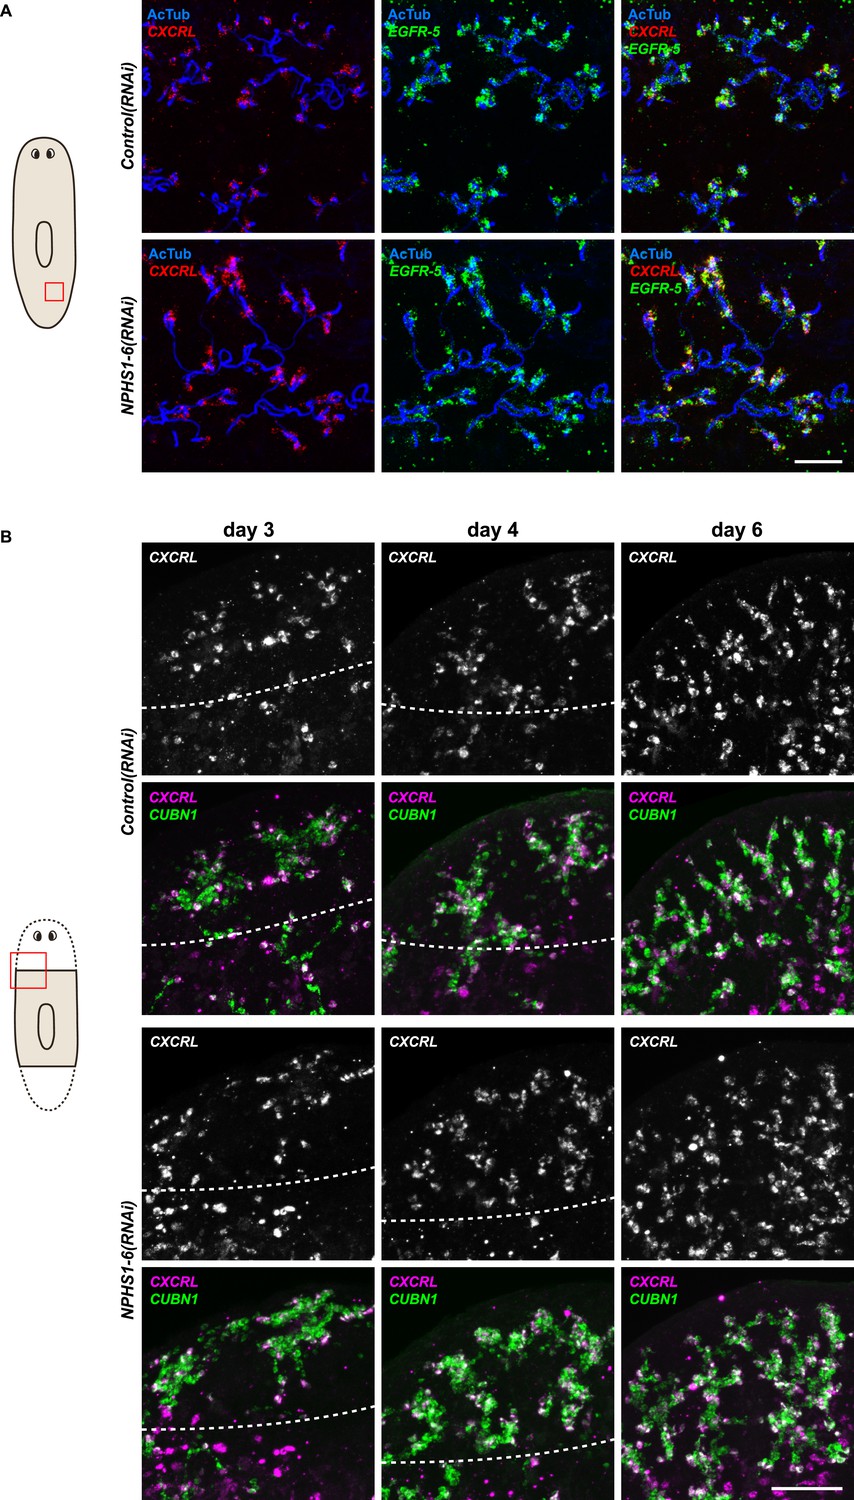
NPHS1-6 is not required for flame cell viability during normal homeostasis, as well as regeneration.
(A, B) Fluorescent overlay of flame cell markers (CXCRL and EGFR-5) with AcTub staining in intact (A) and regenerating (B) Control(RNAi) and NPHS1-6(RNAi). Images are maximum projections of confocal Z-sections. Scale bars: 50 μm.
Figure 4—figure supplement 3

NPHS1-6 is required for de novo formation of filtration diaphragm during regeneneration.
TEM images showing cross-section through a flame cell in regenerating Control(RNAi) and NPHS1-6(RNAi) animals. Inset shows high magnification of filtration diaphragm. Scale bar: 1 μm.
Figure 5 with 3 supplements
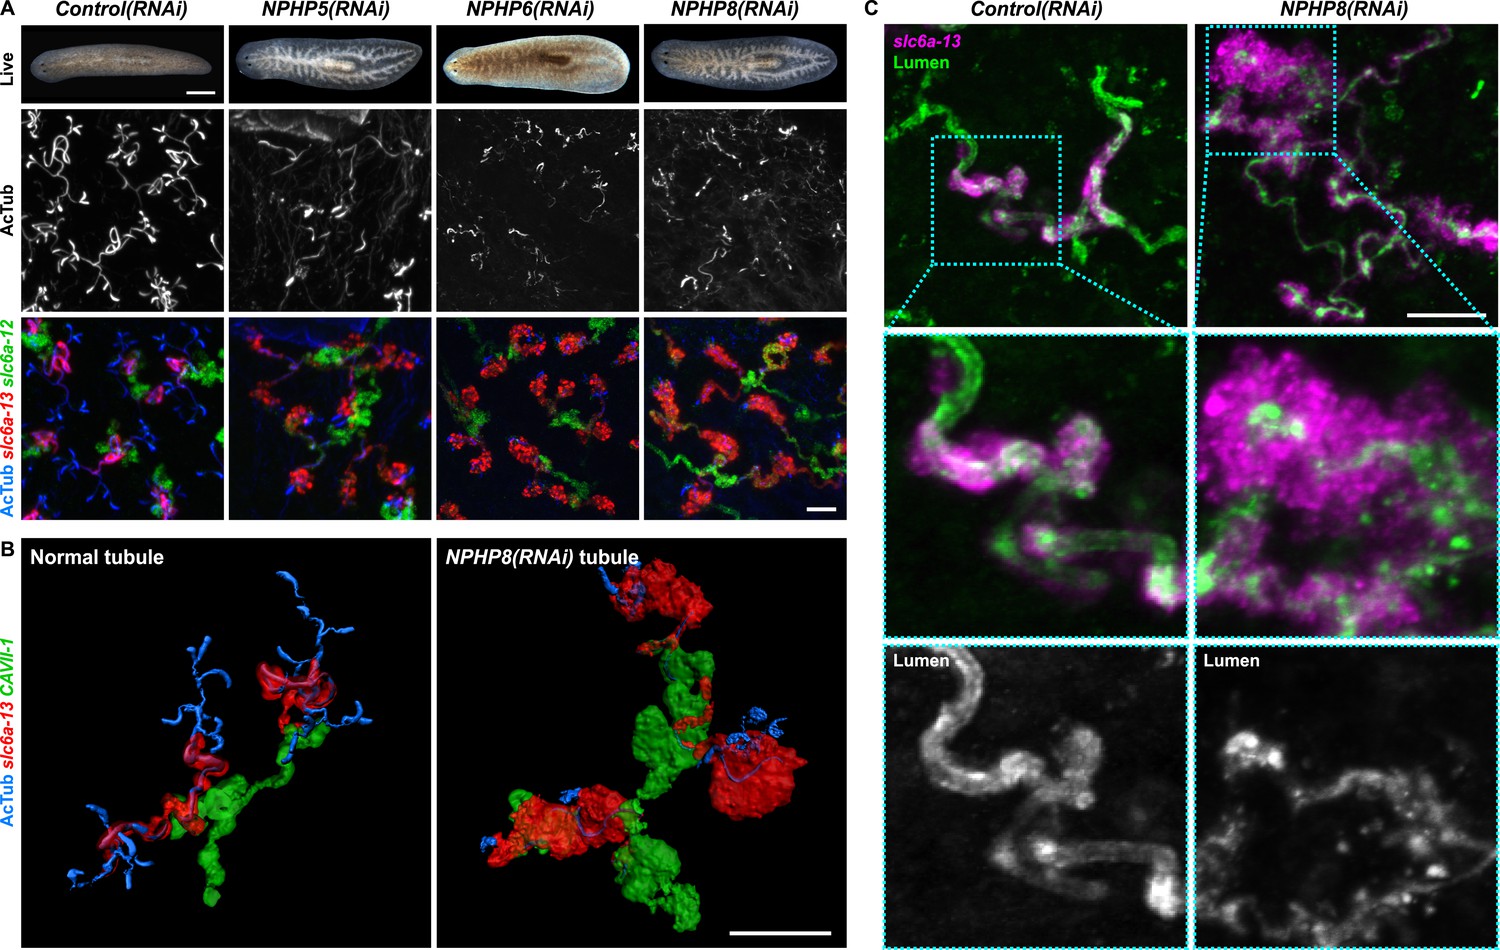
Down-regulation of nephrocystin members leads to the formation of cyst-like structure in protonephridia.
(A) Protonephridial defects in NPHP5(RNAi), NPHP6(RNAi) and NPHP8(RNAi) animals. Top panel: live images show edema in intact RNAi animals. Scale bars: 500 μm; middle panel: monochrome showing AcTub staining; bottom panel: fluorescent overlay of AcTub staining with PT2 and PT3 marker (slc6a-13) and DT marker (slc6a-12). Scale bars: 50 μm. (B) 3D rendering images showing normal tubule and cystic-like tubule in Control(RNAi) and NPHP8(RNAi) animals, respectively. 3D rendering was performed in IMARIS. Scale bars: 50 μm. (C) Fragmented lumen in enlarged protonephridial tubule. Fluorescent overlay of PT2 and PT3 marker slc6a-13 and lumen marker (a customized rabbit antiserum recognized unknown epitope) in intact Control(RNAi) and NPHP8(RNAi) animals. Scale bars: 50 μm. Images in (A) and (C) are maximum projections of confocal Z-sections.
Figure 5—figure supplement 1
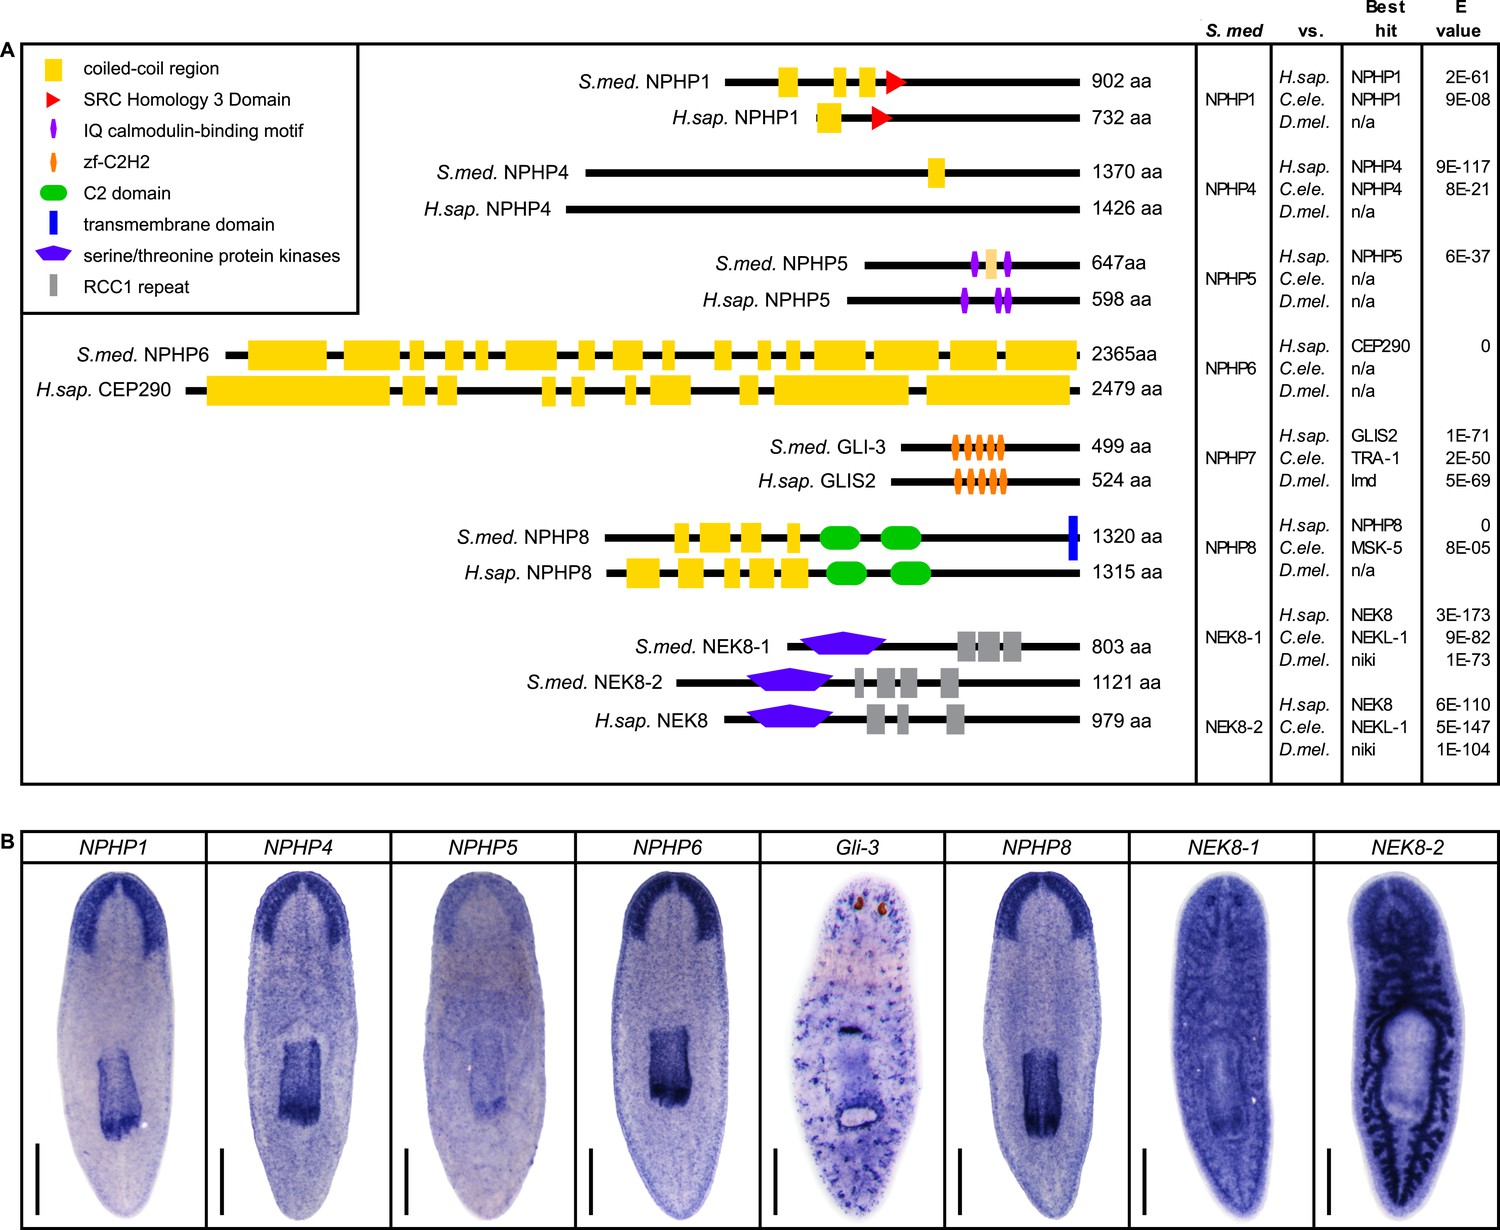
Nephrocystins in the planarian S. mediterranea.
(A) Homology analysis of planarian nephrocystins. Domains predicted by SMART for planarian and human proteins. Best reciprocal BLAST hits in human, C. elegans, and fly refseq protein database. (B) Whole-mount expression patterns of genes encoding nephrocystins by in situ hybridization. Scale bars: 500 μm.
Figure 5—figure supplement 2
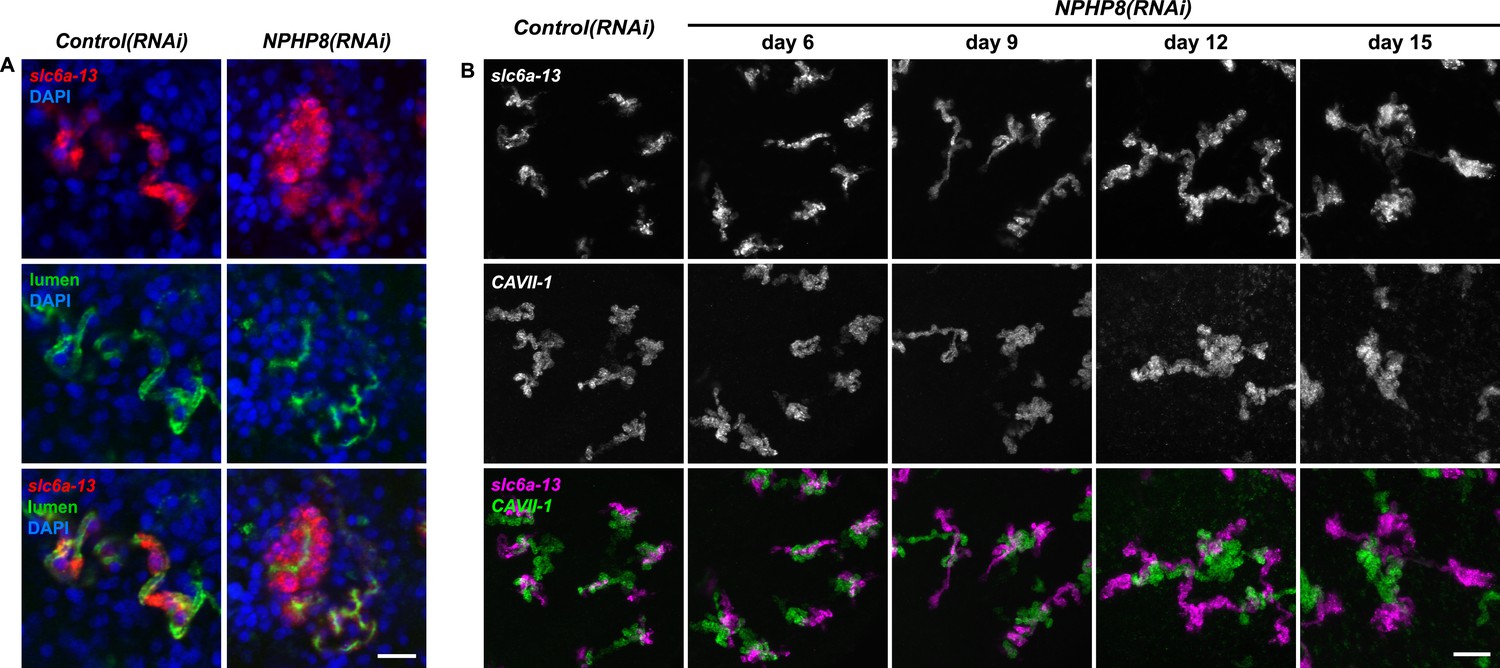
Abnormal tubular enlargement in NPHP8(RNAi) animals.
(A) Fluorescent overlay of lumen marker with PT2 and PT3 marker slc6a-13 and nuclei (DAPI) in Control(RNAi) and NPHP8(RNAi) animals. Scale bars: 25 μm. (A) Fluorescent overlay of PT marker (slc6a-13) and (B) DT marker (CAVII-1) in intact Control(RNAi) and NPHP8(RNAi) animals. Images are maximum projections of confocal Z-sections. Scale bars: 50 μm.
Figure 5—figure supplement 3

Ultrastructure of the PT in NPHP(RNAi) animals.
TEM images showing cross-section through a tubule of protonephridia in indicated RNAi animals. Inset in red box shows abnormally localized basal body in indicated RNAi animals. Inset in green box shows ultrastructure of cilia. c, cilia; n, nucleus; bb, basal body; sj, septate junction; l, lumen.
Figure 6 with 3 supplements
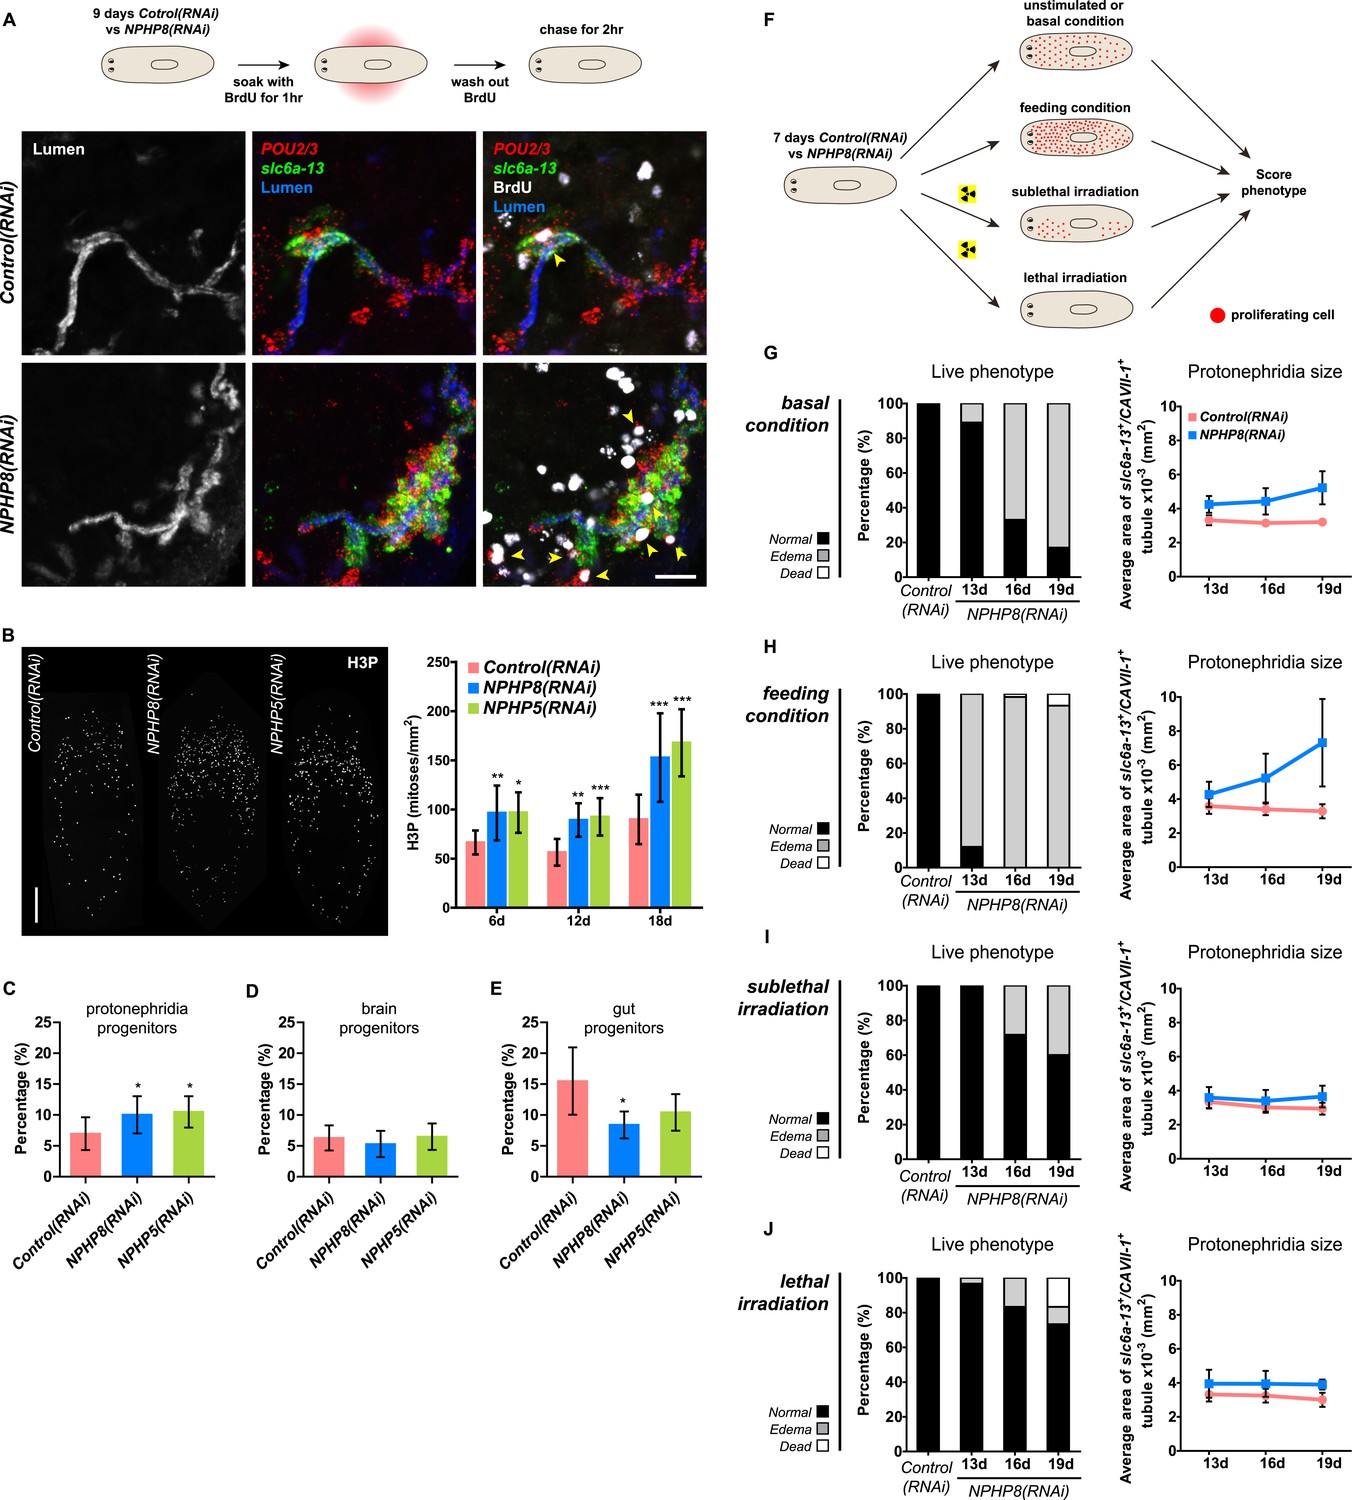
Cystogenesis in planarian protonephridia results from direct proliferation of protonephridia progenitors and requires the presence of stem cells.
(A) BrdU pulse-chase experiment shows the presence of diving protonephridial progenitors in the proximity of protonephridial tubule in Control(RNAi) and NPHP8(RNAi) animals. Yellow arrowhead indicates POU2/3+/BrdU+ cell. Scale bars: 25 μm. (B) Increased global proliferation in NPHP5(RNAi) and NPHP8(RNAi) animals is displayed by immunostaining of mitotic marker phospho-Histone H3 (H3P). Scale bars: 500 μm. * p < 0.05; ** p < 0.01; *** p < 0.001 vs control. The time points in the bar graph indicate the number of day after the last dsRNA introduction. (C–E) Quantification of (C) dividing protonephridial progenitors (POU2/3+/H3P+), (D) diving neuronal progenitors (pax6A+/H3P+) and (E) diving gut progenitors (HNF4+/H3P+) among diving cells (H3P+) in indicated RNAi animals at 18 day after last RNAi introduction. * p < 0.05 vs control. (F–J) Effect of proliferation and the requirement of neoblasts on cyst formation in planarian protonephridia. (F) Schematics demonstrates experimental strategy for panel H–J. 7 day post RNAi feeding animals were either fed with liver to induce cell proliferation or subjected to sublethal or lethal doses of irradiation to reduce or eliminate neoblasts. Scoring live phenotype as well as measuring the average size of each protonephridial unit was used to evaluate the severity of cystic phenotype. Temporal succession of indicated phenotypes (left) and quantification of average area of each slc6a13+/CAVII-1+ tubule (right) in Control(RNAi) and NPHP8(RNAi) animals under (G) basal condition (only RNAi feeding), (H) basal condition plus extra feeding with liver, (I) basal condition plus sub-lethal irradiation to reduce the number of neoblasts, and (J) basal condition plus lethal irradiation to completely eliminate neoblasts. The time points in the bar graphs (G–J) indicate the number of the day after the first dsRNA introduction.
Figure 6—figure supplement 1
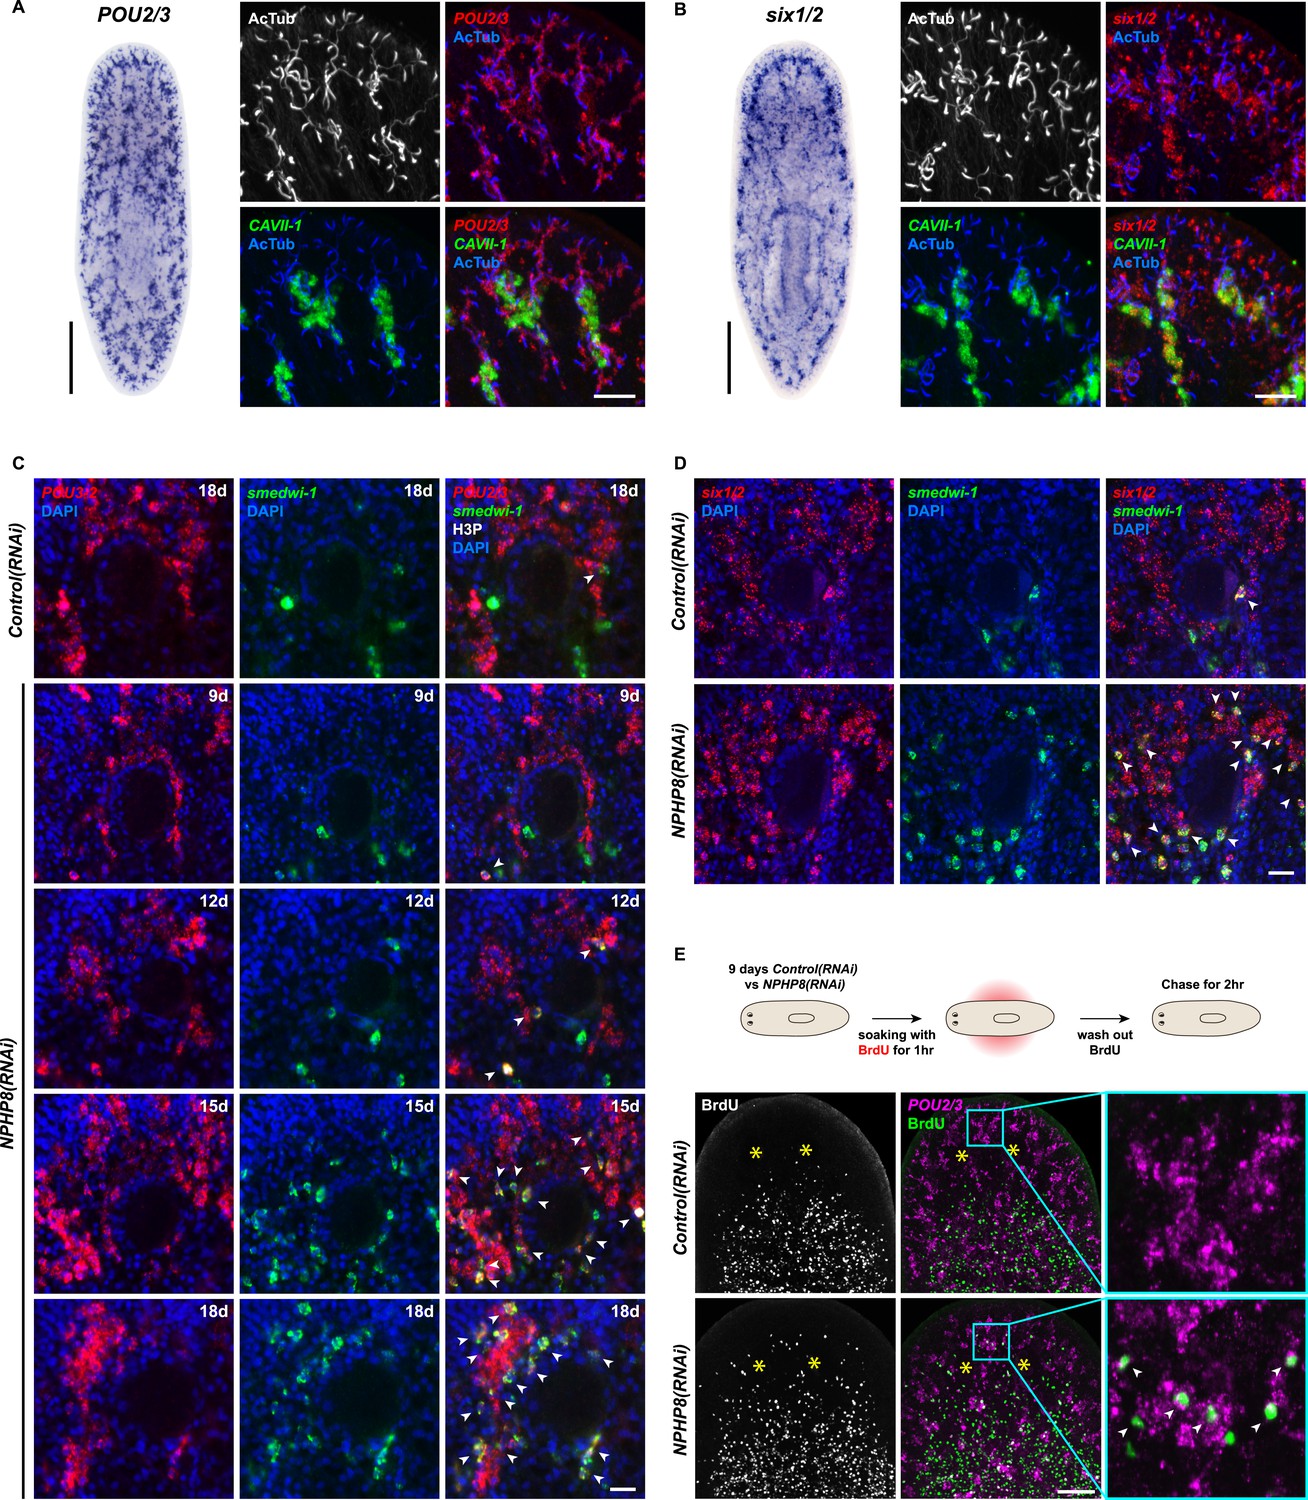
Increase of protonephridial progenitors during cystogenesis in planarian protonephridia.
(A) Left: Whole-mount expression patterns of POU2/3 by in situ hybridization. Scale bars: 500 μm. Right: Fluorescent overlay of POU2/3 with DT marker (CAVII-1) and AcTub. Scale bar: 50 μm. (B) Left: Whole-mount expression patterns of six1/2 by in situ hybridization. Scale bars: 500 μm. Right: Fluorescent overlay of six1/2 with DT marker (CAVII-1) and AcTub. Scale bar: 50 μm. (C, D) Magnified view showing the region surrounding photoreceptor. Fluorescent overlay of POU2/3 and six1/2 with pan stem cell marker Smedwi-1 and mitotic marker H3P. Scale bar: 50 μm. (E) Increase of S-phase protonephridial progenitors during cystogenesis in planarian protonephridia. Intact Control(RNAi) and NPHP8(RNAi) animals were pulsed with BrdU (1 hr), followed by 2 hr-chase. Fluorescent overlay of POU2/3 with BrdU showing the abnormal increase of POU2/3+/BrdU+ in the head region anterior to the photoreceptors. Images are maximum projections of confocal Z-sections. Scale bar: 100 μm.
Figure 6—figure supplement 2
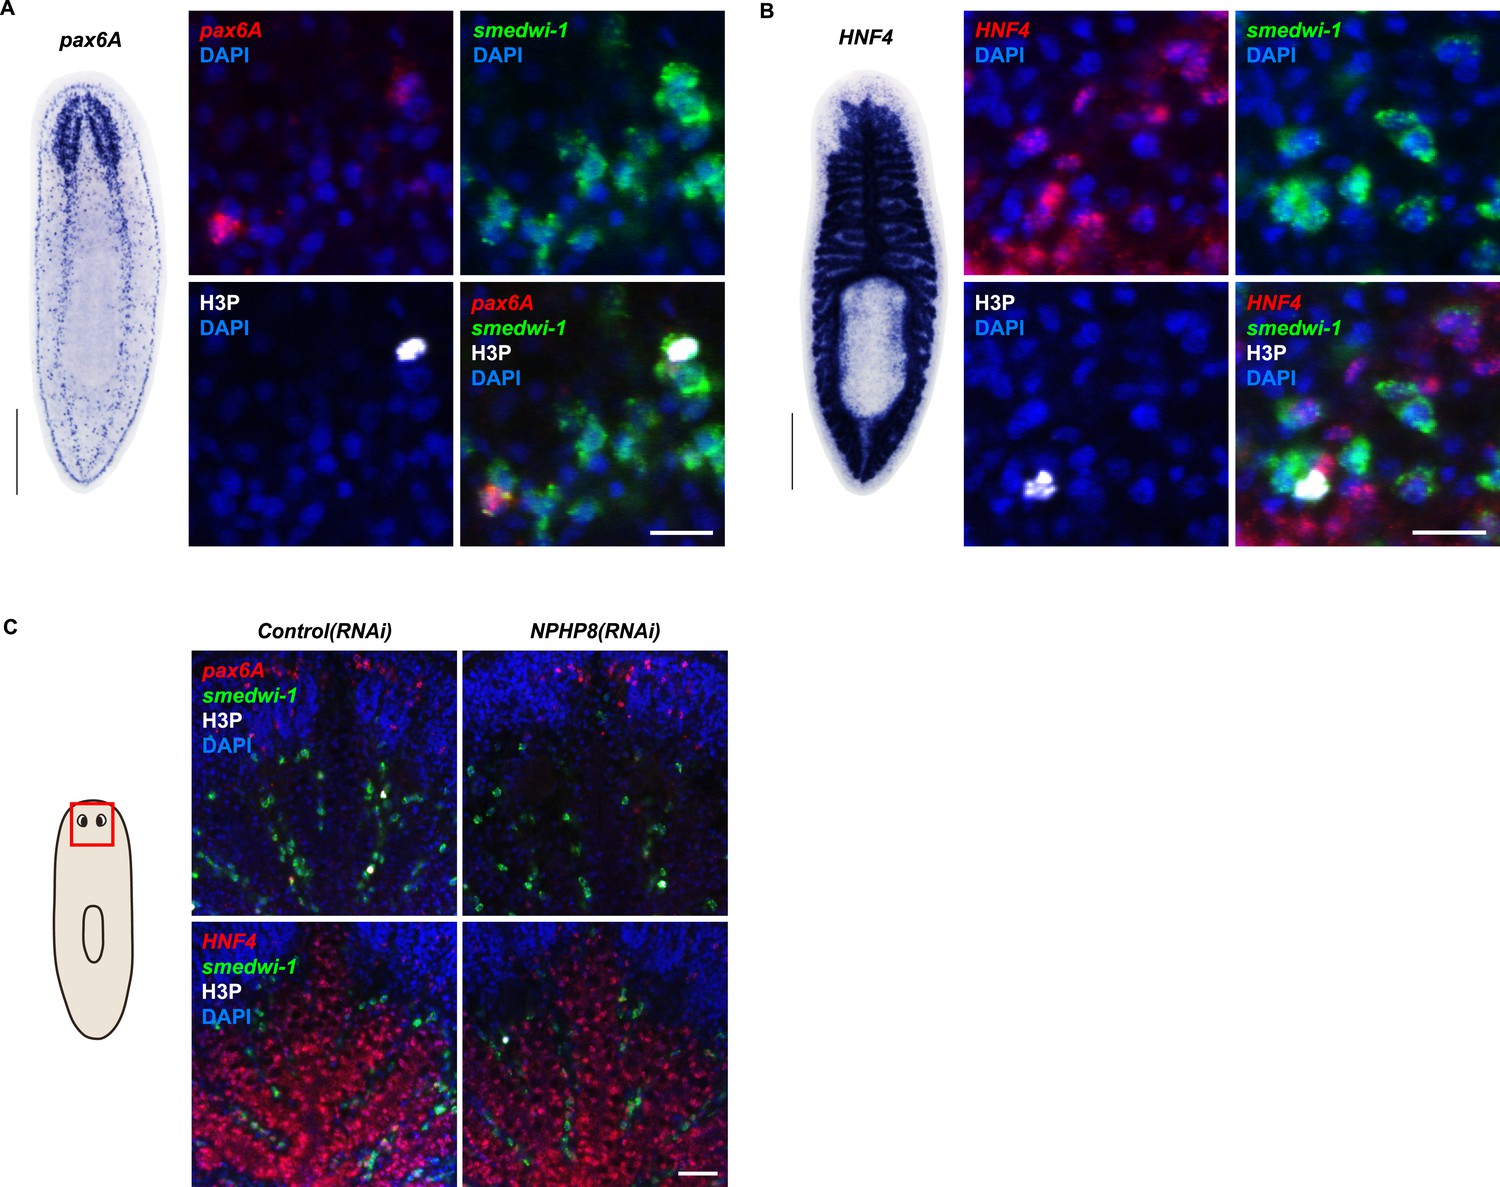
Gut and brain progenitors in NPHP8(RNAi) animals.
(A, B) Left panel: whole-mount expression patterns of pax6A (A) and HNF4 (B) by in situ hybridization. Scale bars: 500 μm; Right panel: fluorescent overlay of (A) pax6A and (B) HNF4 with pan stem cell marker (Smedwi-1) and mitotic marker (H3P). Scale bar: 50 μm. (C) Magnified view showing the head region. Fluorescent overlay of pax6A and HNF4 with pan stem cell marker Smedwi-1 and mitotic marker H3P. Scale bar: 50 μm.
Figure 6—figure supplement 3
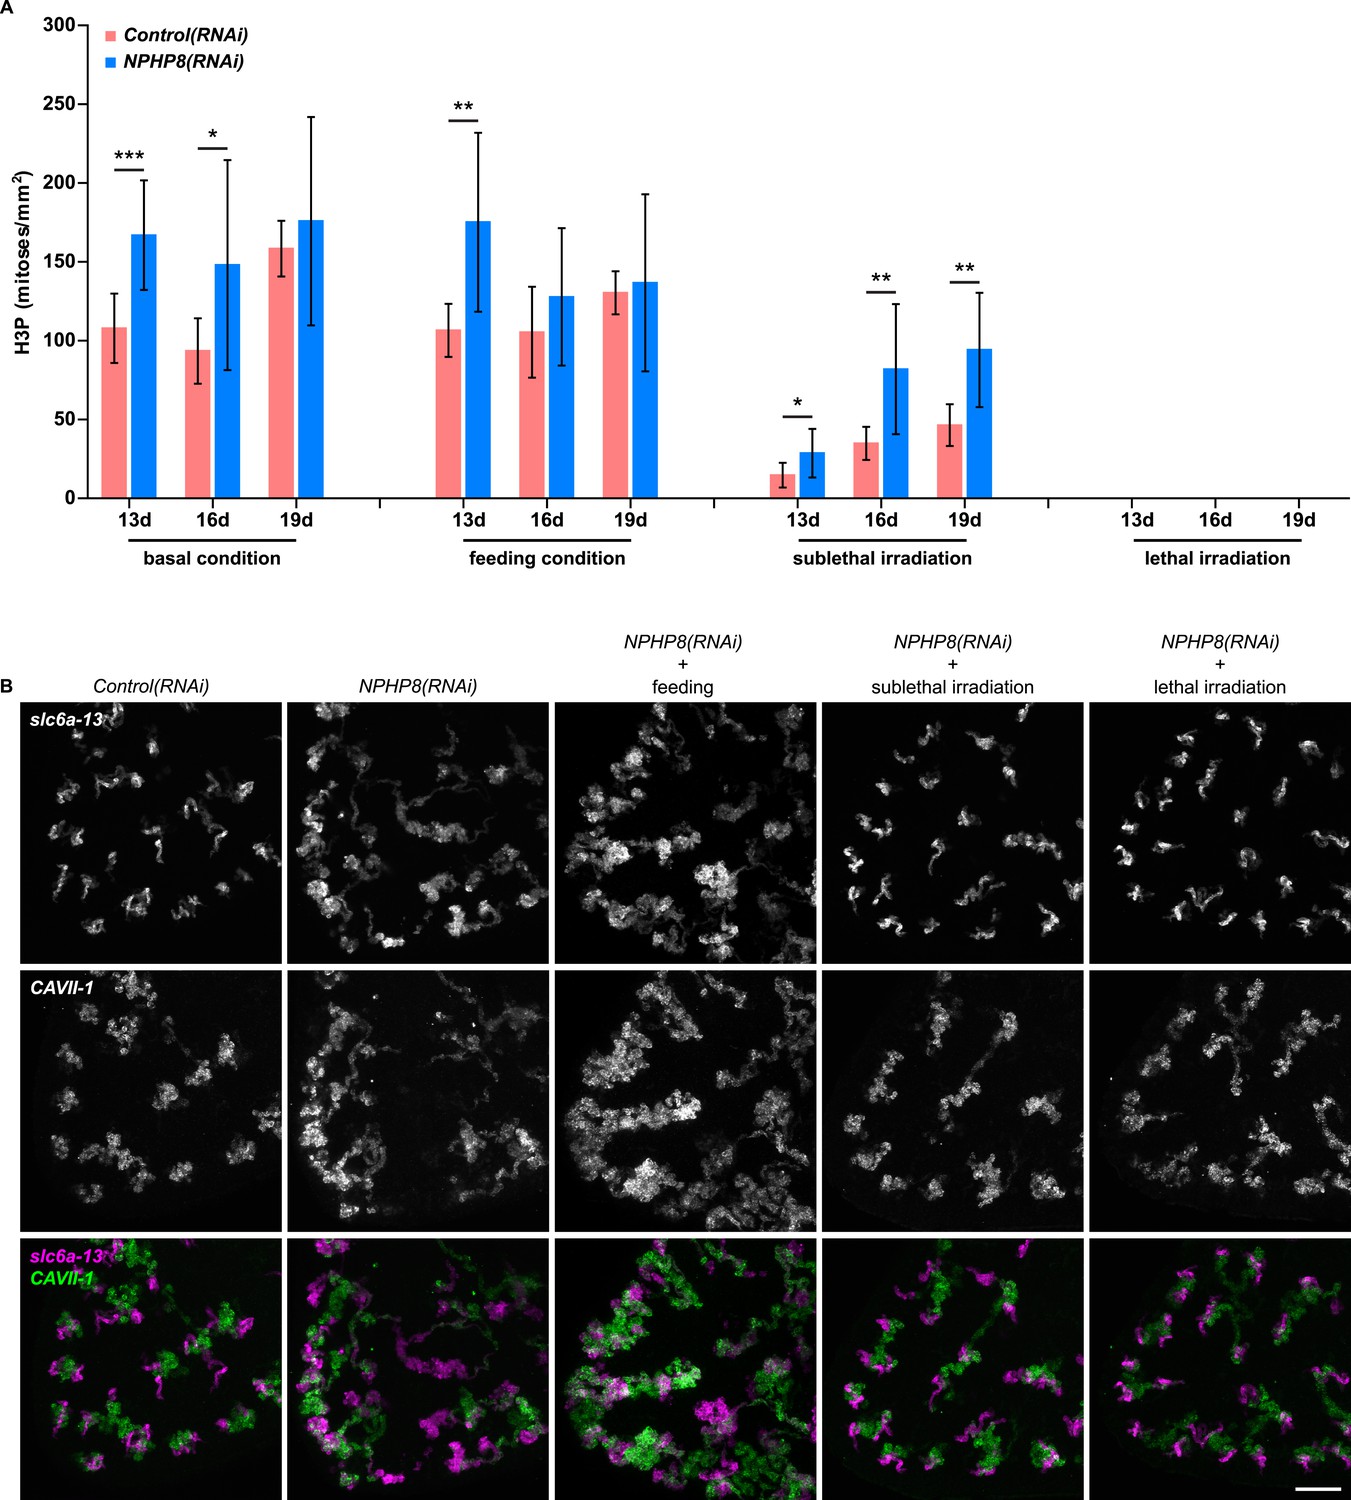
The severity of cystic phenotype in protonephridia depends on proliferation rate and requires the presence of stem cells.
(A) Quantification of mitoses in Control(RNAi) and NPHP8(RNAi) animals. Experimental paradigm is described in Figure 5F. The time point in the bar graph indicates the number of the day after the first dsRNA introduction. (B) The severity of cystic phenotype in protonephridia depends on the rate of proliferation and requires the presence of stem cells. Fluorescent overlay of PT marker (slc6a-13) with DT marker (CAVII-1). Images are maximum projections of confocal Z-sections. Scale bar: 100 μm.
Figure 7 with 2 supplements

Cystic phenotype in protonephridia is cilia-and fluid flow-dependent.
(A) Series of live images show gliding mobility in Control(RNAi) and NPHP8(RNAi) animals. Yellow dot line provides a spatial reference to illustrate progress of animal. Scale bar: 1 mm. (B) Quantification of translocation speed in indicated RNAi animals. Error bar, SD; *** p < 0.001 vs control. (C) Fluorescent overlay of ventral cilia (AcTub) with nucleus marker (DAPI) in indicated RNAi animals. Scale bar: 10 μm. (D–G) Live images show bloating phenotype in IFT88(RNAi), DNAHβ-1(RNAi), and LRRC50(RNAi) animals. Scale bar: 500 μm. (D′–G′) Fluorescent overlay of ventral cilia (AcTub) with nucleus marker (DAPI) in IFT88(RNAi), DNAHβ-1(RNAi), and LRRC50(RNAi) animals. Scale bar: 10 μm. (D′′–G′′) 3D rendering showing fluorescent overlay of AcTub staining with PT2 and PT3 marker (slc6a-13) and DT marker (CAVII-1) in Control(RNAi), IFT88(RNAi), DNAHβ-1(RNAi), and LRRC50(RNAi) animals. Scale bar: 50 μm. (D′′′–G′′′) Magnified view shows fluorescent overlay of POU2/3 with pan stem cell marker (smedwi-1) in the region surrounding photoreceptor. White arrowhead shows POU2/3+/smedwi-1+ cell. Scale bar: 25 μm. (H–I) Abnormal cilia beating in DNAHβ-1(RNAi), and LRRC50(RNAi) animals. (H) Left panel: live images show cilia beating along the lateral body edge of the planarian head region; Right panel: vector map generated by Spatiotemporal image correlation spectroscopy (STICS) analysis shows velocity magnitude and beating pattern of cilia. The brightness of the vector represents the velocity magnitude of the cilia: brighter vector, stronger ciliary beating or vice versa. (I) Quantification of ciliary velocity magnitude in indicated RNAi animals. * p < 0.05 vs control. (J) Cartoon represents working model of cyst formation in the planarian protonephridia. In normal tubule, protonephridial tubular cell turnover is maintained by integration of protonephridial progenitors, originated from the neoblasts, into the tubule. During this process, cilia-driven fluid flow is required for the maintenance of tubular geometry. Obstruction of fluid flow by disrupting cilia function leads to protonephridial cystogenesis that characterized by abnormal proliferation of protonephridial progenitors, tubular enlargement and disorganization.
Figure 7—figure supplement 1
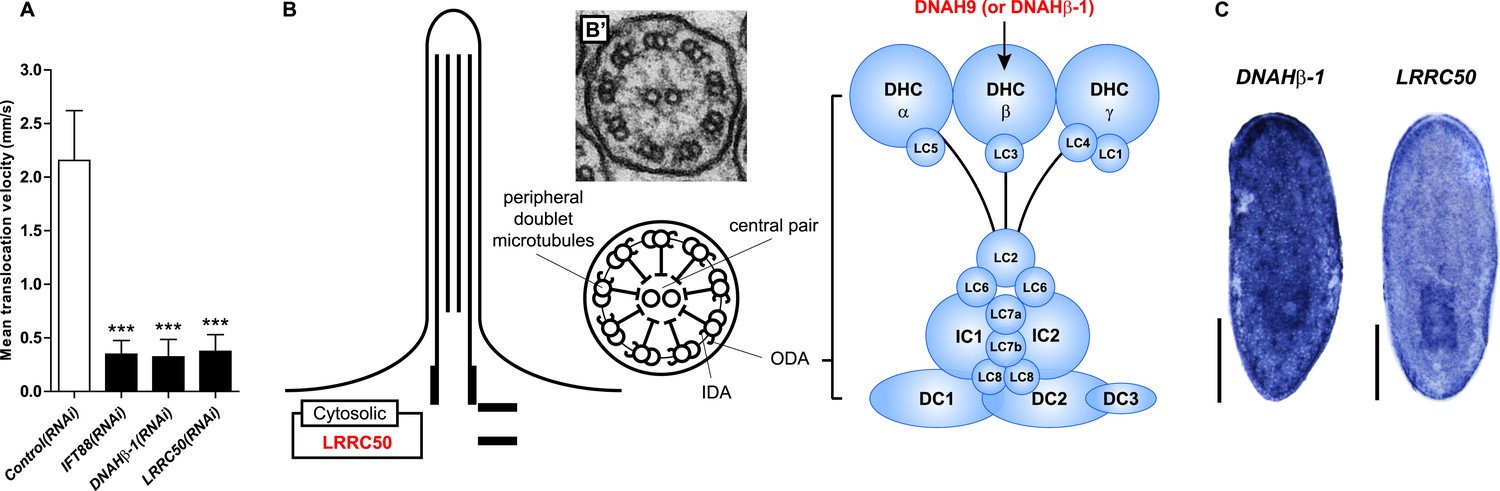
Primary Ciliary Dyskinesia (PCD) genes in the planarian S. mediterranea.
(A) Quantification of translocation speed in indicated RNAi animals. Error bar, SD; *** p < 0.001 vs control. (B) Schematic drawing shows the structure of 9 + 2 motile cilia in planarians. Right panel: schematic representation of the expanded view of the ODA depicts several light, intermediate, and heavy chains. The planarian homologs of human PCD genes with the ODA defects indicated in this study are labeled in red (DNAHβ-1 and LRRC50). (B′) TEM image shows cross-section through a cilium of the protonephridial tubule. IDA, inner dynein arm; ODA, outer dynein arm; DHC, dynein heavy chain; LC, dynein light chain; IC, dynein intermediate chain; DC, docking complex. (C) Whole-mount expression patterns of DNAHβ-1 and LRRC50 by in situ hybridization. Scale bars: 500 μm.
Figure 7—figure supplement 2
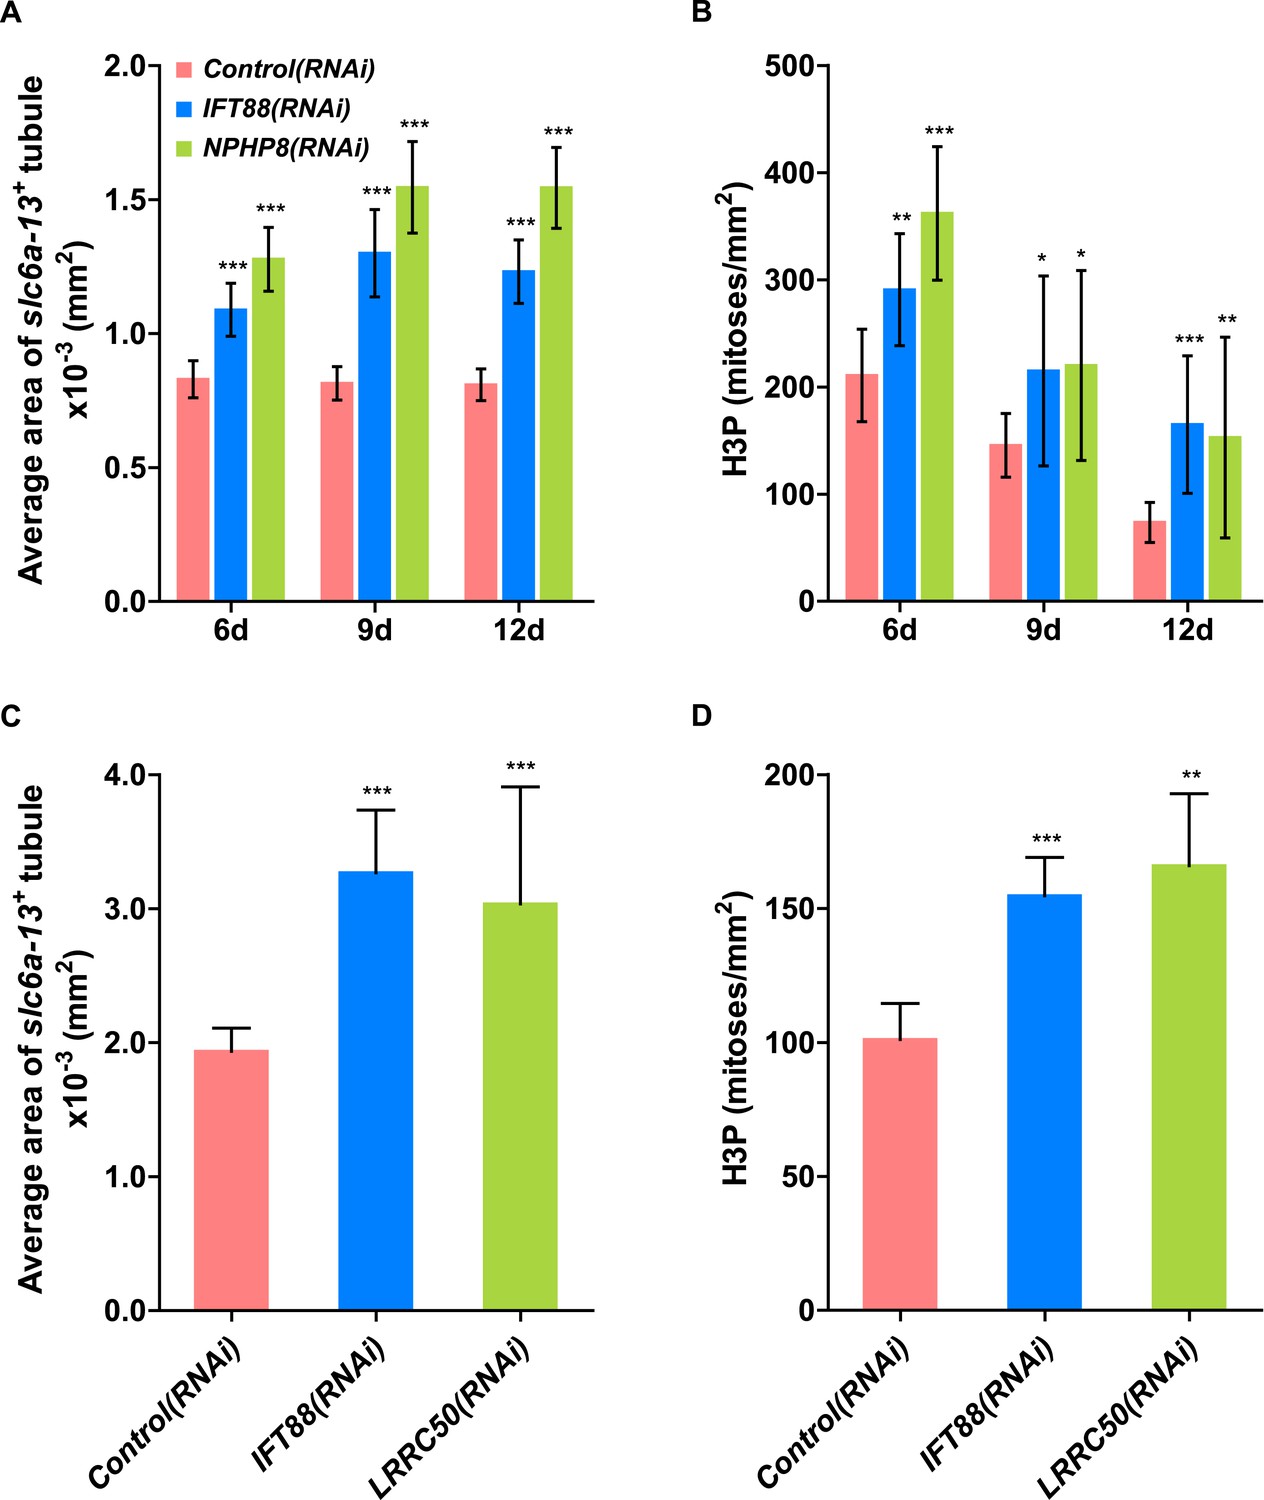
Cystogenesis in planarian protonephridia under IFT88(RNAi) is correlated with increased proliferation.
(A) Quantification of average area of each slc6a13+ tubule (right) in Control(RNAi), IFT88(RNAi) and NPHP8(RNAi) animals to evaluate the severity of protonephridial cystogenesis. (B) Quantification of mitoses in Control(RNAi), IFT88(RNAi) and NPHP8(RNAi) animals. NPHP8(RNAi) animals served as a positive control in this set of experiment. The time points in the bar graph indicate the number of day after the last dsRNA introduction. (C) Quantification of average area of each slc6a13+ tubule (right) in Control(RNAi), IFT88(RNAi) and LRRC50(RNAi) animals to evaluate the severity of protonephridial cystogenesis. (D) Quantification of mitoses in Control(RNAi), IFT88(RNAi) and LRRC50(RNAi) animals. * p < 0.05; ** p < 0.01; *** p < 0.001 vs control.
Videos
Video 1
Protonephridial collecting duct opens to the dorsal epithelia.
Serial TEM images showing the protonephridial collecting duct connected to the dorsal epithelia.
Video 2
Flame cell morphology in Control(RNAi) animal.
Serial TEM images showing flame cell in Control(RNAi) animal.
Video 3
Flame cell morphology in NPHS1-6(RNAi) animal.
Serial TEM images showing flame cell in NPHS1-6(RNAi) animal.
Video 4
3D rendering of normal protonephridial tubule in Control(RNAi) animal.
https://doi.org/10.7554/eLife.07405.037
Video 5
3D rendering of cystic-like protonephridial tubule in NPHP8(RNAi) animal.
https://doi.org/10.7554/eLife.07405.038
Video 6
Cilia beating in Control(RNAi) animal.
Serial images show beating of the cilia along the lateral body edge of the planarian head region in Control(RNAi) animal.
Video 7
Cilia beating in DNAHβ-1(RNAi) animal.
Serial images show beating of the cilia along the lateral body edge of the planarian head region in DNAHβ-1(RNAi) animal.
Video 8
Cilia beating in LRRC50(RNAi) animal.
Serial images show beating of the cilia along the lateral body edge of the planarian head region in LRRC50(RNAi) animal.
Additional files
-
Supplementary file 1
Summary information of the planarian homologs of slc genes.
- https://doi.org/10.7554/eLife.07405.049
-
Supplementary file 2
Expression domains of slc genes in the planarian protonephridia.
- https://doi.org/10.7554/eLife.07405.050
-
Supplementary file 3
Expression domains of slc genes in the rodent metanephros.
- https://doi.org/10.7554/eLife.07405.051
-
Supplementary file 4
Summary information of the planarian homologs of human kidney disease genes.
- https://doi.org/10.7554/eLife.07405.052
Download links
A two-part list of links to download the article, or parts of the article, in various formats.
Downloads (link to download the article as PDF)
Open citations (links to open the citations from this article in various online reference manager services)
Cite this article (links to download the citations from this article in formats compatible with various reference manager tools)
Stem cells and fluid flow drive cyst formation in an invertebrate excretory organ
eLife 4:e07405.
https://doi.org/10.7554/eLife.07405


