Cutting Edge: Lessons from Fraxinus, a crowd-sourced citizen science game in genomics
- The Sainsbury Laboratory, United Kingdom
- Fraxinus - Ash Dieback Game Community, United Kingdom
- John Innes Centre, United Kingdom
- Norfolk Wildlife Trust, United Kingdom
- The Genome Analysis Centre, United Kingdom
- Team Cooper, United Kingdom
Figures
Figure 1 with 3 supplements
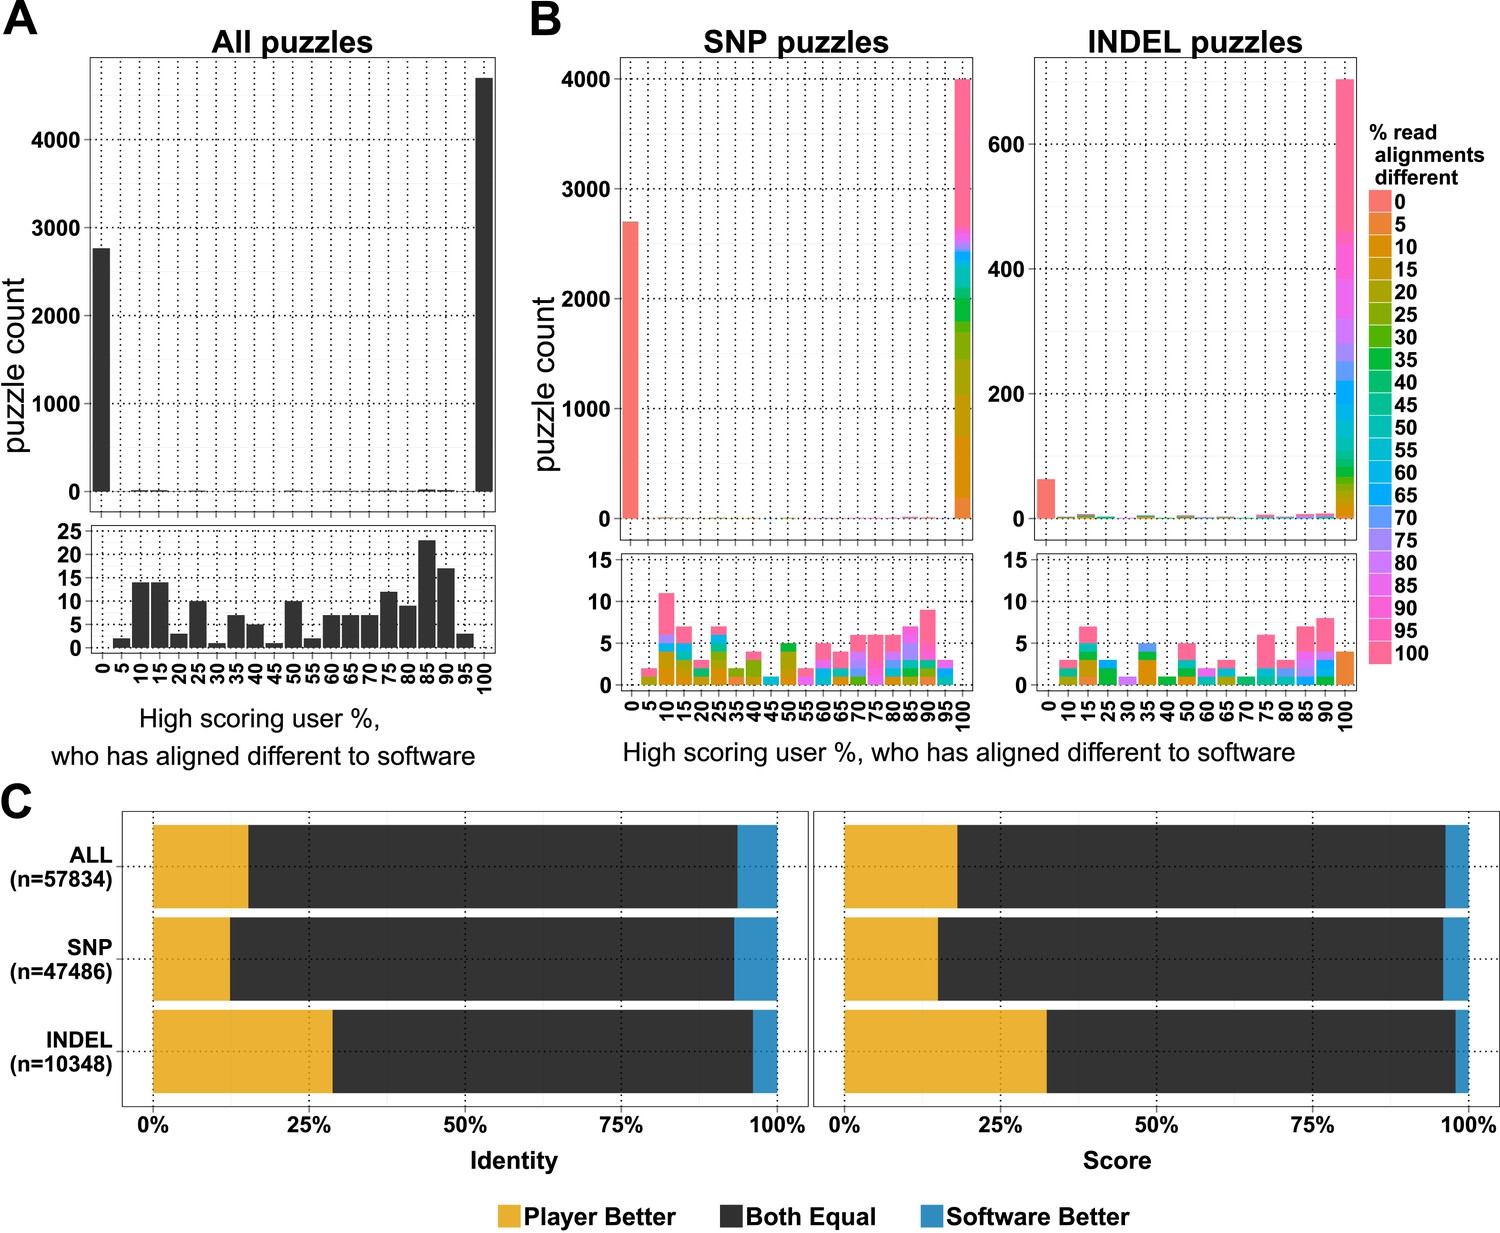
Comparison of player and software alignments for 7260 selected puzzles.
(A) Number of puzzles (y-axis) vs percentage of high-scoring players who produce alignments different to the alignment produced by the BWA mem software (x-axis): in 4701 of these puzzles, the alignments produced by all of the high-scoring players were different to the alignment produced by the software (rightmost column; difference = 100%); in 2765 of puzzles, the alignments produced by all of the high-scoring players were the same as the alignment produced by the software (leftmost column; difference = 0%). Only a small number of puzzles (154) were between these two extremes (see lower panel, which expands the y-axis for differences between 5% and 95%). (B) Single nucleotide polymorphism (SNP) and insertion–deletion polymorphism (INDEL) puzzles presented separately and color coded with a heat map depicting the percent of read alignments contributing to the difference between player and software. (C) Comparison of alignments from the 4701 puzzles that had all high-scoring players aligned different to the software: the left panel is based on percent identity between sequences; the right panel is based on the Fraxinus game score (see Fraxinus game setup in ‘Materials and methods’).
Figure 1—figure supplement 1
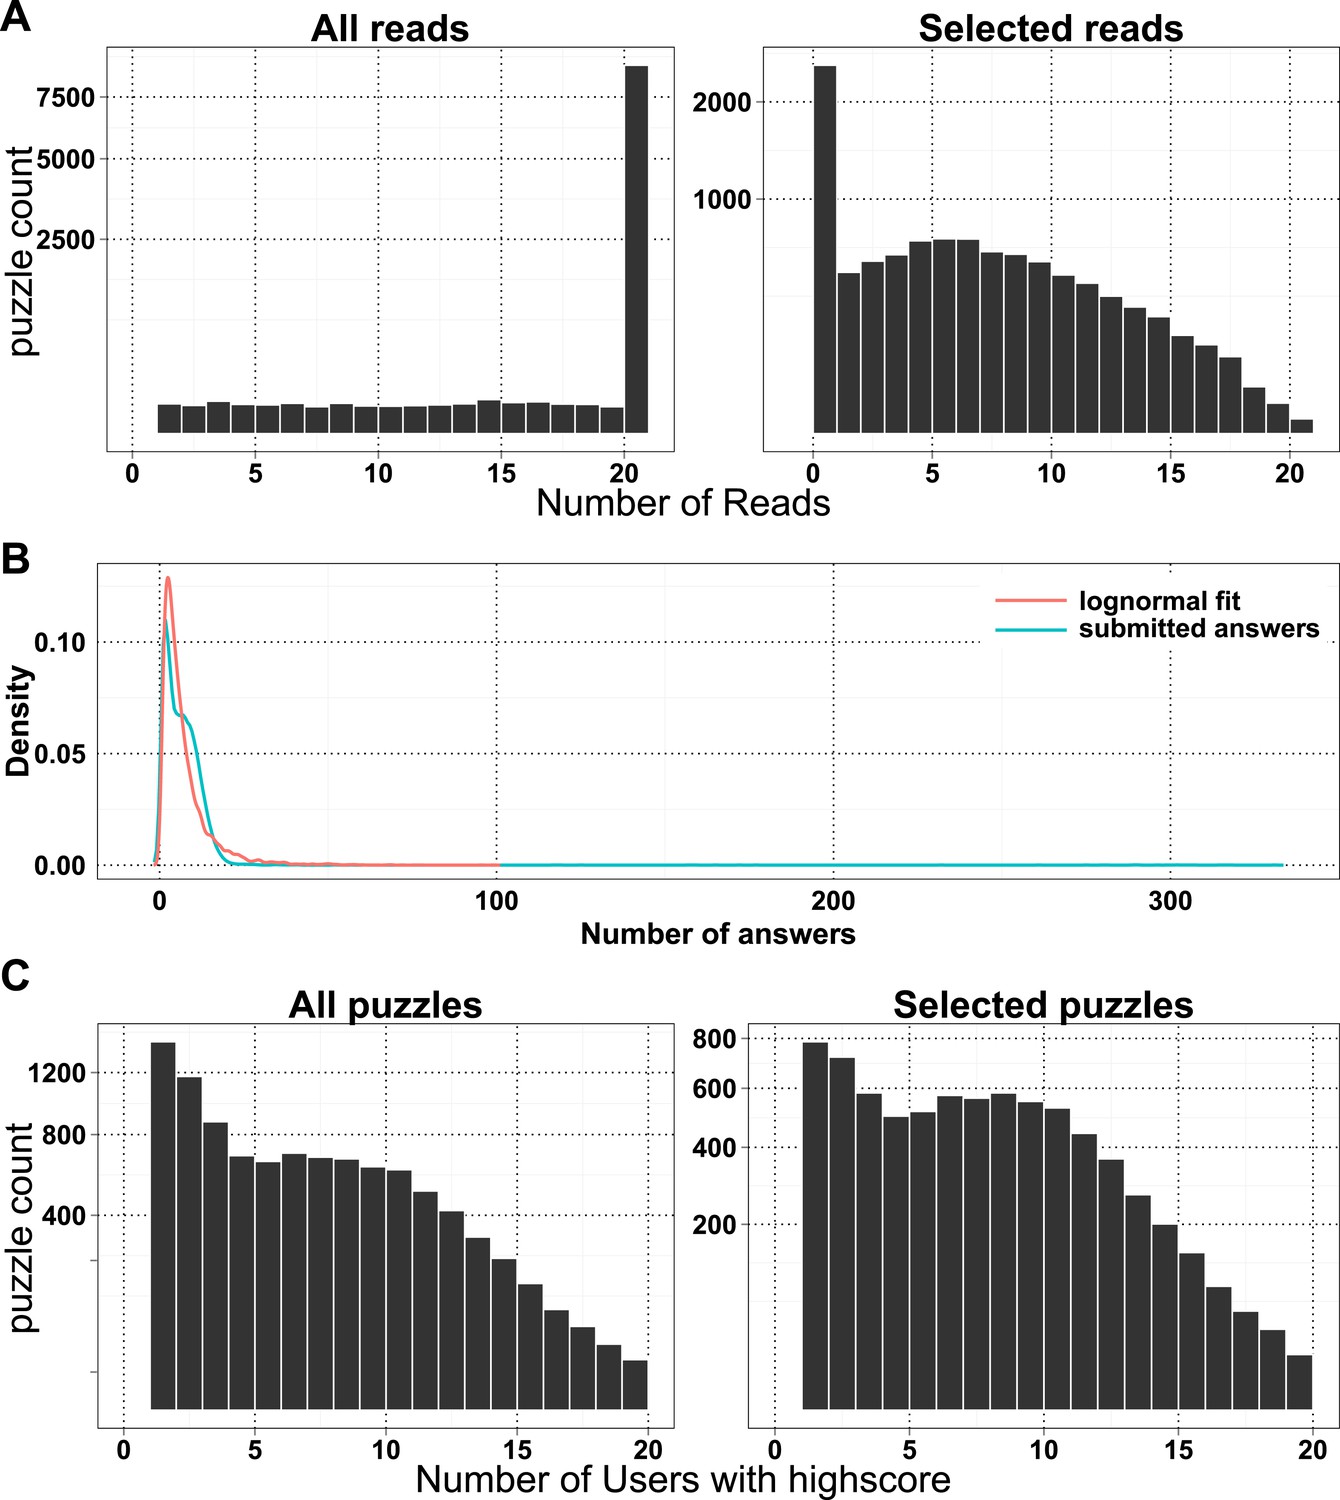
Number of reads, answers, and players per puzzle.
(A) A number of reads per puzzle are presented for all puzzles (left) and selected puzzles for analysis (right). (B) Density plot of all submitted answers and log-normal fit of the distribution. (C) A number high-scoring players per puzzle are presented for all puzzles (left) and selected puzzles for analysis (right).
Figure 1—figure supplement 2
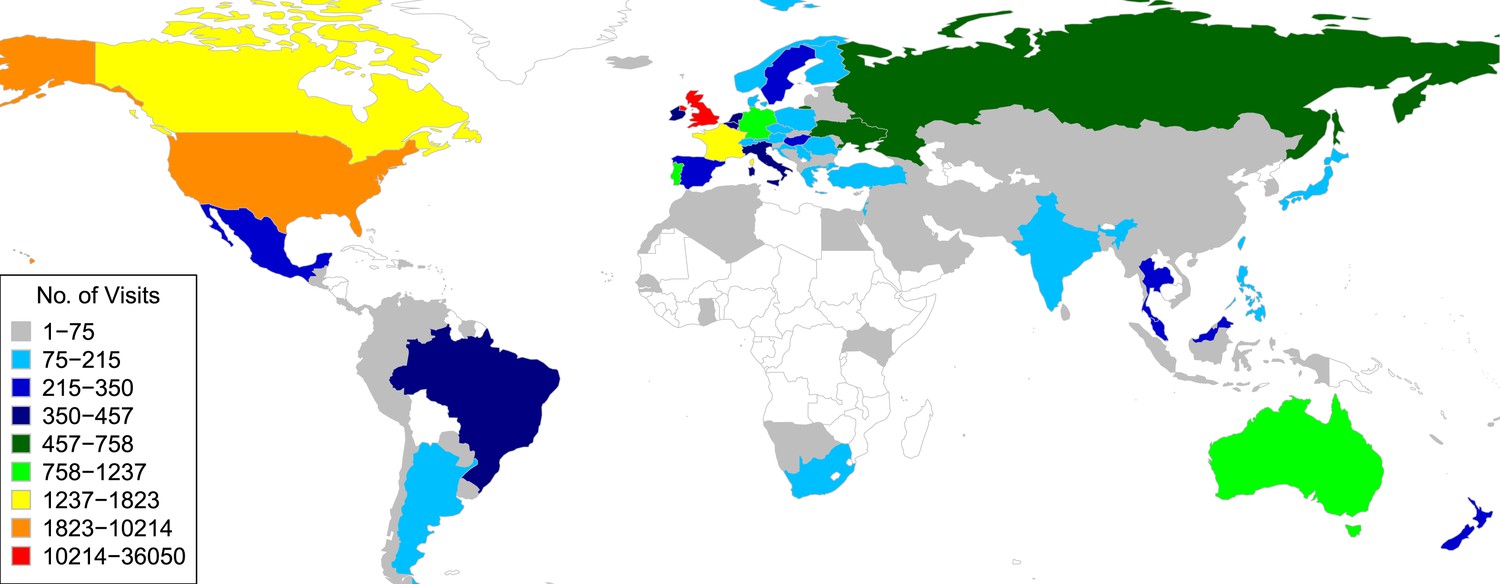
Global distribution of Fraxinus game players; a number of visits are color coded.
https://doi.org/10.7554/eLife.07460.006
Figure 1—figure supplement 3
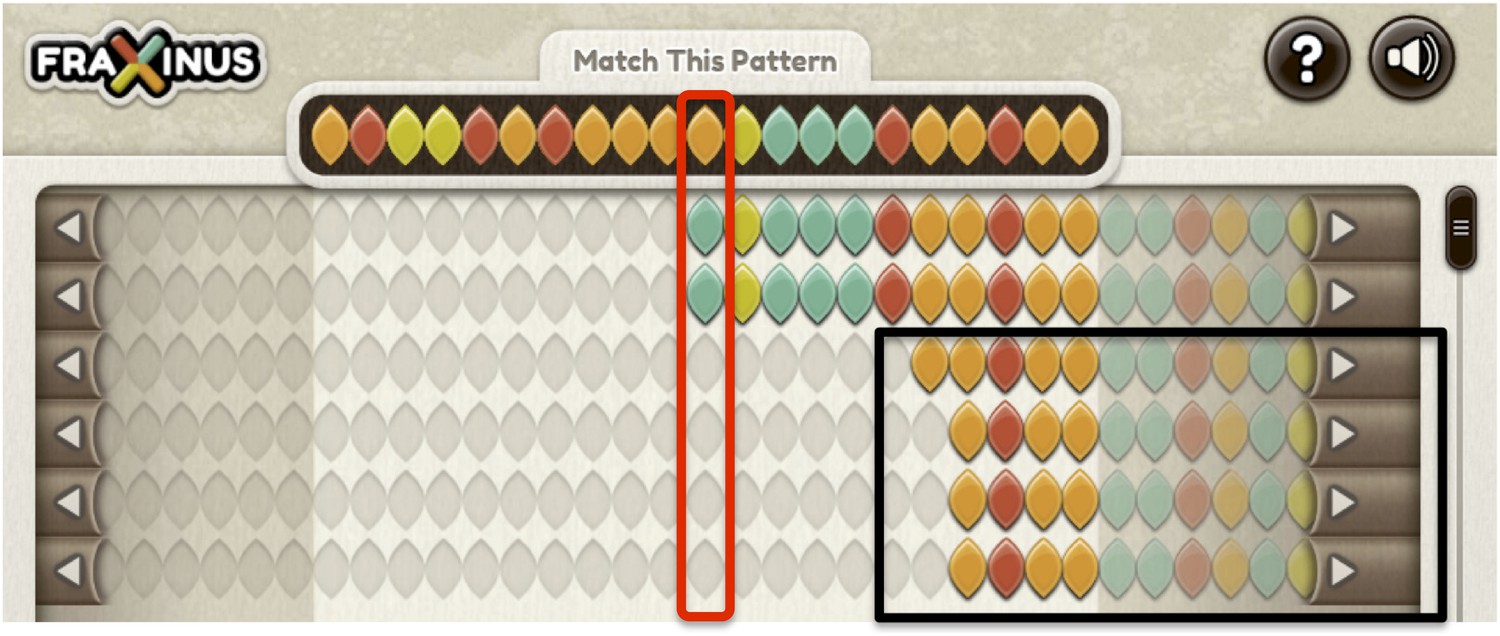
Selecting reads covering the variant allele.
Reads covering the variant base in red box are selected, while the reads in black box are ignored.
Figure 2 with 2 supplements
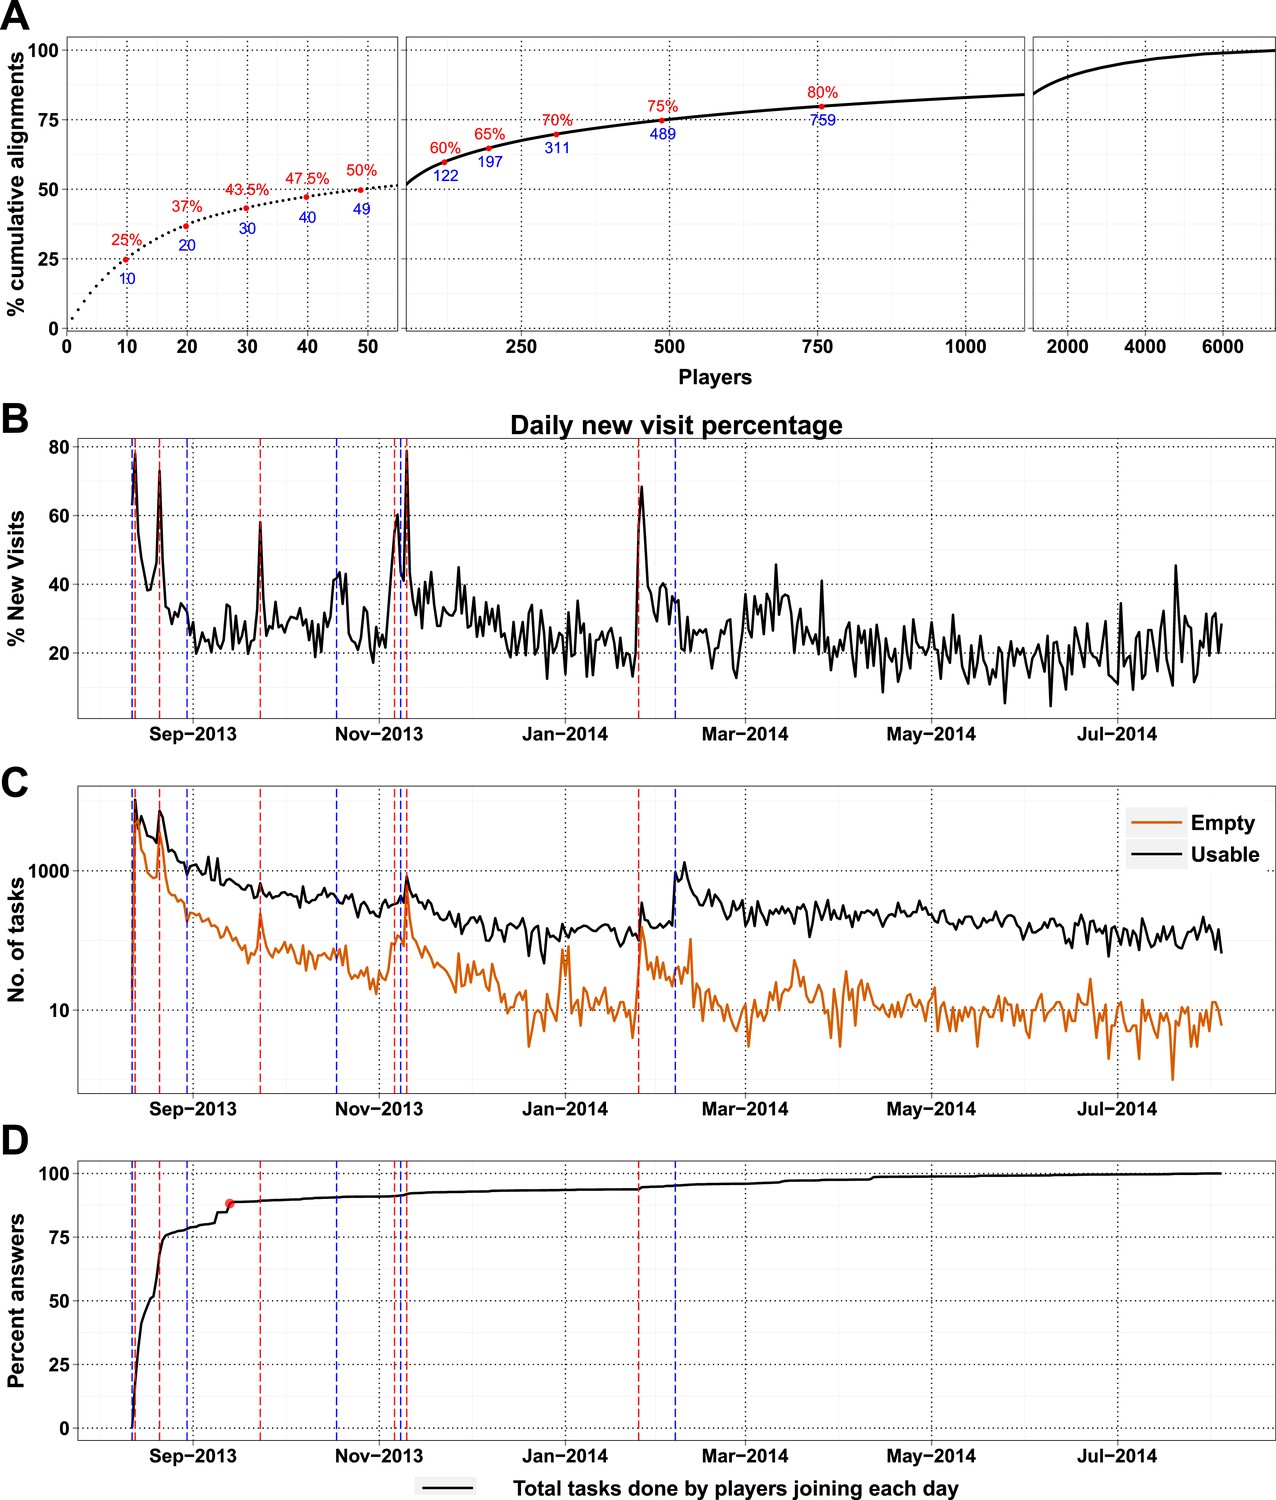
High-scoring players and press releases.
(A) Cumulative contribution by players is plotted against player rank (based on the number of useful answers the player contributed): the ten best players contributed 25% of useful answers. (B) Percent of new visits received daily to Fraxinus vs date, with dashed red lines representing press releases and dashed blue lines representing mention on social media. (C) Number of usable (black line) and empty (orange line) tasks provided by players vs date. Press releases led to prominent peaks in the number of empty tasks and less prominent peaks in the number of usable tasks. (D) Cumulative contribution (by all players) vs date: 88% of the answers were provided within the first month (red dot).
Figure 2—figure supplement 1
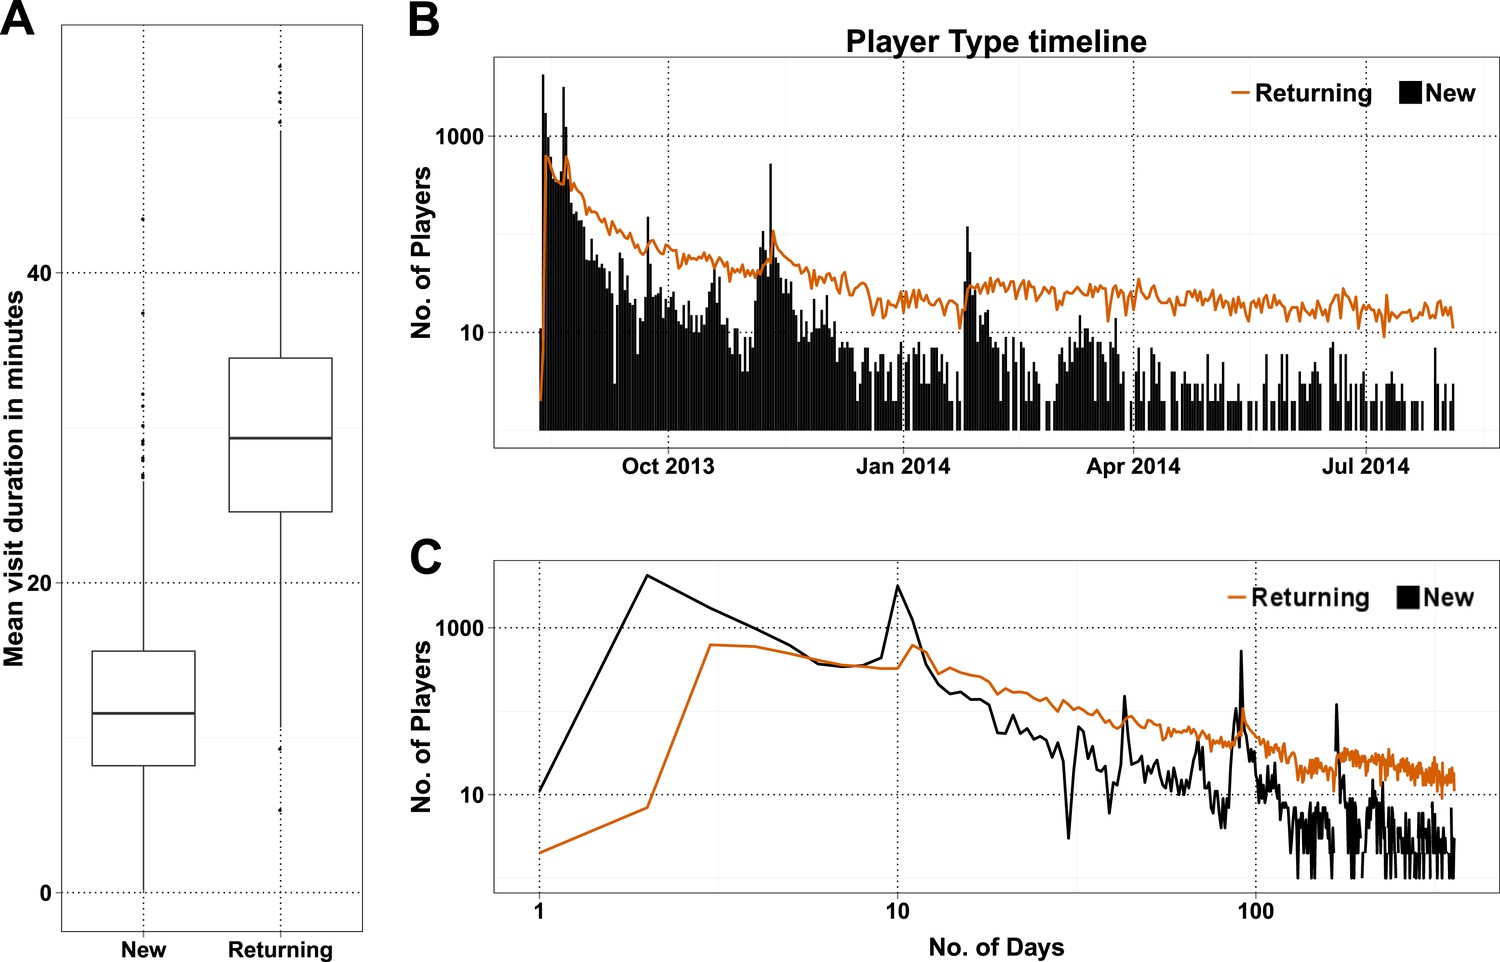
NPs and returning players (RPs) in Fraxinus.
(A) Box plot of mean visit duration in minutes presented for NPs and RPs. (B) Daily NP (black bars) and RP (orange line) player numbers visiting the Fraxinus game page. (C) Same as B, presented in log–log scale for both NPs and RPs.
Figure 2—figure supplement 2
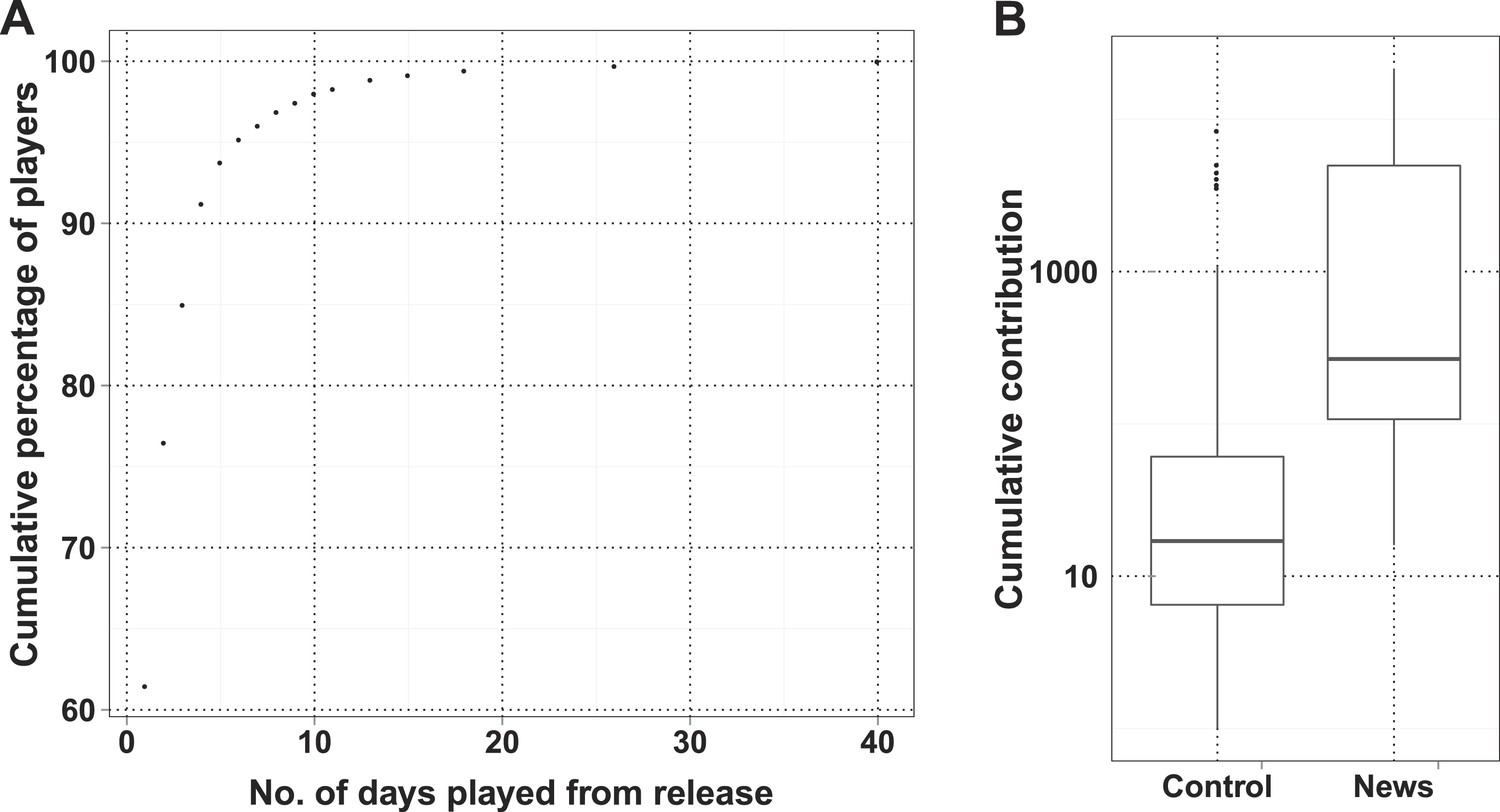
Characteristics of players joining on press release dates.
(A) Cumulative percent of players joining on press release dates plotted against number of days they are active. (B) Box plot of number of useful tasks performed by players joining on either press release date (News) and remaining dates (Control). As majority of players joined within the first month, players who joined after 15 September 2013 were taken in to account for this box plot.
Figure 3 with 3 supplements
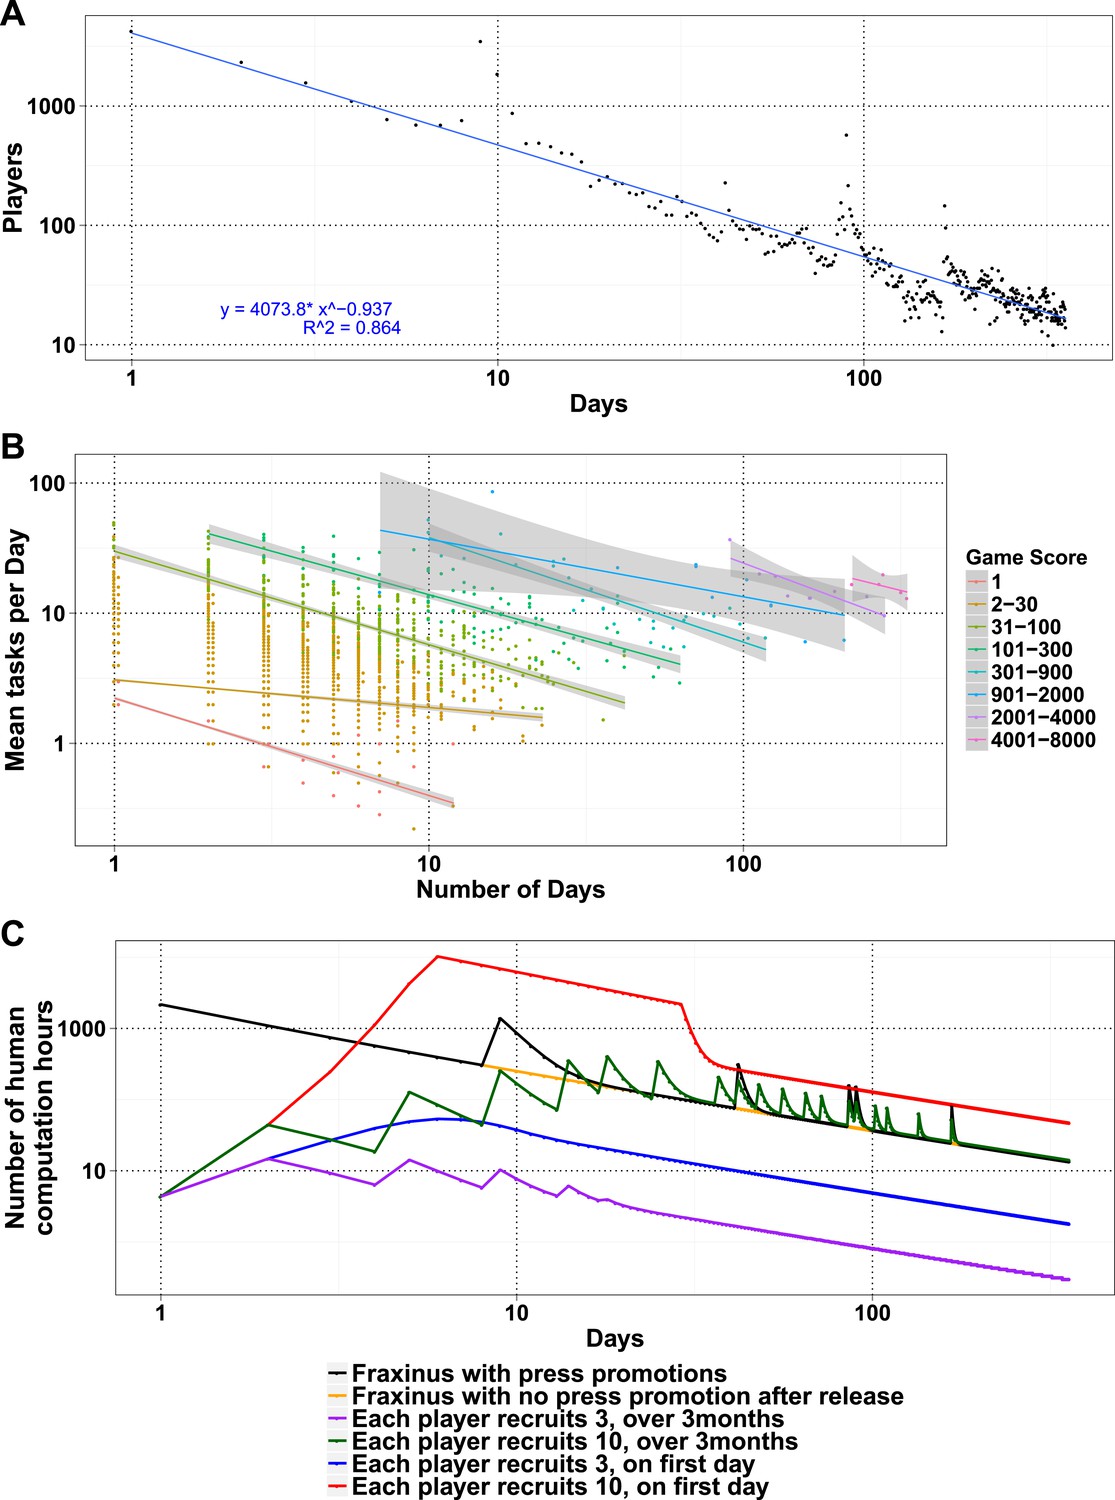
Modeling human computation for citizen science projects.
(A) Actual data showing number of players on each day (y-axis) vs time in days since game release (x-axis) for Fraxinus. The observed distribution of players visiting the game page daily is fitted to a linear model on log scales. (B) The enthusiasm of players decreases irrespective of their success at the game. The mean number of tasks completed per day (y-axis) is plotted against the number of days, the players were active (x-axis) for groups of players in similar score groups (color coded based on their scores); contribution decreases over time for all groups. (C) Predictions from a model that predicts work done (measured in computation hours; y-axis) as a function of days since game release (x-axis) for six different scenarios: Fraxinus with press releases at and after launch (black); with a press release at launch, but no subsequent press releases (orange); each player recruits three new players (NPs) over a period of 3 months (purple); each player recruits 10 NPs over a period of 3 months (green); each player recruits three NPs on first day (blue); and each player recruits 10 NPs on first day (red).
Figure 3—figure supplement 1
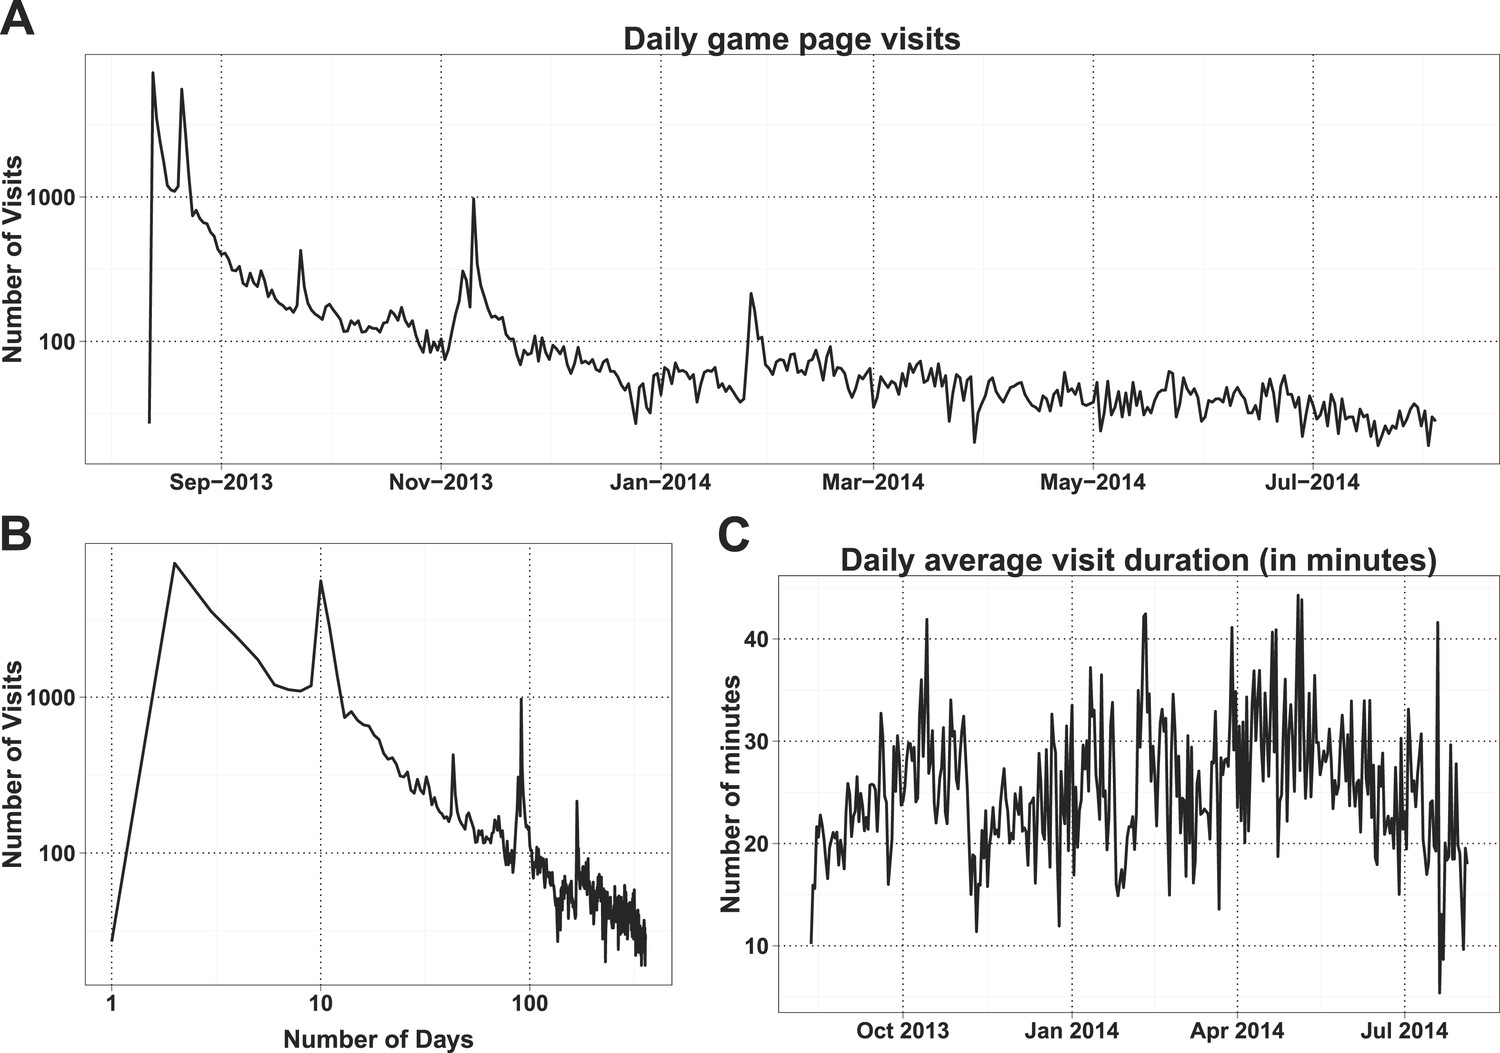
Daily distribution of Fraxinus game visits.
(A) Daily game page visits are presented along the game time line. (B) Same as A, presented in log–log scale. (C) Daily average visit duration per session presented along the game time line.
Figure 3—figure supplement 2
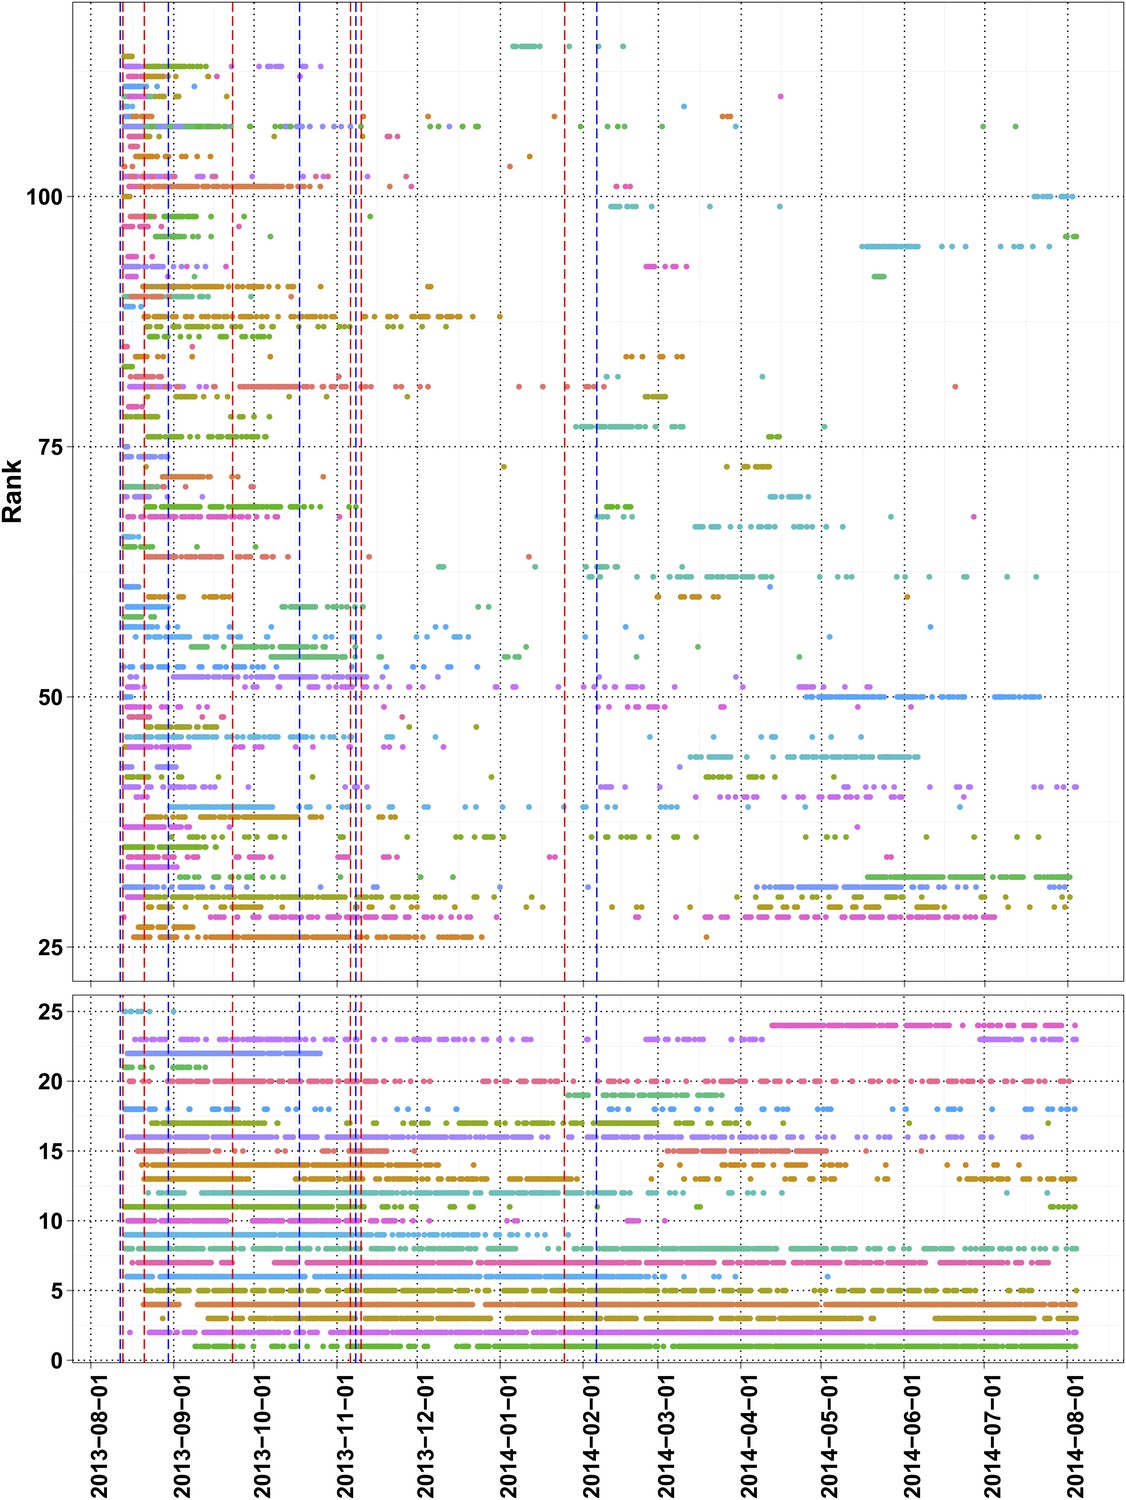
Task time line of top 120 players with more than 100 useful answers.
Traditional press releases (red lines) and social network mentions (blue lines) are marked.
Figure 3—figure supplement 3
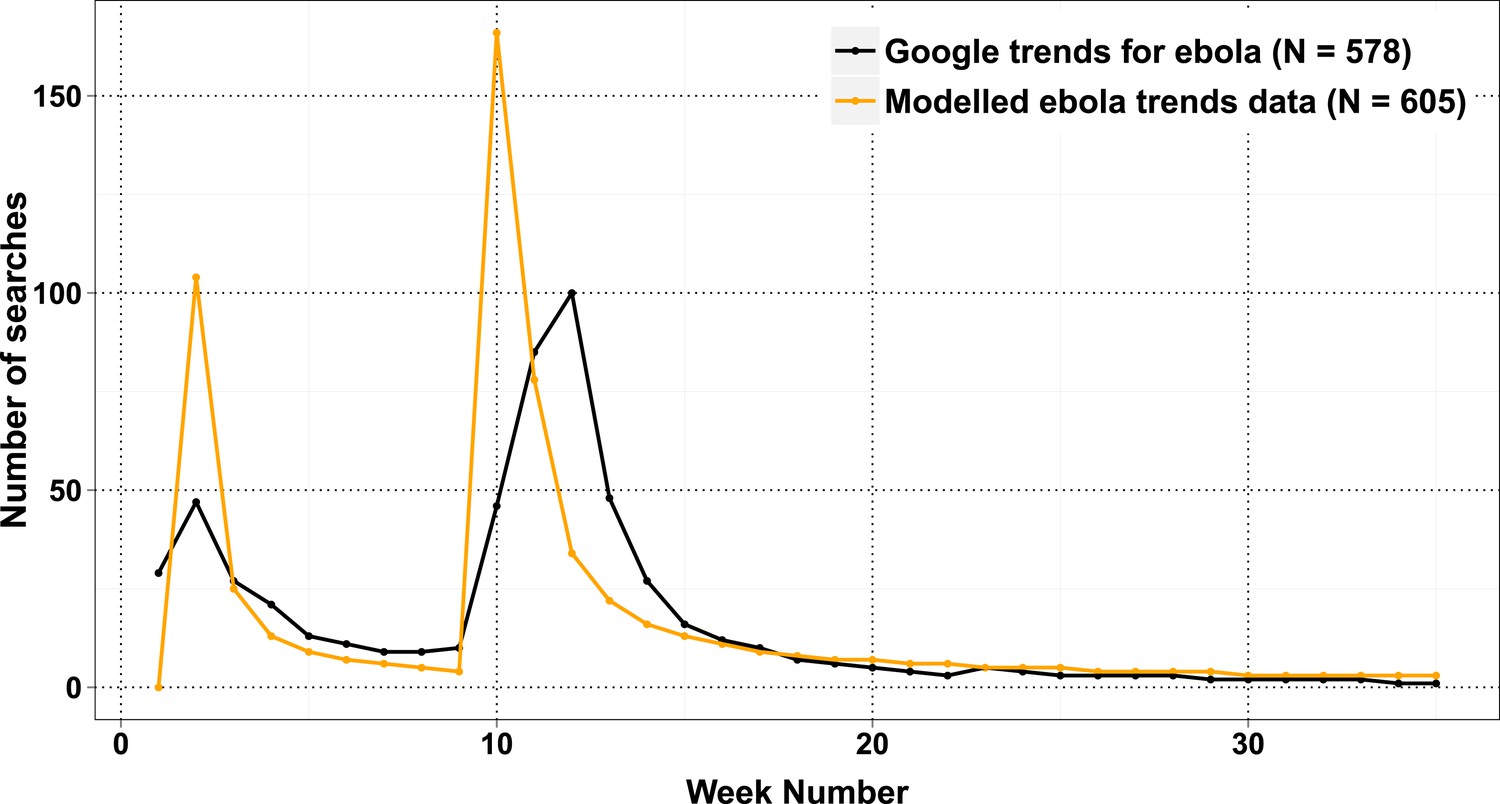
Change in interest in the search term ‘Ebola’ from Google (http://www.google.co.uk/trends/explore#q=ebola&date=4%2F2014%2010m&cmpt=q&tz=) and the predictions for the same from the linear model derived.
https://doi.org/10.7554/eLife.07460.015Tables
Table 1
Number of variants and derived puzzles used in Fraxinus version 1
| Fungal sample | SNP | INDEL | ||
|---|---|---|---|---|
| Variants | Puzzles | Variants | Puzzles | |
| Ashwellthorpe1 | 250 | 2937 | 53 | 521 |
| Ashwellthorpe2 | 353 | 1121 | 51 | 170 |
| Upton broad and marshes1 | 397 | 4964 | 56 | 374 |
| Total | 1000 | 9022 | 160 | 1065 |
-
SNP, single nucleotide polymorphisms; INDEL, insertion–deletion polymorphism.
Table 2
Details about player visits and contributions made to Fraxinus
| Description | Details |
|---|---|
| Start date | 2013-08-12 |
| Date until | 2014-08-04 |
| Game duration in days | 358 |
| Total number of visits | 63,132 |
| Total number of players | 25,614 |
| Mean new visits % per day | 26.7 |
| Mean visit duration in minutes | 25.3 |
| Total time contributed in days | 924 |
Table 3
Details about categories of players visiting Fraxinus
| Description | No. of players | Percent |
|---|---|---|
| Viewed introduction | 6115 | 23.87 |
| Completed tutorial and scanned puzzles | 7958 | 31.07 |
| Attempted puzzles | 4184 | 16.33 |
| Scored puzzles | 7357 | 28.72 |
| Total players | 25,614 | 100 |
Additional files
-
Supplementary file 1
Table S1: details of alignment answers received for the Fraxinus version 1. Table S2: comparison of the alignments that were aligned differently to software by players. Table S3: details of news articles, press releases, and social network mentions promoting Fraxinus game. Table S4: details about most active players contributing to Fraxinus. Table S5: list of players agreed to be included as authors under ‘Fraxinus Players’.
- https://doi.org/10.7554/eLife.07460.016
Download links
A two-part list of links to download the article, or parts of the article, in various formats.
Downloads (link to download the article as PDF)
Open citations (links to open the citations from this article in various online reference manager services)
Cite this article (links to download the citations from this article in formats compatible with various reference manager tools)
Cutting Edge: Lessons from Fraxinus, a crowd-sourced citizen science game in genomics
eLife 4:e07460.
https://doi.org/10.7554/eLife.07460


