Correction: Structural basis for the prion-like MAVS filaments in antiviral innate immunity
- University of Texas Southwestern Medical Center, United States
- CryoEM Shared Resources, Janelia Farm Research Campus, Howard Hughes Medical Institute, United States
- Howard Hughes Medical Institute, University of Texas Southwestern Medical Center, United States
Figures
Figure 1

Analyses of high-resolution cryoEM images of MAVS CARD filaments.
(A) A representative EM image after motion correction. (B) The power spectrum of a motion-corrected image showing Thon rings up to ∼3 Å (bottom arrow), with the CTF fittings (white concentric rings) exhibited as white flat annuli over the power spectrum. The CTF fitting was done with CTFFIND4. (C) The quality of the CTF fitting was evaluated by comparing the rotationally averaged amplitudes from the Thon rings (green trace) with the averaged amplitudes of the fitted CTF function (dashed yellow trace). The Thon rings are visible to ∼3 Å, and the fitting is good to at least ∼4 Å (top arrow in B). (D) Representative class averages of the new dataset showing some fine structural features. The classification was done with Relion 2D classification. (E) Summed power spectra of filaments with less than 5° of out-of-plane tilt in the last step of refinement. Layer lines 9 and 32 (meridional) are labeled (yellow arrows). The contrast is enhanced to show layer line 32. The middle portion of the power spectrum is shown as a zoomed-in view to the top with layer lines 4 and 9 labeled. (F) Summed power of projections from the C1 map along 360 different directions normal to its helical axis.
Figure 2
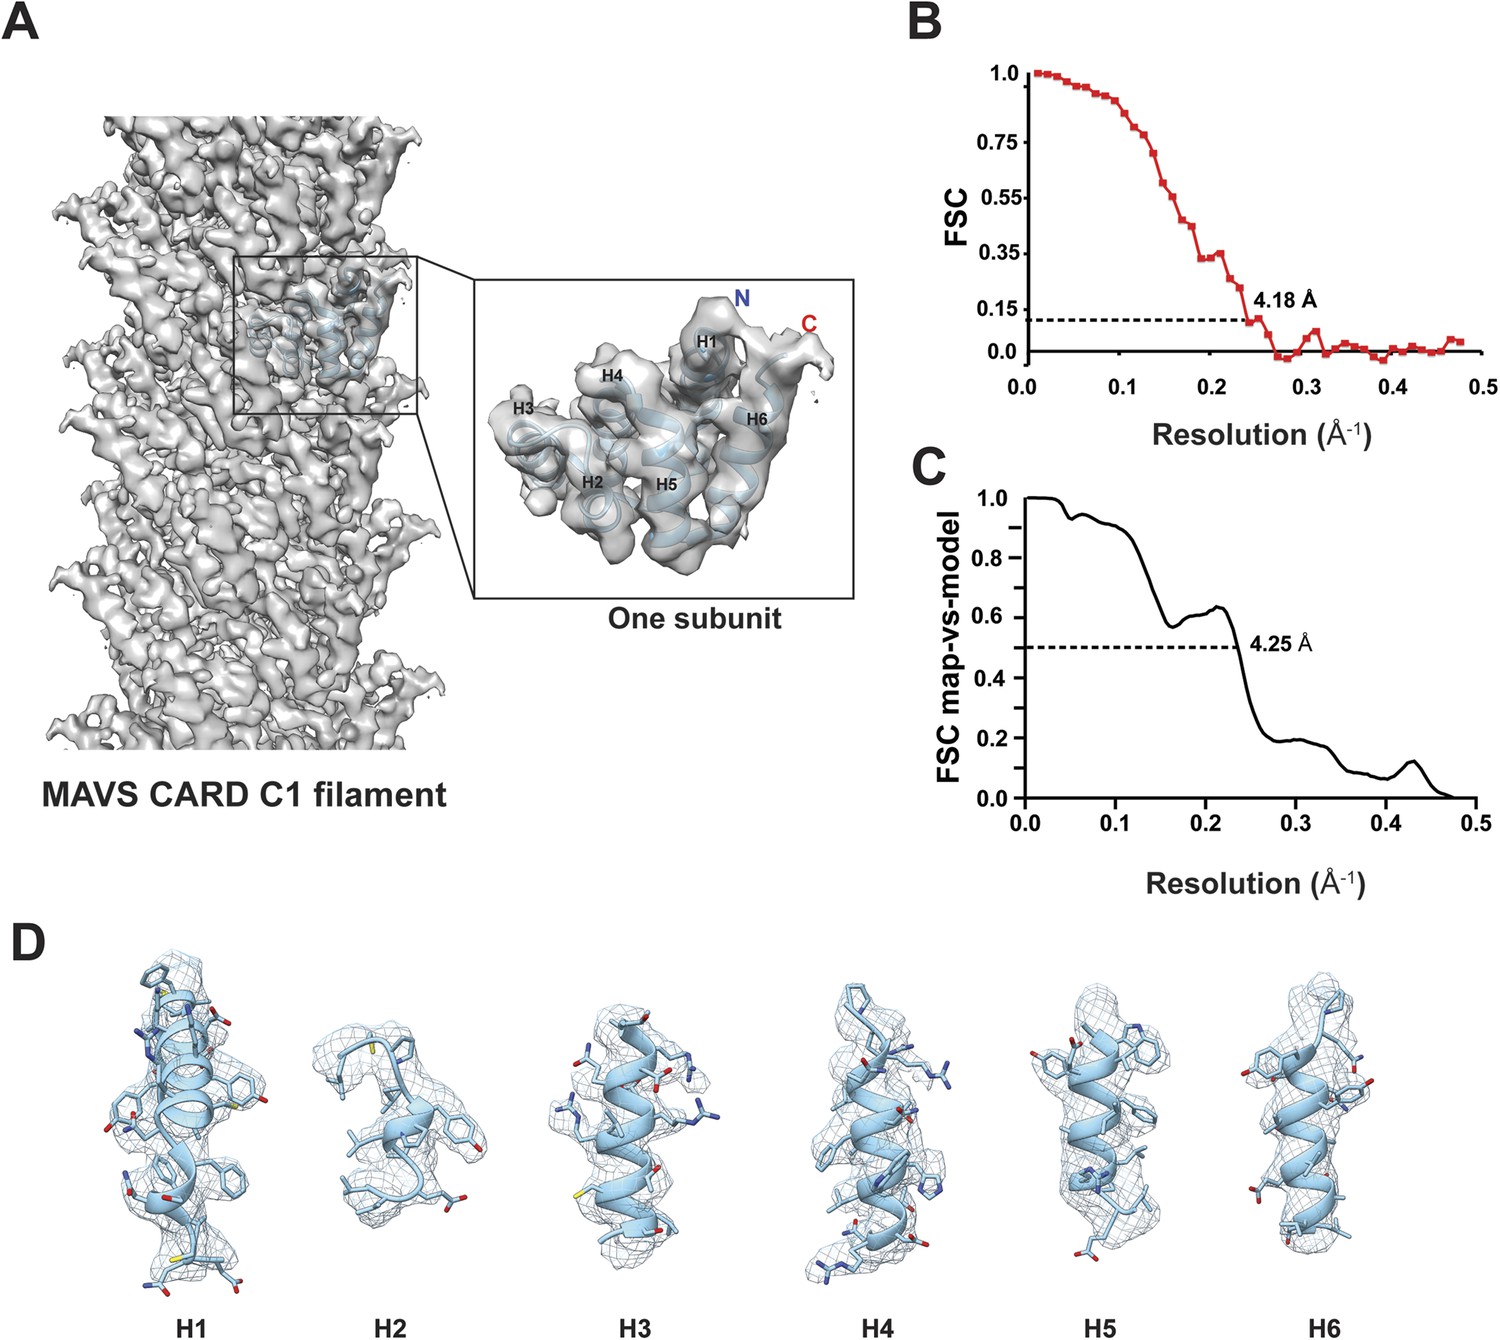
Molecular modeling based on the near-atomic resolution cryoEM map.
(A) A side view of the cryoEM map with an atomic model of human MAVS CARD docked as a rigid body (blue: atomic model of residues 1–97, PDB: 3J6J). The N- and C- termini face the periphery of the filament. (B) Gold-standard Fourier Shell Correlation (FSC) curve between maps calculated from the top and bottom two halves of the selected data. The dashed line points to the estimated resolution of 4.18 Å at FSC = 0.143. (C) FSC between the segmented cryoEM map of one CARD and the map calculated from the atomic model (PDB: 3J6J, residues 1–97). The 0.5 thresholding yielded an estimated resolution of 4.25 Å. (D) Zoomed-in views of the six α-helices with side chains shown as stick models and superimposed with the EM density (grey mesh).
Figure 3

Molecular interfaces of the pseudoatomic model based on the C1 map.
(A) A model of the MAVS CARD filament based on the cryoEM map, showing three helical turns. Each MAVS CARD interacts with six nearest neighbors: two neighbors along the helical trajectory (grey and yellow), and four neighbors between helical turns (grey and cyan, grey and orange). (B, C) Details of interactions at type I and II interfaces. Residues at the interfaces are shown as stick models. (D) The segmented cryoEM map with two MAVS CARD molecules and a magnified view of type II interface with clear EM density for W56 and R43. (E) Important residues at type III interface shown as stick models.
Videos
Video 1
CryoEM structure of the MAVS CARD filament.
https://doi.org/10.7554/eLife.07546.003Download links
A two-part list of links to download the article, or parts of the article, in various formats.
Open citations (links to open the citations from this article in various online reference manager services)
Cite this article (links to download the citations from this article in formats compatible with various reference manager tools)
Correction: Structural basis for the prion-like MAVS filaments in antiviral innate immunity
eLife 4:e07546.
https://doi.org/10.7554/eLife.07546


