A native interactor scaffolds and stabilizes toxic ATAXIN-1 oligomers in SCA1
- Baylor College of Medicine, United States
- Texas Children's Hospital, United States
- University of Texas Medical Branch, United States
- Howard Hughes Medical Institute, Baylor College of Medicine, United States
- University of Minnesota, United States
Figures
Figure 1 with 2 supplements

ATXN1 oligomers are located in areas prone to SCA1 degeneration.
(A) Western blot analysis of soluble fractions from cerebella shows the existence of amyloid oligomers exclusively in Atxn1154Q/+ mice model but in neither wild-type nor Atxn1−/− controls. (B) Immunofluoresence studies of Atxn1154Q/+ brain sections using anti-Ataxin-1 (green) and F11G3 (red) confirms the ATXN1 identity of the amyloid oligomers. Scale bar = 15 μm. (C) Western blot using anti-ATXN1 antibody showed that the isolated oligomers (IP with F11G3), were indeed ATXN1 oligomers. These ATXN1 oligomers were IP’d exclusively from Atxn1154Q/+ mouse cerebellum and not from Atxn1−/− controls. (D) AFM analysis showing brain-derived ATXN1 oligomers IP from Atxn1154Q/+ mouse using F11G3. Scale bar 200 nm. (E) Double staining using the Purkinje cell (PC) marker, calbindin (green) and F11G3 (red) revealed that ATXN1 oligomers accumulate in PC dendrites before dendritic degeneration is observed (top panel). With progression of dendritic degeneration, ATXN1 oligomers tend to accumulate in both the cytoplasm and nucleus (middle and bottom panel). Scale bar 30 μm. No degeneration is represented by (−), a low level of degeneration is represented by (+), and advanced degeneration by (++). Mice analyzed were 28 weeks old. (F) Histological staining for ATXN1 (top panel) and oligomers (F11G3, bottom panel) in cerebellum and cortex of Atxn1154Q/+ (left panels) and WT mice (right panels). Scale bar 50 μm.
Figure 1—figure supplement 1
ATXN1 oligomers in SCA1 mouse.
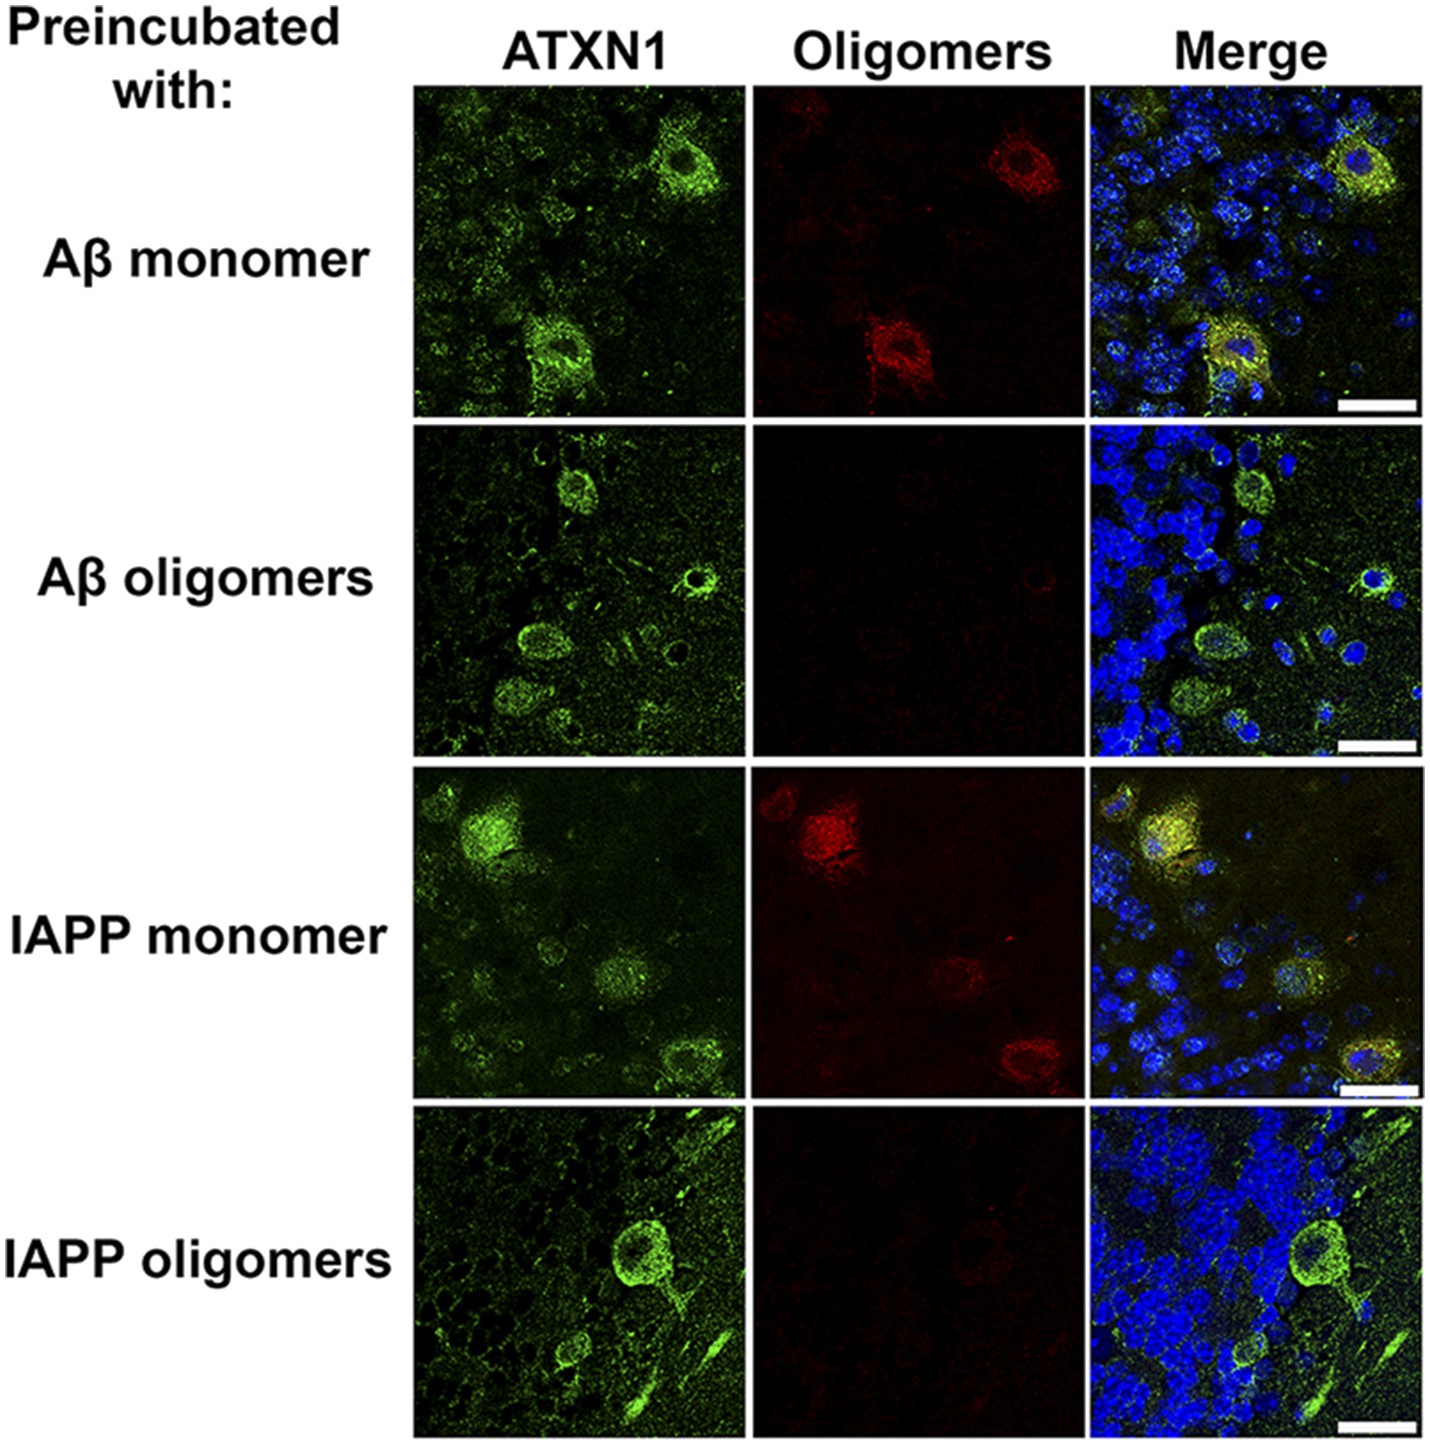
Whenever the antibody F11G3 was preincubated with the antigen Aβ or IAPP oligomers, no immunolabeling was observed in Atxn1154Q/+ sections that were previously positive for oligomers. Double immunofluorescence between anti-ATXN1 antibody (green) and F11G3 (red) preincubated with recombinant oligomers show the positive signal only for ATXN1. Double immunofluorescence between anti-ATXN1 antibody (green) and F11G3 (red) preincubated with recombinant monomers show positive signal for both antibodies. Scale bar 25 μm.
Figure 1—figure supplement 2
ATXN1 oligomers levels are higher in the cerebellum than in the cortex.
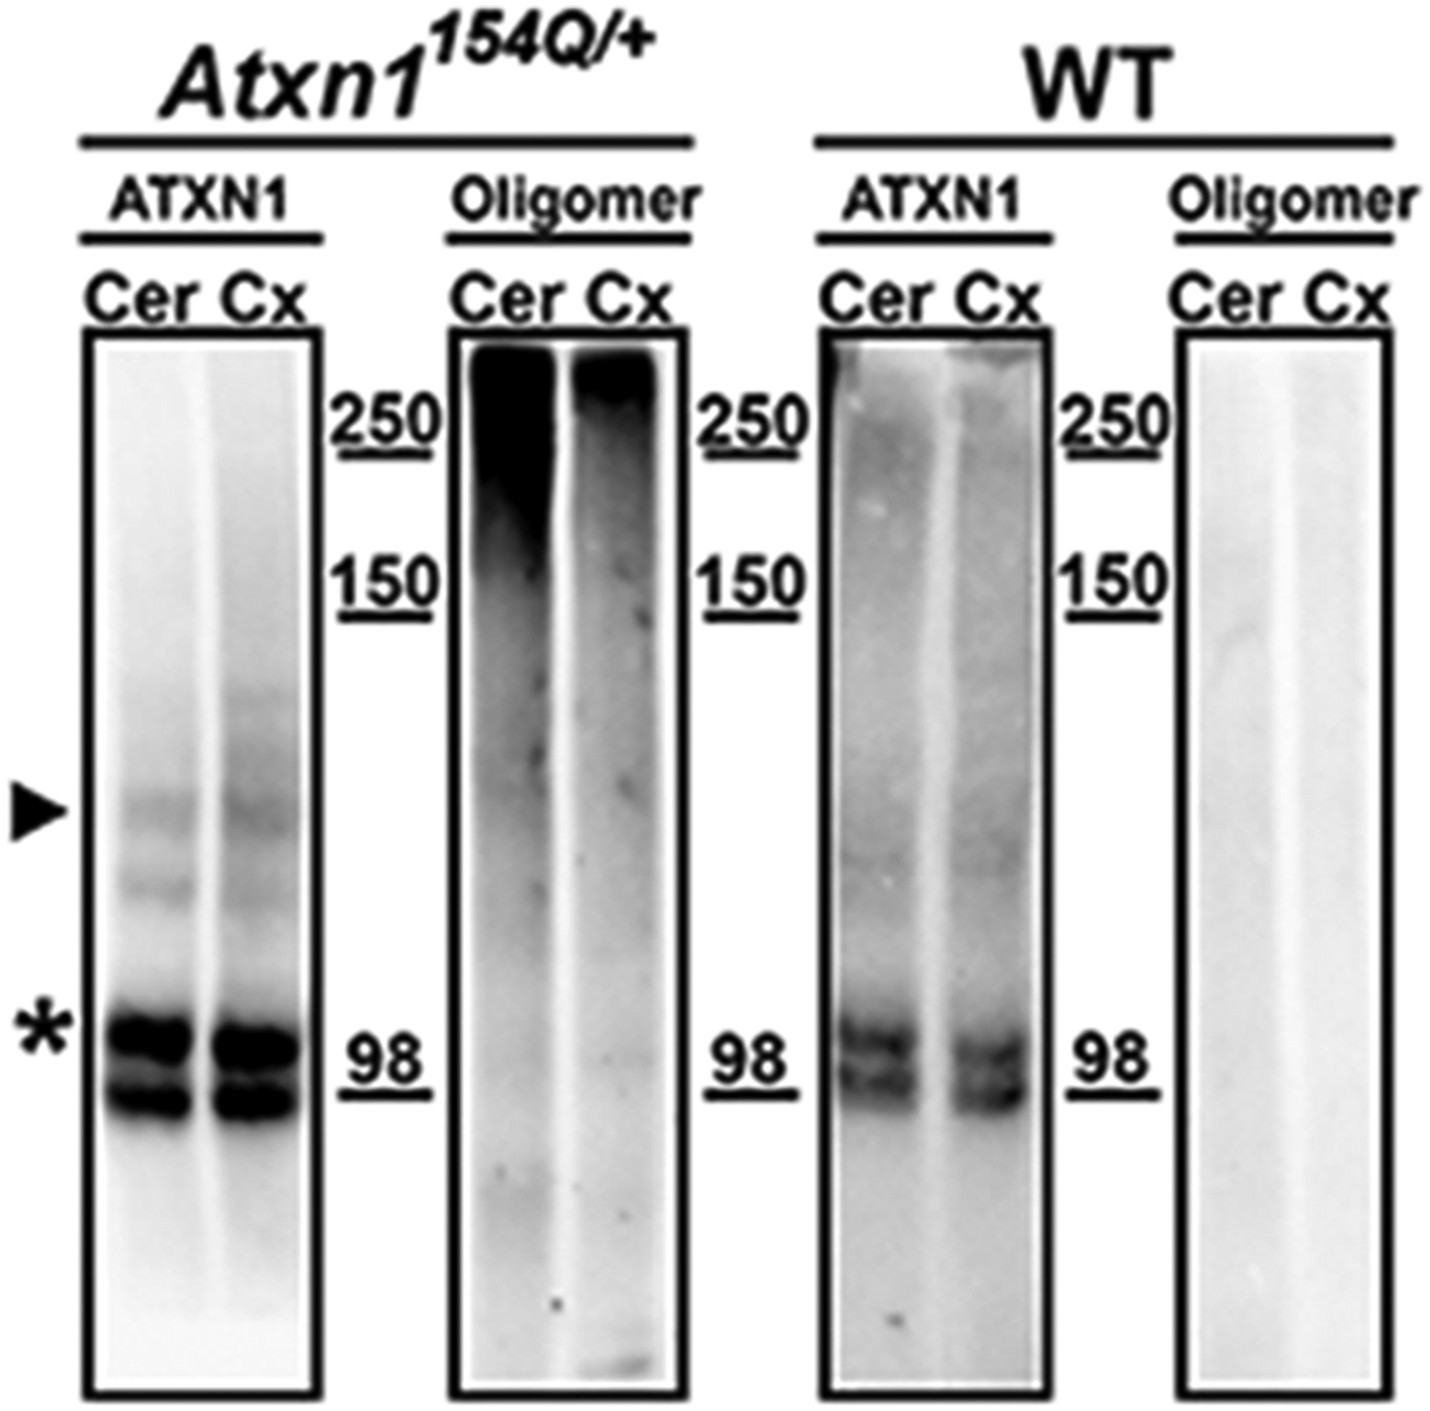
Western blots using F11G3 confirmed higher levels of ATXN1 oligomers in the cerebellum (Cer) than in the cortex (Cx) in the Atxn1154Q/+ mouse. ATXN1 was detected using 11750 antibody; arrowhead corresponded to 154Q ATXN1 band. 2Q ATXN band (*) demonstrated equal amount of loading between the Cer and Cx sample.
Figure 2 with 4 supplements
ATXN1 oligomers form high molecular weight complexes that correlate with motor impairment.
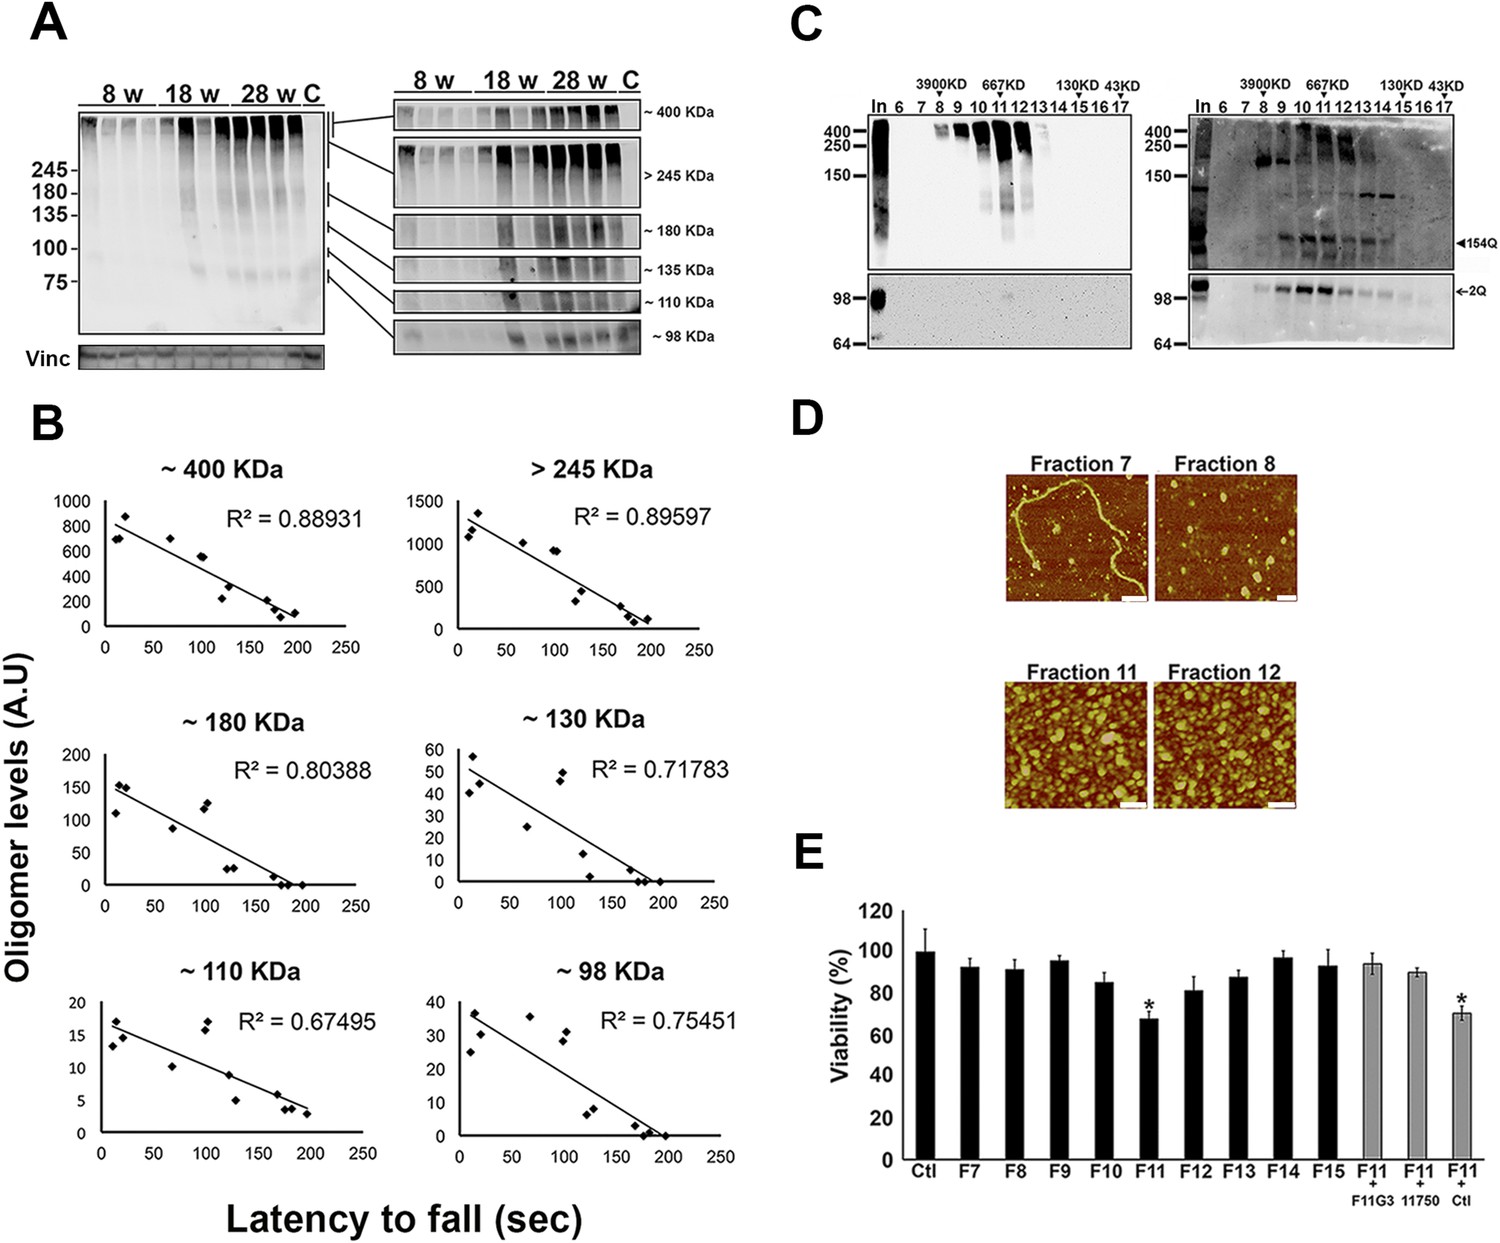
(A) Western blot of cerebellar lysates of 8-, 18- and 28-week old Atxn1154Q/+ mice using F11G3. Right panels indicate cropped regions of the blot with exposure adjusted to permit comparative quantification among mice of different ages. (B) Correlation plots between the different molecular weight oligomers (Figure 1A) and the latency to fall in the rotarod assay in Atxn1154Q/+ mice. Each black dot corresponds to one Atxn1154Q/+ mouse from 1A. (C) Size exclusion chromatography (SEC) from Atxn1154Q/+ mouse cerebellum probed for oligomers (F11G3, left panel) and ATXN1 (11750, right panel). Note that top panels reveal a higher exposure than the bottom panels. In corresponded to Input before fractionation. (D) Representative atomic force microscopy (AFM) pictures from fractions 7, 8, 11 and 12 (Scale bar 140 nm). (E) MTT (3-(4,5-Dimethylthiazol-2-yl)-2,5-Diphenyltetrazolium Bromide) assay performed on cerebellar granule neurons. Cells grown 7 days in vitro (DIV) were treated with different fractions (labeled below the x-axis) and viability was measured 18 hr following treatment (black bars). Gray bars denote viability following incubation of fraction 11 previously co-incubated with the indicated antibodies. *p < 0.05.
Figure 2—figure supplement 1
Correlation between the levels of 154Q or 2Q ATXN1 and the latency to fall from the rotarod.
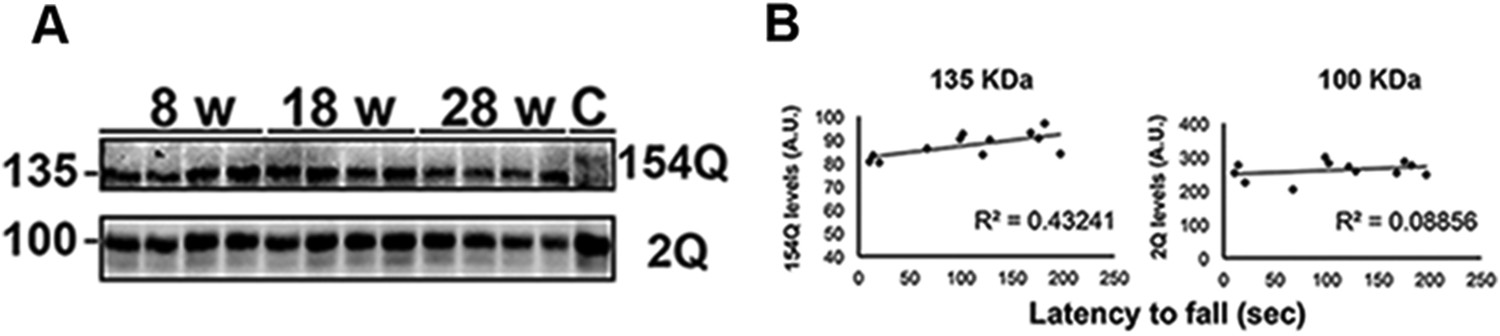
(A) A slight decrease in the level of 154Q ATXN1 was observed with age in Atxn1154Q/+ samples, but no changes were observed in the levels of 2Q ATXN1. The antibody 11750 was used to detect ATXN1 in western blot. (B) No correlation was observed between the levels of 154Q or 2Q ATXN1 and the latency to fall from the rotarod.
Figure 2—figure supplement 2
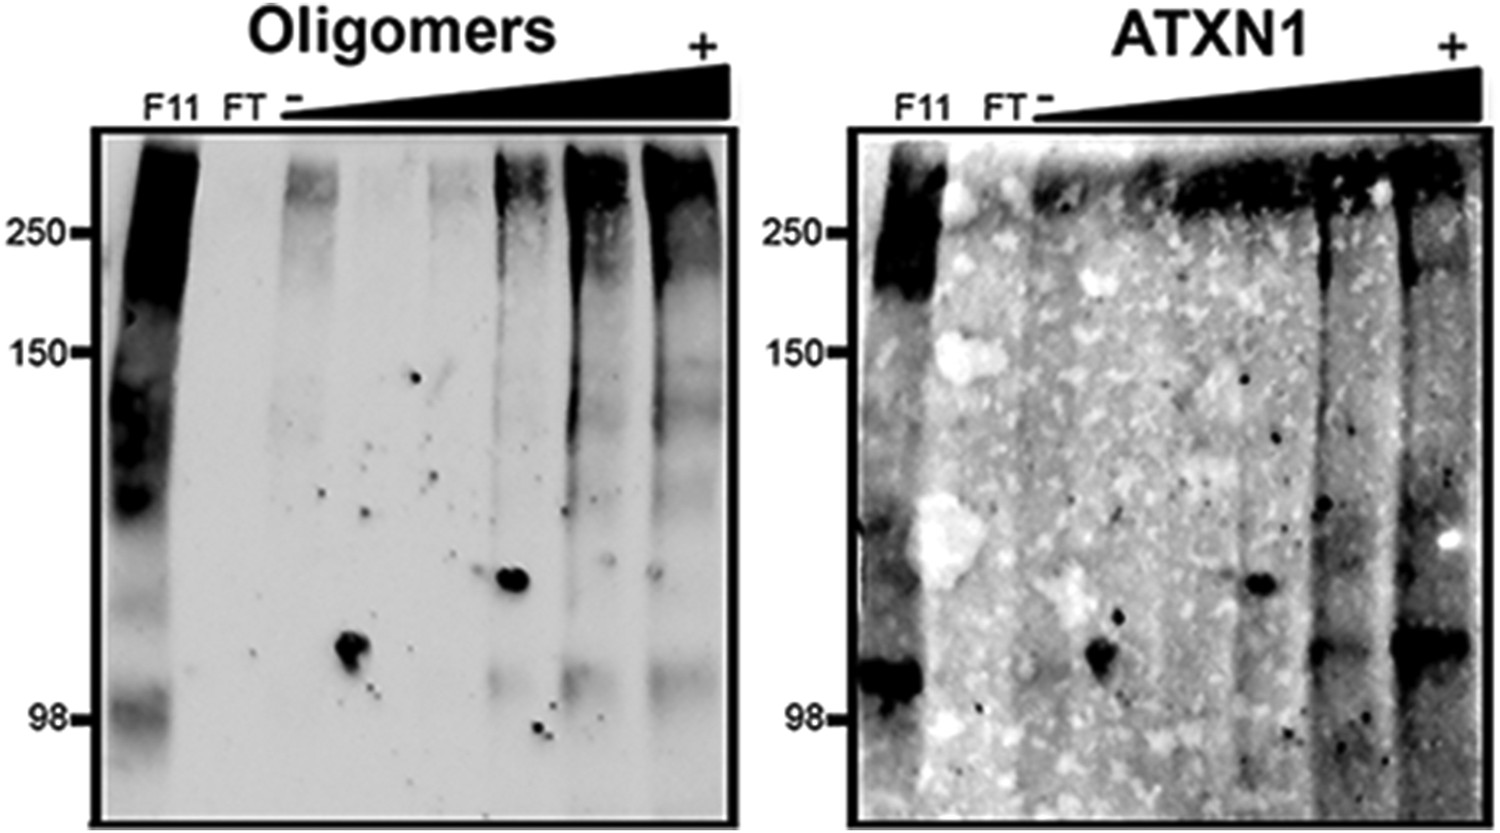
ATXN1 oligomers characterization by hydrophobic interaction column.
Fraction 11 of the SEC from Atxn1154Q/+ mouse cerebellum was passed through a hydrophobic interaction column (HIC). ATXN1 oligomer complexes were detected in fractions with high levels of exposed hydrophobic domains. F11 corresponded to Fraction 11 input; FT corresponded to the HIC flow through; (−) and (+) indicates lower and higher levels of hydrophobic fractions, respectively. Oligomers were detected with F11G3 and ATXN1 was detected with 11750.
Figure 2—figure supplement 3
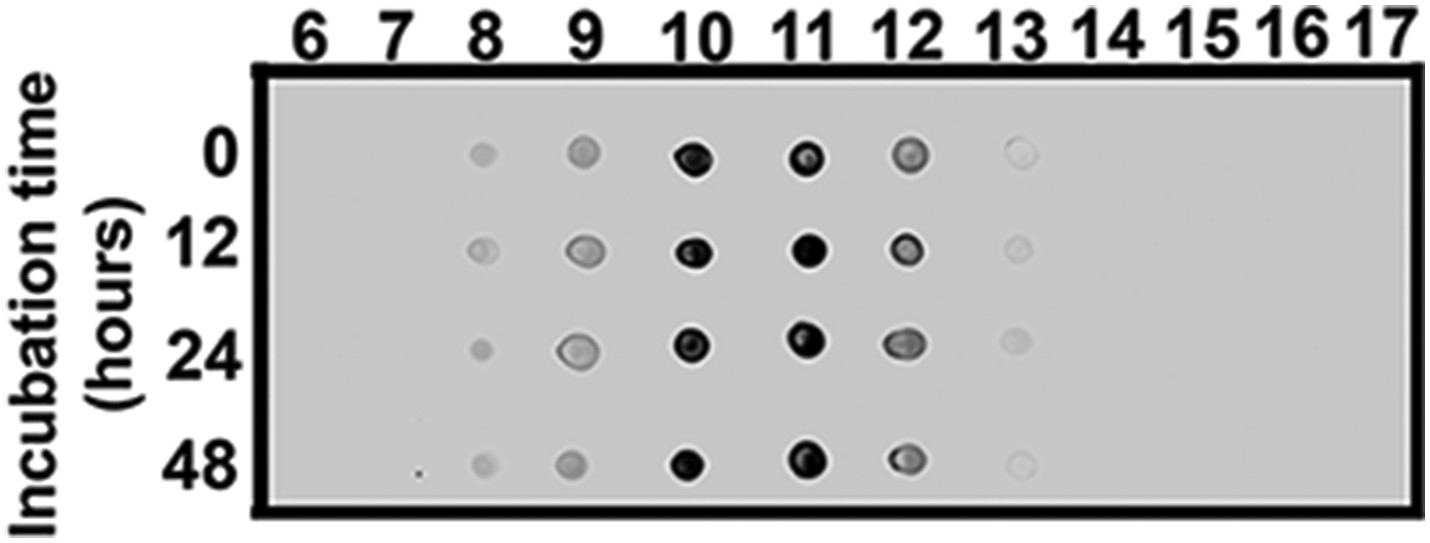
ATXN1 oligomers from Atxn1154Q/+ are highly stable.
Dot-blot probed with F11G3 of SEC fractions from Atxn1154Q/+ cerebellum incubated at 37°C for 12, 24 and 48 hr.
Figure 2—figure supplement 4
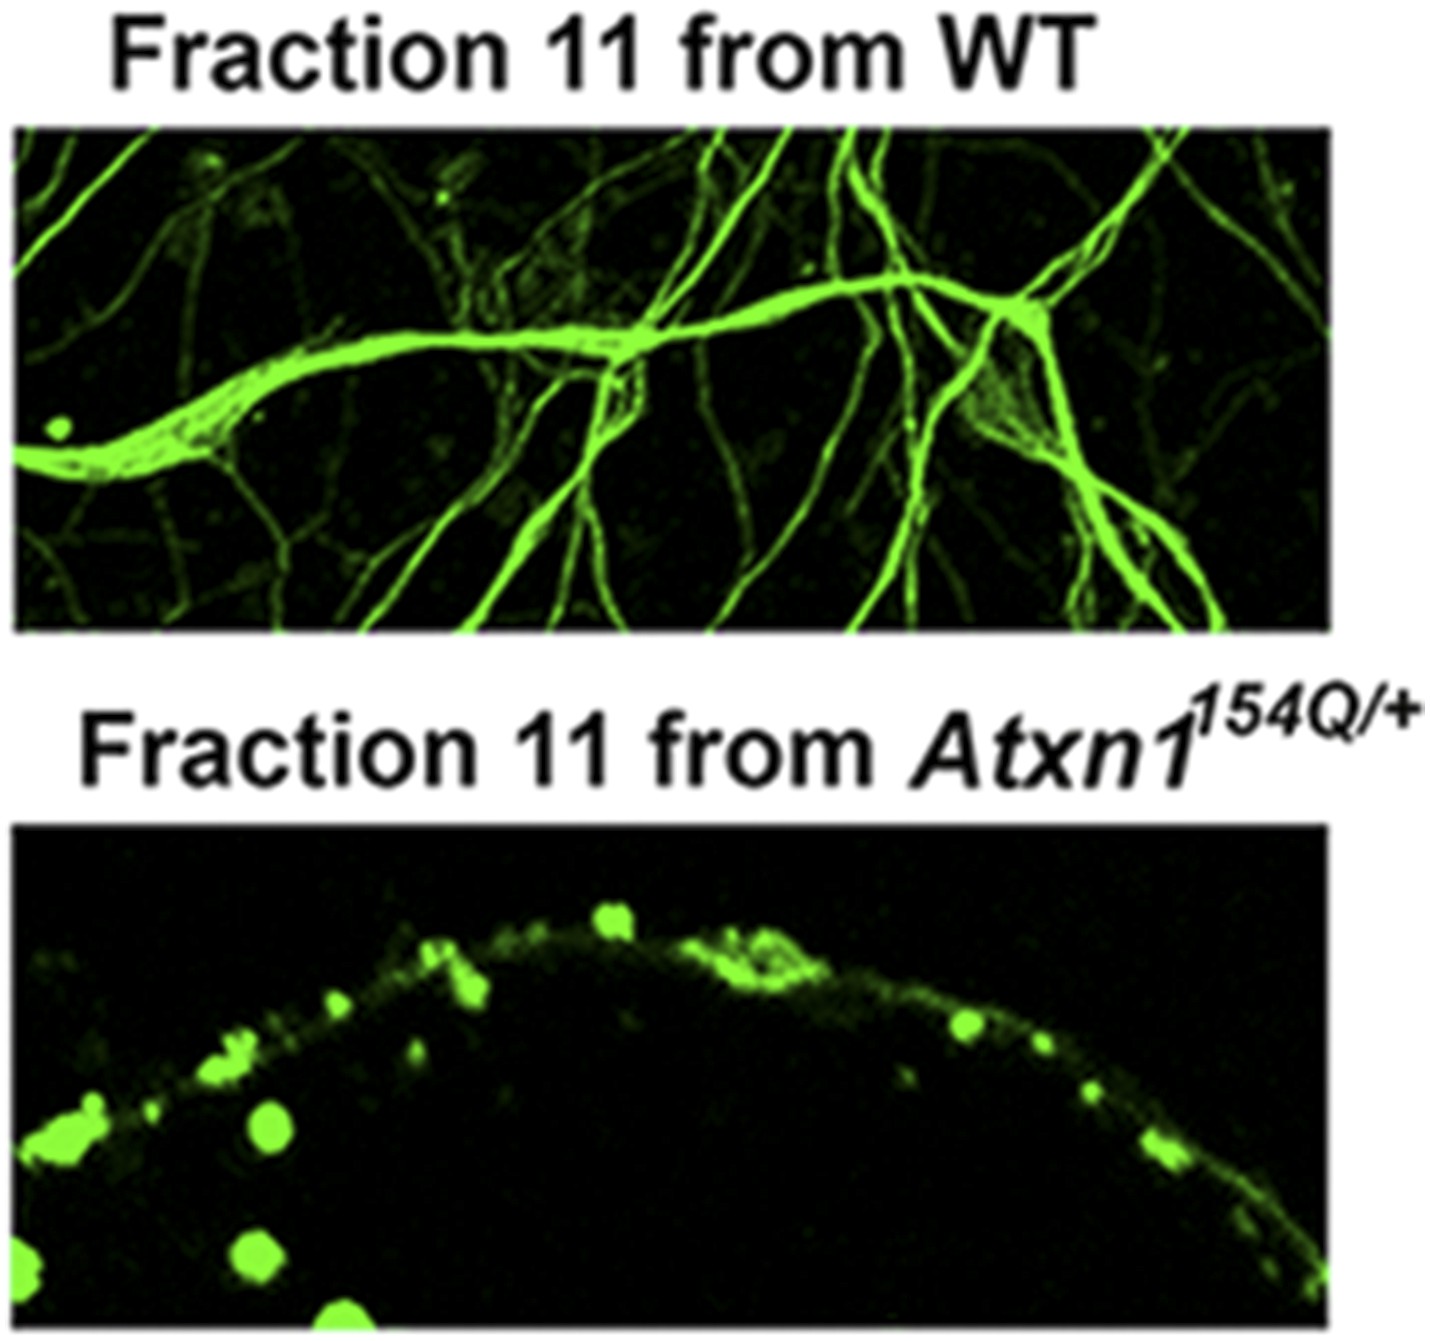
ATXN1 oligomeric complex induce cellular toxicity.
Cellular staining of CGPC cells after fraction 11 treatment using Tuj1 antibody: the ATXN1 oligomer complex induces degeneration in cells.
Figure 3 with 2 supplements
ATXN1 oligomer complexes from Atxn1154Q/+ mouse cerebellum induce the formation of new ATXN1 oligomers.
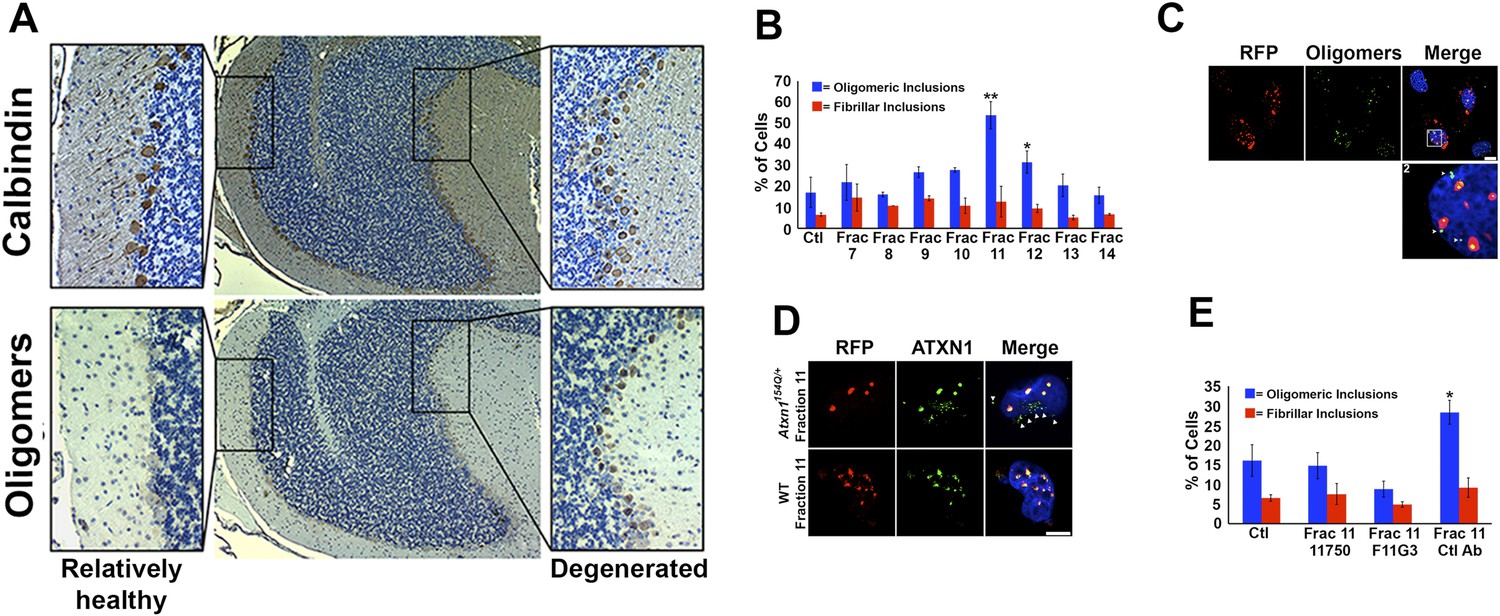
(A) Histological analysis in Atxn1154Q/+ brain sections reveals the regional presence of oligomers in PCs stained with calbindin (top panel) and oligomers stained with F11G3 (bottom panel) in degenerating PCs (bottom right panel) but not surviving PCs (bottom left panel). (B) Cell-based seeding assay: mRFP-ATXN1(82Q) cells were incubated with the indicated fractions (Frac 7–14) and the oligomeric and fibrillar inclusions were quantified. *p < 0.05. **p < 0.01. (C) Immunostaining for oligomers (F11G3, green) of mRFP-ATXN1(82Q) cells following treatment with fraction 11. Arrowheads denote internalized oligomers. Scale bar 15 μm. (D) Immunostaining for ATXN1 (11750, green signal) of mRFP-ATXN1(82Q) after treatment with fraction 11 from Atxn1154Q/+ cerebellum (top row) demonstrated that exogenous ATXN1 (green signal) is internalized into the cells. Cells treated with fractions 11 from wild-type mouse cerebellum (bottom row) did not show internalized ATXN1 entities. Scale bar 15 μm. (E) Quantification of the percentage of mRFP-ATXN1(82Q) cells with oligomeric (blue bars) or fibrillar (red bars) inclusions following treatment of fraction 11 pre-incubated with the indicated antibodies *p < 0.05.
Figure 3—figure supplement 1
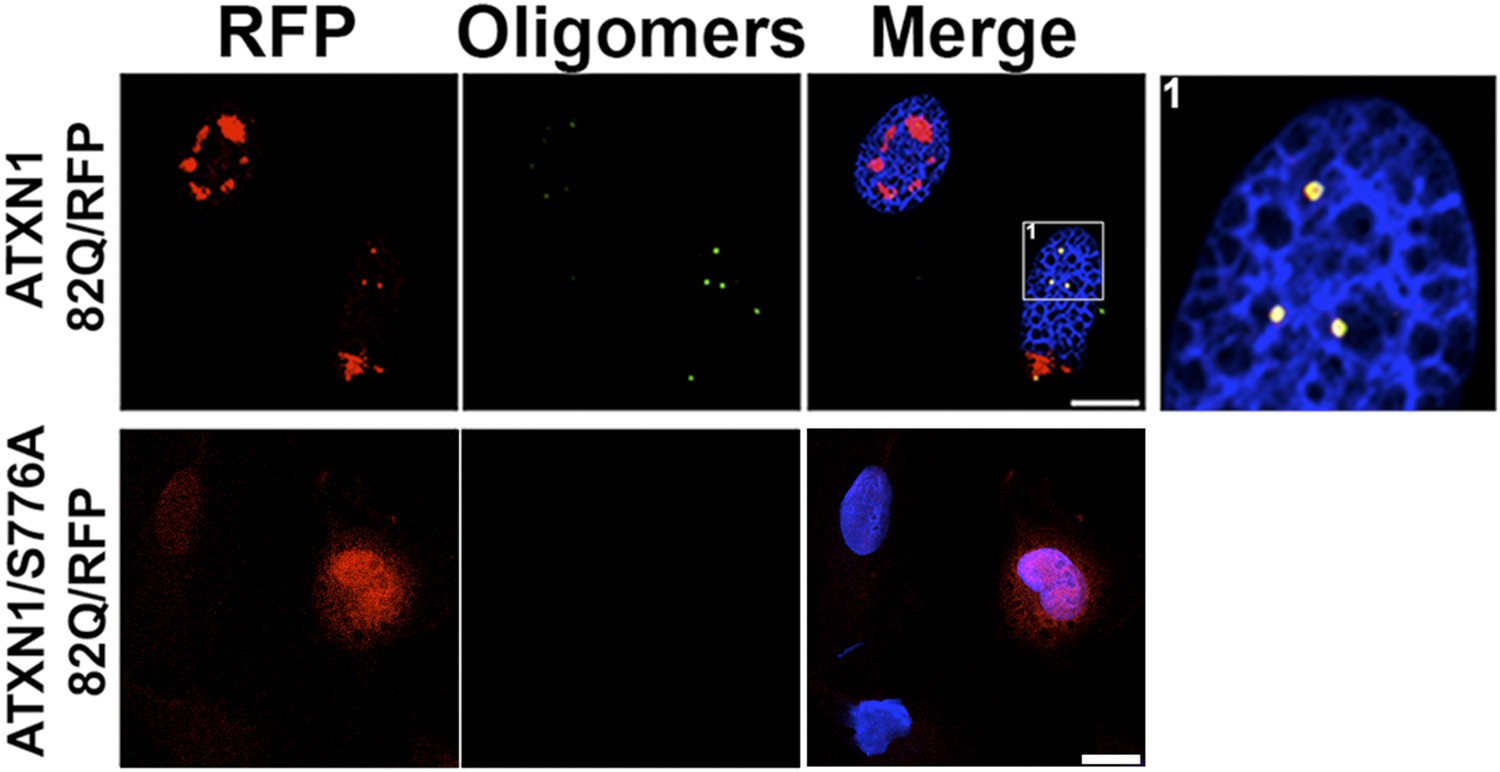
ATXN1 oligomers are detected in mRFP-ATXN1(82Q) cells.
Immunostaining for oligomers (F11G3, green) in a stable cell line expressing mRFP-ATXN1(82Q) (top panels) or a similar stable cell line expressing 82Q ATXN1 with the S776A mutation (bottom panels). The S776A mutation prevents formation of Nis and oligomers. Scale bar 15 μm.
Figure 3—figure supplement 2
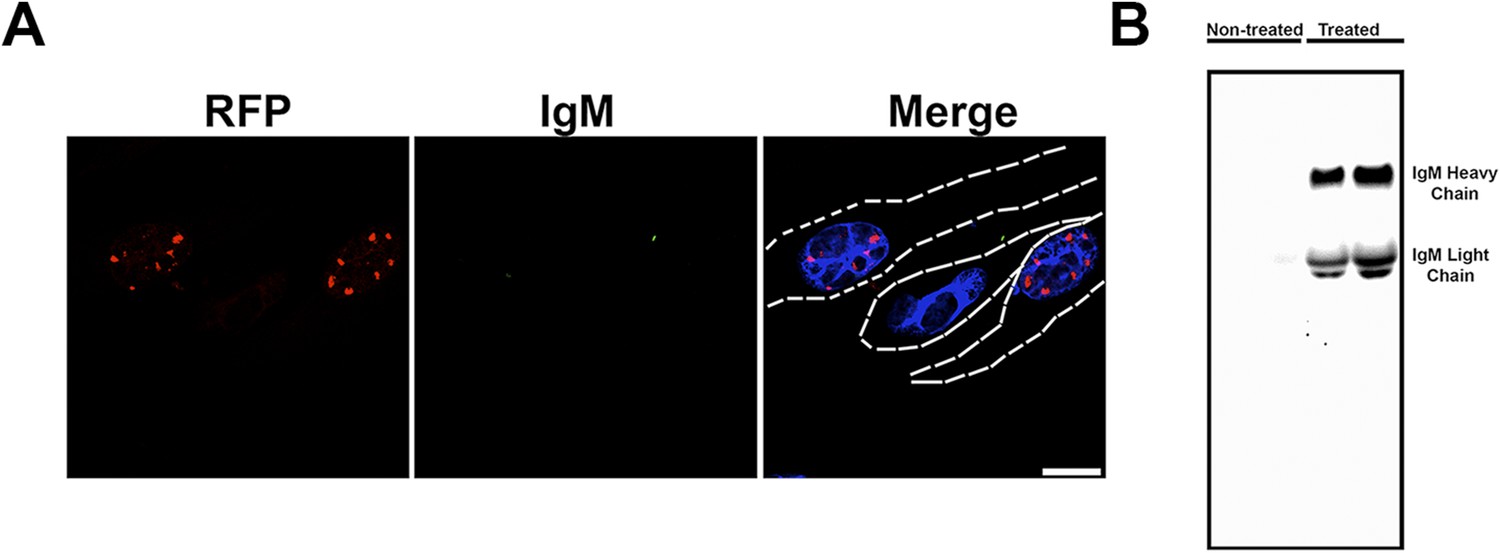
Anti-oligomer antibody F11G3 does not get internalized into the cells.
(A) Daoy mRFP-ATXN1(82Q) stable cell lines were treated with SEC fraction 11 from Atxn1154Q/+ cerebellum pre-incubated with F11G3 for 10 hr. After fixation cells were stained with a secondary anti-mouse IgM alexa 488 (green signal). No intracellular signal was observed in any cell. Low extracellular signal was observed (arrowhead). Scale bar 15 μm. (B) Cell media was analyzed by western blot using secondary anti-mouse IgM. Heavy and light chains from IgM were observed in treated samples but not in untreated control.
Figure 4 with 3 supplements
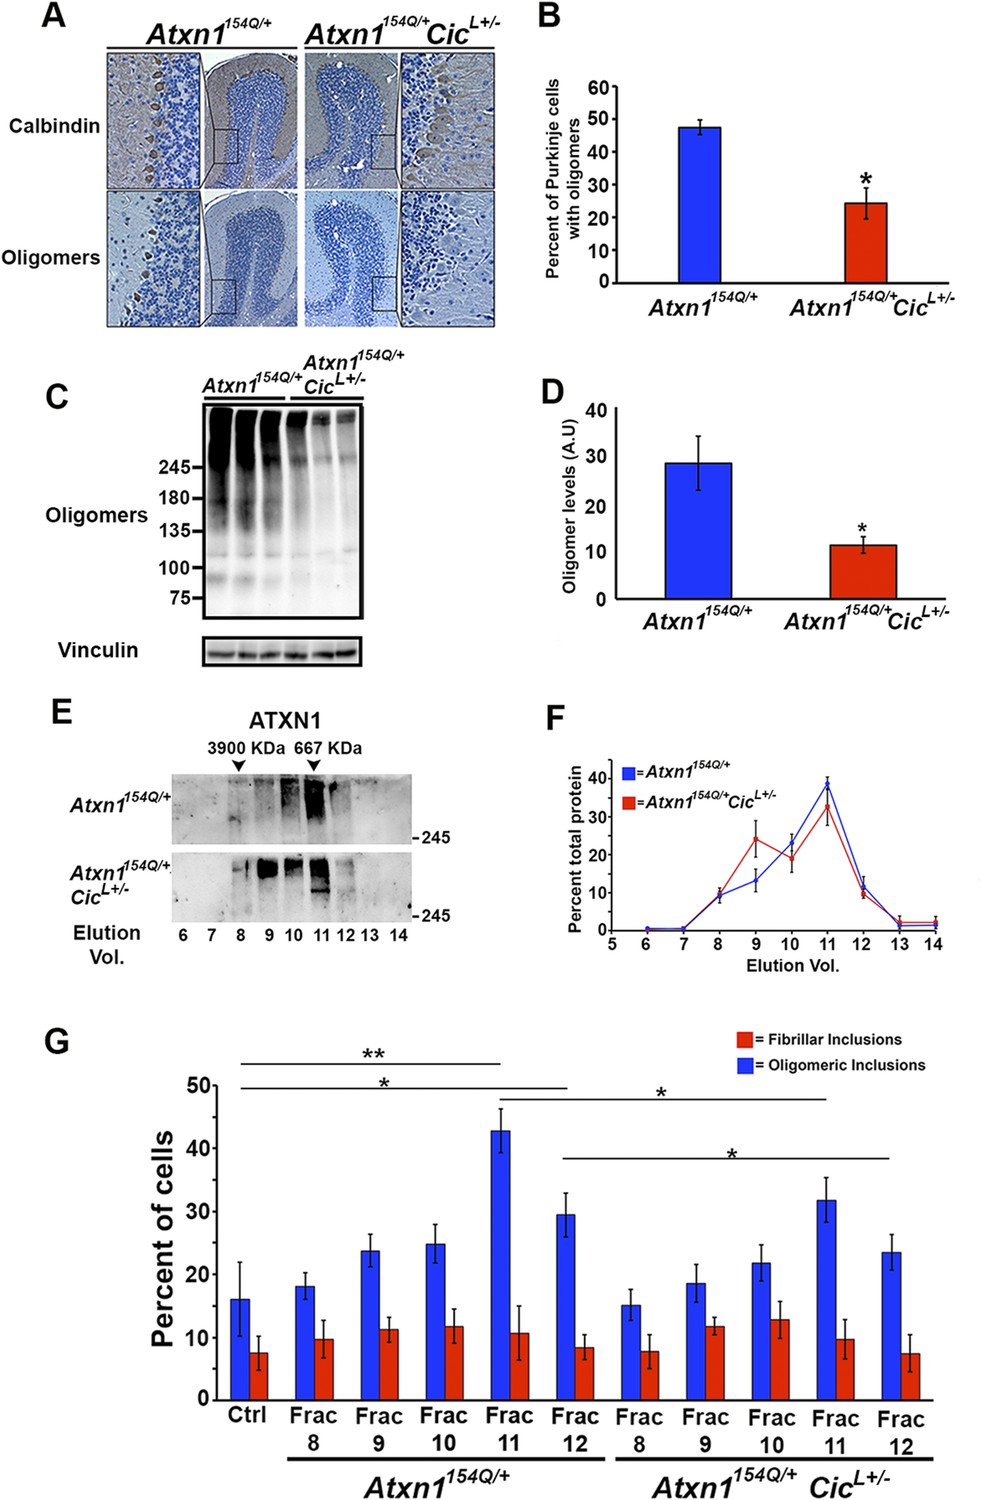
Reduction of CIC levels decreases the levels of ATXN1 oligomer complexes in vivo.
(A–B) Pathological analysis showed fewer PCs from Atxn1154Q/+;CicL+/- mice loaded with oligomers than PCs from Atxn1154Q/+ mice. PCs were stained with calbindin antibody and oligomers with F11G3. *p < 0.05. (C–D) Western blot revealed lower levels of oligomers in the cerebellum of Atxn1154Q/+;CicL+/- mice than in Atxn1154Q/+ mice. Oligomers were measured using F11G3. **p < 0.01. (E–F) Size Exclusion Chromatography (SEC) showed that ATXN1 complexes in cerebellar samples from Atxn1154Q/+;CicL+/- mice shift to a higher molecular weight fraction than those in Atxn1154Q/+ cerebella. (G) Cell-based seeding assay demonstrated that the absence of one Cic allele in Atxn1154Q/+;CicL+/- mice reduced the formation of new ATXN1 oligomers in Daoy mRFP-ATXN1(82Q). Fraction 11 and 12 ATXN1 oligomer complexes from control Atxn1154Q/+ mouse cerebella seeded the formation of new mRFP-ATXN1(82Q). *p < 0.05, **p < 0.01.
Figure 4—figure supplement 1
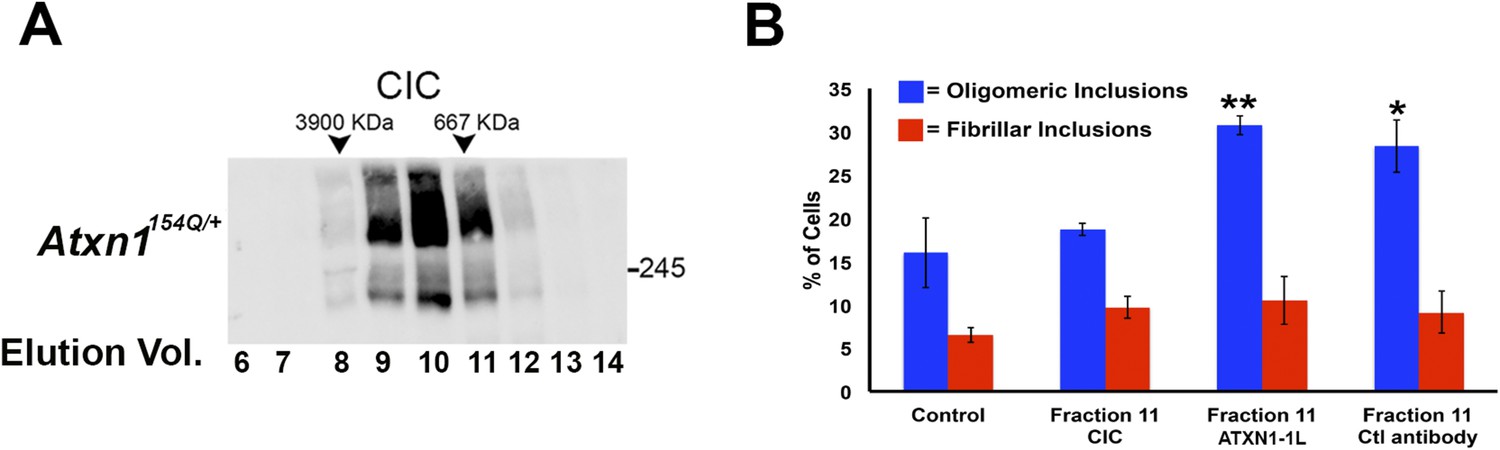
CIC is part of the ATXN1 oligomeric complex.
(A) Size exclusion chromatography (SEC) on Atxn1154Q/+ mouse cerebellar soluble fraction revealed that CIC is part of a higher molecular weight oligomeric complex detected with F11G3 (fractions 10 and 11). (B) Pre-incubation of fraction 11 from Atxn1154Q/+ cerebellum with anti-CIC antibody blocked the internalization and seeding capacity of oligomer complexes. Pre-incubation of fraction 11 with an anti-ATXN1-like antibody (ATXN1-like is a paralog of ATXN1 that lacks the polyQ tract) failed to block the seeding capacity of ATXN1 oligomer complexes. Ctl = control antibody. *p < 0.05, **p < 0.001.
Figure 4—figure supplement 2
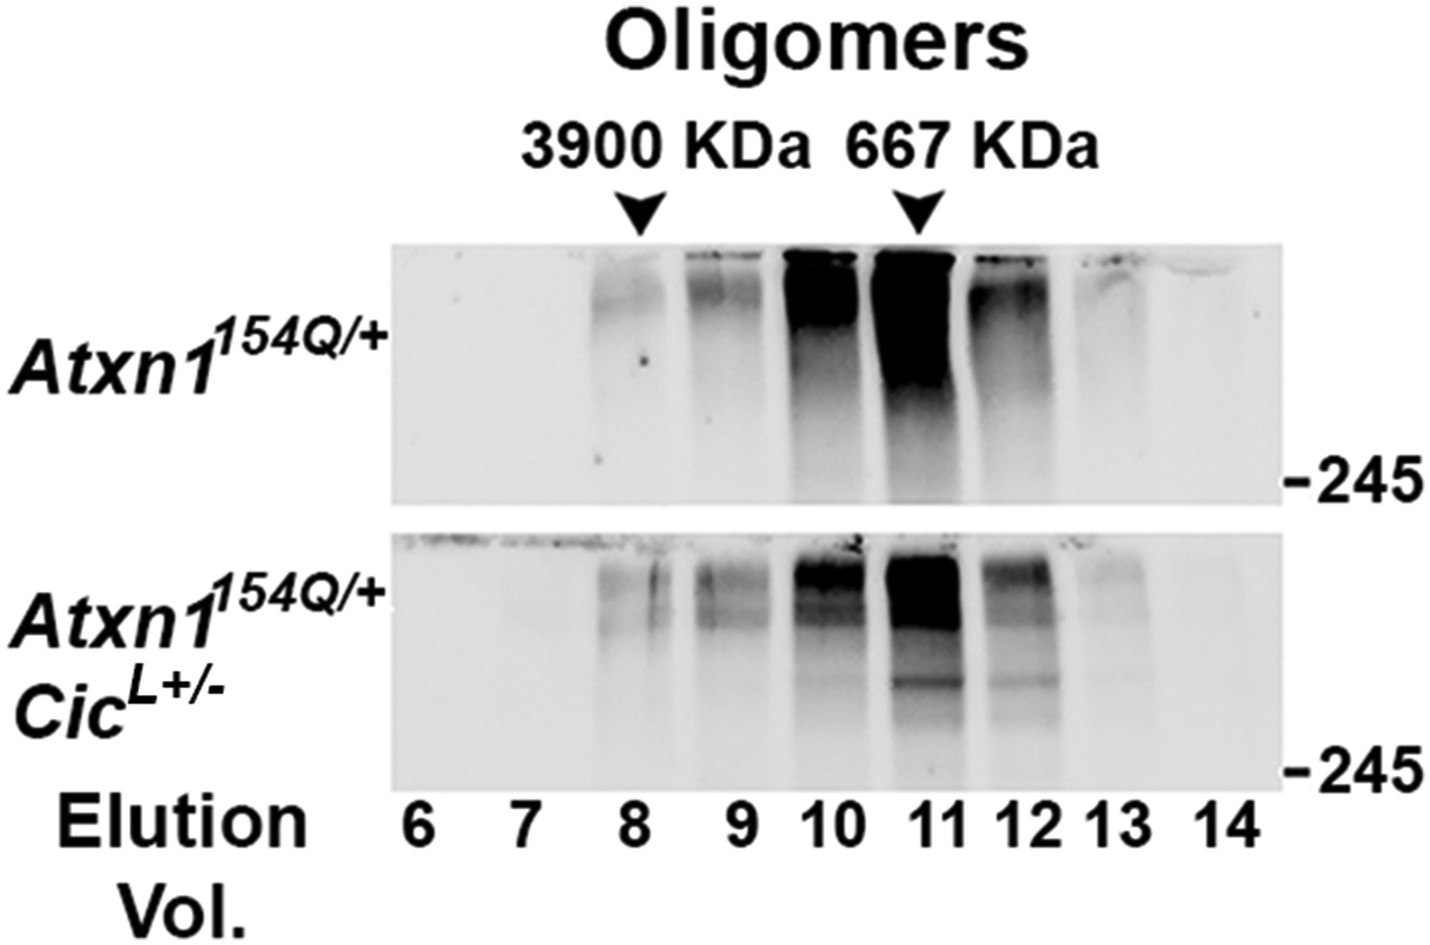
Higher molecular weight complexes in Atxn1154Q/+;CicL+/- do not present an oligomeric conformation.
SEC revealed no shift of ATXN1 oligomeric complexes in Atxn1154Q/+;CicL+/- mouse cerebellum compared with Atxn1154Q/+ mice.
Figure 4—figure supplement 3
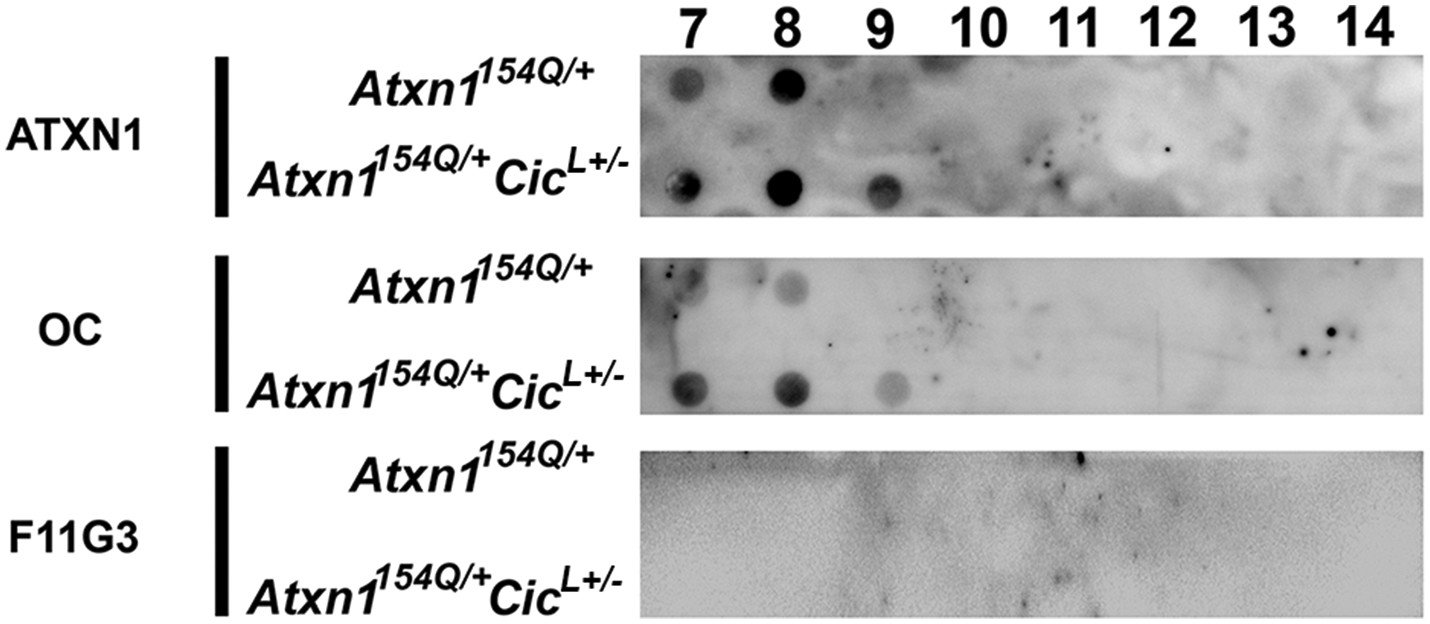
High molecular weight complexes characterization by filter retardation assay (FRA).
ATXN1 insoluble aggregates were detected on Atxn1154Q/+ mouse cerebellar soluble fractions 7 and 8. In Atxn1154Q/+;CicL+/- mouse cerebellum ATXN1 insoluble aggregates were observed in fraction 7, 8 and 9. Fibrillar oligomers detected by OC, are observed in fraction 7 and 8 from Atxn1154Q/+ mouse and fractions 7, 8 and 9 from Atxn1154Q/+;CicL+/- mouse. No oligomers detected by F11G3 were observed in any of the insoluble fractions.
Figure 5 with 1 supplement
ATXN1 requires CIC binding to maintain oligomer conformation.
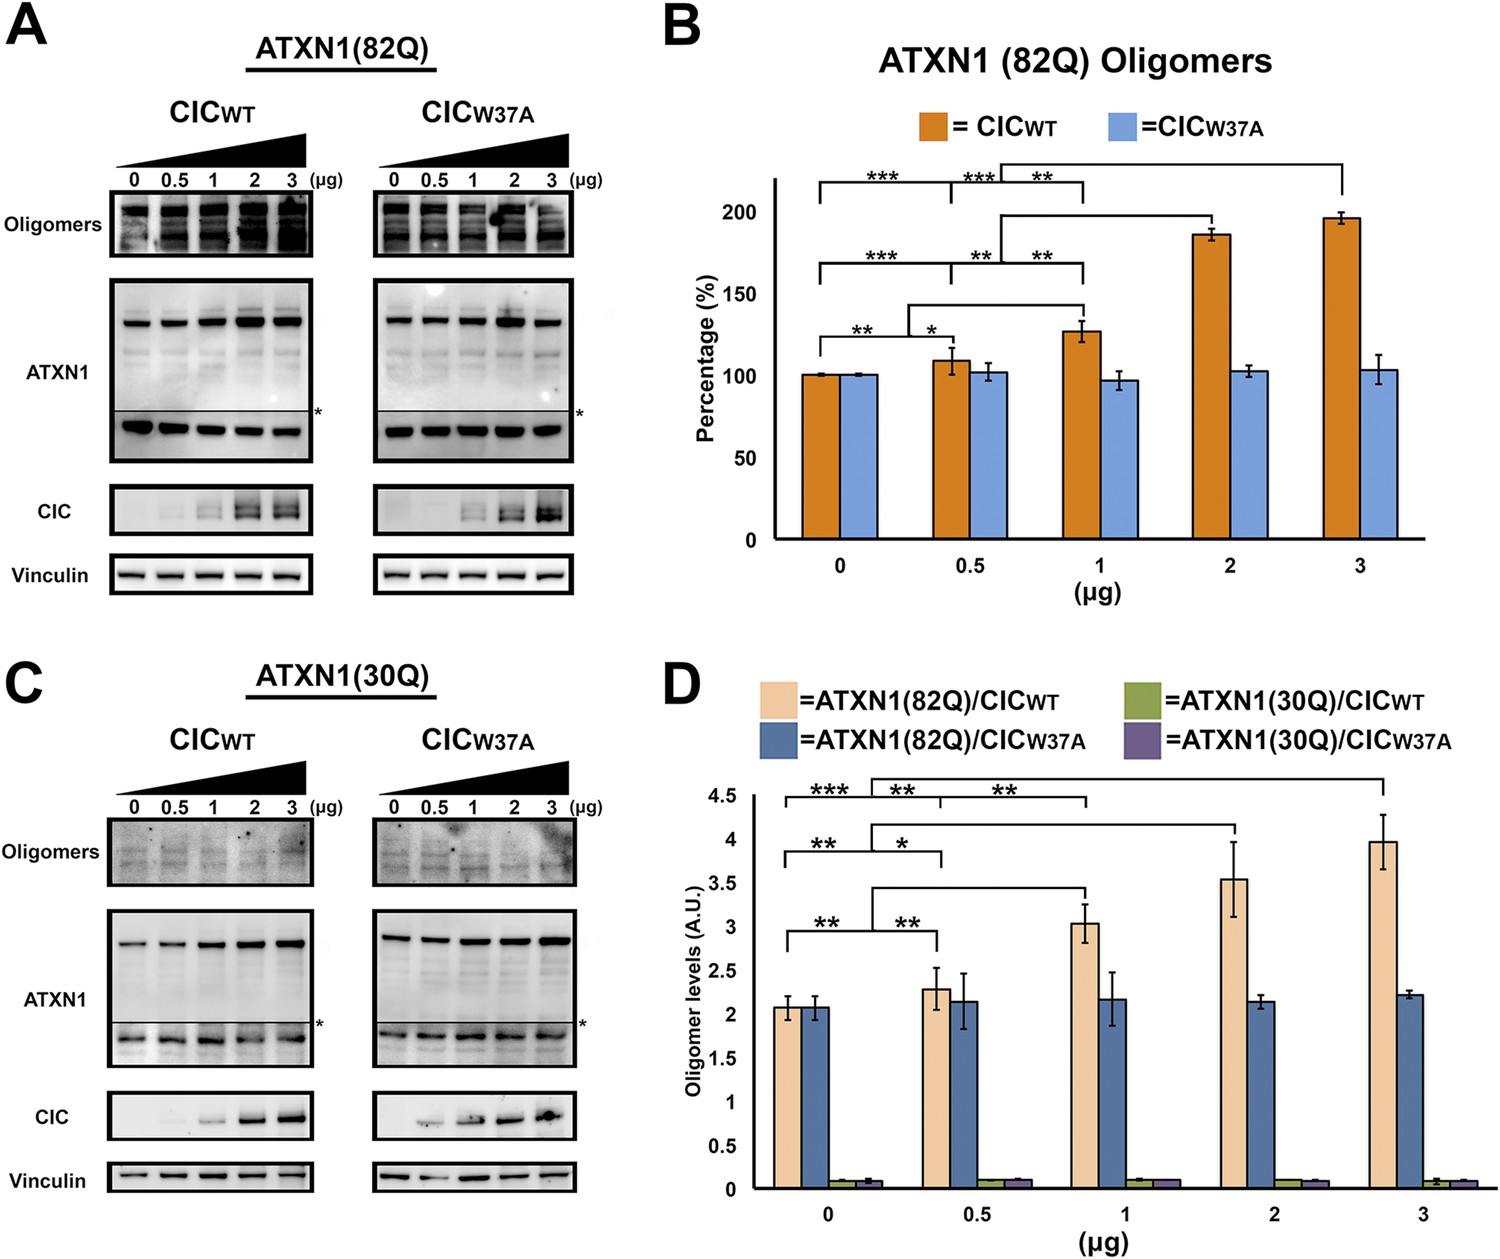
(A) Western blot of Hela cells co-transfected with ATXN1(82Q) and increasing concentrations (from 0.5 to 3 μg) of wild type CIC (left panel) or increasing concentrations of mutant CIC/W37A (right panel). Membranes were probed with F11G3 to determine the levels of oligomers. * indicated change in exposure of the membrane. (B) Quantification of oligomers from Western blot analysis (A), demonstrated that increased oligomer levels correlated with increases of transfected wild-type CIC. Mutant CIC/W37A produced no effect on the amount of oligomers detected by Western blot. n = 4. *p < 0.05, **p < 0.01 and ***p < 0.001. (C) Western blot of Hela cells co-transfected with ATXN1(30Q) and increasing concentrations (from 0.5 to 3 μg) of wild-type CIC (left panel) or increasing concentrations of mutant CIC/W37A (right panel). Membranes were probed with F11G3 to determine the levels of oligomers. Almost no oligomers were detected in any of the measured conditions. * indicated change in exposure of the membrane. (D) ELISA using F11G3 shows that cells transfected with ATXN1(82Q) have high levels of oligomers, but cells transfected with ATXN1(30Q) had almost no detectable oligomers. Increasing amounts of oligomers were observed when cells transfected with ATXN1(82Q) were co-transfected with increasing amounts of wild type CIC but not mutant CIC/W37A. n = 4. *p < 0.05, **p < 0.01 and ***p < 0.001.
Figure 5—figure supplement 1

CIC facilitates ATXN1 oligomerization.
(A–B) Daoy mRFP-ATXN1(82Q) stable cell lines transfected with the N-terminal fragment of CIC showed a higher number of oligomeric inclusions than cells transfected with the N-terminal fragment of mutant CIC W37A or control (non-transfected) cells. *p < 0.05. Scale bar 20 μm.
Figure 6 with 1 supplement
CIC stabilizes ATXN1 oligomers.
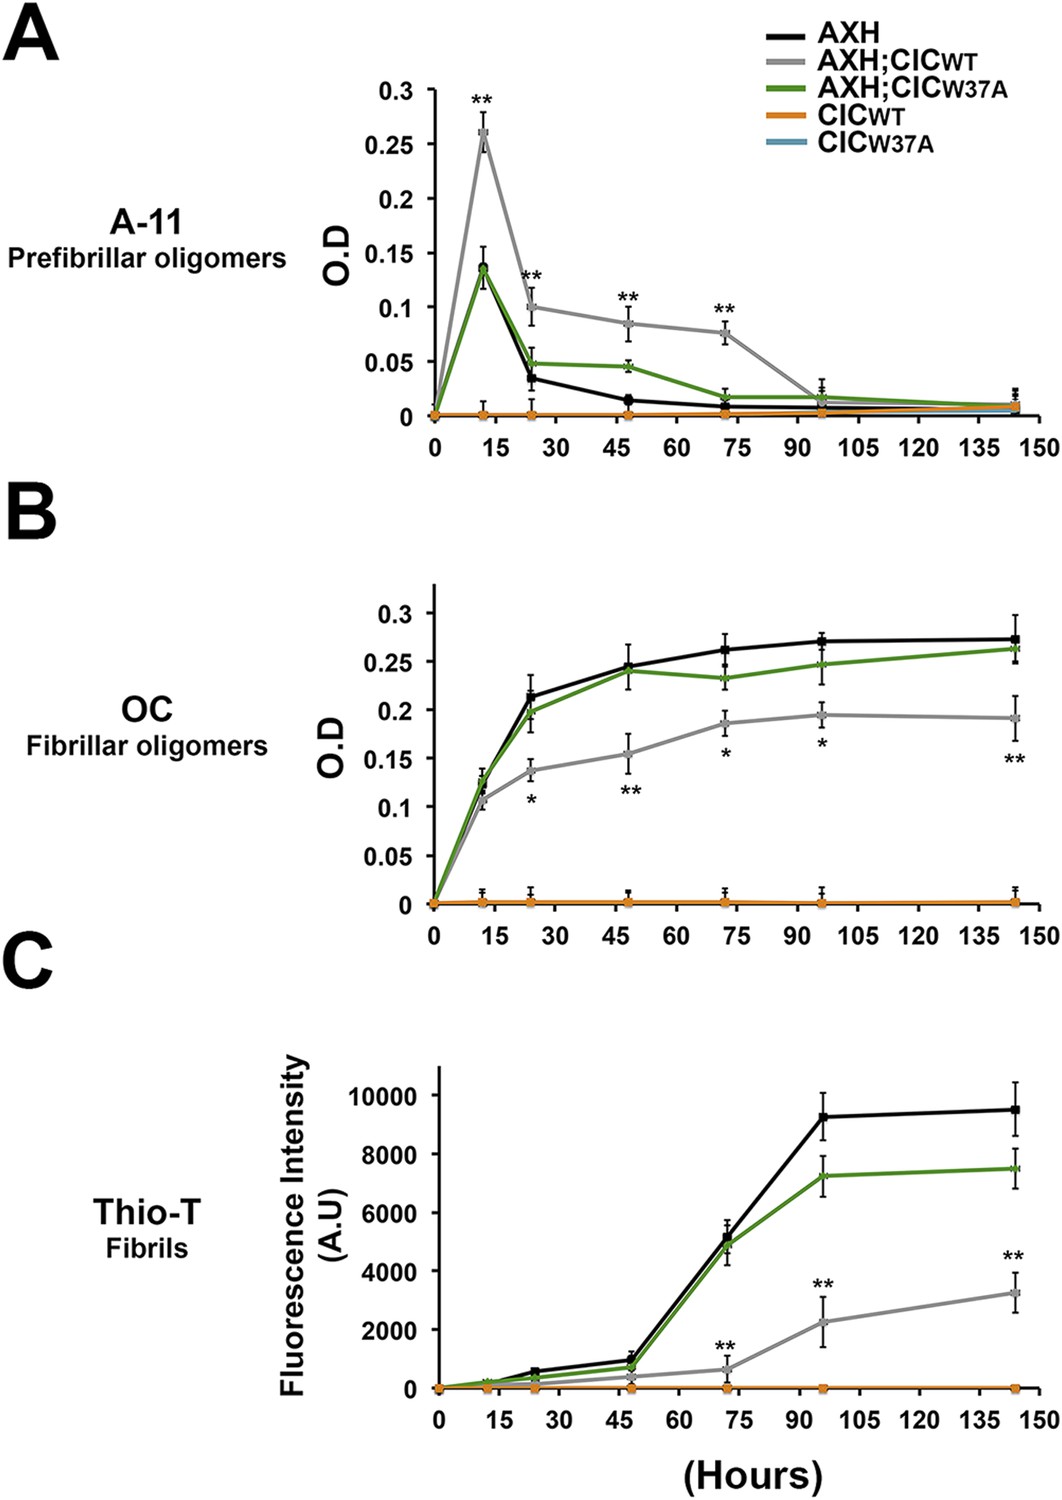
(A) ELISA using anti-prefibrillar oligomer antibody A-11 shows that the N-terminal fragment of wild-type CIC stabilized AXH fragments in the oligomeric conformation, unlike the N-terminal fragment of mutant CIC W37A or AXH incubated alone. Wild-type and mutant CIC alone did not oligomerize at any time point. (B) ELISA using anti-fibrillar oligomer antibody OC shows that only wild type, not mutant, CIC partially inhibits the formation of fibrillar oligomers. (C) Thioflavin T assay demonstrated that wild-type but not mutant CIC blocks the formation of AXH fibrils. *p < 0.05, **p < 0.01.
Figure 6—figure supplement 1

The AXH domain of ATXN1 has a high energy for aggregation.
3D profile method for predicting fibrillizing segments. The top and bottom panels show the predicted energy for fibrillation of every six-residue segment of AXH and α-Synuclein, respectively. Red histogram bars represent hexapeptides with energy below −23 kcal∕mol, which are predicted to form fibrils.
Figure 7
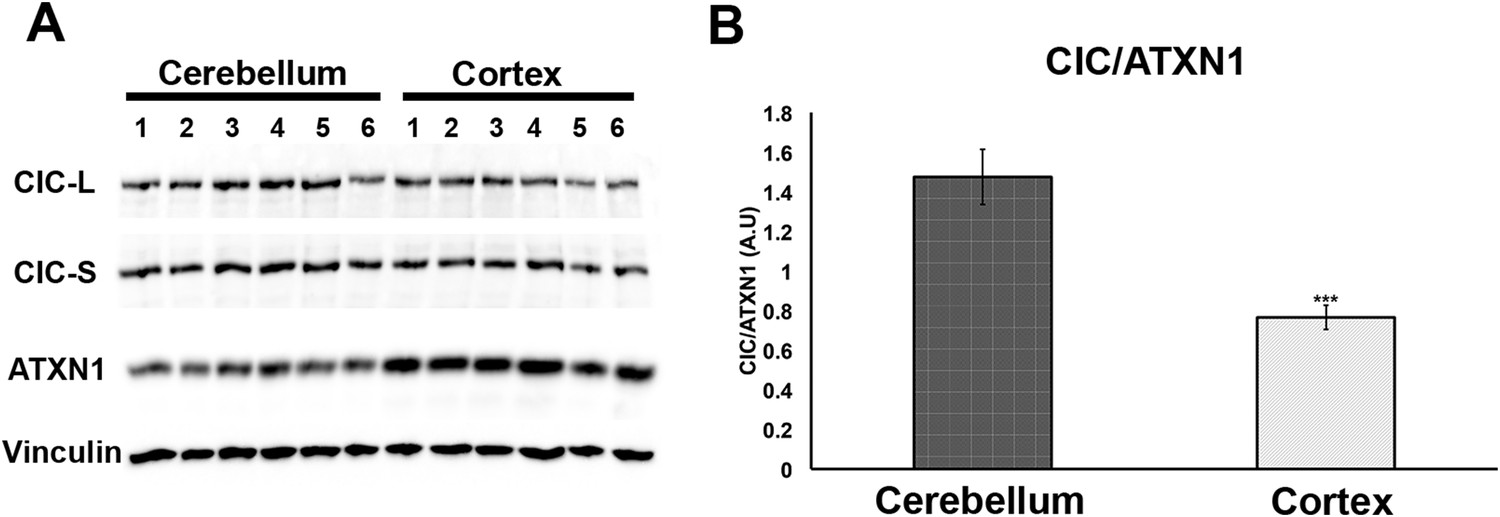
Comparison of CIC and ATXN1 protein levels in cerebellum and cortex.
CIC levels are higher in the cerebellum than in the cortex, while ATXN1 levels are lower in the cerebellum than in the cortex, making the amount of CIC per ATXN1 much higher in the cerebellum.
Figure 8
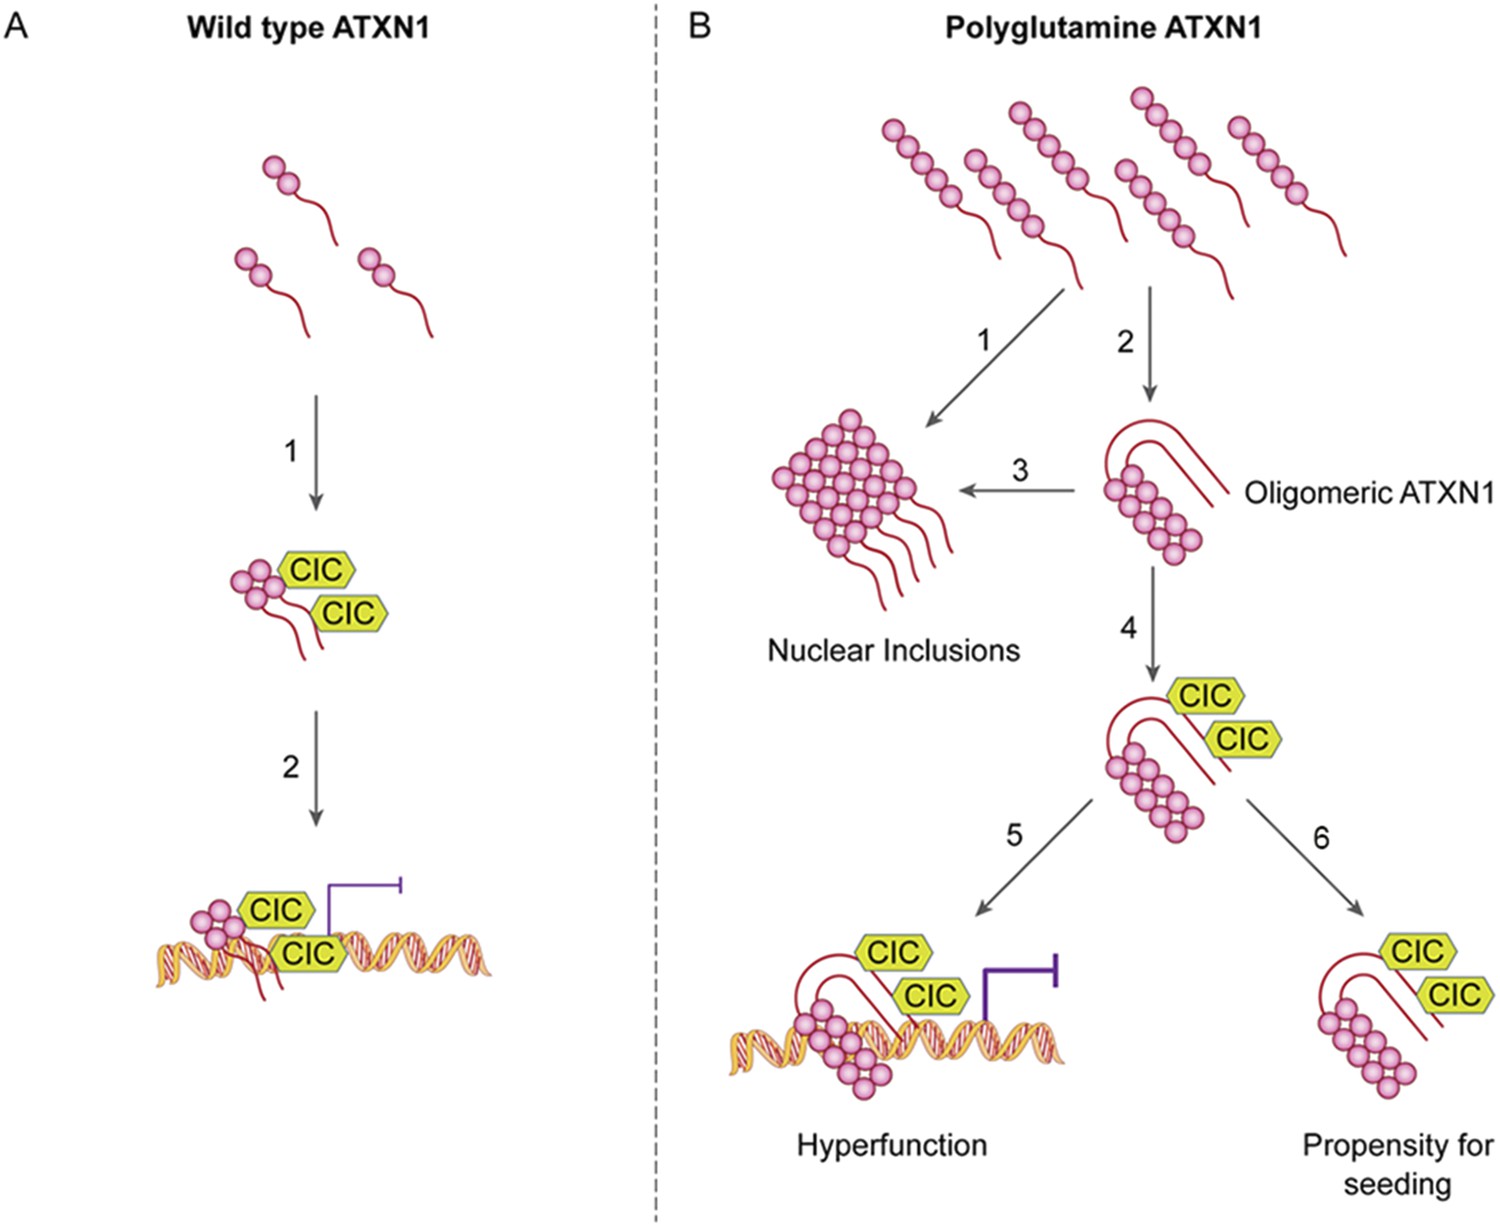
ATAXIN-1 oligomer complexes with seeding capability correlate with disease progression in spinocerebellar ataxia type 1: a model.
Under normal conditions (A, left panel), wild type ATXN1 forms a transcriptional repressor complex with CIC (1) and binds to DNA (2). Under pathological conditions (B, right panel), polyQ-expanded ATXN1 accumulates and can directly form nuclear inclusions (1) or it can adopt an oligomeric conformation (2). These oligomers form nuclear inclusions (3) or form a stable oligomeric complex with CIC (4) that could: act as a dysfunctional transcriptional repressor complex (5) or be released into the extracellular space and be internalized by neighboring neurons, seeding the formation of new oligomers (6). The toxic effect of oligomeric complexes might be mitigated by reducing the total levels of polyQ ATXN1 or hindering the propagation of these toxic complexes (e.g., by immunotherapy).
Download links
A two-part list of links to download the article, or parts of the article, in various formats.
Downloads (link to download the article as PDF)
Open citations (links to open the citations from this article in various online reference manager services)
Cite this article (links to download the citations from this article in formats compatible with various reference manager tools)
A native interactor scaffolds and stabilizes toxic ATAXIN-1 oligomers in SCA1
eLife 4:e07558.
https://doi.org/10.7554/eLife.07558


