Mapping the conformational landscape of a dynamic enzyme by multitemperature and XFEL crystallography
- University of California, San Francisco, United States
- Cornell University, United States
- Lawrence Berkeley National Laboratory, United States
- SLAC National Accelerator Laboratory, United States
- Stanford University, United States
- Howard Hughes Medical Institute, Stanford University, United States
Figures
Figure 1 with 1 supplement
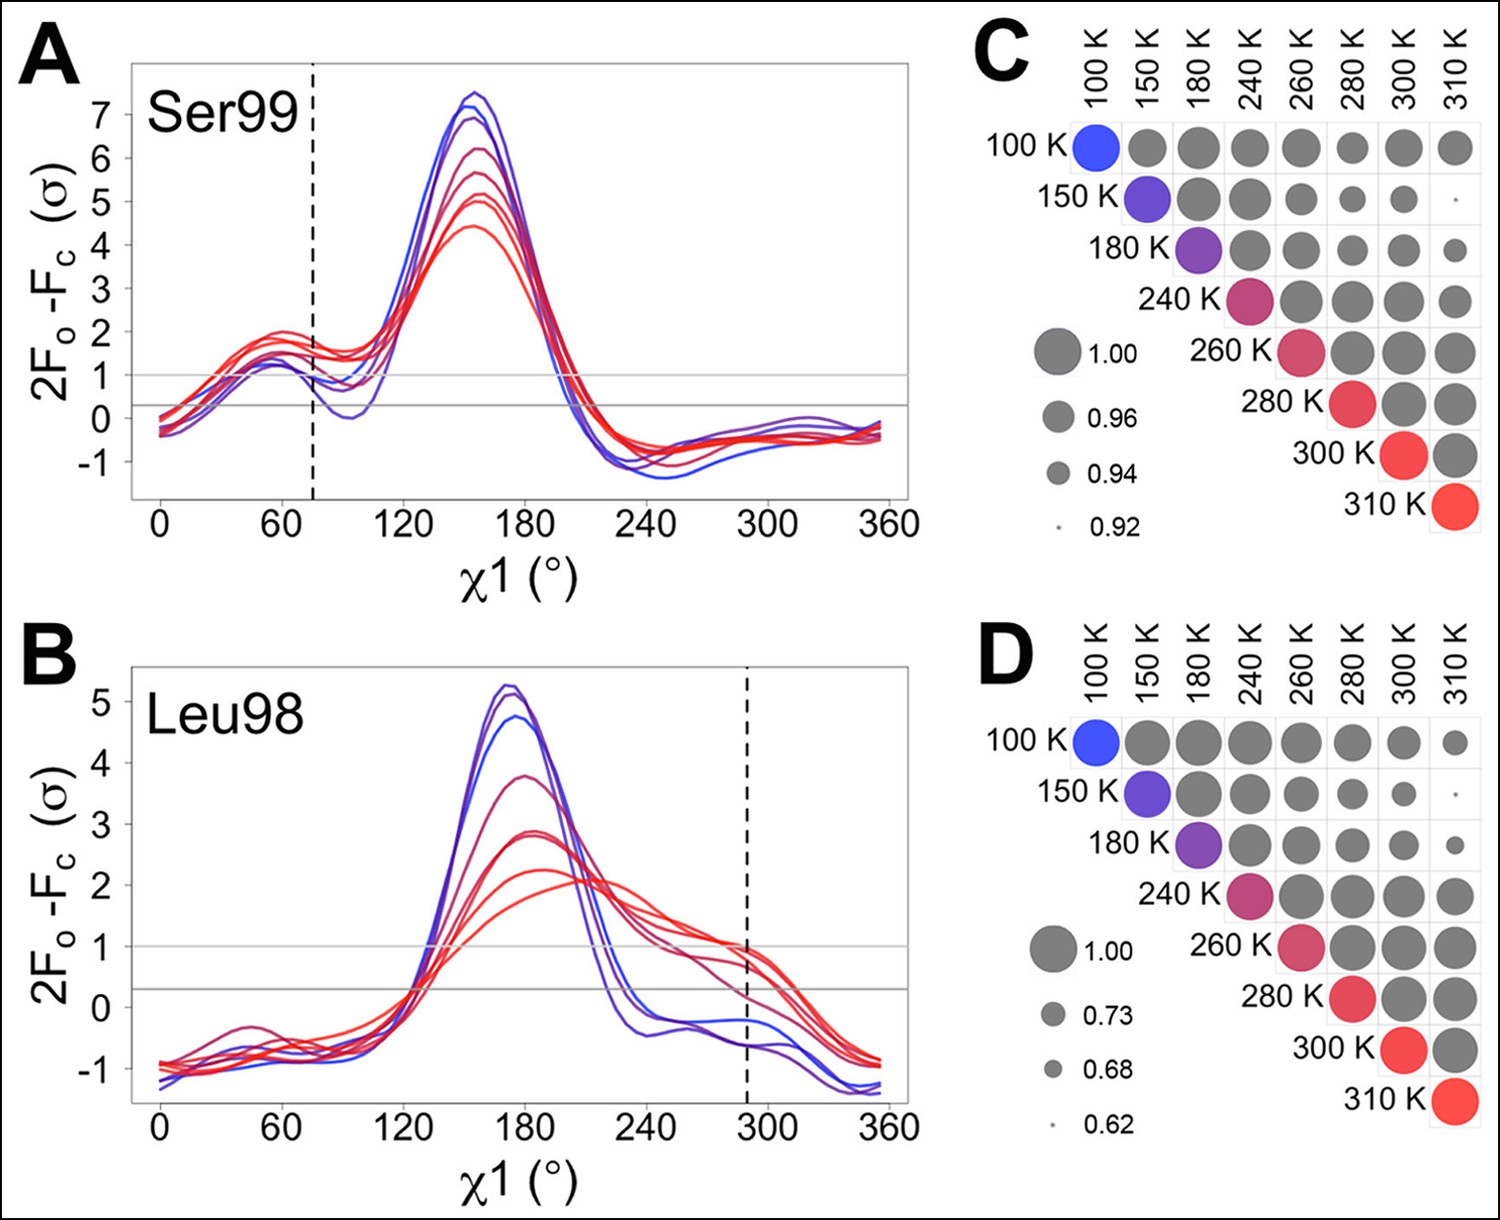
Automated electron density sampling reveals increased conformational redistribution.
Ringer curves of 2mFo-DFc electron density versus χ1 dihedral angle for (A) Ser99 and (B) Leu98 show large peaks for modeled major conformations and smaller peaks for additional minor conformations (dashed vertical lines). These secondary peaks become more evident as temperature increases (color gradient from blue to purple to red). A backrub motion was used for Ser99. For (C) Ser99 and (D) Leu98, a Pearson correlation coefficient was calculated between each pair of Ringer curves from the corresponding panel in (A) or (B). Circles in diagonal elements are colored as in (A) or (B); circles in off-diagonal elements are all gray but scaled by pairwise correlation coefficient (see legend). Pairs of curves from similar temperatures are generally more correlated to each other (larger circles) than are pairs of curves from more different temperatures (smaller circles).
Figure 1—Figure supplement 1
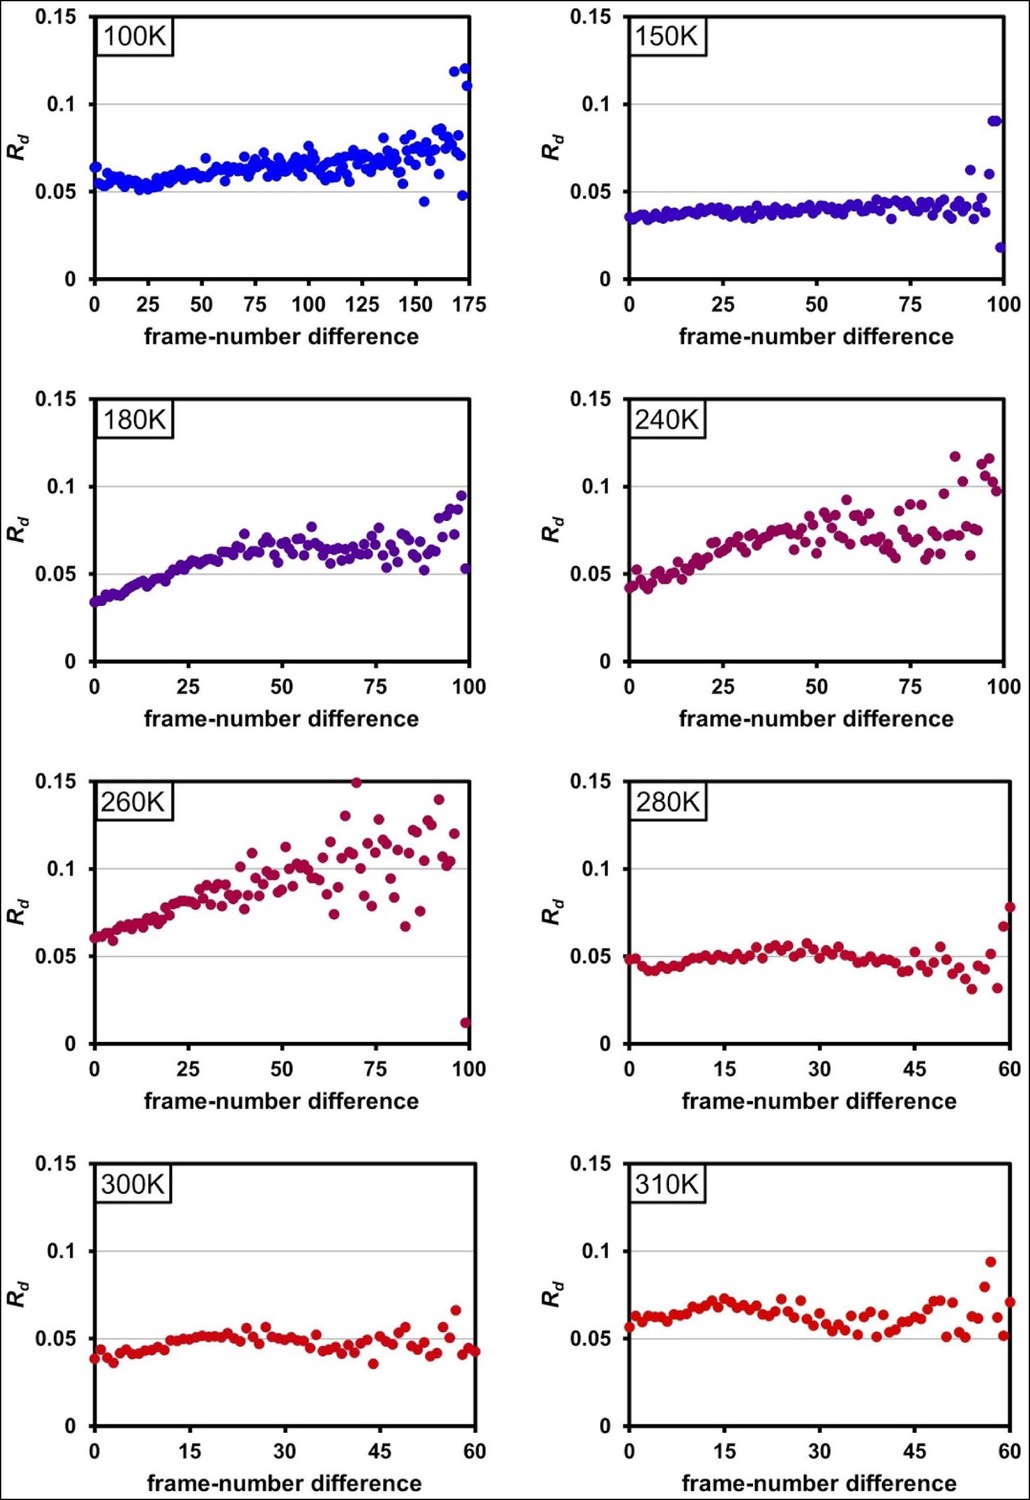
Radiation damage is minimal across data collection temperatures.
Plots of Rd versus frame-number difference for each dataset in the multitemperature trajectory reveal only minimal radiation damage. The datasets around 180– 260 K exhibit higher Rd in later frames, which may reflect either a time-dependent cryocooling artifact or a radiation damage at these intermediate temperatures. Although the rate of X-ray damage varies strongly with temperature, the data collection strategy was adjusted to yield a comparable amount of damage per frame. Therefore, there is no correlation between data collection temperature and the overall extent of radiation damage; the highest temperature datasets are equally undamaged as the lowest temperature datasets. By contrast, we observe a strong correlation between data collection temperature and conformational heterogeneity.
Figure 2 with 1 supplement
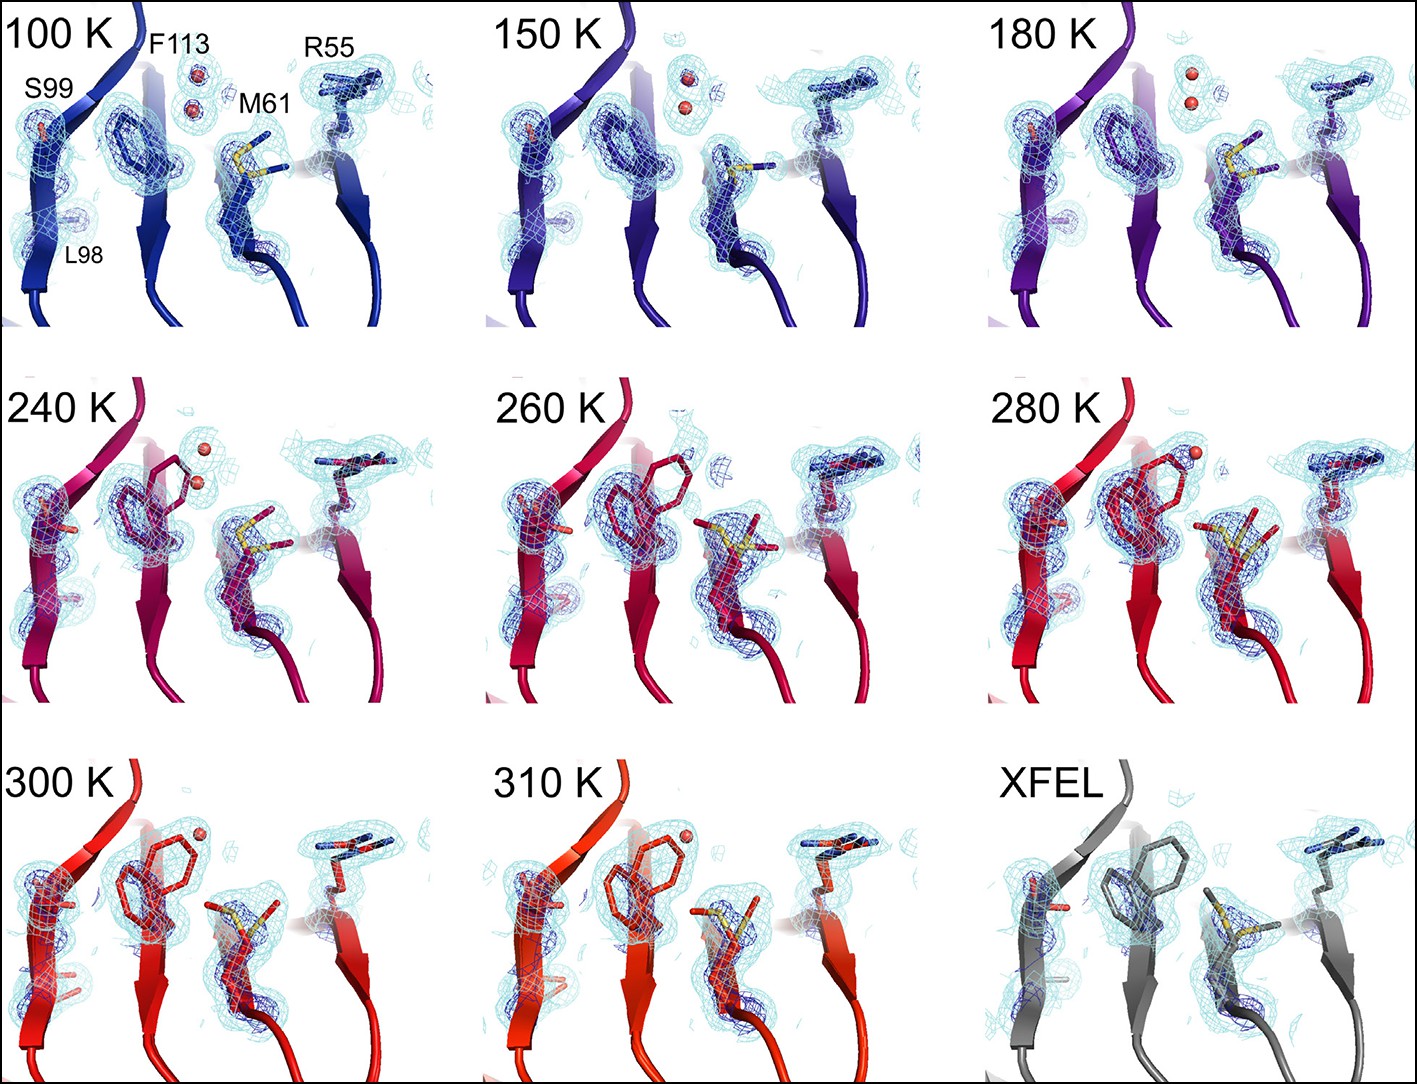
Multiconformer modeling across temperatures captures increasing conformational heterogeneity.
Residues extending from the core to the active site of cyclophilin A (CypA) adopt a single conformer at low temperatures, but gradually transition to increasing occupancy of secondary conformations as temperature increases. These conformations are well supported by 2mFo-DFc electron density contoured at 0.6 σ (cyan mesh) and 3.0 σ (dark blue mesh). This is corroborated by the room-temperature X-ray free-electron laser (XFEL) model (gray), which is free from conventional radiation damage and features the same secondary conformations. Water molecules (red spheres) are more fully ordered at low temperatures, but become only partially occupied at higher temperatures because they are mutually exclusive with the secondary Phe113 conformation.
Figure 2—figure supplement 1

Single-conformer models cannot explain the crystallographic data at higher temperatures..
The CypA dynamic network is shown after molecular replacement and refinement (including automated water placement) in PHENIX, before any manual rebuilding. The major state is well supported by 2mFo-DFc electron density contoured at 0.6σ (cyan mesh) and 3.0σ (dark blue mesh) for all datasets, but mFo-DFc difference electron density becomes more negative for the major state (−3.0σ, red mesh) and more positive for the unmodeled minor state ( 3.0σ, green mesh) as temperature increases across the synchrotron datasets (blue to red), especially at and above 240 K. Full-occupancy water molecules (red spheres) are automatically placed by PHENIX near the Phe113 minor state in lower temperature, but not in higher temperature synchrotron models because they are mutually exclusive with the secondary Phe113 conformation.
Figure 3 with 1 supplement

The active-site conformational ensemble of cyclophilin A (CypA) determined without radiation damage at room temperature.
(A) Electron density maps for room-temperature synchrotron (red) and (B) X-ray-free electron laser (XFEL) (silver) single-conformer models reveal conformational heterogeneity extending from the protein core (Leu98 and Ser99) to the active site (Arg55) of CypA. The primary conformation is well supported by 2mFo-DFc electron density contoured at 0.6 σ (cyan mesh) and 3.0 σ (dark blue mesh). mFo-DFc difference electron density contoured at 3.0 σ (green mesh) and − 3.0 σ (red mesh) suggests unmodeled alternative conformations. (C, D) Finalized multiconformer models explicitly model these alternative conformations, which are well-supported by 2mFo-DFc electron density. (E, F) Ringer electron density sampling for the single-conformer models shows peaks representing alternative conformations for (E) Ser99 and (F) Leu98. The primary conformations of both residues are obvious as peaks for both models, but the minor conformations (dashed vertical line; as modeled in 3k0n) are also evident, with 2mFo-DFc values well above the 0.3σ (darker gray horizontal line) threshold, except for the Leu98 in the XFEL model (due to the lower resolution). A backrub motion of −10° positions the backbone properly for Ringer to best detect the minor conformation for Ser99, but not for Leu98.
Figure 3—figure supplement 1
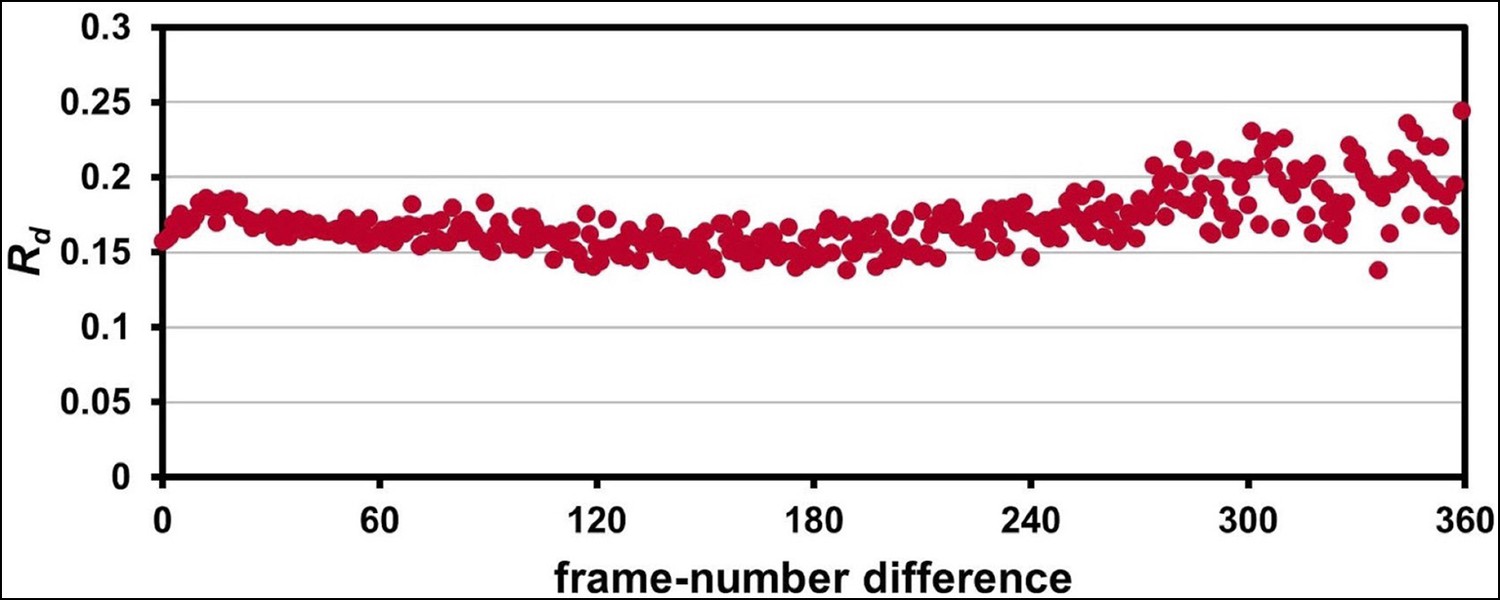
The 1.2 Å room-temperature CypA synchrotron data show no signs of radiation damage.
A plot of ‘decay R-factor’ (Rd) as a function of frame-number difference (as in Figure 1—figure supplement 2) has a slope of zero, indicating the absence of radiation damage. Rd is calculated using pairwise observations of unique reflections (hkl) with centroids on frames i and j, and the frame-number difference is given by i-j. The calculations were performed using a 2.0 Å resolution cutoff.
Figure 4 with 1 supplement

Alternative loop conformations can appear at lower temperatures.
The surface loop containing residues 79–83 adopts alternative conformations at low temperatures (top row) but not at high temperatures (bottom two rows). The secondary loop conformation is separated from the body of the protein by an ordered water molecule (red sphere); the van der Waals interactions between the loop and the water may reflect an enthalpic stabilization that is more dominant at low temperatures. The electron density peak to the right of the water corresponds to the backbone carbonyl oxygen of Glu81. 2mFo-DFc electron density contoured at 0.6σ (cyan mesh) and 2.0σ (dark blue mesh). XFEL: X-ray-free electron laser.
Figure 4—figure supplement 1

Alternative loop conformations are not present in the highest-resolution (1.2 Å) dataset.
The surface loop containing residues 79–83 does not adopt alternative conformations in the 1.2 Å synchrotron dataset. 2mFo-DFc electron density contoured at 0.6σ (cyan mesh) and 2.0σ (dark blue mesh).
Figure 5
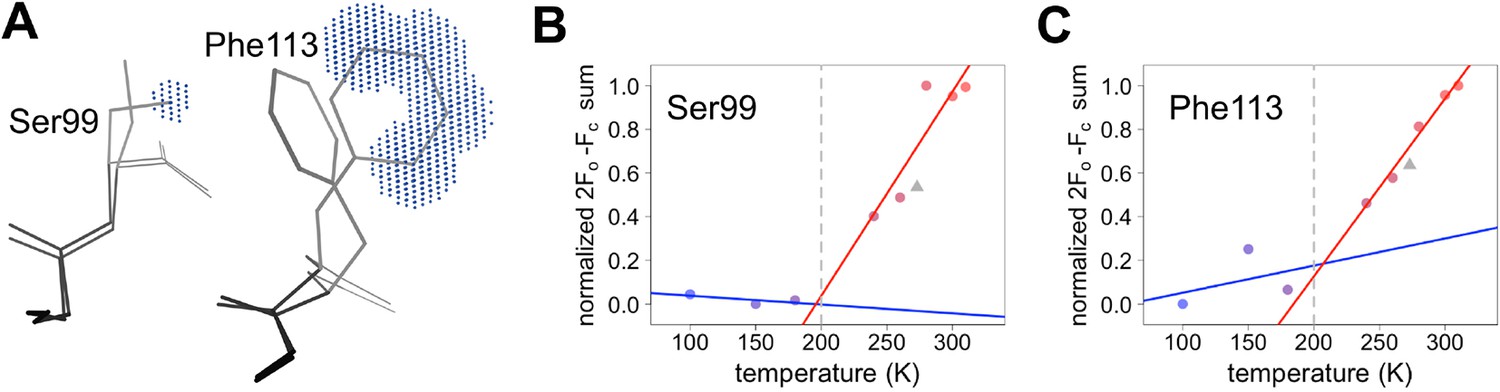
Quantifying temperature titration of conformational heterogeneity in multiconformer models.
(A) 2mFo-DFc electron density was summed over the volume occupied by the minor conformation but not the major conformation (blue grid points) for Ser99 and Phe113. (B,C) Minor-state 2mFo-DFc electron density increases with temperature. Electron density sums were normalized for each residue. Multitemperature points from synchrotron data are shown in colors corresponding to temperature. The X-ray-free electron laser point is shown as a gray triangle. Best-fit lines are shown for 180 K and below (blue) versus 240 K and above (red).
Figure 6 with 7 supplements
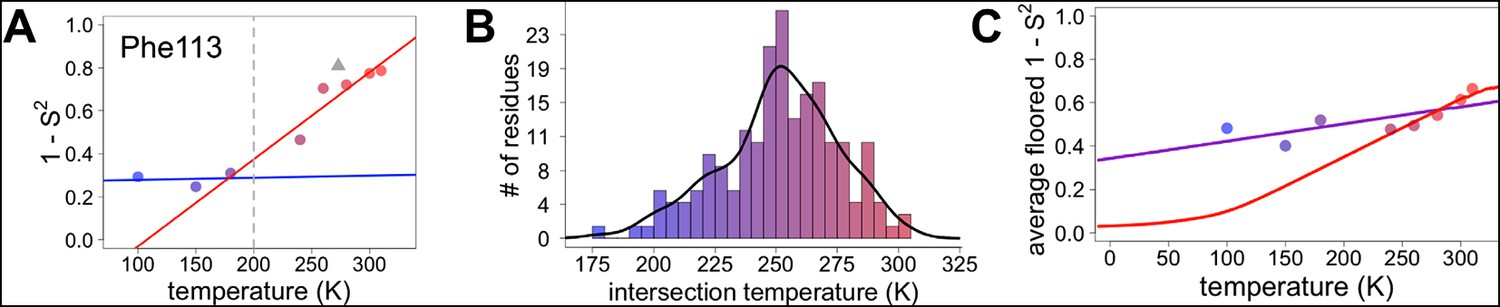
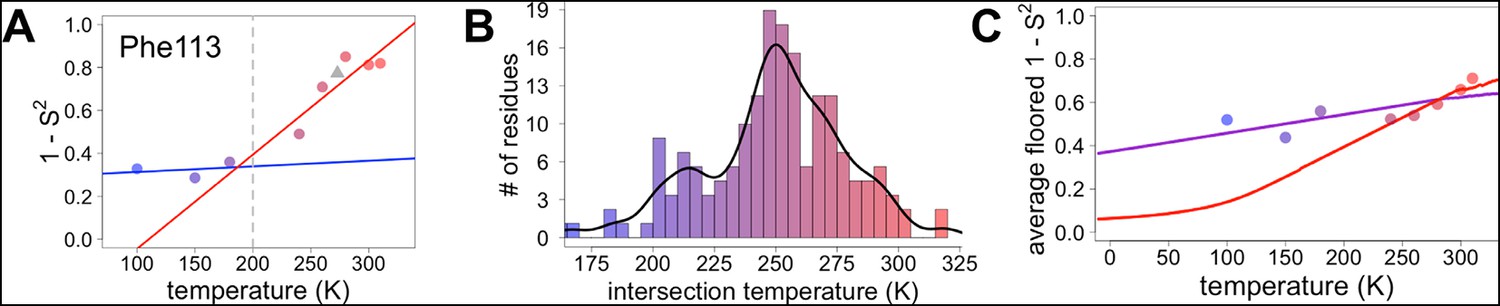
Diversity in temperature dependences of side chain disorder across cyclophilin A (CypA) does not predict the observed average arrest of disorder.
(A) The complement of B-factor-influenced side chain order parameter for the bond most closely associated with the χ1 dihedral angle for Phe113. Lines reflect least-squares fits to synchrotron models at 180 K and below (blue) versus 240 K and above (red). Multitemperature synchrotron points in colors; X-ray-free electron laser (XFEL) point (not included in fits) as gray triangle. (B) Distribution of the intersection temperature between the <200 and >200 K lines fitted with kernel density function. The peak is near 250 K, although there is a tail toward lower temperatures. Intersection temperatures were <170 K for four residues and >330 K for five residues. (C) Predicted and observed values for the complement of side chain order parameter, averaged over all residues in CypA. The predicted values were obtained by extrapolating each residue’s fit line for 240 K and above (red curve) or for the full 100–300 K (purple curve), flooring the result to 0, then averaging across all residues in CypA. Observed values, similarly floored and averaged, are shown as points.
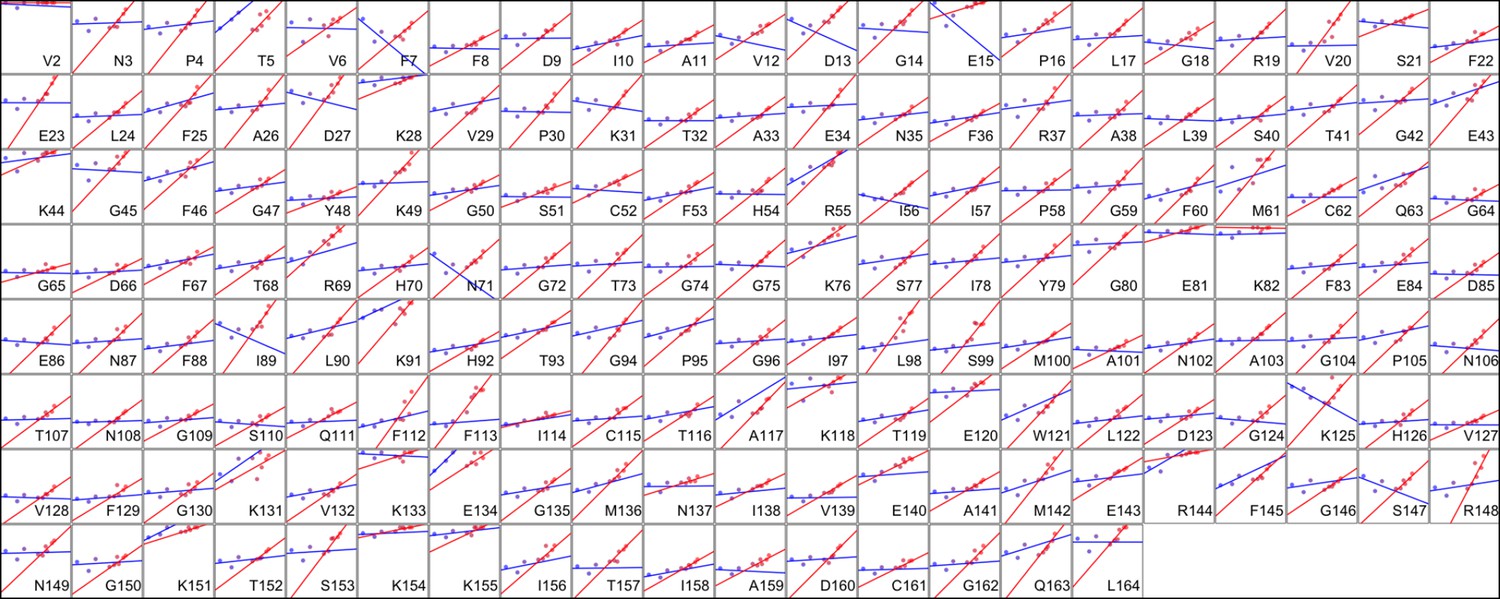
Figure 6—figure supplement 1
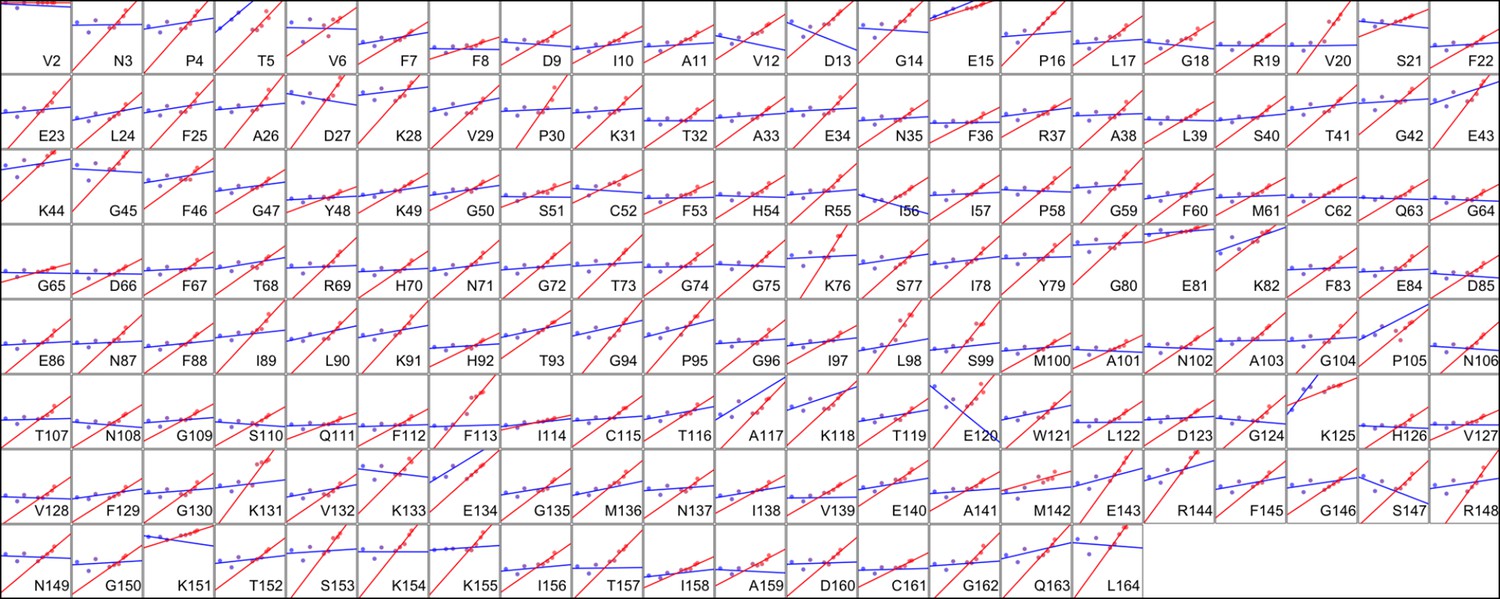
Heterogeneous response of side chain disorder to temperature.
The complement of B-factor-influenced side chain order parameter for the bond most closely associated with the χ1 dihedral angle for all residues in CypA. Lines reflect least-squares fits to synchrotron models for 180 K and below (blue) versus 240 K and above (red).
Figure 6—figure supplement 2
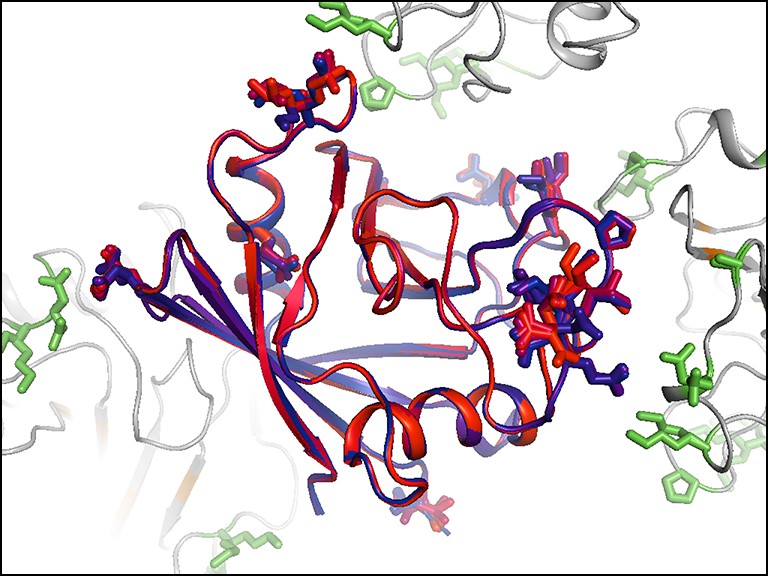
Residues with persistent disorder across temperatures are interconnected in the crystal lattice.
Several residues with high 1 – S2 values (Val2, Glu15, Gly80, Glu81, Lys82, Pro105, Ala117, Glu120, Lys125, Met142, Ser147, and Lys151) are shown for the central molecule (blue-to-red sticks and backbone) and also in symmetry mates (green sticks, gray backbone). Many of these residues appear to interact with each other via lattice contacts. Frustration in these interactions may lead to persistent disorder.
Figure 6—figure supplement 3
Diversity in temperature dependences of side chain-end disorder across CypA does not predict the observed average arrest of disorder.
Each panel is as in Figure 6 , but the order parameter now models the final heavy-atom to heavy-atom bond for each side chain (see ‘Methods’).
Figure 6—figure supplement 4
Heterogeneous response of side chain-end disorder to temperature.
The small multiple plots are as in Figure 6—figure supplement 1 , but the order parameter now models the final heavy-atom to heavy-atom bond for each side chain (see ‘Methods’).
Figure 6—figure supplement 5

Different residues extrapolate to different maximal-order temperatures.
Fit lines for temperature points at 240 K and above were used to extrapolate to the maximal-order temperature, at which 1 − S2 = 0. (A) Order parameter modeling the bond most closely associated with the χ1 dihedral angle. (B) Order parameter modeling the final heavy-atom to heavy-atom bond for each side chain.
Figure 6—figure supplement 6
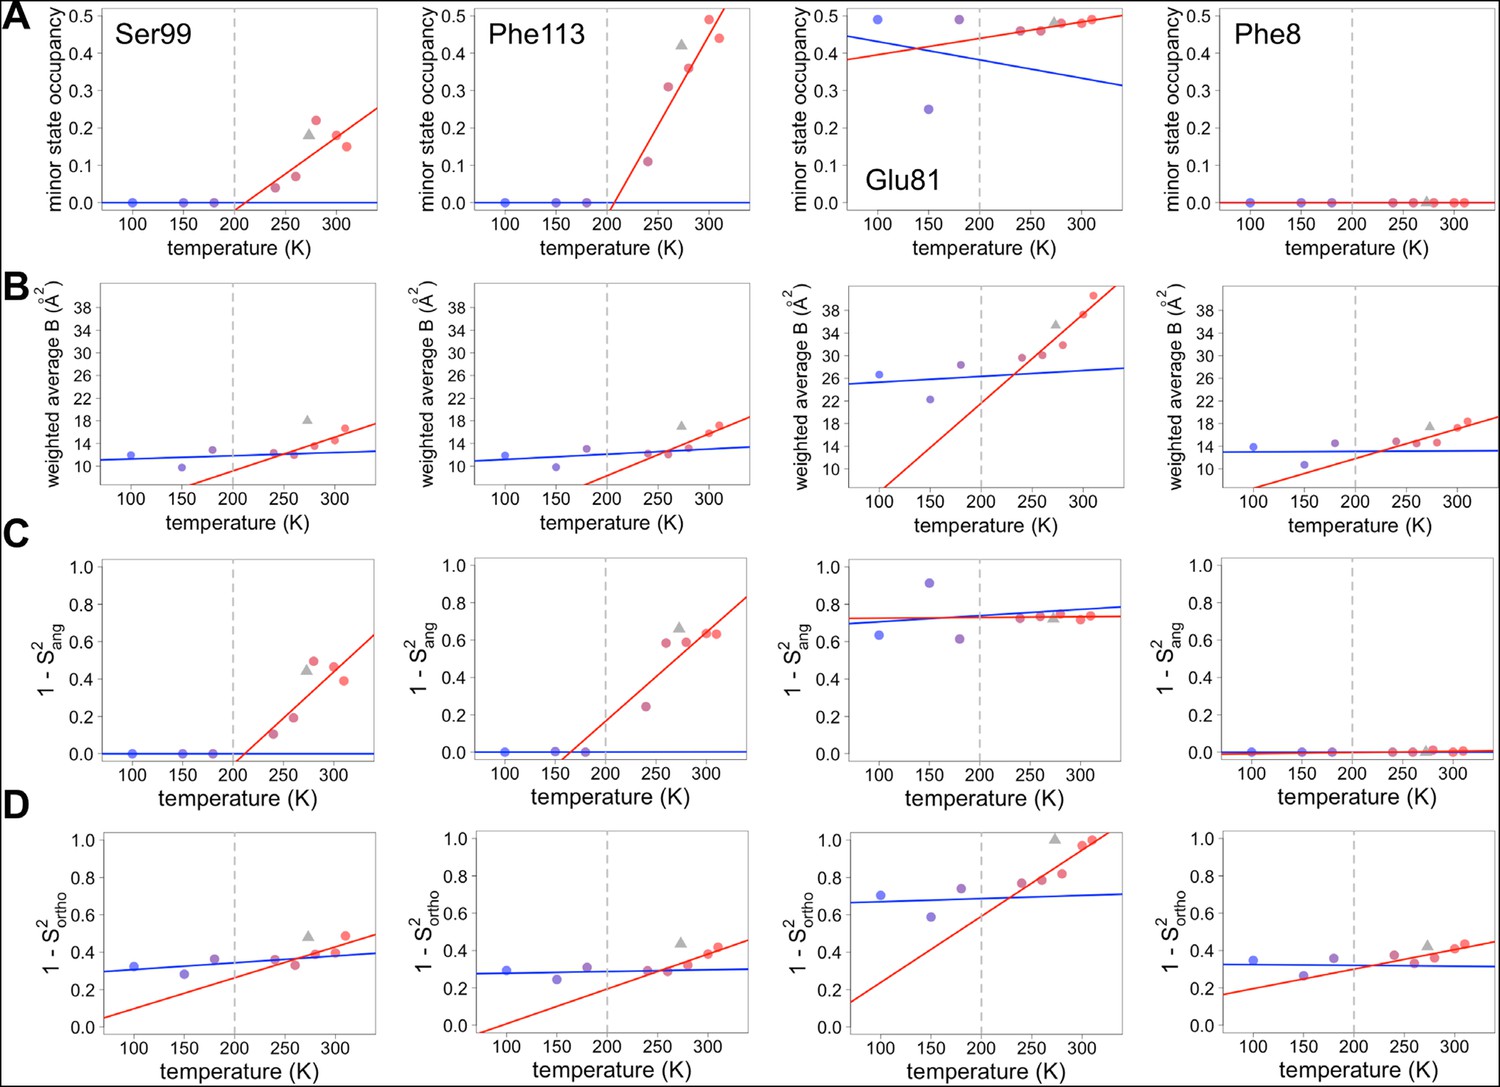
Both harmonic and non-harmonic flexibilities contribute to changes in order parameters with temperature.
(A– D) Contributions to χ1 order parameter versus temperature for four representative residues in CypA. Ser99 and Phe113 are in the active-site network, Glu81 is surface-exposed and adopts alternative conformations at all temperatures (Figure 4), and Phe8 is buried in the protein core and is single-rotamer at all temperatures. Similar conformations within the same rotameric well were grouped together for this analysis. (A) Occupancy of minor alternative conformations. (B) Intra-residue heavy-atom-average B-factor. (C) Complement of the S2ang component of the χ1 order parameter, which uses occupancy-weighted angles between bond vectors across alternative conformations. (D) Complement of the S2ortho component of the χ1 order parameter, which uses occupancy-weighted B-factors. Placement of XFEL points and coloring as in Figure 6A .
Figure 6—figure supplement 7

Globally averaged disorder exhibits an apparent transition near 250 K.
Points indicate observed values for the complement of side chain order parameters, floored at 0 and then averaged over all residues in CypA, as in Figure 6 . The blue and red lines represent fits to the ≤180 K and ≥240 K floored and averaged points, respectively. The fits to these globally averaged data suggest a transition at ∼250 K, even though the underlying heterogeneity of the individual residue responses does not indicate there is a transition near this temperature.
Figure 7
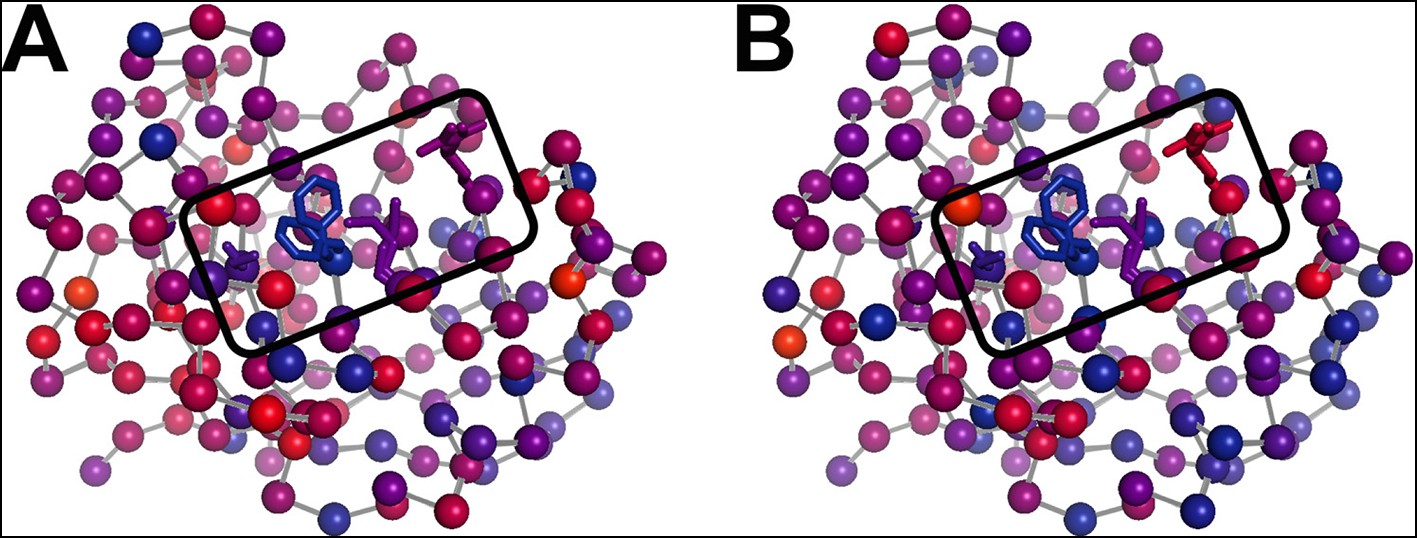
The temperature dependence of side chain disorder is non-homogenously spatially distributed in CypA.
Intersection temperatures from (A) χ1 order parameters as in Figure 6B or (B) side chain terminus order parameters as in Figure 6—figure supplement 3 B are mapped to the 1.2 Å room-temperature synchrotron model. Each residue is marked with a sphere colored based on its apparent transition temperature, from low (blue) to high (red). The active-site network is subdivided: Ser99 and Phe113 (left of boxed region) both transition at a low temperature regardless of order parameter bond vector, but Met61 and Arg55 transition at higher, different temperatures.
Figure 8

The dynamic active-site network of cyclophilin A (CypA) has a complex energy landscape.
(A) The previous simple model in which Ser99, Phe113, and Arg55 (Met61 omitted for clarity) interconvert from one macrostate (blue) to the other (red) completely collectively. NMR data suggest this process occurs on a millisecond timescale. (B) A more nuanced model in which network microstates are populated differently depending on the network macrostate, defined by the Phe113 rotameric state. In the left macrostate, Ser99 rotamer changes are disfavored because of steric overlaps with Phe113, but Arg55 rotamer changes are accommodated; the reverse is true (perhaps to a lesser extent) in the right macrostate. Within each microstate, rapid thermal motions occur (bottom right), and may alleviate some minor steric overlaps. Timescales are estimates consistent with NMR observables for CypA and other systems. ms: millisecond; ns: nanosecond; ps: picosecond.
Videos
Video 1
Animated interpolation between electron density maps in temperature trajectory.
For each pair of adjacent temperatures (e.g. 100 and 150 K), the temperature regime between them was bisected and an average 2mFo-DFc electron density map was calculated in reciprocal space using CCP4 utilities, until temperature points were spaced by <1 K. A new multiconformer model is shown when the animation reaches the corresponding temperature.
Video 2
Fixed-target X-ray-free electron laser (XFEL) data collection from cyclophilin A (CypA) crystals at the LCLS-XPP end station.
Screen capture image of the Blu-Ice GUI showing a video display of a CypA crystal. After each shot, a new damage line appears and the crystal is translated.
Video 3
Animated rotation around the 100 K (blue) and 310 K (red) models and electron density maps from Figure 4.
https://doi.org/10.7554/eLife.07574.017
Video 4
360° rotation around Figure 7B.
https://doi.org/10.7554/eLife.07574.028Tables
Table 1
Crystallographic statistics for multitemperature synchrotron datasets collected on a single crystal per dataset. Statistics for the highest resolution shell are shown in parentheses.
| 100 K | 150 K | 180 K | 240 K | 260 K | 280 K | 300 K | 310 K | |
|---|---|---|---|---|---|---|---|---|
| PDB ID | 4YUG | 4YUH | 4YUI | 4YUJ | 4YUK | 4YUL | 4YUM | 4YUN |
| Wavelength (Å) | 0.9767 | 0.9767 | 0.9767 | 0.9767 | 0.9767 | 0.9767 | 0.9767 | 0.9767 |
| Resolution range (Å) | 33.58–1.48 (1.53–1.48) | 16.95–1.34 (1.39–1.34) | 16.12–1.38 (1.43–1.38) | 34.05–1.42 (1.47–1.42) | 33.98–1.48 (1.53–1.48) | 25.23–1.42 (1.47–1.42) | 22.67–1.5 (1.55–1.50) | 22.66–1.58 (1.64–1.58) |
| Space group | P212121 | P212121 | P212121 | P212121 | P212121 | P212121 | P212121 | P212121 |
| Unit cell (a, b, c) | 42.24, 51.91, 88.06 | 42.45, 51.82, 88.01 | 42.42, 51.96, 88.21 | 43.04, 53.22, 88.63 | 43.09, 52.79, 88.81 | 43.00, 52.61, 89.12 | 43.01, 52.61, 89.32 | 42.85, 52.58, 89.41 |
| Total reflections | 160,129 (15,842) | 160,780 (7,437) | 154,202 (11,295) | 152,578 (13,600) | 134,699 (13,381) | 168,932 (15,019) | 144,734 (14,433) | 125,225 (12,326) |
| Unique reflections | 32,657 (3,240) | 42,288 (3,471) | 39,548 (3,820) | 38,881 (3,710) | 34,411 (3,391) | 38,763 (3,794) | 32,999 (3,254) | 28,291 (2,760) |
| Multiplicity | 4.9 (4.9) | 3.8 (2.1) | 3.9 (3.0) | 3.9 (3.7) | 3.9 (3.9) | 4.4 (4.0) | 4.4 (4.4) | 4.4 (4.5) |
| Completeness (%) | 99 (100) | 95 (80) | 97 (95) | 99 (96) | 100 (100) | 100 (100) | 99 (100) | 100 (100) |
| Mean I/sigma (I) | 14.07 (1.57) | 25.95 (3.24) | 16.47 (1.64) | 12.86 (1.66) | 10.09 (1.46) | 15.51 (1.52) | 16.90 (1.63) | 13.26 (1.45) |
| Wilson B-factor (Å2) | 16.07 | 13.12 | 16.95 | 15.55 | 16.06 | 17.62 | 19.75 | 21.44 |
| R-merge (%) | 6.8 (99.4) | 3.0 (29.4) | 4.2 (71.8) | 6.2 (99.2) | 8.1 (104.3) | 4.9 (100.0) | 4.7 (101.7) | 6.7 (127.3) |
| R-measurement (%) | 7.6 (111.0) | 3.4 (36.9) | 4.8 (85.6) | 7.2 (116.8) | 9.4 (120.8) | 5.6 (115.3) | 5.4 (115.9) | 7.6 (144.5) |
| CC1/2 | 1.00 (0.62) | 1.00 (0.90) | 1.00 (0.60) | 1.00 (0.50) | 1.00 (0.52) | 1.00 (0.52) | 1.00 (0.59) | 1.00 (0.56) |
| CC* | 1.00 (0.88) | 1.00 (0.97) | 1.00 (0.87) | 1.00 (0.82) | 1.00 (0.83) | 1.00 (0.83) | 1.00 (0.86) | 1.00 (0.85) |
| Refinement resolution range (Å) | 33.085–1.48 (1.558–1.48) | 19.117–1.34 (1.394–1.34) | 16.995–1.38 (1.435–1.38) | 34.055–1.42 (1.477–1.42) | 33.98–1.48 (1.547–1.48) | 25.23–1.42 (1.477–1.42) | 22.67–1.5 (1.579–1.5) | 25.2221.58 (1.679 –1.58) |
| Reflections used in refinement | 32,627 (4,654) | 42,278 (3,932) | 39,545 (4,265) | 38,879 (4,161) | 34,411 (4,237) | 38,762 (4,256) | 32,999 (4,643) | 28,287 (4,632) |
| Reflections used for R-free | 1,028 (147) | 1,325 (125) | 1,238 (133) | 1,218 (130) | 1,080 (133) | 1,217 (133) | 1,036 (145) | 889 (146) |
| R-work (%) | 13.3 (20.4) | 12.4 (16.4) | 13.3 (25.4) | 12.6 (26.3) | 13.1 (26.0) | 11.1 (22.6) | 10.8 (20.0) | 11.7 (21.8) |
| R-free (%) | 18.3 (26.8) | 15.6 (21.3) | 17.5 (33.0) | 15.6 (30.4) | 16.8 (31.2) | 14.3 (25.5) | 14.4 (24.8) | 15.0 (28.8) |
| Number of non-hydrogen atoms | 2,279 | 2,433 | 1,969 | 1,993 | 2,035 | 2,120 | 2,096 | 2,172 |
| Macromolecule atoms | 1,933 | 2,132 | 1,745 | 1,750 | 1,837 | 1,924 | 1,952 | 2,061 |
| Protein residues | 165 | 164 | 164 | 163 | 163 | 163 | 163 | 163 |
| RMS (bonds) (Å) | 0.009 | 0.008 | 0.008 | 0.009 | 0.009 | 0.008 | 0.009 | 0.009 |
| RMS (angles) (°) | 1.16 | 1.20 | 1.23 | 1.20 | 1.16 | 1.16 | 1.14 | 1.14 |
| Ramachandran favored (%) | 97 | 94 | 97 | 96 | 97 | 96 | 97 | 96 |
| Ramachandran allowed (%) | 3.3 | 5.7 | 2.7 | 4.1 | 3 | 4.2 | 3.3 | 3.9 |
| Ramachandran outliers (%) | 0 | 0 | 0 | 0 | 0 | 0 | 0 | 0 |
| Rotamer outliers (%) | 2.4 | 1.3 | 0.53 | 1.1 | 1.5 | 1.9 | 1.4 | 0.88 |
| Clashscore | 0.57 | 1.08 | 0.00 | 1.24 | 0.27 | 0.78 | 0.52 | 0.00 |
| Average B-factor (Å2) | 21.74 | 17.25 | 21.85 | 20.14 | 20.00 | 21.48 | 24.09 | 25.77 |
| Macromolecule average B-factor (Å2) | 18.48 | 14.67 | 19.99 | 17.95 | 18.17 | 19.61 | 22.82 | 24.94 |
| Solvent average B-factor (Å2) | 39.99 | 35.54 | 36.34 | 35.89 | 37.01 | 39.89 | 41.23 | 41.30 |
-
PDB: Protein Data Bank. CC: correlation coefficient.
Table 2
Improvements in validation statistics from finalizing raw qFit models. Statistics calculated with phenix.molprobity.
| RT synchrotron | XFEL | 100 K | 150 K | 180 K | 240 K | 260 K | 280 K | 300 K | 310 K | ||
|---|---|---|---|---|---|---|---|---|---|---|---|
| Rfree (%) | Raw qFit | 16.7 | 25.2 | 19.0 | 16.9 | 18.5 | 17.5 | 17.9 | 15.7 | 16.3 | 16.1 |
| Final | 14.6 | 24.9 | 18.3 | 15.6 | 17.5 | 15.6 | 16.8 | 14.3 | 14.4 | 15.0 | |
| Δ | –2.1 | –0.3 | –0.7 | –1.3 | –1.0 | –1.9 | –1.1 | –1.4 | –1.9 | –1.1 | |
| MolProbity score | Raw qFit | 1.47 | 1.80 | 1.79 | 1.31 | 1.21 | 1.18 | 1.45 | 1.28 | 0.95 | 1.19 |
| Final | 1.08 | 1.39 | 1.19 | 1.29 | 0.63 | 1.14 | 0.91 | 1.25 | 0.99 | 0.76 | |
| Δ | –0.39 | –0.41 | –0.80 | –0.02 | –0.58 | –0.04 | –0.54 | –0.03 | 0.04 | –0.43 |
-
RT: Room temperature; XFEL: X-ray-free electron laser.
Table 3
Crystallographic statistics for room-temperature XFEL dataset collected across 71 crystals. Statistics for the highest resolution shell are shown in parentheses.
| XFEL | |
|---|---|
| PDB ID | 4YUP |
| Resolution range (Å) | 43.98 –1.75 (1.81 –1.75) |
| Space group | P212121 |
| Unit cell (a, b, c) | 42.42, 51.82, 87.96 |
| Unique reflections | 19,942 (1894) |
| Completeness (%) | 99 (96) |
| Wilson B-factor (Å2) | 21.12 |
| Refinement resolution range (Å) | 43.98 –1.75 (1.93 –1.75) |
| Reflections used in refinement | 19,936 (4,811) |
| Reflections used for R-free | 625 (151) |
| R-work (%) | 20.0 (34.3) |
| R-free (%) | 24.9 (36.1) |
| Number of non-hydrogen atoms | 1,762 |
| Macromolecular atoms | 1,559 |
| Protein residues | 164 |
| RMS (bonds) (Å) | 0.017 |
| RMS (angles) (°) | 1.44 |
| Ramachandran favored (%) | 96 |
| Ramachandran allowed (%) | 3.6 |
| Ramachandran outliers (%) | 0 |
| Rotamer outliers (%) | 1.8 |
| Clashscore | 1.92 |
| Average B-factor (Å2) | 29.03 |
| Macromolecule average B-factor (Å2) | 26.52 |
| Solvent average B-factor (Å2) | 48.25 |
| Number of TLS groups | 3 |
-
PDB: Protein Data Bank; TLS: translation libration screw; XFEL: X-ray-free electron laser.
Table 4
Crystallographic statistics for room-temperature synchrotron dataset collected on a single crystal. Statistics for the highest resolution shell are shown in parentheses.
| 1.2 Å Synchrotron | |
|---|---|
| PDB ID | 4YUO |
| Wavelength (Å) | 0.9795 |
| Resolution range (Å) | 44.60 –1.20 (1.24 –1.20) |
| Space group | P212121 |
| Unit cell (a, b, c) | 42.9, 52.43, 89.11 |
| Total reflections | 307,722 (18,999) |
| Unique reflections | 58,118 (5,122) |
| Multiplicity | 5.3 (3.7) |
| Completeness (%) | 91 (82) |
| Mean I/sigma (I) | 10.99 (5.93) |
| Wilson B-factor (Å2) | 15.22 |
| R-merge (%) | 11.2 (20.4) |
| R-measurement (%) | 12.2 (23.4) |
| CC1/2 | 0.99 (0.96) |
| CC* | 1.00 (0.99) |
| Refinement resolution range (Å) | 45.19 –1.20 (1.23 –1.20) |
| Reflections used in refinement | 58,108 (3,657) |
| Reflections used for R-free | 2,000 (126) |
| R-work (%) | 12.7 (31.3) |
| R-free (%) | 14.6 (33.5) |
| Number of non-hydrogen atoms | 2327 |
| Macromolecular atoms | 2143 |
| Protein residues | 163 |
| RMS (bonds) (Å) | 0.009 |
| RMS (angles) (°) | 1.16 |
| Ramachandran favored (%) | 96 |
| Ramachandran allowed (%) | 4.1 |
| Ramachandran outliers (%) | 0 |
| Rotamer outliers (%) | 0.84 |
| Clashscore | 0.98 |
| Average B-factor (Å2) | 19.62 |
| Macromolecule average B-factor (Å2) | 18.40 |
| Solvent average B-factor (Å2) | 33.86 |
-
PDB: Protein Data Bank.
Download links
A two-part list of links to download the article, or parts of the article, in various formats.
Downloads (link to download the article as PDF)
Open citations (links to open the citations from this article in various online reference manager services)
Cite this article (links to download the citations from this article in formats compatible with various reference manager tools)
Mapping the conformational landscape of a dynamic enzyme by multitemperature and XFEL crystallography
eLife 4:e07574.
https://doi.org/10.7554/eLife.07574


