Sex differences in cerebellar synaptic transmission and sex-specific responses to autism-linked Gabrb3 mutations in mice
- Northwestern University, United States
Figures
Figure 1 with 2 supplements
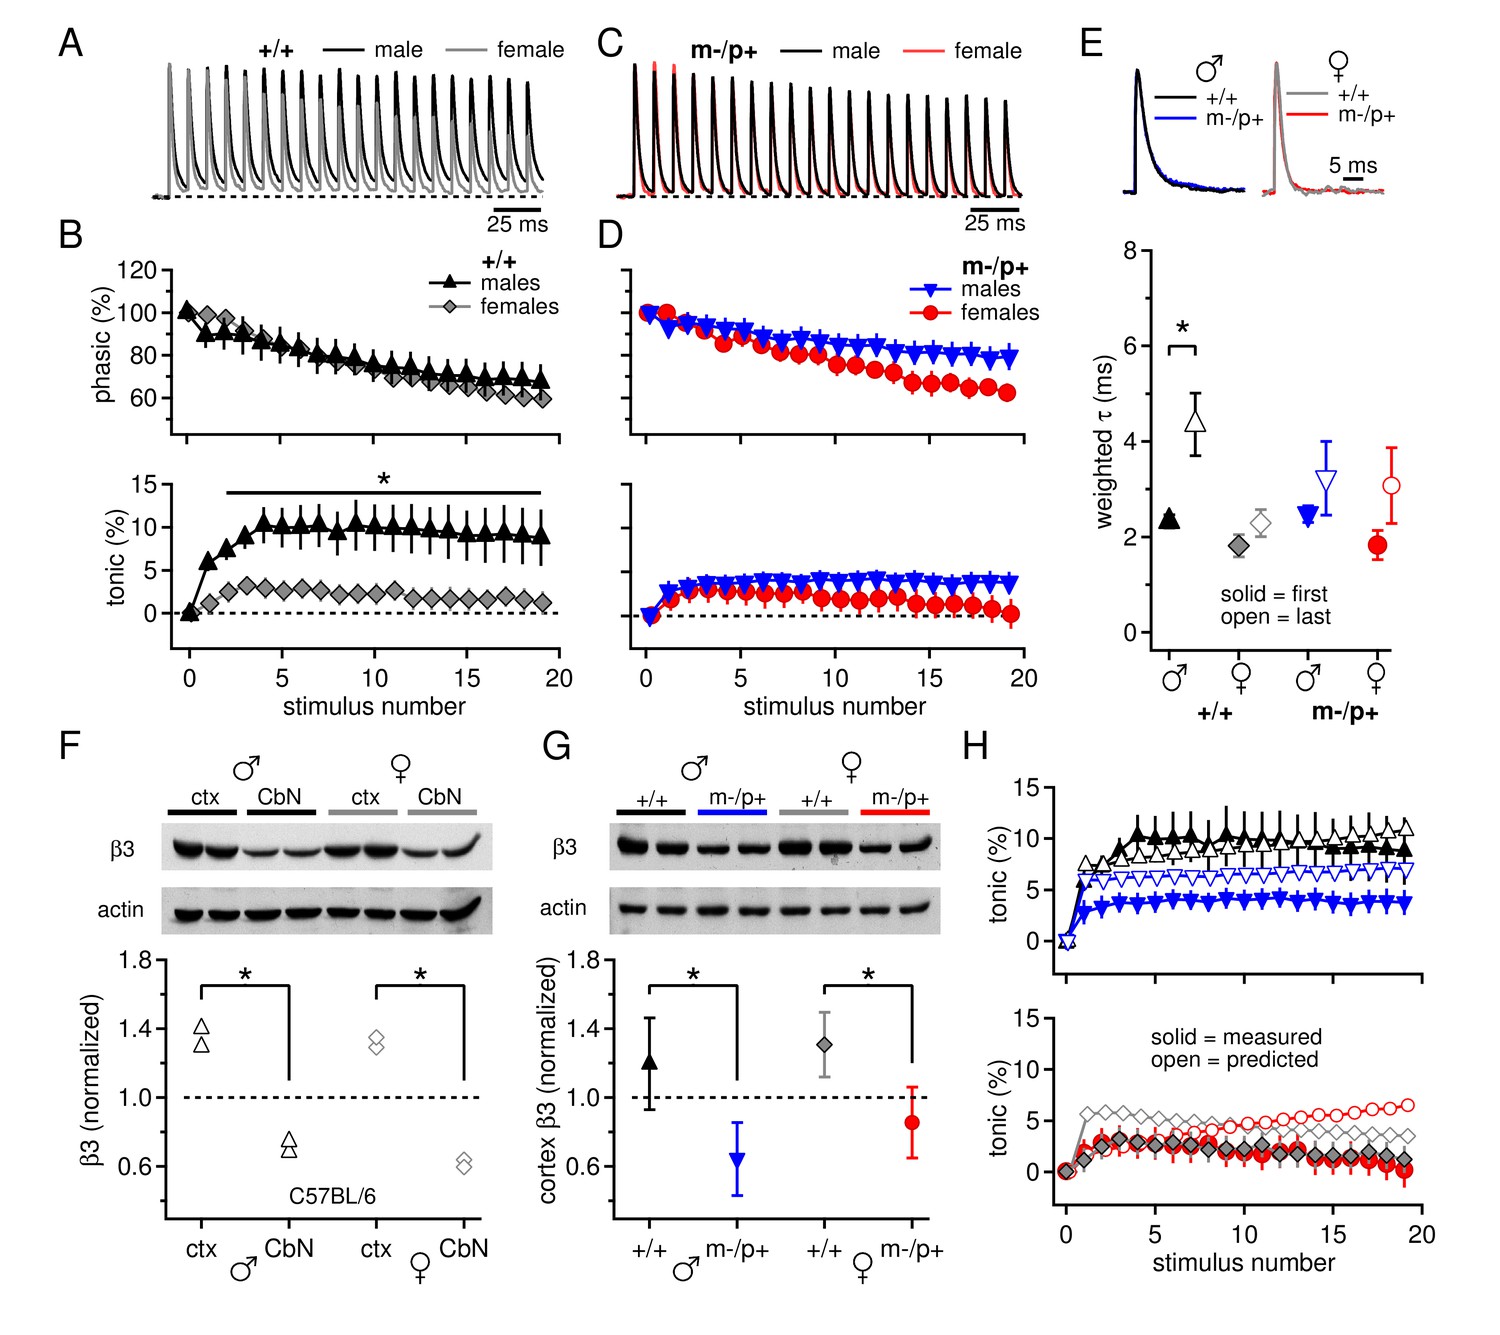
Sex differences in CbN synaptic currents and sex-specific responses to the Gabrb3 m-/p+ mutation.
(A) 100-Hz trains of synaptic currents evoked in CbN cells from male and female wild-type mice, normalized to the first peak. Dotted line, baseline holding current. (B) Mean amplitudes of phasic (upper panel) and tonic (lower panel) synaptic currents as a percentage of the first peak synaptic current vs. stimulus number. Dotted line, 0 current. (C,D) As in A, B, but for cells from male and female m-/p+ mice. (E) Top: example IPSCs evoked by a single stimulus, normalized to the peak current. Bottom: Solid symbols: weighted τdecay for IPSCs from a single stimulus. Open symbols: weighted τdecay for the last IPSC in the train. (F) Representative blot (top) and quantification (bottom) for β3 subunit expression in the cerebellar cortex vs. the cerebellar nuclei in C57BL/6 mice. Each symbol represents the normalized value for one lane. (G) Representative blot (top) and quantification (bottom) for normalized β3 subunit protein expression in the cerebellar cortex of Gabrb3 mice. (H) Solid symbols: measured tonic current, re-plotted from (B) and (D). Open symbols: predicted tonic current, calculated from the weighted τdecay of the first and last IPSCs. Symbol color code as in (E). In all figures, data are plotted as mean ± SEM. Asterisks indicates statistically significant differences.
Figure 1—figure supplement 1
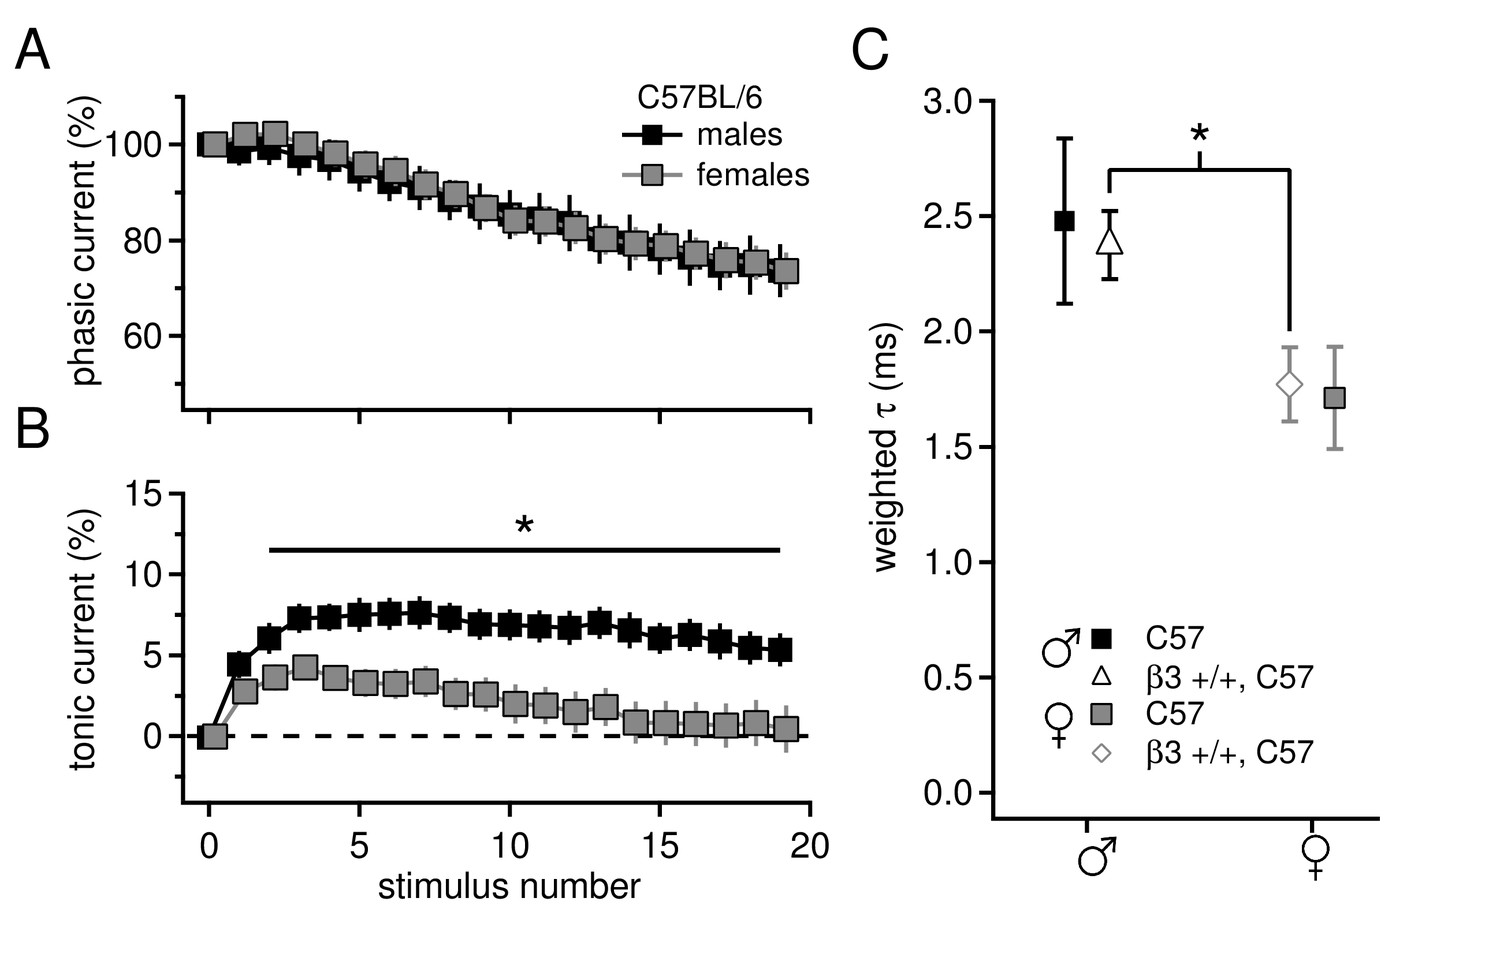
Sex differences in tonic current and IPSC decay kinetics in C57BL/6 mice.
(A) Phasic current, as a percentage of initial IPSC amplitude, over 20 stimuli for C57BL/6 males (n=16) and females (n=16). The curves do not differ between males and females (p=0.9). (B) Tonic current, as a percentage of initial IPSC amplitude, over 20 stimuli for C57BL/6 males and females. Females have significantly less tonic current than males (p=0.015). (C) Weighted decay time constants for IPSCs recorded from CbN cells of males and females for C57BL/6 mice (closed symbols). Males tended to have slower decay times than females (males 2.5 ± 0.4 ms, n=11; females 1.7 ± 0.2 ms, n=9; p=0.088). Decay times for C57 males and Gabrb3 +/+ males were not significantly different (p=0.7), nor were decay times for C57 females and Gabrb3 +/+ females (p=0.8). Combining the datasets for sex-matched wild-type cells (open symbols) demonstrates that IPSC decay times are significantly faster in females than in males (males 2.4 ± 0.1, n=33; females 1.8 ± 0.2, n=21; p=0.008).
Figure 1—figure supplement 2
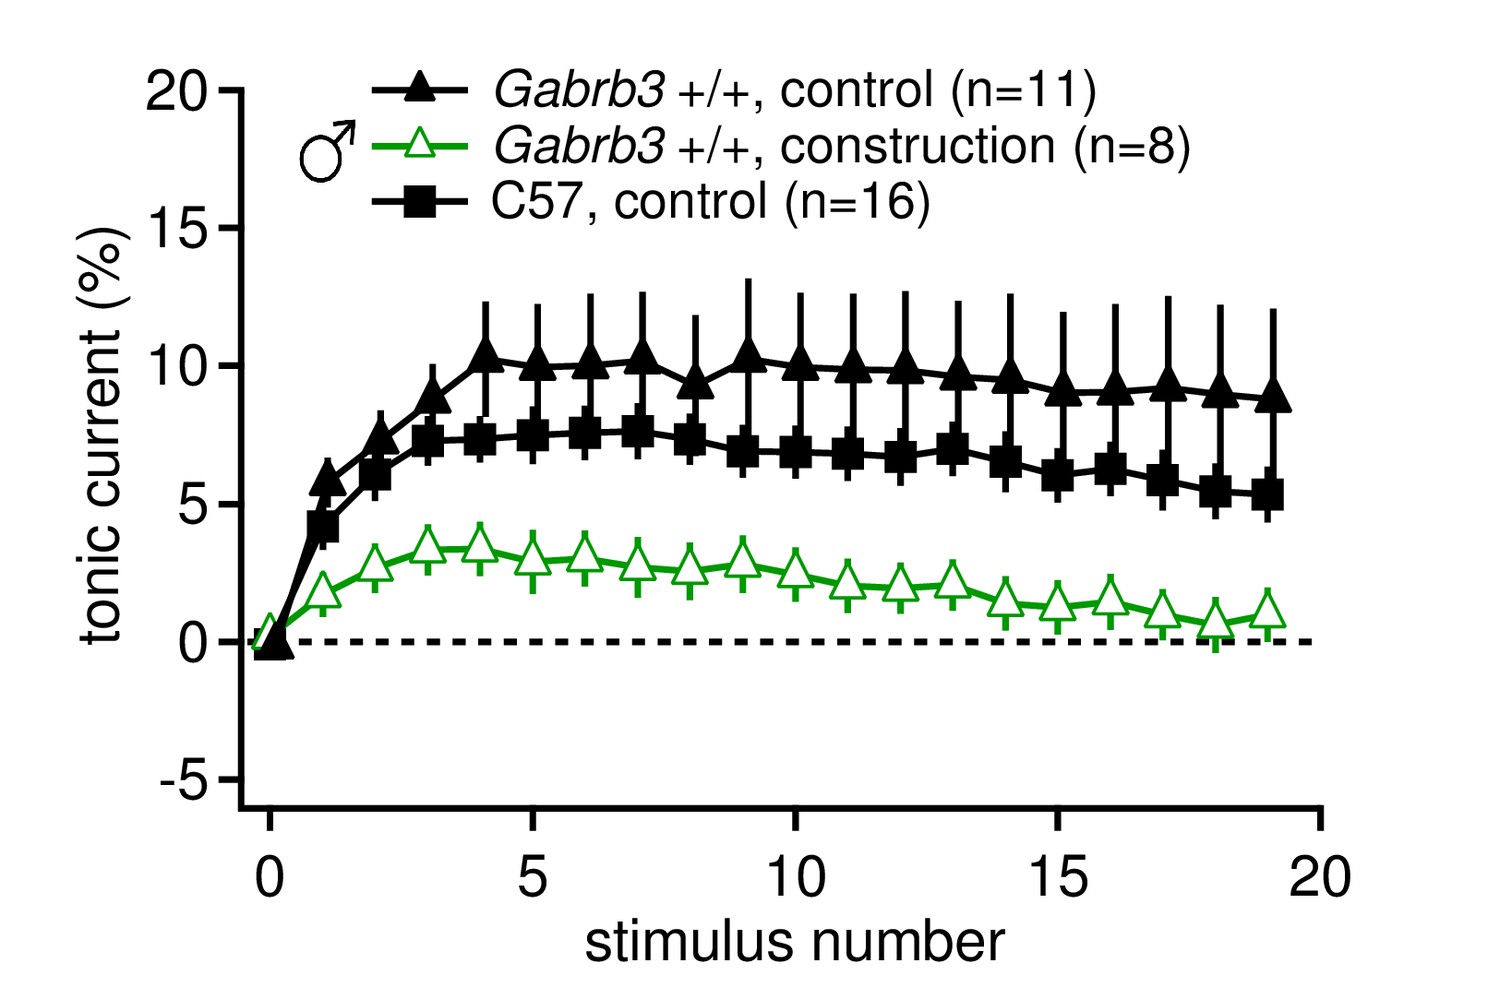
Tonic synaptic current, likely mediated by mGluR1/5, may be modulated by environmental conditions such as chronic stress.
Tonic current, as a percentage of initial IPSC amplitude, for 20 stimuli at 100 Hz for Gabrb3 +/+ male mice before (control) and during construction (construction), and C57BL/6 control male mice. Nearby construction caused daily intense vibrations in the facility where mice were housed. Tonic currents from CbN cells of mice born after construction began (open green triangles, 'construction') were significantly smaller than tonic currents from mice born and recorded from before construction began (black triangles, control, re-plotted from Figure 1, p=0.040 vs. 'construction'). C57BL/6J male mice were not bred and housed on site (black squares) and had similar tonic currents to control Gabrb3 +/+ mice (p=0.26).
Figure 2

Group I mGluRs account for differences in synaptic currents and responses to the Gabrb3 m-/p+ mutation.
(A) Synaptic currents in the presence of CPCCOEt evoked in CbN cells from male and female wild-type mice. Dotted line, baseline holding current. (B) Mean amplitudes of phasic (upper panel) and tonic (lower panel) synaptic currents recorded in CPCCOEt as a percentage of the peak current evoked by the first stimulus in each train vs. stimulus number. Control data from Figure 1 are superimposed for comparison. Dotted line, 0% current. (C, D) As in B, but for cells from male and female m-/p+ mice. (E) Percent difference in tonic current ± CPCCOEt for each group, calculated from the difference between the mean tonic current for stimuli 5–10 in control and CPCCOEt solutions. (F) Solid symbols: weighted τdecay for each group in CPCCOEt. Open symbols: weighted τdecay from the last IPSC of the train, in CPCCOEt.
Figure 3
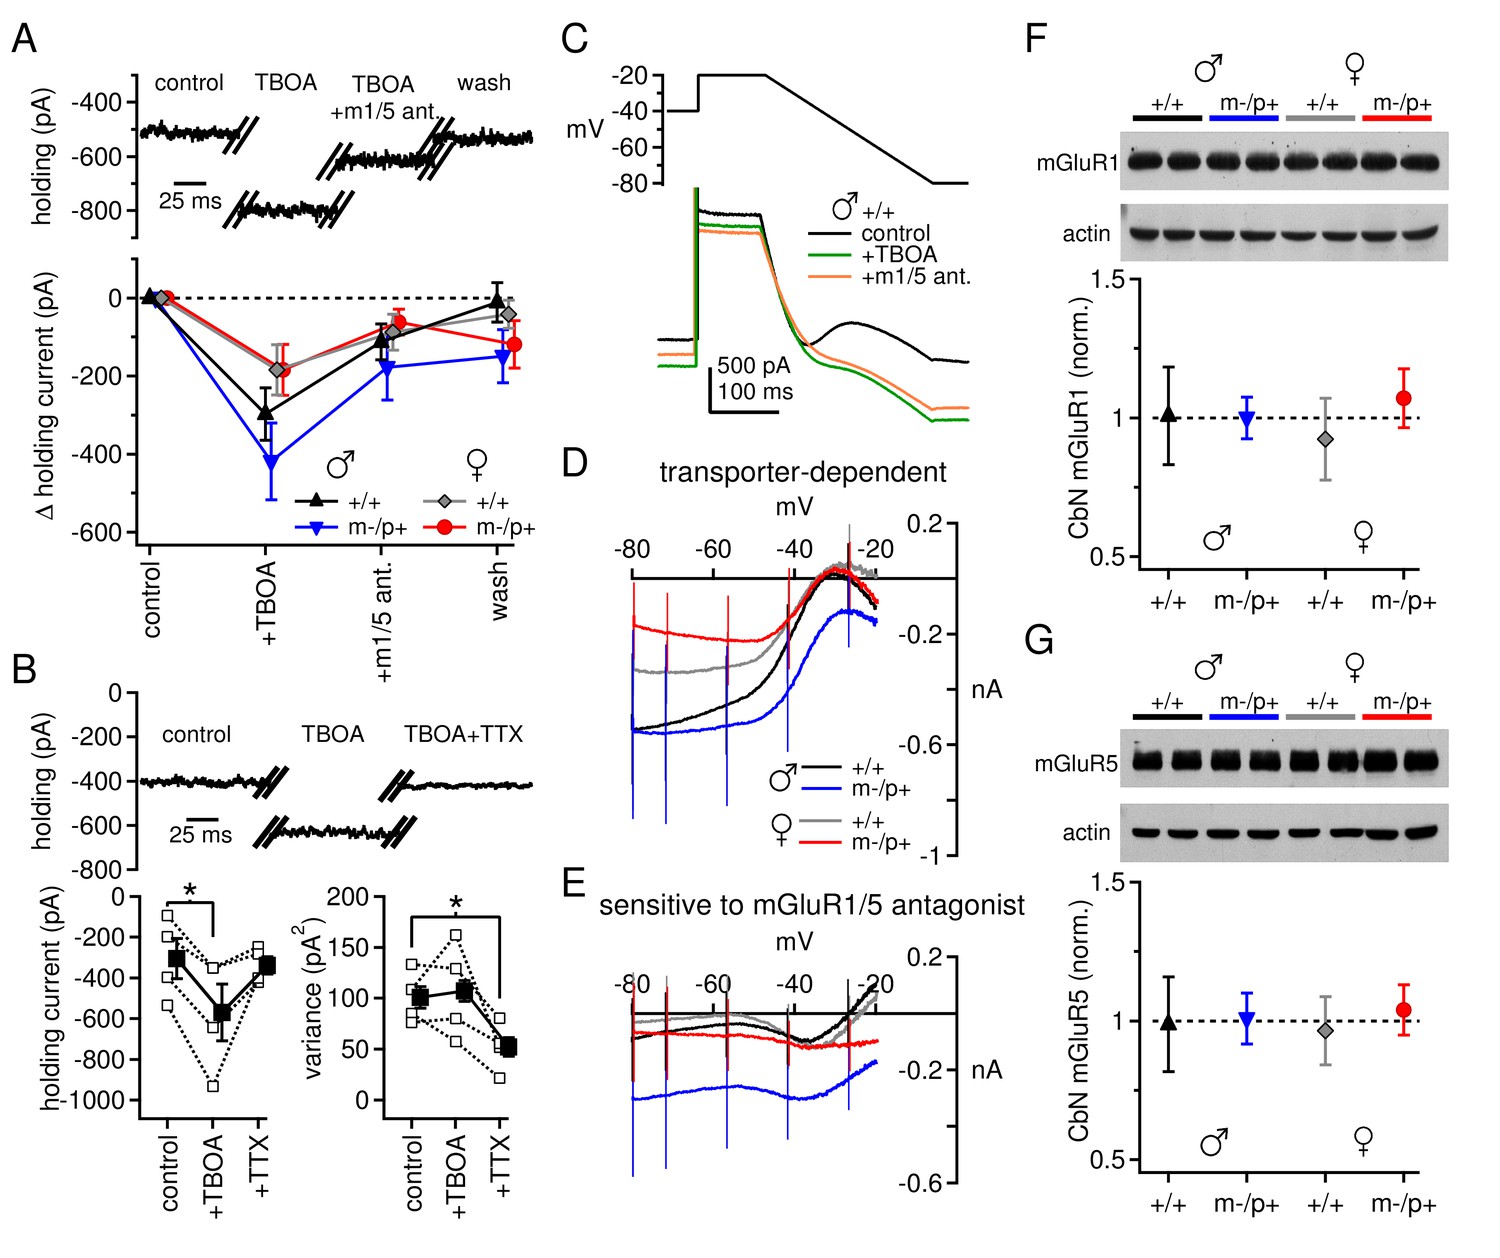
Differences in mGluR1/5-dependent currents depend on glutamate access to receptors rather than receptor expression.
(A) Increase in holding current in a +/+ male mouse by TBOA reversal by group I mGluR antagonists. (B) Increase in holding current by TBOA reversal by TTX. Top: sample traces from a C57BL/6 male mouse. Bottom: summary data for current amplitude (left) and variance (right). (C) Voltage ramp (top) and current (bottom) for a +/+ male in control, TBOA, and TBOA + mGluR1/5 antagonist(s). Each current is the mean of three traces. (D) Transporter-induced current (control current minus current in TBOA) vs. voltage. (E) TBOA-induced current sensitive to mGluR1/5 antagonist(s) (current in TBOA minus current in TBOA + mGluR1/5 antagonist), vs. voltage. In all figures, 'm1/5 ant.' indicates either CPCCOEt or JNJ16259685 + MPEP. (F) Representative blot (top) and summary (bottom) for normalized mGluR1 protein expression in the CbN of Gabrb3 mice. (G) As in (F), for mGluR5.
Figure 4
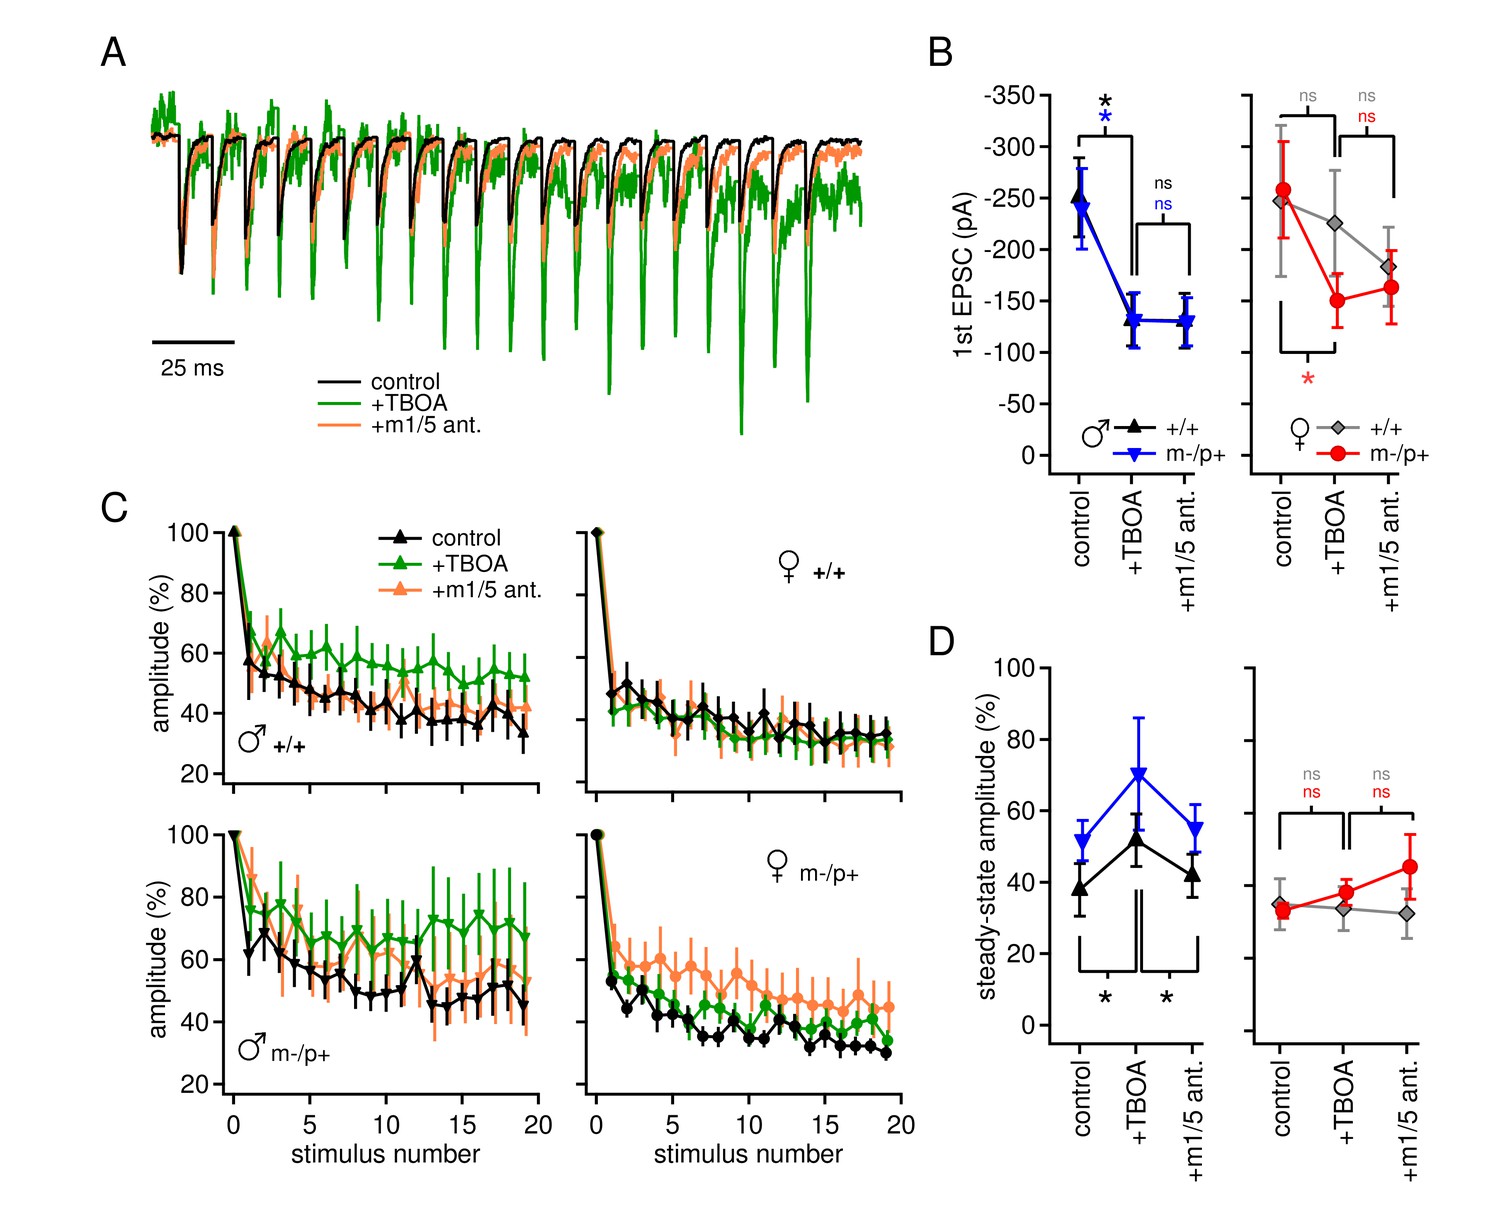
Group I mGluR-dependent and -independent effects of TBOA on evoked EPSCs.
(A) Sample traces from a CbN cell from a m-/p+ male of EPSCs elicited by 100 Hz stimulus trains, in control, TBOA, and TBOA + mGluR1/5 antagonist(s), normalized to the peak of the first EPSC. (B) First EPSC amplitude in control, TBOA, and TBOA + mGluR1/5 antagonist(s). Color code indicates statistical differences, 'ns,' non-significant. (C) EPSC amplitude for EPSCs evoked at 100 Hz in control, TBOA, and TBOA + mGluR1/5 antagonist(s). (D) The steady-state amplitude, measured as the mean of the last 5 EPSCs normalized to the first EPSC, for males (left) and females (right) in control, TBOA, and TBOA + mGluR1/5 antagonist(s).
Figure 5
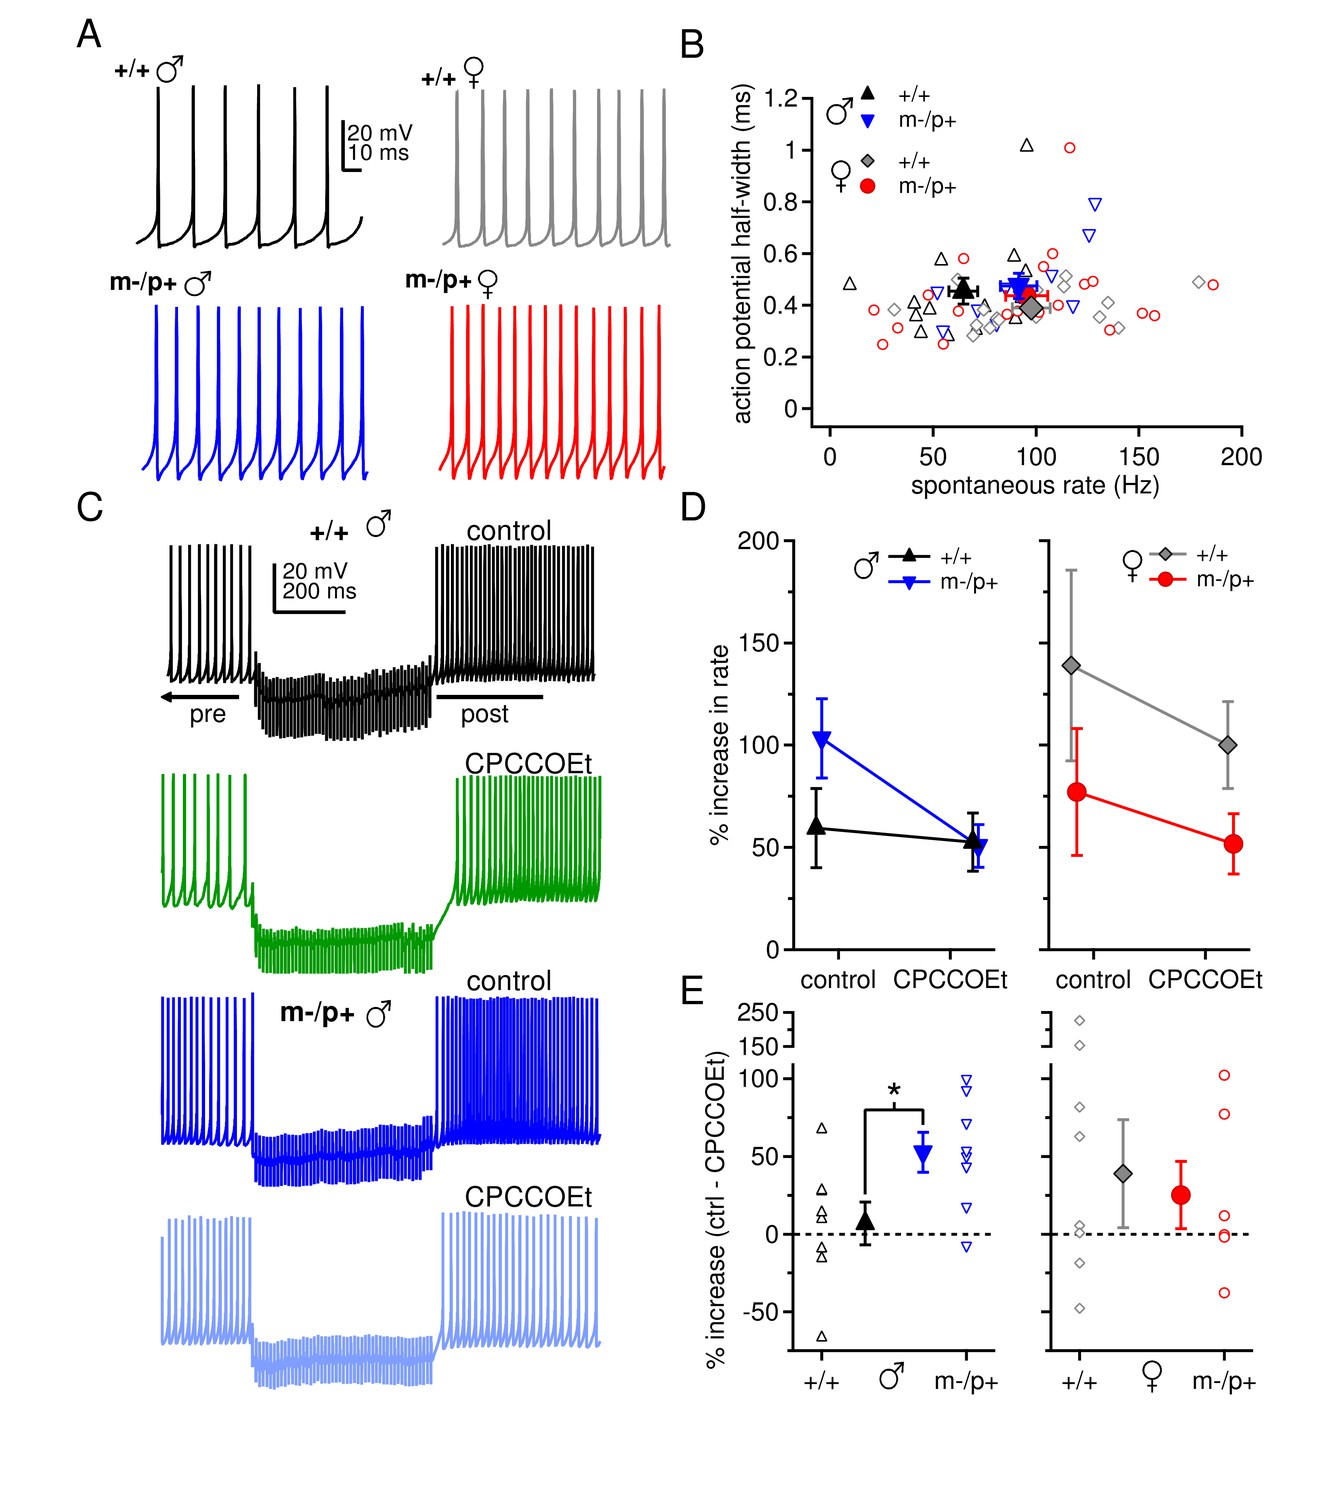
Sex differences in spontaneous firing rates and evoked rebound firing, and sex-specific responses to the Gabrb3 m-/p+ mutation.
(A) Sample traces of spontaneous action potentials in CbN cells. (B) Action potential half-width vs. spontaneous firing rate for all cells from all groups. Open symbols, individual cells; closed symbols, mean values. (C) Action potentials in a CbN cell, interrupted by a 500-ms, 100-Hz net inhibitory stimulus train, before and after application of CPCCOEt, for wild-type and m-/p+ CbN cells from males. To facilitate comparison, pre-stimulus firing was kept near 40 Hz (below the spontaneous rate) with constant holding current. (D) Difference between post- and pre-stimulus rates as a percentage of the pre-stimulus rate, before and after application of CPCCOEt for CbN cells from males (left) and females (right). (E) The percent increase in rate that depends on mGluR1/5, calculated from cell-by-cell differences between rate increases ± CPCCOEt in C, for males (left) and females (right). Dotted lines, 0%.
Figure 6 with 3 supplements
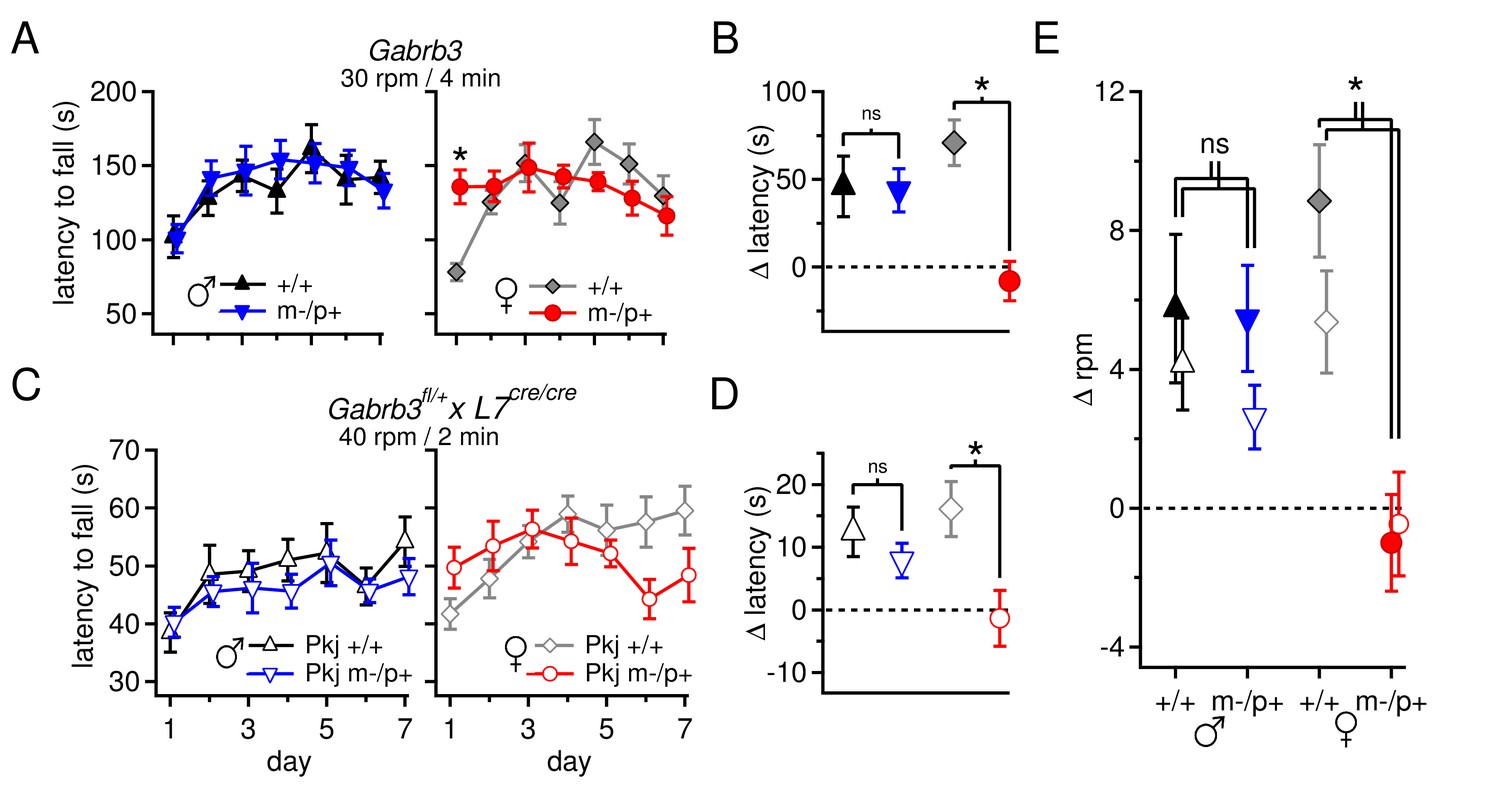
Performance on the accelerating rotarod varies with sex and Gabrb3 and depends on GABAAR β3 expression only in Purkinje cells.
(A) Latency to fall vs. training day for Gabrb3 P22 males (left) and females (right). (B) Change in latency, calculated as the difference between the Day-1 fall latency and mean Day 5–7 fall for all four groups. Symbol color code as in (A). (C) Latency to fall vs. training day for P22 Purkinje-specific Gabrb3 P22 males (left) and females (right). (D) Change in latency, calculated as the difference between the Day-1 fall latency and mean Day 5–7 fall for Purkinje-specific Gabrb3 mice. Symbol color code as in (C). (E) Change in the rotation rate (in rpm) at which the mouse fell on Day-1 vs. mean Day 5–7 for global Gabrb3 mice (closed symbols) and Purkinje-specific Gabrb3 mice (open symbols).
Figure 6—figure supplement 1
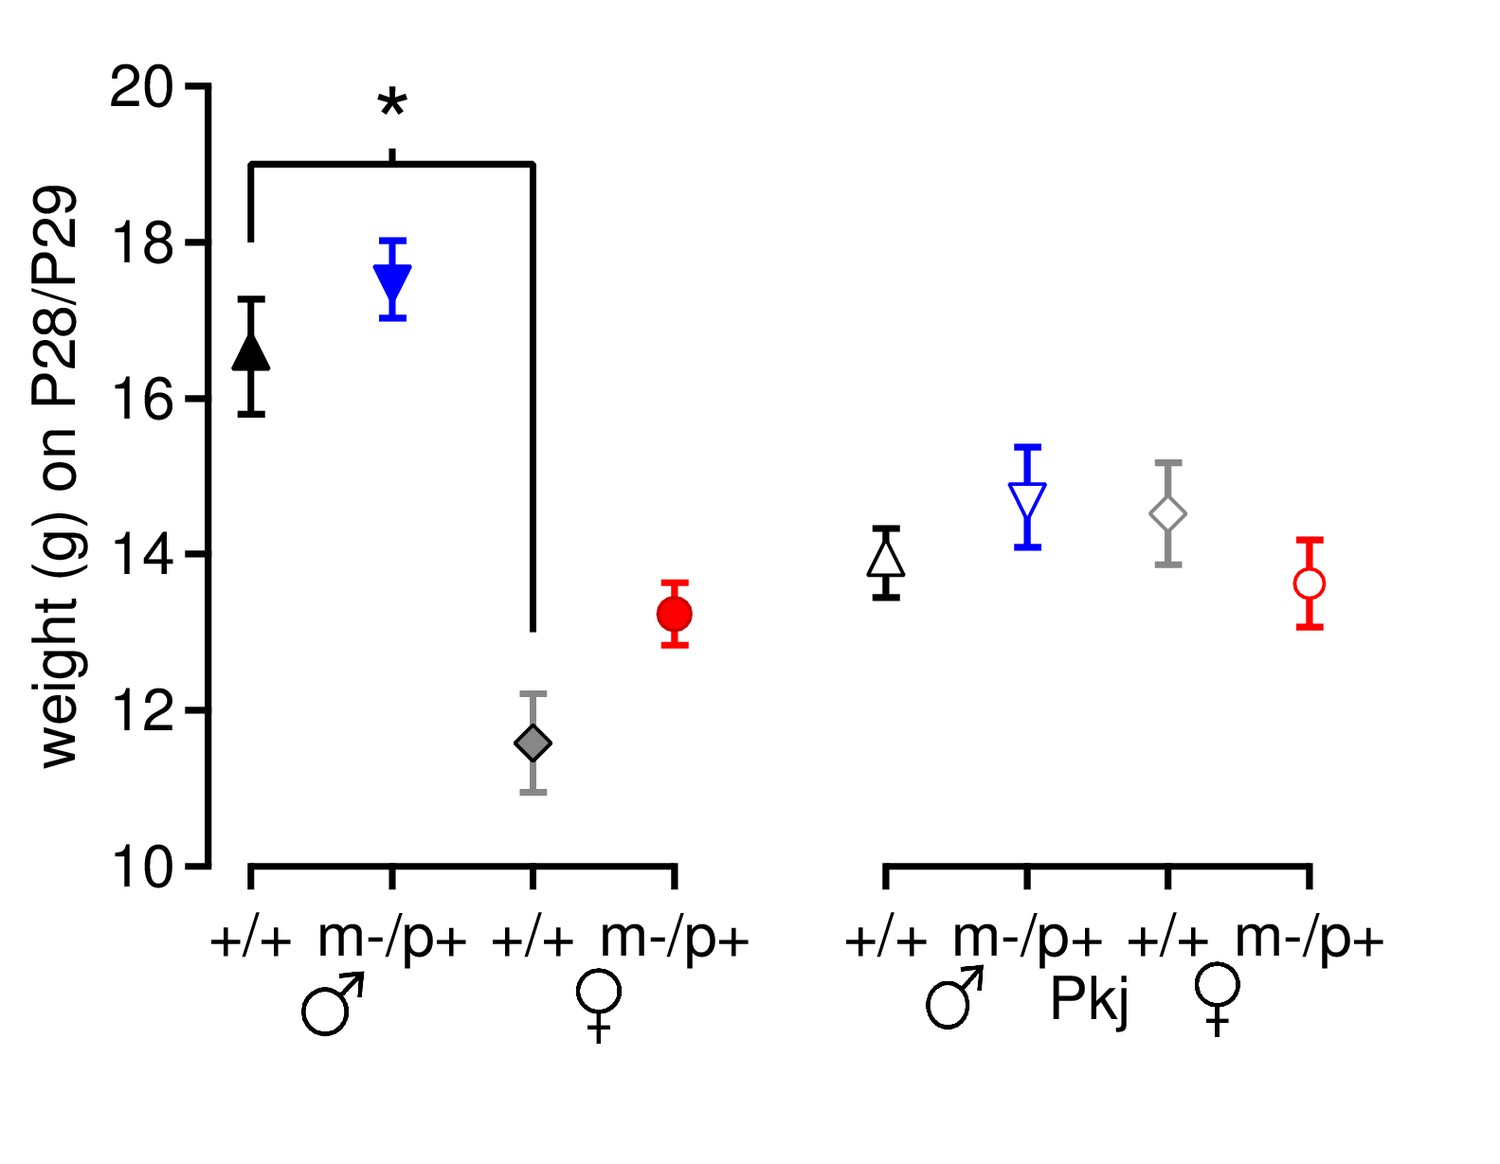
Mouse weight does not account for differences in motor learning.
Weight of Gabrb3 mice (closed symbols) and Purkinje-specific Gabrb3 mice (open symbols) on or immediately after Day 7 of rotarod testing. For Gabrb3 mice, females were lighter than males (+/+ males 16.5 ± 0.7 g, +/+ females 11.6 ± 0.6 g, p<0.001), but mutant males weighed the same as wild-type males (m/p+ males 17.5 ± 0.5 g, p=0.61 vs. +/+ males), and mutant females weighed the same as wild-type females (m/p+ females 13.2 ± 0.4 g, p=0.23 vs. +/+ females). No differences in weight were found between Purkinje-specific Gabrb3 groups (p=0.49).
Figure 6—figure supplement 2
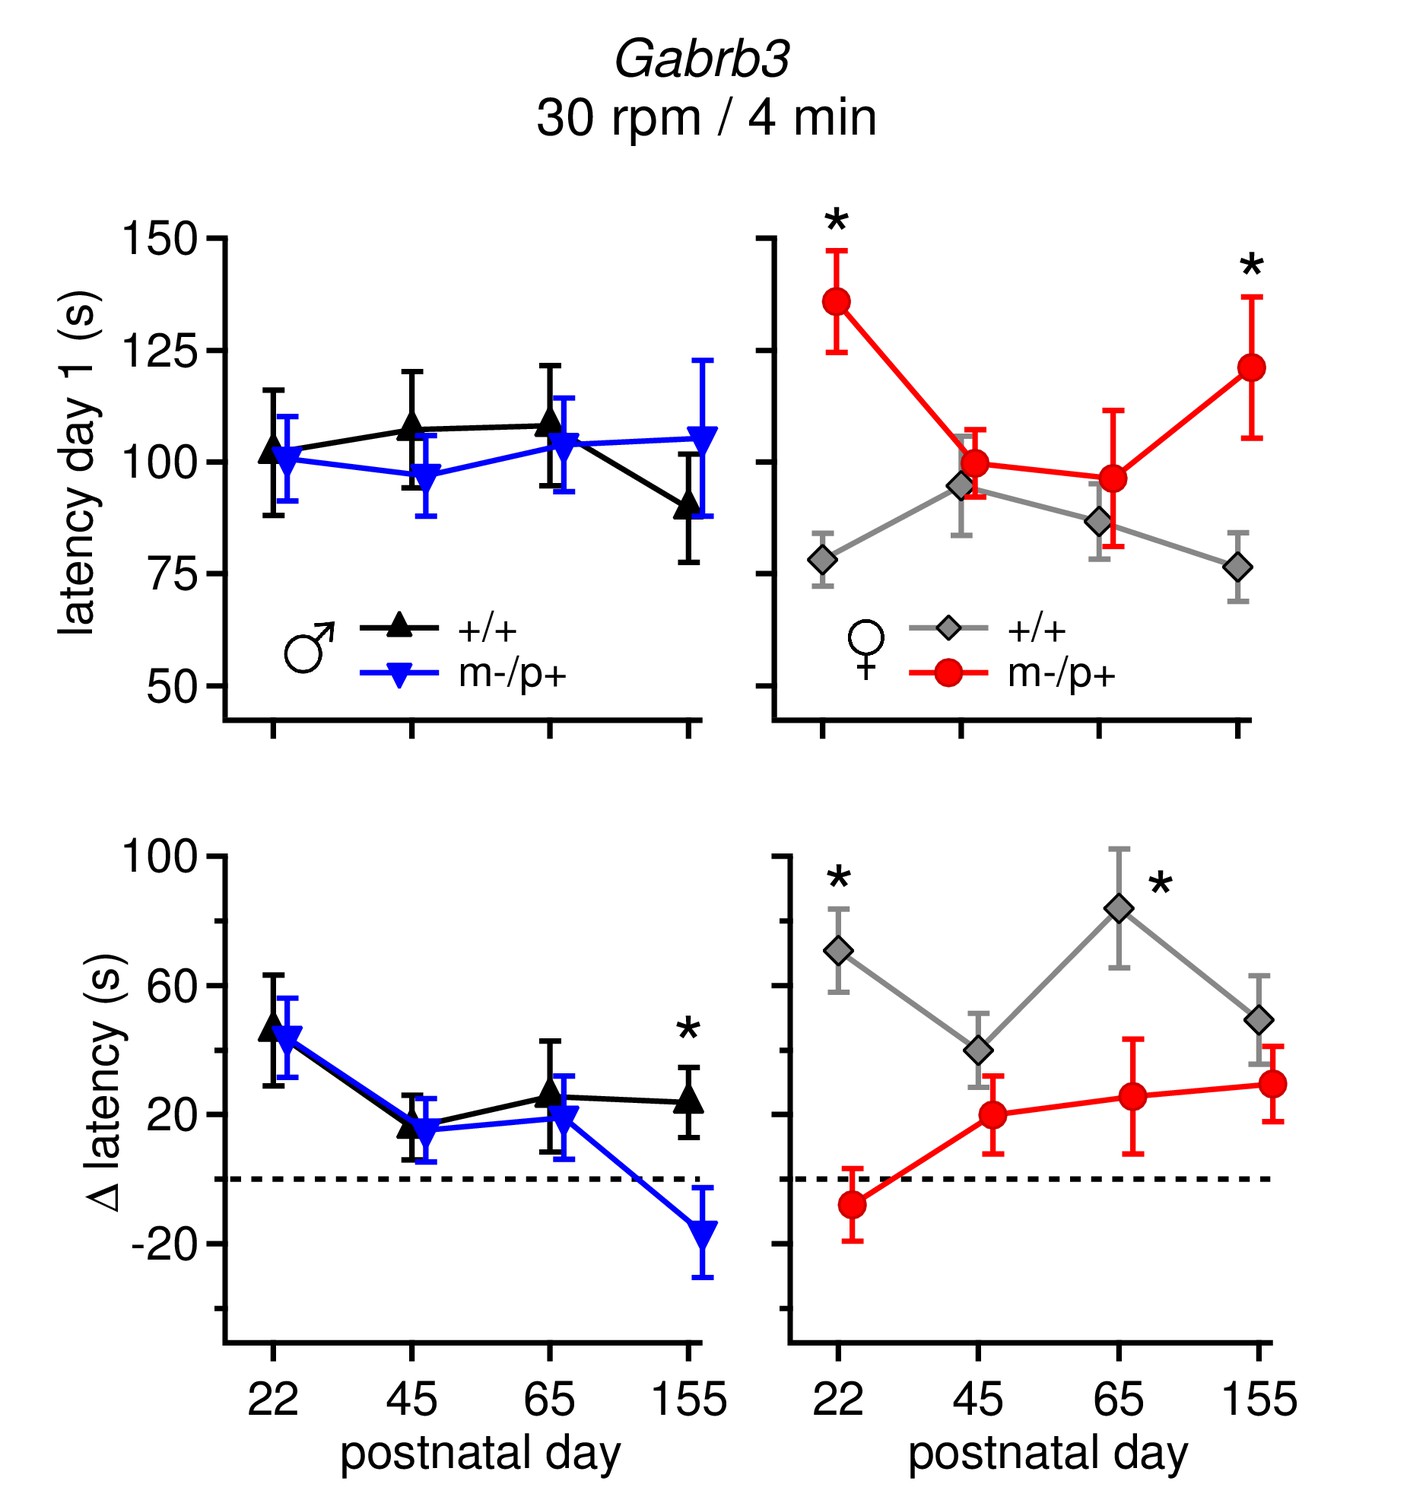
Differences in performance on rotarod change over development.
(Top: ) Average latency to fall on Day 1 for all four age groups for males (left) and females (right). Only m-/p+ females showed variable day 1 latencies throughout development. (Bottom: ) Average Δ latency for all four age groups for males (left) and females (right). Mutant males showed a decreasing Δ latency over development, whereas mutant females showed a increasing Δ latency over development. For all groups (sex, mutation, age), n=8.
Figure 6—figure supplement 3
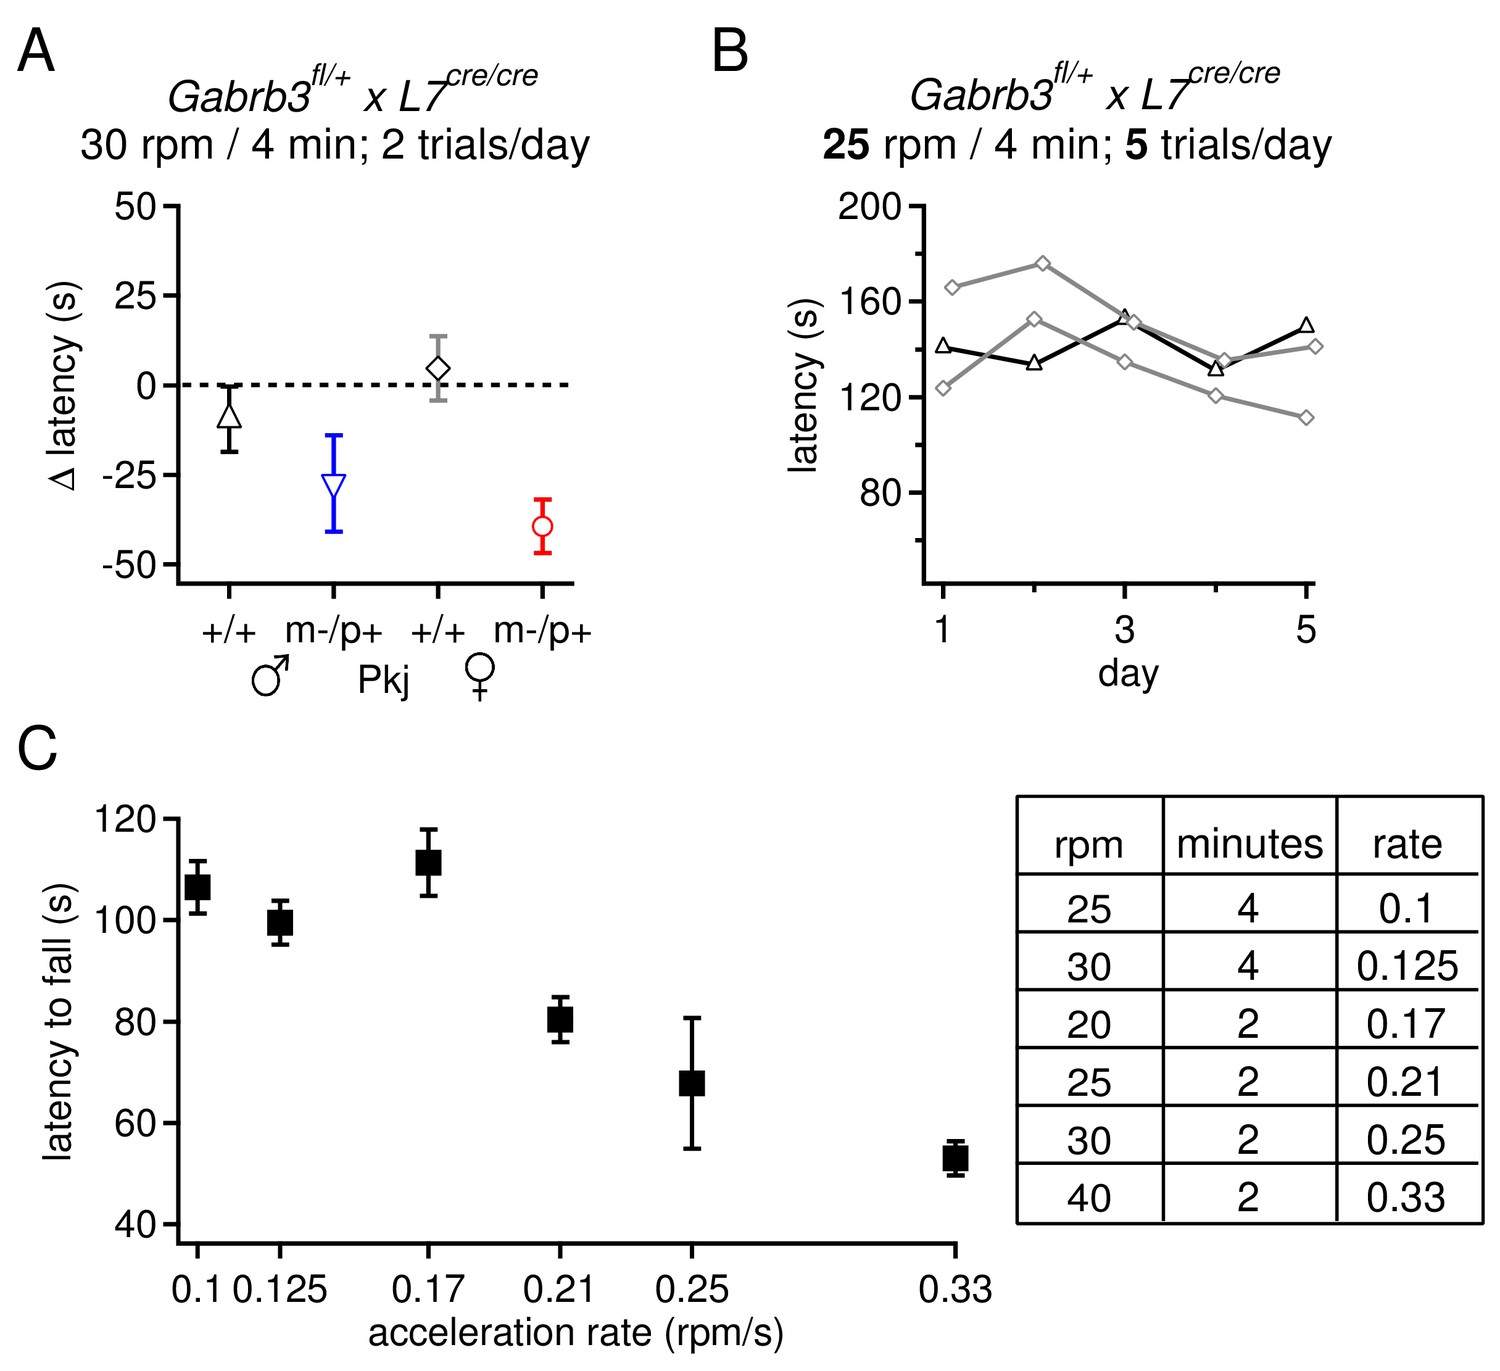
Selection of rotarod protocols that permit an increase in fall latency over training for transgenic mice on a 129S background.
(A) Change latency to fall on the accelerating rotarod for Purkinje-specific Gabrb3 mice, age P22, subjected to 2 daily trials with the rod accelerating to 30 rpm over 4 min. None of the four groups increased their fall latency over the course of 7 days. (B) Latency to fall for individual Purkinje-specific Gabrb3 +/+ male and female mice on the accelerated rotarod, where the rate of acceleration was reduced to 25 rpm over 4 min, and the number of daily trials was increased to 5. This alteration in the protocol did not result in an increased fall latency on the accelerated rotarod task. (C) Latency to fall on the accelerating rotarod on Day 1 across various acceleration protocols. Mice from all groups are pooled. The rate of acceleration for each protocol is listed in the table (right). The highest acceleration gave the shortest initial latency to fall, but made it possible for mice to improve with training.
Figure 7
Differences in CbN cell tonic current depend on GABAAR β3 expression only in Purkinje cells.
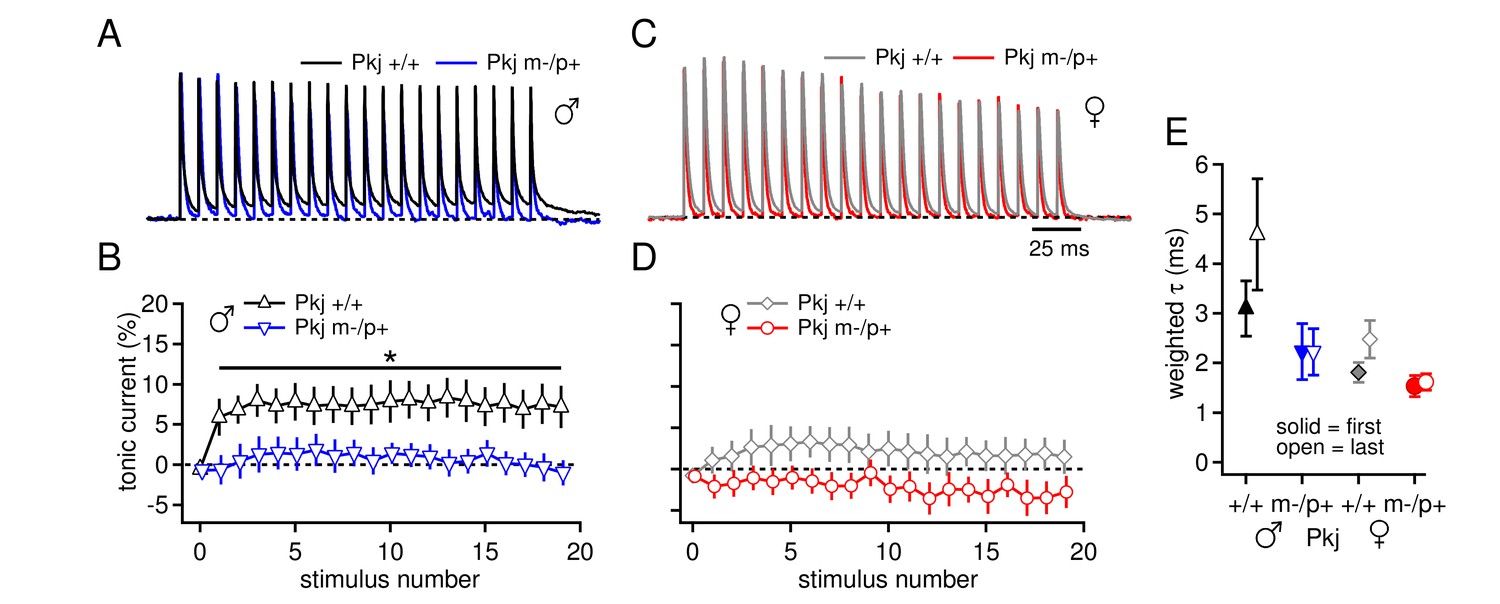
(A) 100-Hz trains of synaptic currents evoked as in Figure 1 in CbN cells from Purkinje-specific Gabrb3 +/+ and m-/p+ male mice, normalized to the first peak. Dotted line, baseline holding current. (B) Mean amplitudes of tonic synaptic currents as a percentage of the first peak evoked current vs. stimulus number for cells from Pkj +/+ and Pkj m-/p+ male mice. Dotted line, 0% current. (C, D) As in A, B, but for cells from +/+ and m-/p+ female mice. (E) Solid symbols: weighted τdecay for IPSCs from a single stimulus for each group of CbN cells from Purkinje-specific Gabrb3 mice. Open symbols: weighted τdecay for the last IPSC in the train.
Figure 8
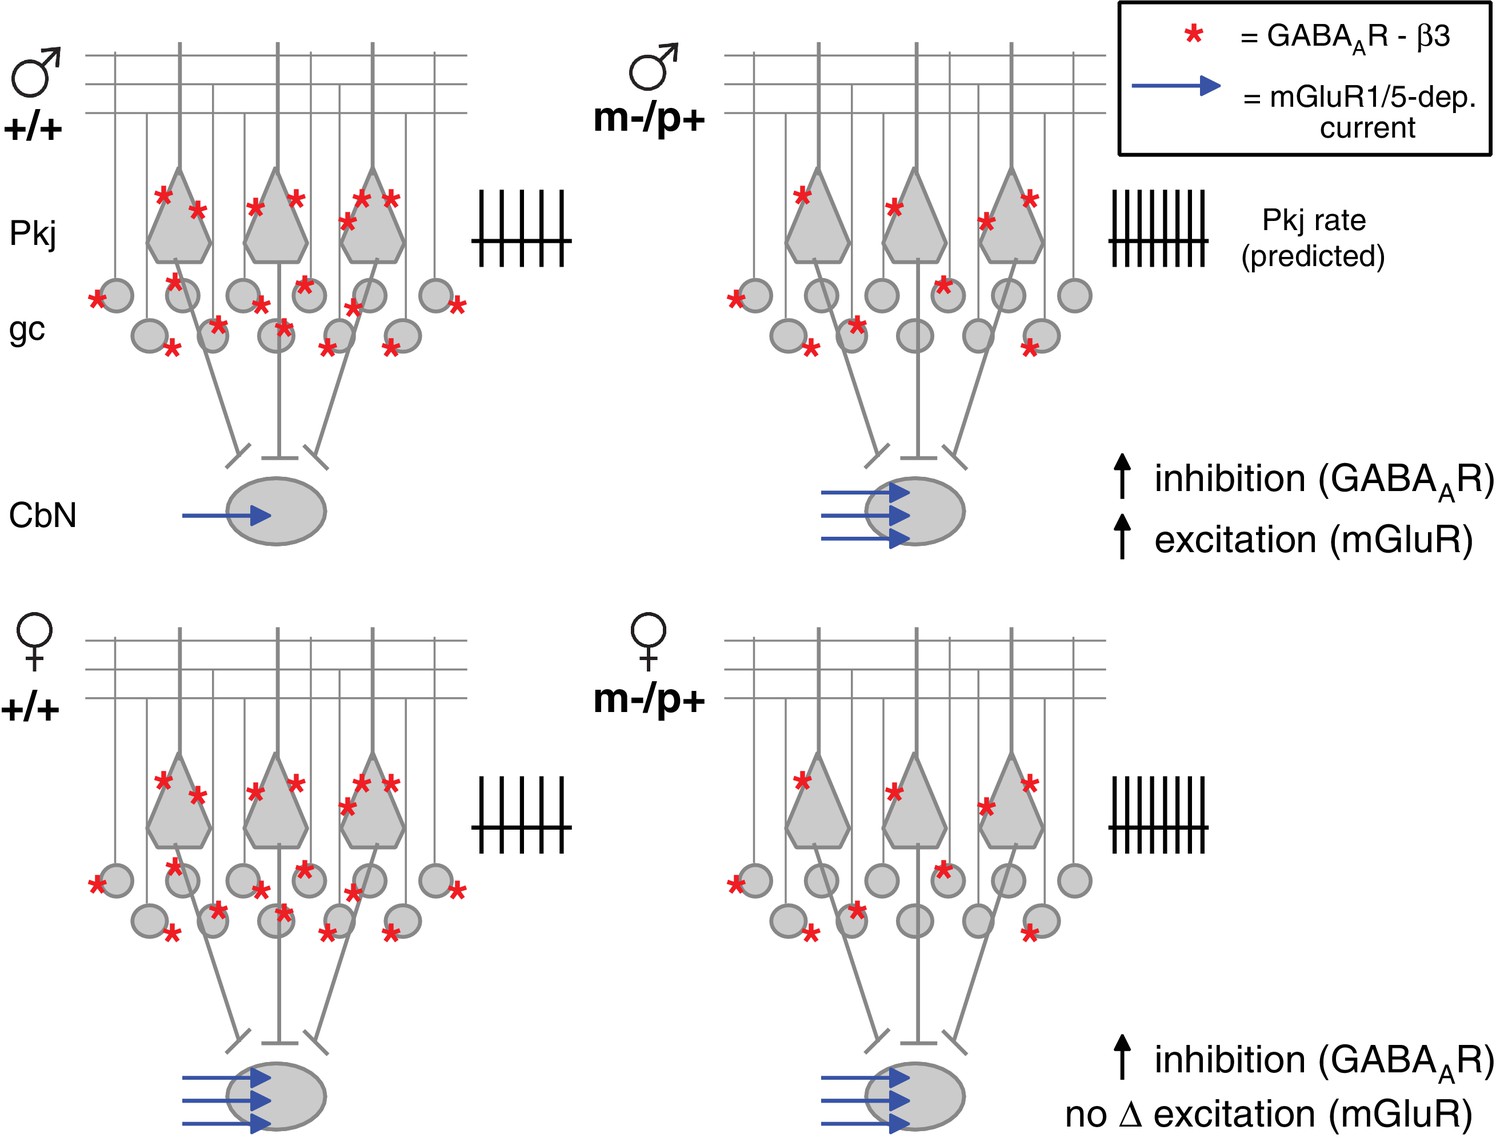
Diagram of sex differences in mGluR1/5 and compensatory changes in males with loss of GABAAR β3.
(Top:) Expected relative levels of GABAAR β3 expression (red asterisks) in the cerebellar cortex, and mGluR1/5-dependent current amplitude (blue arrows) in large CbN cells. For simplicity, only Purkinje cells (Pkj), granule cells (gc), and large CbN cells are depicted. The m-/p+ mutation reduces β3 expression, predicting a disinhibition of granule and Purkinje cells. The resulting increase in Purkinje cell firing rates should increase inhibition of CbN cells. (Top: ) Mutant males counteract the predicted increase in inhibition with increased via mGluR1/5-dependent inward currents. (Bottom: ) Wild-type females have more mGluR1/5-dependent current than wild-type males and presumably balance excitation and inhibition through other means. Mutant females do not up-regulate mGluR1/5-dependent current, and apparently do not compensate for the increased inhibition.
Download links
A two-part list of links to download the article, or parts of the article, in various formats.
Downloads (link to download the article as PDF)
Open citations (links to open the citations from this article in various online reference manager services)
Cite this article (links to download the citations from this article in formats compatible with various reference manager tools)
Sex differences in cerebellar synaptic transmission and sex-specific responses to autism-linked Gabrb3 mutations in mice
eLife 5:e07596.
https://doi.org/10.7554/eLife.07596


