Longitudinal analysis of Plasmodium sporozoite motility in the dermis reveals component of blood vessel recognition
- Johns Hopkins Bloomberg School of Public Health, United States
- University of Pennsylvania, United States
- Leiden University Medical Center, Netherlands
Figures
Figure 1 with 3 supplements
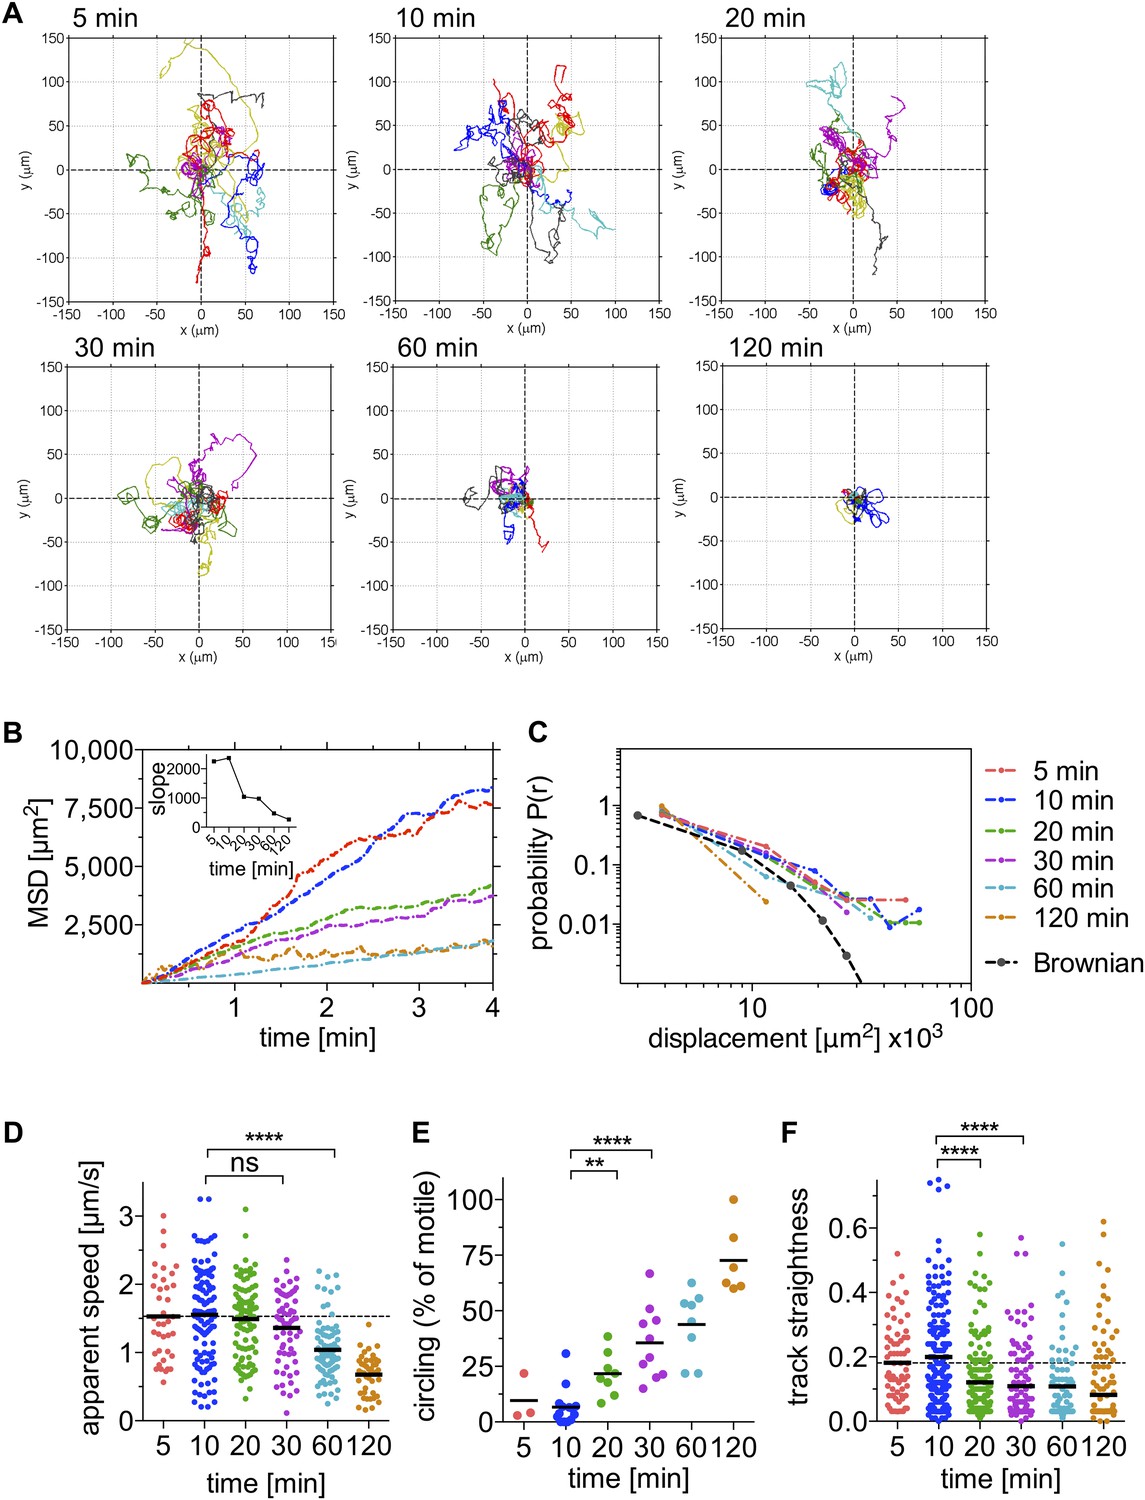
Sporozoite motility is increasingly constrained over time and is not well described by a Brownian walk.
Time-lapse microscopy of sporozoites was started at the indicated time points after intradermal inoculation and 4 min long videos were acquired. See Video 1 for a representative time course. (A) Meandering and linearly moving sporozoites were manually tracked using Imaris software and for each time point 11 representative reconstructed tracks were plotted to a common origin to visualize parasite dispersal over time. For panels B–F, a varying number of videos were processed for each time point after inoculation: 5 min (2 videos/37 tracks), 10 min (14 videos/179 tracks), 20 min (7 videos/95 tracks), 30 min (9 videos/129 tracks), 60 min (8 videos/77 tracks), and 120 min (7 videos/67 tracks). (B) Mean square displacement (MSD) of sporozoite tracks over the duration of the 4 min video, at indicated time points after inoculation, with inset showing the slope obtained through linear regression fitting of MSD curves. (C) The probability distribution P(r) of squared final sporozoite displacements at the end of the 4-min videos. For comparison, the distribution of a Brownian walk is shown. (D) Apparent speed of gliding sporozoites. Bars represent mean values and dashed line marks the mean value at 5 min after inoculation. (E) The percentage of sporozoites gliding continuously in the same circle throughout the duration of the video, showing an increasing proportion of exclusively circling sporozoites at later time points. Every data point represents one video. (F) Straightness of sporozoite tracks, the ratio of displacement to track length of both meandering and linearly moving, as well as continuously circling sporozoites. Bars represent mean values and dashed line marks the mean value at 5 min after inoculation.
Figure 1—figure supplement 1
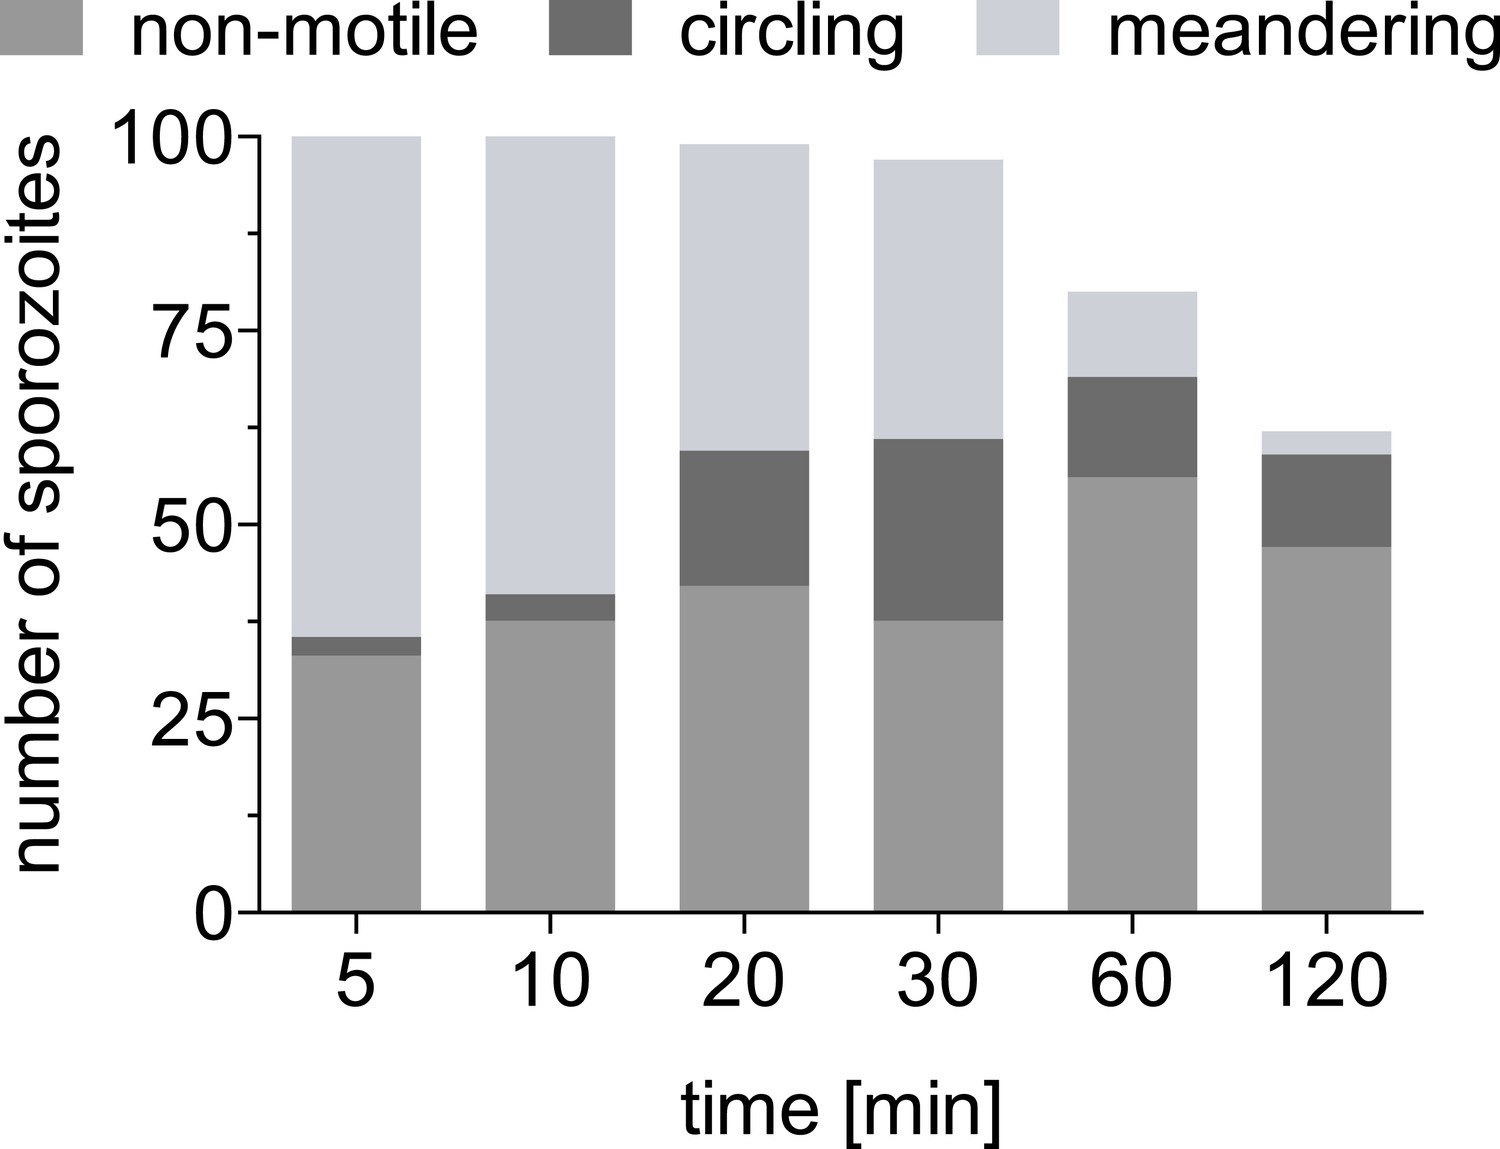
Absolute number of sporozoites exhibiting different motility patterns over time.
Data from two complete time courses were combined and shown is the absolute number of total sporozoites at the inoculation site at each time point and of these, the number that are non-motile, continuously circling and meandering.
Figure 1—figure supplement 2
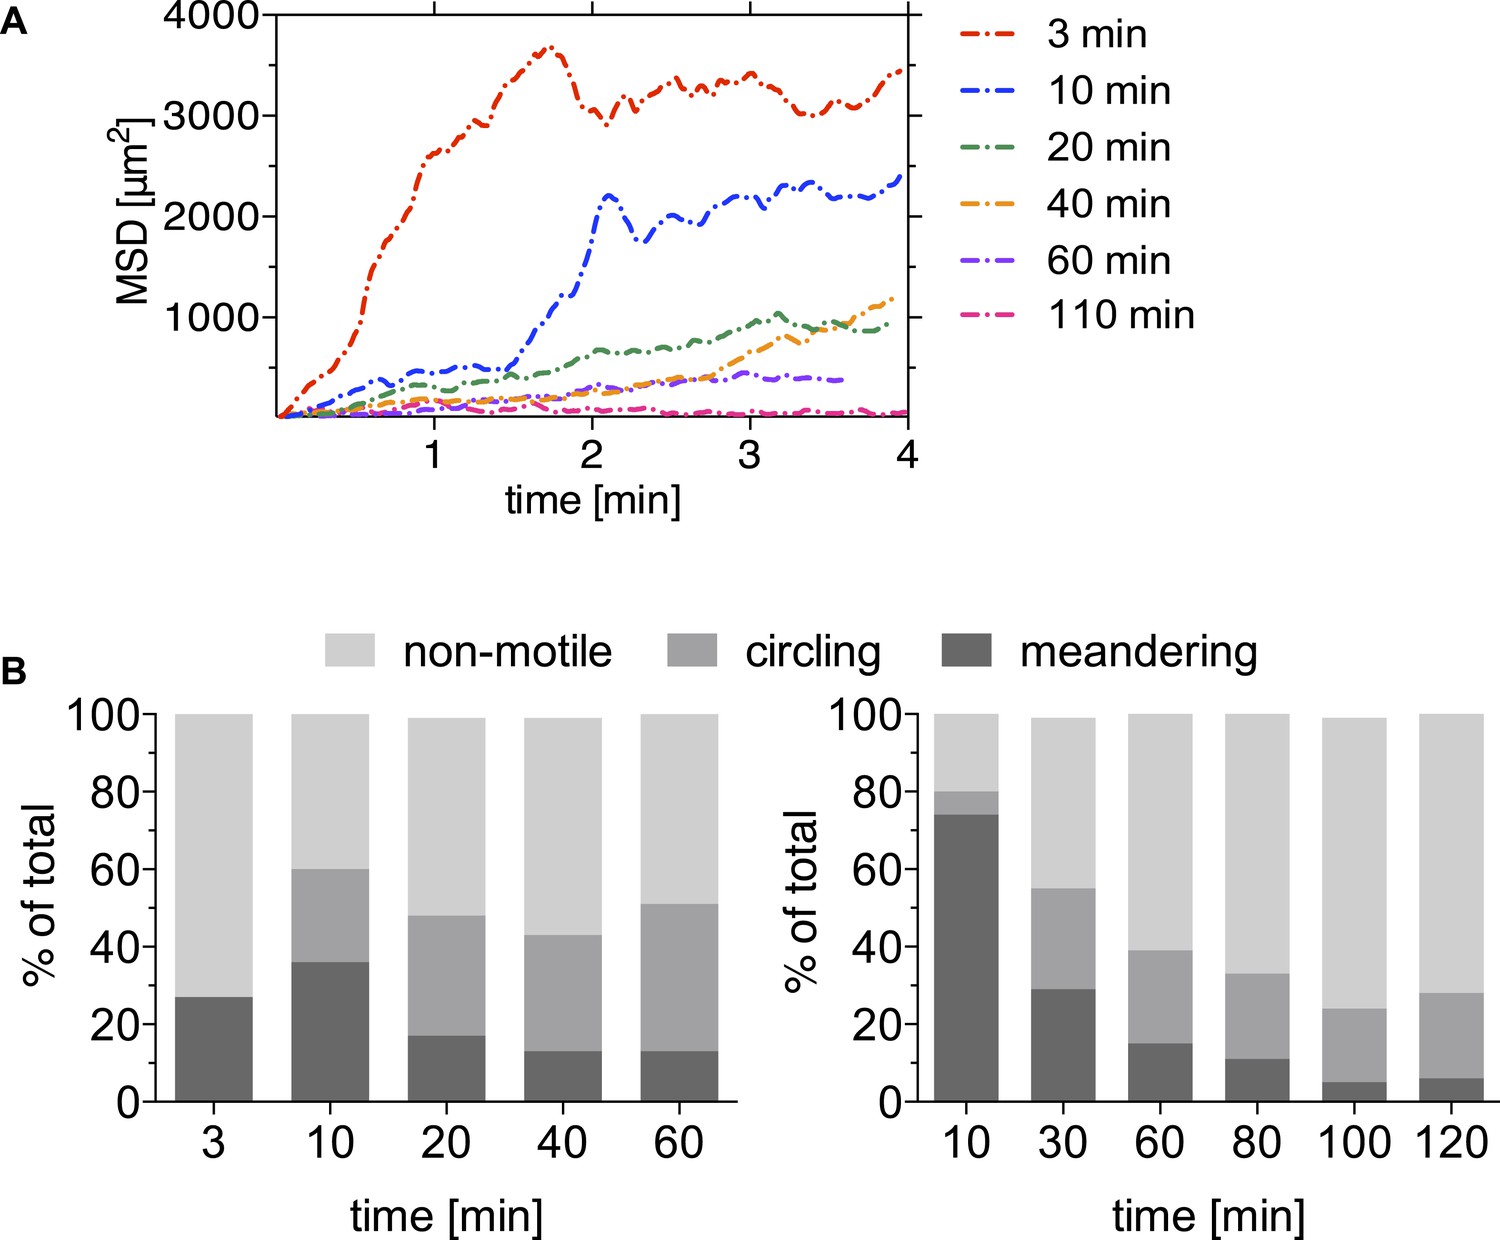
Motility is increasingly constrained over time after sporozoite inoculation by mosquito bite.
A mosquito infected with PbmCherry sporozoites was allowed to probe on the ear pinnae of an anethesized mouse and the first 4-min time-lapse was acquired 3 min after the proboscis was seen in the field of view. The bite site was followed for a total of 110 min, and images were acquired at the indicated times. Data shown was obtained from two biological replicate time courses. (A) Sporozoites were manually tracked using Imaris software to compare the MSD of sporozoites at 3 min (38 tracks), 10 min (30 tracks), 20 min (73 tracks), 40 min (53 tracks), 60 min (61 tracks), and 110 min (1 video only/21 tracks) after mosquito bite. (B) Proportion of manually counted sporozoite motility patterns are shown as percent of total sporozoites. Data from two independent experiments are shown.
Figure 1—figure supplement 3
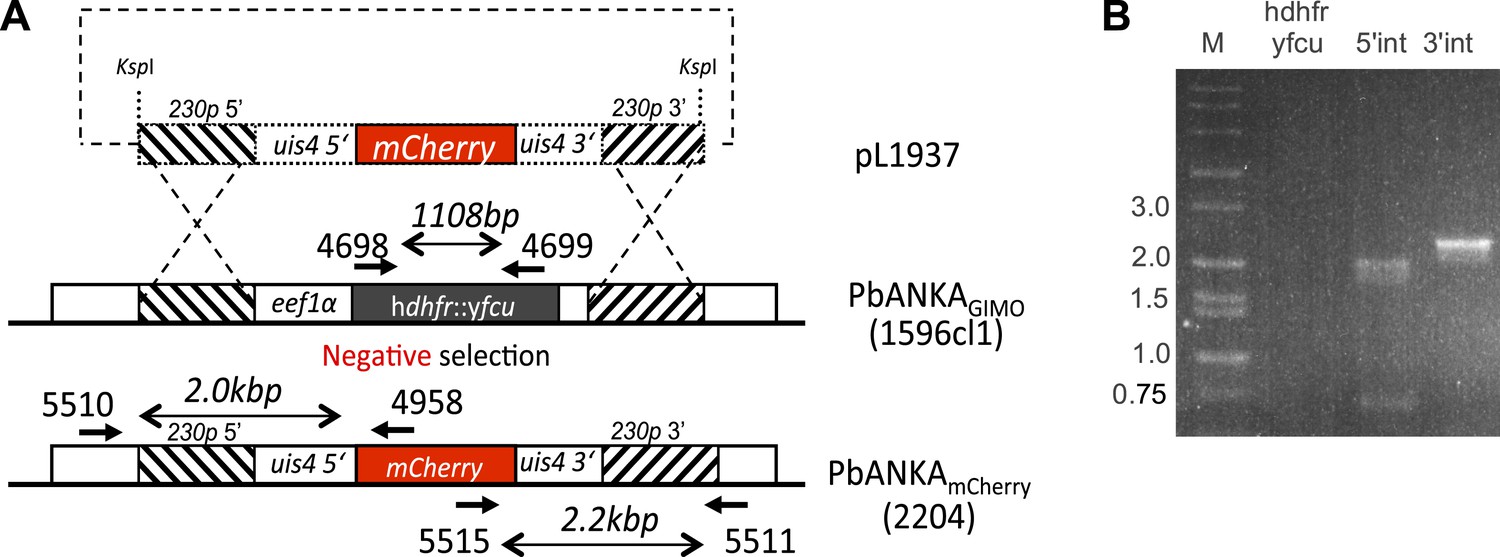
Generation and verification of a marker-free Plasmodium berghei line expressing mCherry under control of the uis4 promoter, using GIMO transfection.
(A) Schematic representation of the introduction of an mCherry-expression cassette under the control of uis4-promoter into the GIMOPbANKA mother line 1596cl1. Transfection construct pL1937 containing the uis4-mCherry-3ʹpbdhfr cassette is integrated into the modified P. berghei 230p locus containing the hdhfr::yfcu selectable marker cassette (black box) by double cross-over homologous recombination at the target regions (hatched boxes). Negative selection with 5-FC selects for parasites that have the mCherry reporter introduced into the genome and the hdhfr::yfcu marker removed (PbANKAmCherry line 2204). Location of primers used for PCR analysis and sizes of PCR products are shown. (B) Diagnostic PCRs confirm integration as expected in PbANKAmCherry line 2204 clone 5, shown by the absence of the hdhfr::yfcu marker (amplification of hdhfr::yfcu with primers 4698/4699) and correct 5′- and 3′-integration PCR product sizes (primer pairs 5510/4958 and 5515/5511, respectively). See Supplementary file 1 for all primer sequences.
Figure 2 with 1 supplement
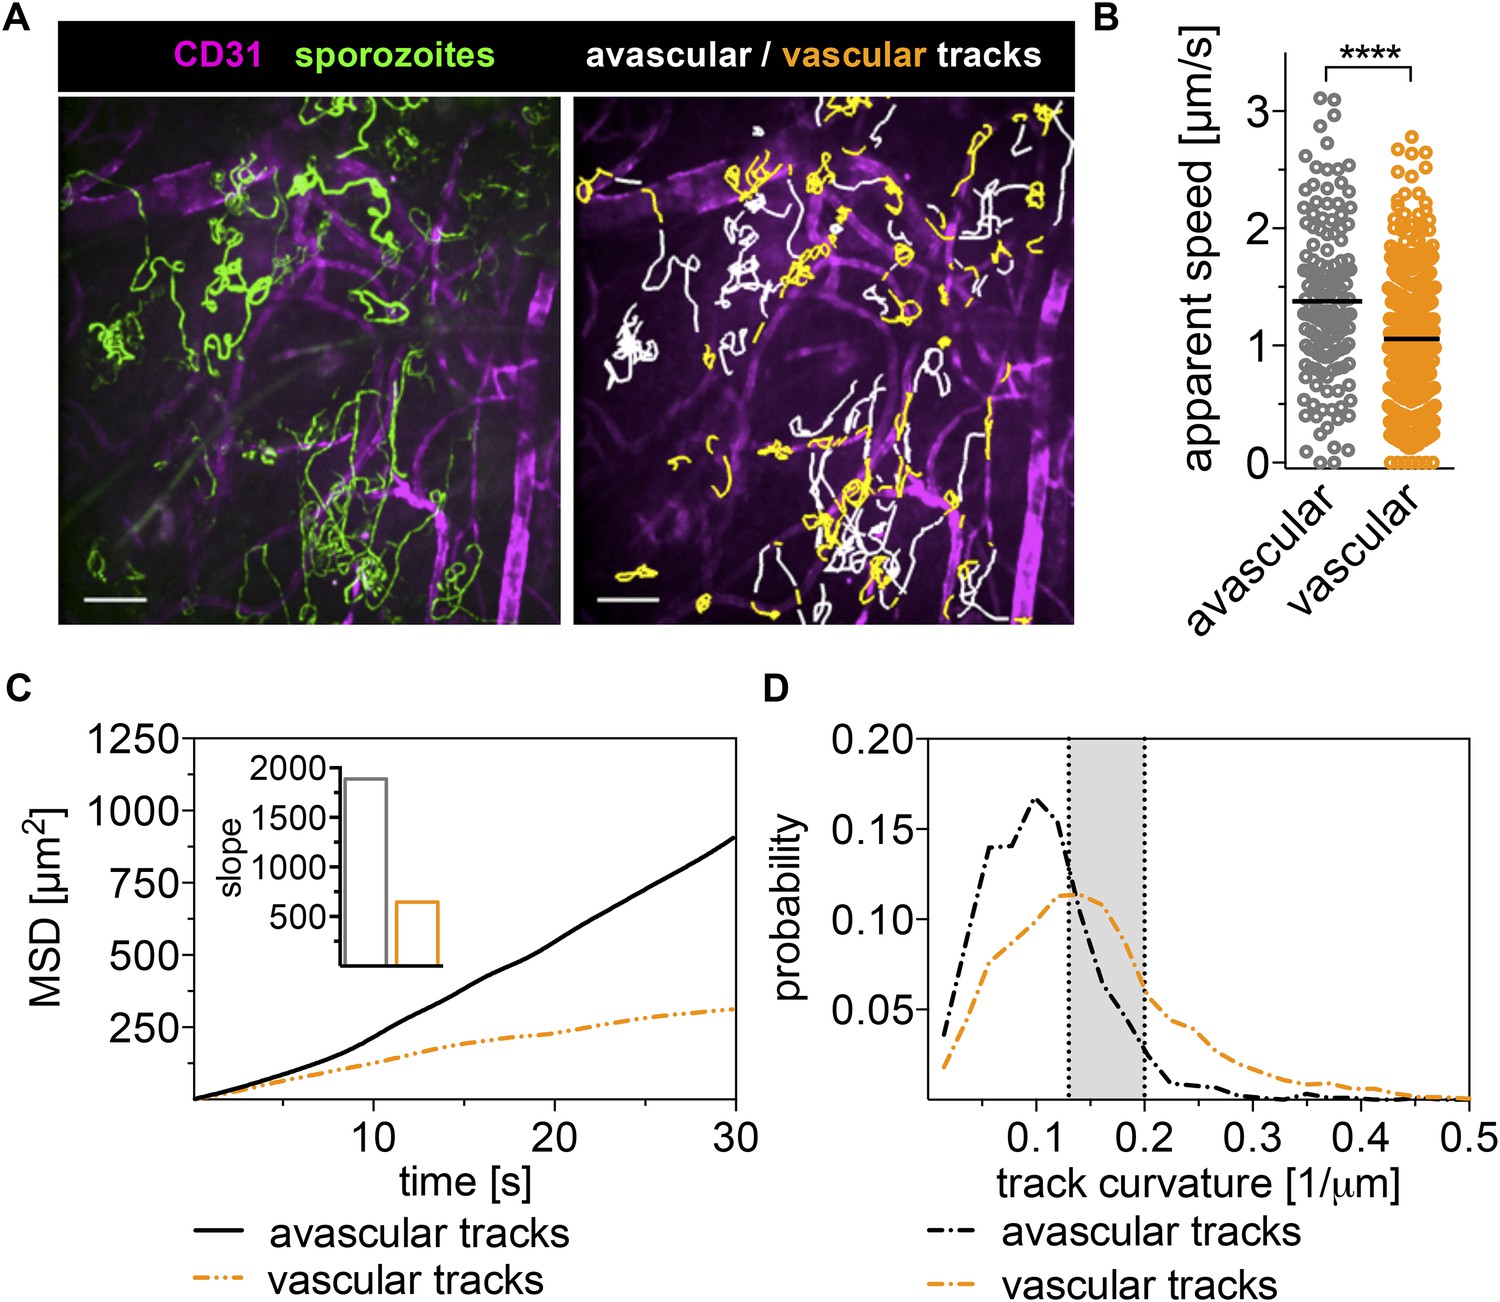
Sporozoites recognize dermal blood vessels.
Time-lapse microscopy of sporozoites, 10 min after intradermal inoculation, and CD31-labeled vascular endothelia. (A) Maximum intensity projection over 240 s shows trajectories of moving sporozoites (green) and blood vessels (far red) (see Video 2). Sporozoites were manually tracked using Imaris software and tracks overlapping with CD31+ vessels are colored orange, while tracks in between CD31+ vessels are white. Scale bar, 25 μm. For panels B–D, 18 videos were processed and 313 tracks of sporozoites moving in proximity of blood vessels and 163 tracks of sporozoites moving in between blood vessels were generated. (B) Apparent speed, with lines representing mean values, reveals a decrease in gliding speed once sporozoites are in proximity of blood vessels. (C) MSD plot shows significant decrease in displacement of sporozoite tracks in the vicinity of vasculature. Inset shows decreased slope of perivascular tracks obtained from linear regression fitting (R2 values: Rperivascular = 0.9884; Ravascular = 0.9924). (D) Extrapolated track curvature, as defined by 1/radius (where the radius is measured in μm), of perivascular and avascular sporozoite tracks. Kolmogorov–Smirnov two-sample test was performed and found difference of perivascular and avascular curvature highly significant (p = 10−57). Shaded area shows range of curvature of dermal capillaries (Yen and Braverman, 1976; Braverman, 1997).
Figure 2—figure supplement 1

Anti-CD31 does not stain lymphatic vessels early after its inoculation.
Dual live immunostaining for the lymphatic vessel hyaluronan receptor-1 and the panendothelial marker CD31. Lymphatic vessels (green) are labeled with anti-mouse LYVE-1 (clone ALY7, Affymetrix), inoculated intravenously 24 hr prior to imaging. Anti-mouse CD31 AF-64 was inoculated 3 hr prior to imaging and though blood vessels are stained (magenta), at this time point, lymphatic vessels remain unstained with anti-CD31.
Figure 3 with 2 supplements
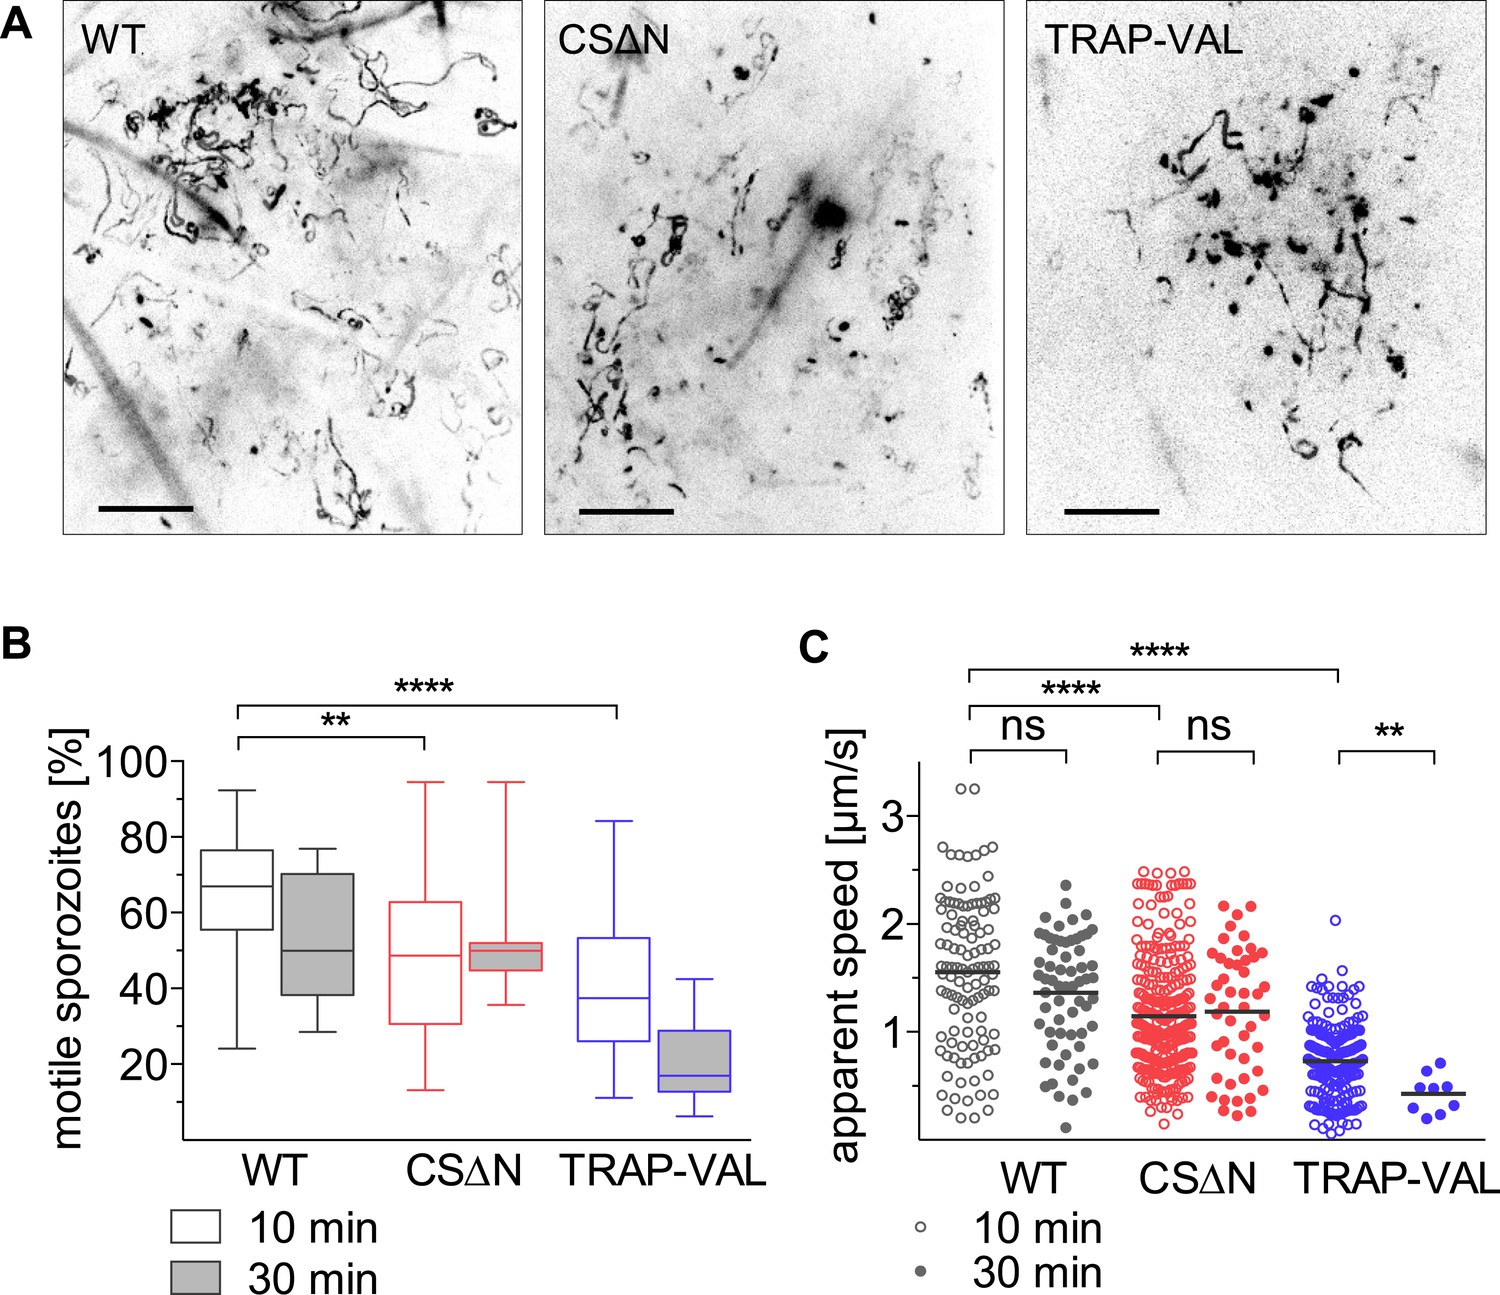
Intradermal motility of CSΔN and TRAP-VAL sporozoites.
Time-lapse microscopy of CSΔN and TRAP-VAL sporozoites (see Video 3 and Video 4). (A) Maximum intensity projections of videos acquired 10 min after inoculation visualize trajectories of sporozoites. Scale bars, 50 μm. (B) Proportion of motile sporozoites was manually counted in videos acquired 10 min (WT, 33 videos; CSΔN, 31 videos; TRAP-VAL, 43 videos) and 30 min (WT, 8 videos; CSΔN, 11 videos; TRAP-VAL, 10 videos) after inoculation. (C) Apparent speed of sporozoites 10 min and 30 min after inoculation, averaged over the 4-min video.
Figure 3—figure supplement 1

Generation of mutant CSΔN parasites in the marker-free P. berghei line expressing mCherry under control of the uis4 promoter.
(A) Schematic representation of the strategy used to replace the endogenous CSP locus with CSΔN. The transfection plasmid (pCSΔN) contains 730 bp of CSP 5′-UTR (thin black line), the selectable marker hdhfr with its 5′- and 3′-UTRs (thick black lines) and the CSΔN copy of the gene flanked by its 5′- and 3′-UTRs (thin black lines). Dotted gray lines indicate the location of homologous recombination with the endogenous CSP locus. Location of primers used for PCR analysis is shown. (B) Correct integration was confirmed by PCR of gDNA from the CSΔN mutant clone B3 with primers DP1 and DP2 to amplify the 5′-integration site and primers 3′int-F and 3′int-R to amplify the 3′-integration site. PCRs with primers CS-F and CS-R were used to amplify the ORF of CSP, resulting in a smaller product in CSΔN compared to the wild-type control. This PCR product was also used for sequencing to confirm the presence of the expected mutation. See Supplementary file 1 for all primer sequences. (C) Confirmation of strongly reduced infectivity of CSΔN sporozoites upon intradermal inoculation. Mice were injected with 104 wild-type control or CSΔN salivary gland sporozoites, either by intravenous (IV) or intradermal (ID) injection, and 36.5 hr later, total liver RNA was extracted, and liver parasite burden was determined by RT-qPCR. There were four mice per group, and the liver parasite burden of each mouse is shown. (D) Western blot analysis of wild-type control and CSΔN salivary gland sporozoite lysates. The blot was cut in half, and the top was probed with polyclonal antiserum specific for TRAP as a loading control (top panel), and the bottom was probed with mAb 3D11 specific for the CSP repeat region (lower panel). Molecular mass is indicated in kilodaltons. (E) Fluorescence and phase-contrast images of unpermeabilized wild-type control and CSΔN salivary gland sporozoites. CSP on the surface of sporozoites was visualized by detection with mAb 3D11 specific for the CSP repeat region or polyclonal rabbit N-terminal CSP serum.
Figure 3—figure supplement 2
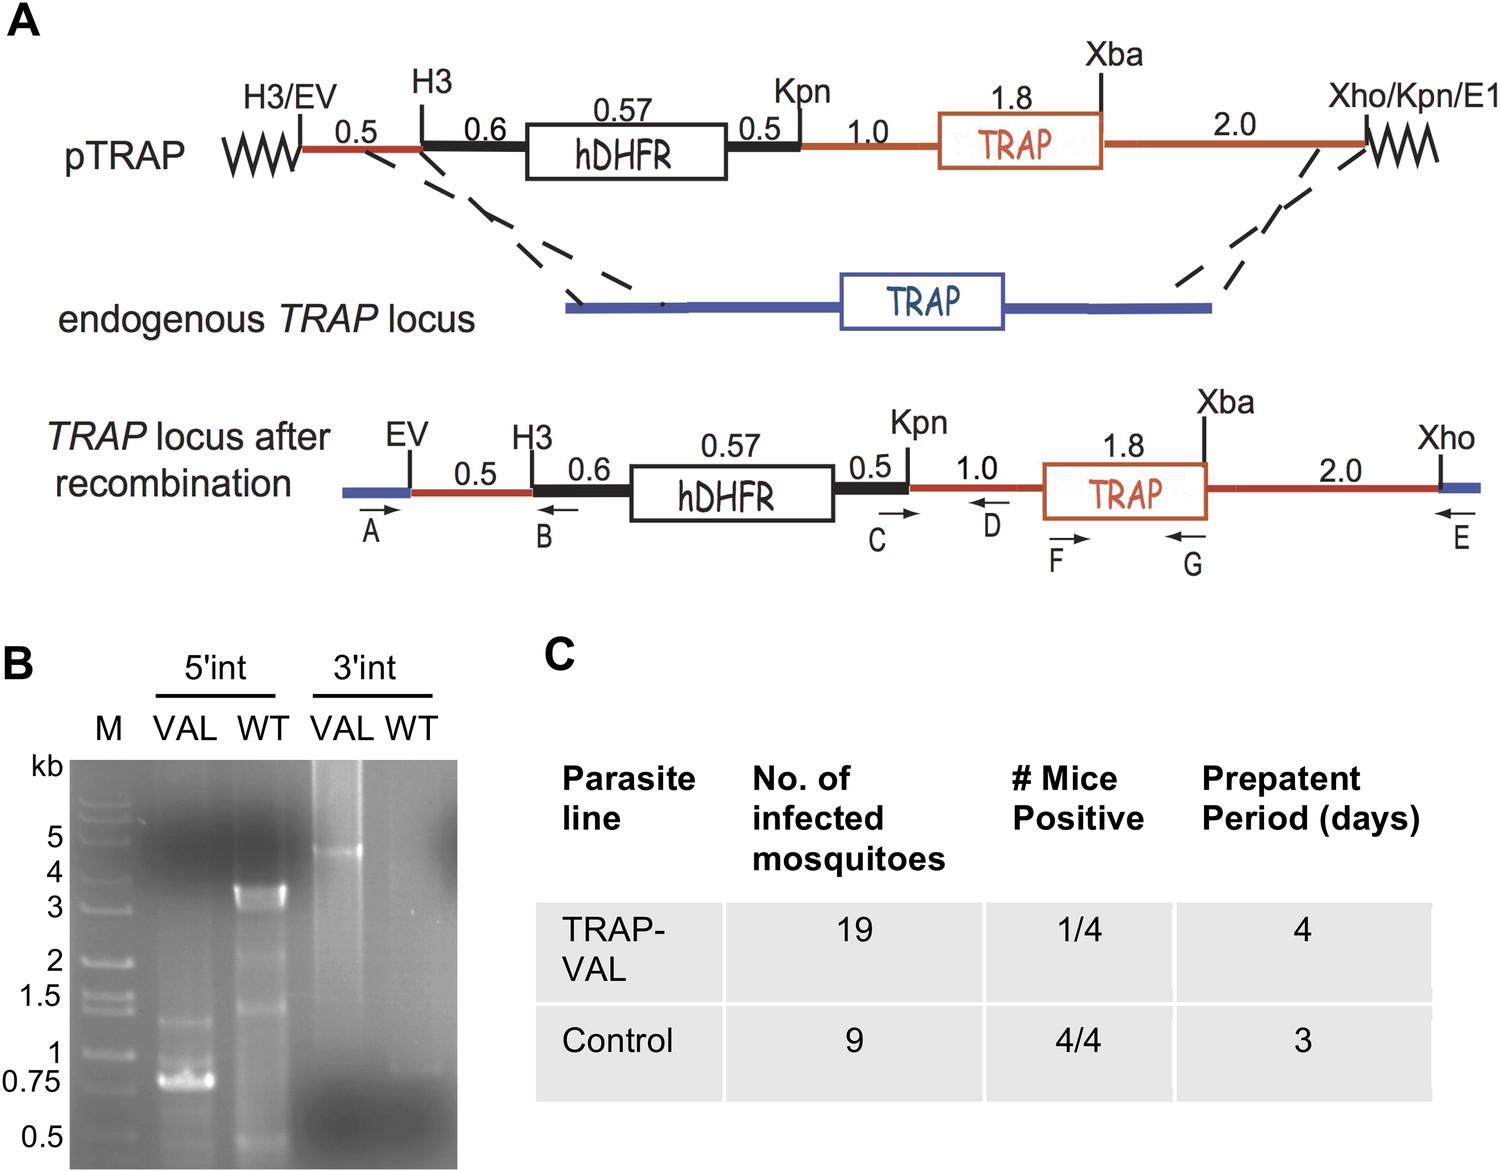
Generation of mutant TRAP-VAL parasites in the marker-free P. berghei line expressing mCherry under control of the uis4 promoter.
(A) Schematic representation of the strategy used to replace the endogenous TRAP locus with the TRAP-VAL copy of the gene. The transfection plasmid (pTRAP) contains 500 bp of TRAP 5′-UTR (red line), the selectable marker hDHFR (black box) with its 5′- and 3′-UTRs, and the TRAP gene (red box) flanked by its 5′- and 3′-UTRs (red lines). Dashed black lines indicate the location of homologous recombination with the endogenous TRAP locus. Location of primers used for PCR analysis is shown. (B) Diagnostic PCRs were used to verify successful recombination at the 5′ end (primers A and B) and the 3′ end (primers C and E). Primers F and G (shown in panel A) were used to amplify the TRAP open reading frame for sequencing to confirm the presence of the desired mutations. See Supplementary file 1 for primer sequences. (C) Confirmation of reduced infectivity of TRAP-VAL sporozoites determined by prepatent period after exposure to the bites of mosquitoes infected with wild-type control or TRAP-VAL parasites.
Figure 4
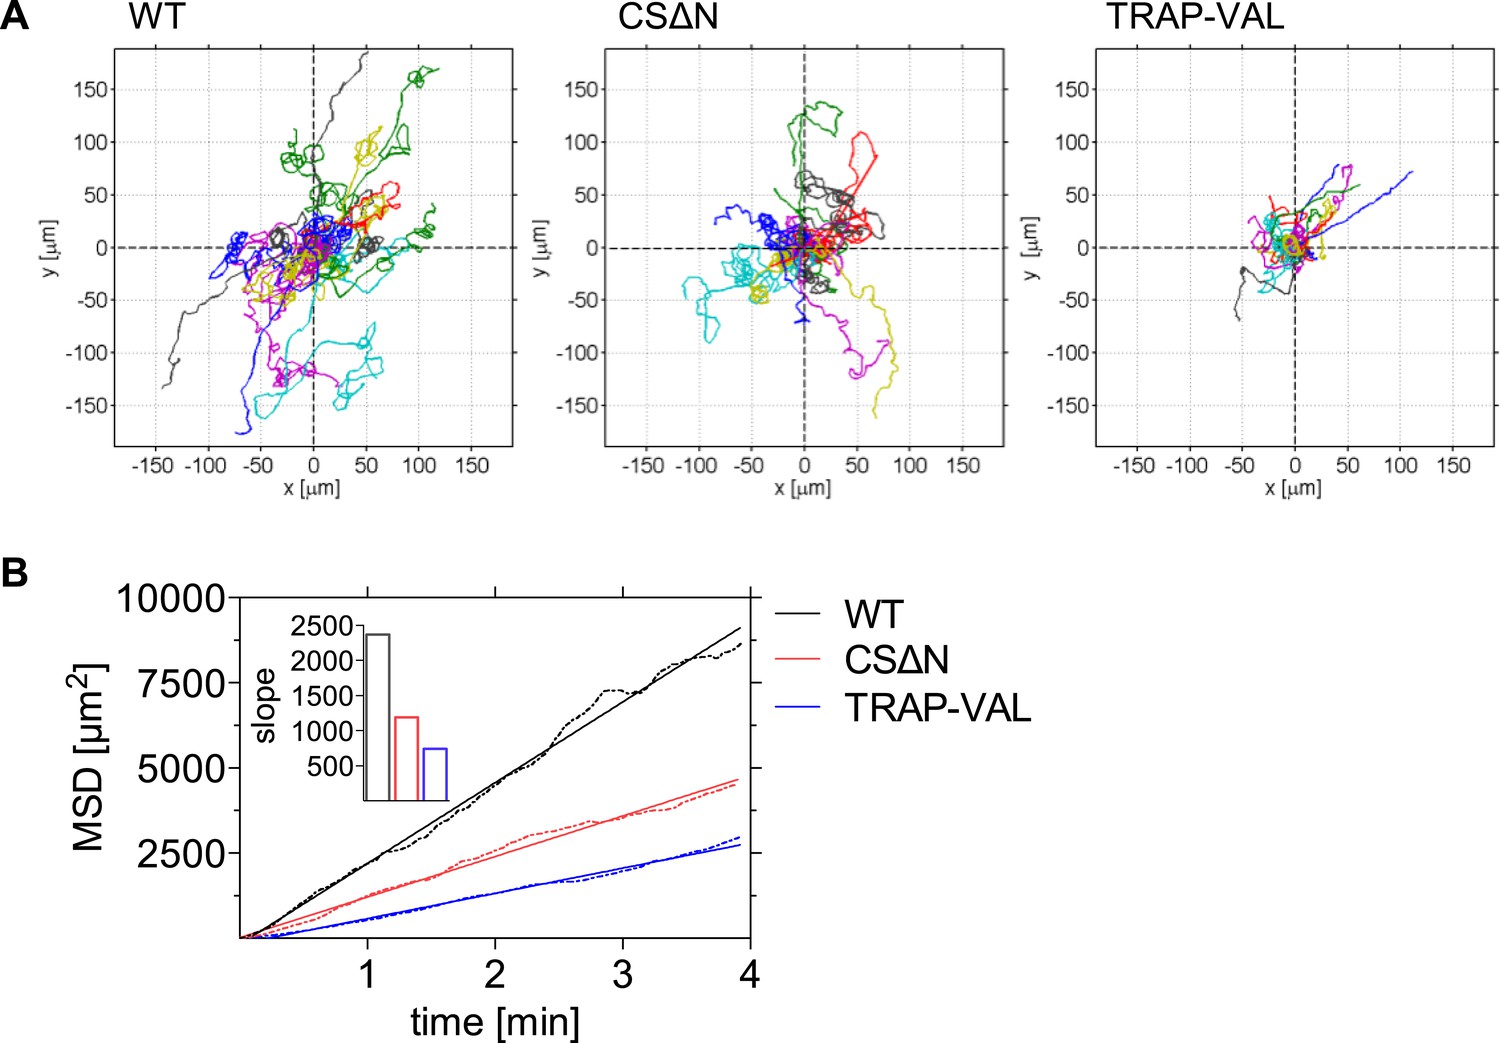
Decreased dispersal of CSΔN and TRAP-VAL sporozoites in vivo.
Time-lapse microscopy of CSΔN and TRAP-VAL sporozoites. (A) Sporozoites were manually tracked using Imaris software and 20 representative tracks of each WT, CSΔN, and TRAP-VAL sporozoites were plotted to a common origin, revealing a decreased dispersal of mutant sporozoites. (B) MSD plot over time. Data shown was obtained from tracking 179 WT sporozoites (12 videos), 211 CSΔN sporozoites (29 videos), and 215 TRAP-VAL sporozoites (33 videos). Inset shows the decreased slope of mutant parasites obtained from linear regression fitting (R2 values: RWT = 0.9926; RCSΔN = 0.9890; RTRAP-VAL = 0.9932).
Figure 5 with 1 supplement
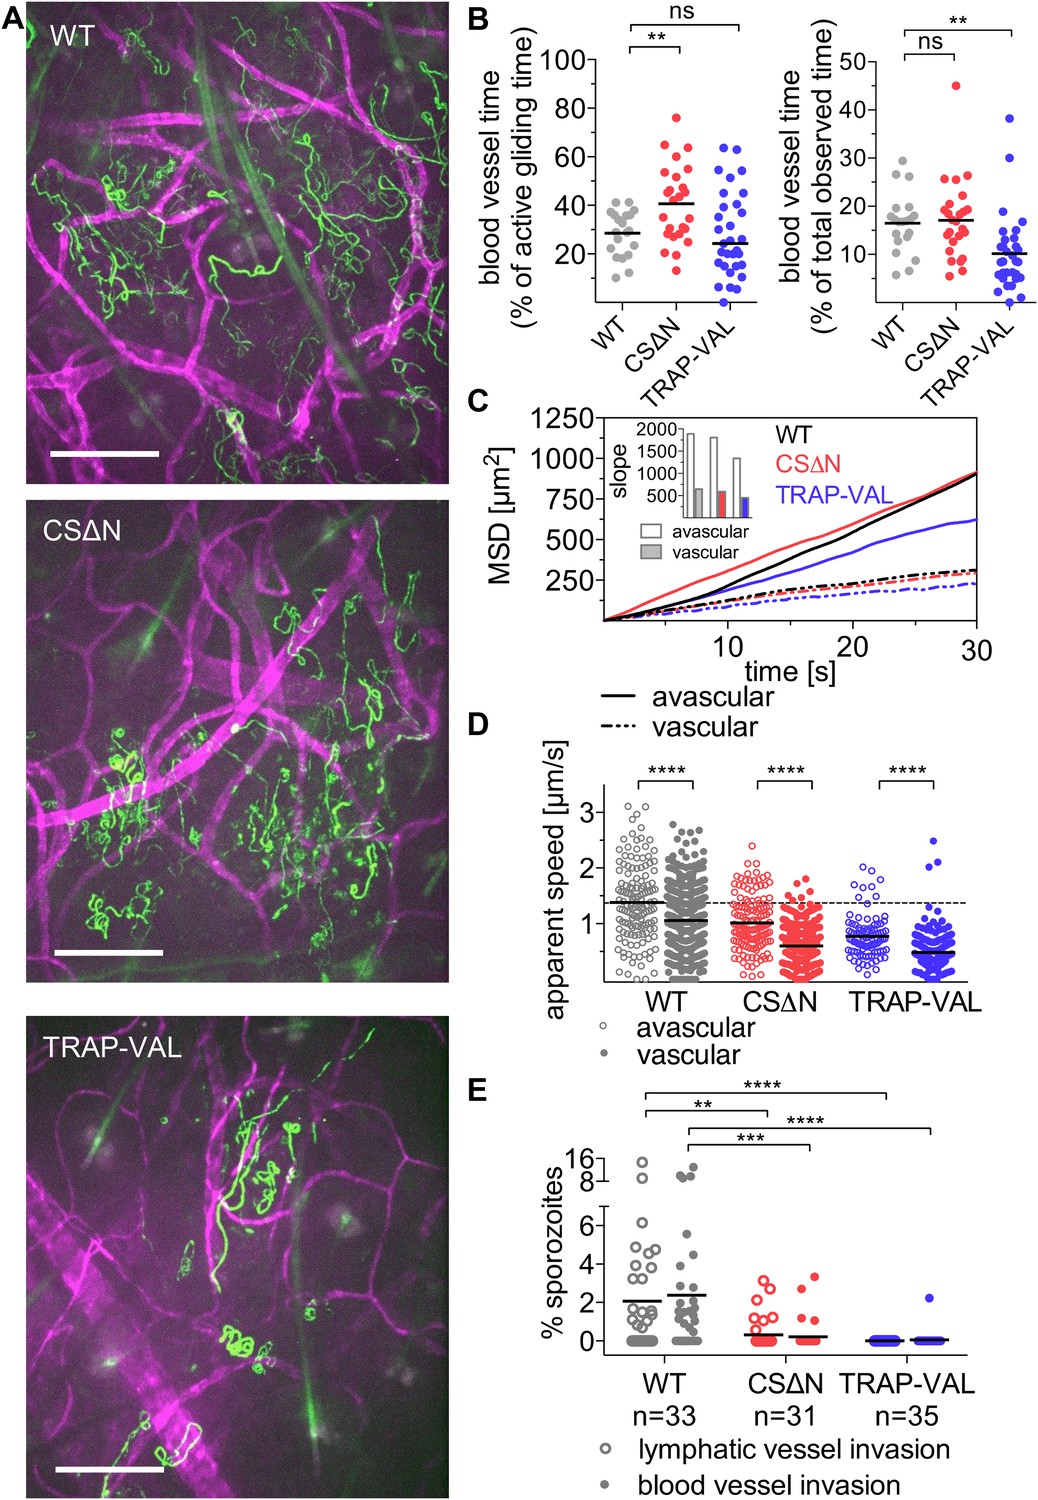
Sporozoite interaction with dermal vascular endothelia.
Time-lapse microscopy of CSΔN and TRAP-VAL sporozoites 10 min after intradermal inoculation (see Video 2, Video 5, and Video 6). (A) Maximum intensity projection over 240 s reveals trajectories of WT, CSΔN, and TRAP-VAL sporozoites (green) moving in the dermis with CD31-labeled vascular endothelia (far red). Scale bars, 50 μm. For panels B–D, every data point represents one video and 18 WT, 25 CSΔN, and 24 TRAP-VAL videos were processed. (B) The time sporozoites spend in proximity to CD31-labeled vessels was quantified by manual tracking of sporozoites and is expressed as percent of motile time (left panel) or total observed time (right panel). Graphs show significant increase in the time CSΔN, but not TRAP-VAL sporozoites spend actively gliding on or around blood vessels. (C) To generate the MSD of sporozoites moving in proximity to CD31-labeled vessels, 313 WT, 352 CSΔN, and 192 TRAP-VAL tracks of sporozoites moving in proximity to CD31-labeled vessels were generated and compared to 163 WT, 121 CSΔN, and 89 TRAP-VAL tracks of sporozoites moving in avascular areas of the dermis. To calculate the MSD of the obtained sporozoite tracks with various duration times, all tracks were uniformly fragmented into tracks of 30 s in duration. MSD plot shows decrease in displacement of mutant sporozoite tracks in proximity to blood vessels. Inset shows slopes of linear regression fitting (all R2 values ≥0.988). (D) Apparent speed of wild-type control and mutant sporozoites in the proximity of blood vessels or in avascular portions of the dermis with lines representing mean values. Dashed line marks the mean value of wild-type control in avascular portions of the dermis. These data reveal a significant decrease in gliding speed of CSΔN and TRAP-VAL sporozoites, once the sporozoite is approaching vasculature, similar to wild-type control sporozoites. (E) Blood and lymphatic vessel invasion events were manually counted. Invasion was classified similar to previously descriptions (Amino et al., 2006), with blood vessel invasion being defined by a sudden increase in speed or visual entry of the blood vessel and disappearance out of the field of view. Lymphatic invasion was characterized by the switch from directed forward movement to sideward drifting with a low velocity (see Videos 7 and Video 8). The proportion of invading sporozoites as percent of total sporozoites in the field of view is shown. In the duration of the acquired 4 min videos, 2.38% and 2.06% of WT sporozoites invaded blood vessels and lymphatic vessels, respectively. This was in sharp contrast to the blood and lymphatic vessel invasion rates of CSΔN (0.23% and 0.26%) and TRAP-VAL (0.05% and 0%); n equals number of videos analyzed.
Figure 5—figure supplement 1

Blood vessel and lymphatic vessel invasion events and sporozoite MSD in videos acquired with and without CD31-labeling of dermal vasculature.
(A) No significant difference in the number of invasion events was observed in the presence or absence of CD31-labeling of vascular endothelia. (B) Mean square displacement (MSD) of sporozoite tracks over the duration of 4-min videos, at indicated time points after inoculation, showing comparable displacement of sporozoites in the dermis of mice with and without CD31 labeling. Dotted line shows 10 min time point data from Figure 1B, and solid lines shows the data used for that analysis split up into data from videos with CD31 labeling and videos without. The number of videos processed was: 10 min-all videos (14 videos/179 tracks), 10 min-without CD31 (10 videos/140 tracks), 10 min-with CD31 (4 videos/39 tracks).
Videos
Video 1
Time-lapse microscopy of wild-type control P. berghei sporozoites from 5 min to 120 min after intradermal inoculation.
https://doi.org/10.7554/eLife.07789.003
Video 2
Wild-type control P. berghei sporozoites 10 min after intradermal inoculation together with CD31-labeled vascular endothelia.
Maximum projection shown in Figure 2.
Video 3
Wild-type control (green) and CSΔN (far red) sporozoites 10 min after intradermal inoculation.
Note that an overlay of two independently acquired videos was generated using ImageJ to allow direct comparison of WT to CSΔN sporozoite motility. Individual maximum projections shown in Figure 3.
Video 4
Wild-type control (green) and TRAP-VAL (far red) sporozoites 10 min after intradermal inoculation.
Note that an overlay of two independently acquired videos was generated using ImageJ to allow direct comparison of WT to TRAP-VAL sporozoite motility. Individual maximum projections shown in Figure 3.
Video 5
CSΔN sporozoites 10 min after intradermal inoculation together with CD31-labeled vascular endothelia.
Maximum projection shown in Figure 4.
Video 6
TRAP-VAL sporozoites 10 min after intradermal inoculation together with CD31-labeled vascular endothelia.
Maximum projection shown in Figure 4.
Video 7
Wild-type control sporozoites 10 min after intradermal inoculation together with CD31-labeled vascular endothelia highlighting blood and lymphatic vessel invasion events.
Squares indicate blood vessel invasion and circles point to sporozoites entered into the lymphatic system. Blood vessel invasion events are characterized by a sudden increase in speed (square on the left) or visual entry of the blood vessel and disappearance out of the field of view (square on the right). Lymphatic invasion was characterized by the switch from directed forward movement to sideward drifting with a low velocity.
Video 8
Blood vessel invasion by wild-type control sporozoites in the absence of CD31 labeling.
Imaging was performed 10 min after intradermal inoculation and squares indicate blood vessel invasion events, characterized by a sudden increase in speed.
Additional files
-
Supplementary file 1
Primer sequences used to generate and confirm the transgenic and mutant parasites described in this study.
- https://doi.org/10.7554/eLife.07789.023
Download links
A two-part list of links to download the article, or parts of the article, in various formats.
Downloads (link to download the article as PDF)
Open citations (links to open the citations from this article in various online reference manager services)
Cite this article (links to download the citations from this article in formats compatible with various reference manager tools)
Longitudinal analysis of Plasmodium sporozoite motility in the dermis reveals component of blood vessel recognition
eLife 4:e07789.
https://doi.org/10.7554/eLife.07789


