Reward modulates the effect of visual cortical microstimulation on perceptual decisions
- University of Oxford, United Kingdom
- National Eye Institute, United States
Figures
Figure 1
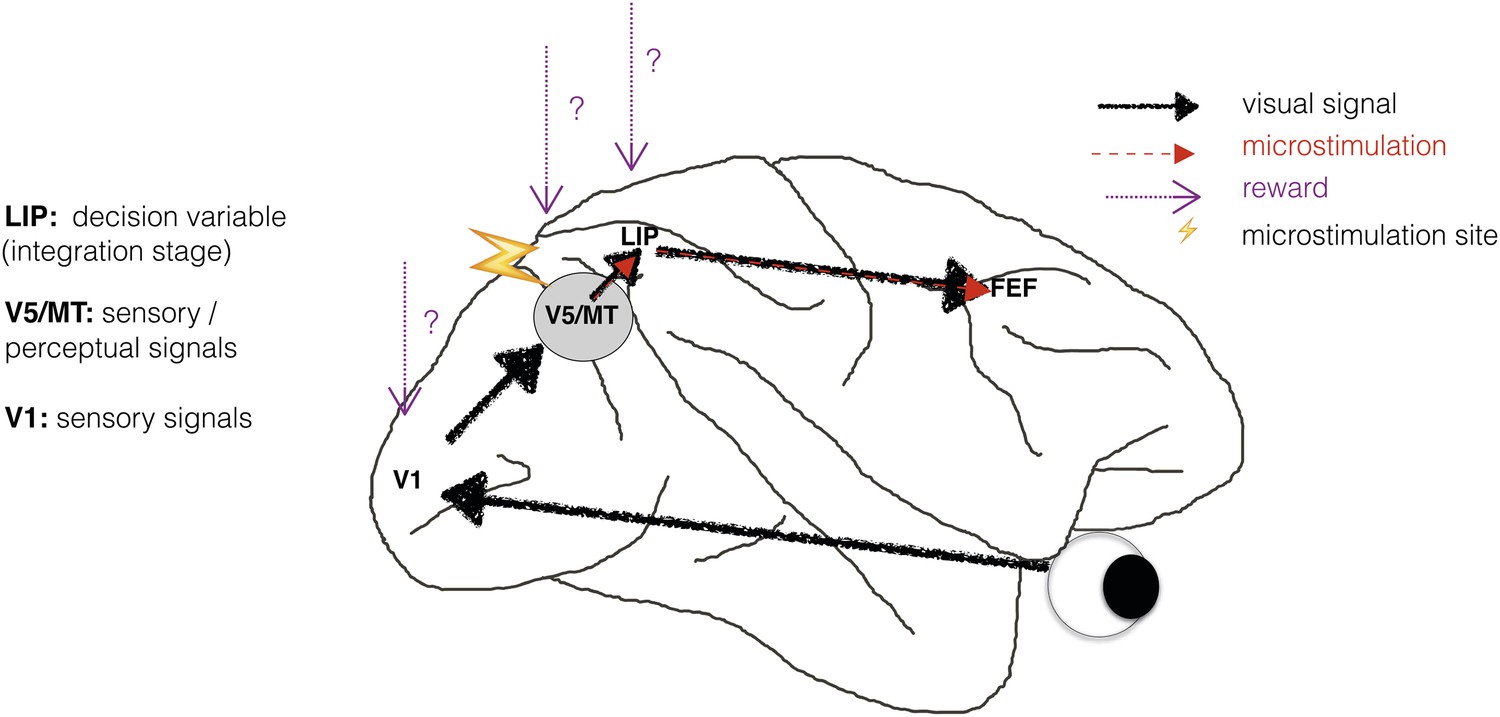
Schematic illustration of a visual perceptual decision-making pathway with V5/MT microstimulation and reward.
Primary visual cortex (area V1) comprises the initial stage of visual information processing but neurons here can respond to visual sensory signals that do not reach perception (Cumming and Parker, 1997). On the other hand, activity of motion- and disparity-selective neurons in visual area V5/MT have been closely linked to animals' subjective perception during discrimination of structure-from-motion (SFM) visual stimuli (Dodd et al., 2001). In the present study, we artificially activate motion- and disparity-selective neurons in visual area V5/MT with electrical microstimulation. Microstimulation biases perceptual choices towards visual interpretations that match the tuning of the stimulated neurons (Krug et al., 2013). In visual discrimination tasks, sensory evidence is integrated over time into a decision variable (DV), represented in the activity of neurons in lateral intraparietal cortex (area LIP; see Gold and Shadlen 2007 for review). Since visually evoked and electrically evoked signals both influence behaviour, they are presumably integrated together to influence the DV. The results of evidence integration also affect activity in the frontal eye fields (FEF) that represent the planning of eye movements (saccades), which animals use to indicate their perceptual decision in the discrimination task (Figure 2). Previous studies have established an influence of reward on neural representations in sensorimotor regions such as area LIP (Platt and Glimcher, 1999; Sugrue et al., 2004; Rorie et al., 2010). However, it is not known whether reward can also affect sensory or perceptual signals represented in visual cortex during perceptual decision-making.
Figure 2
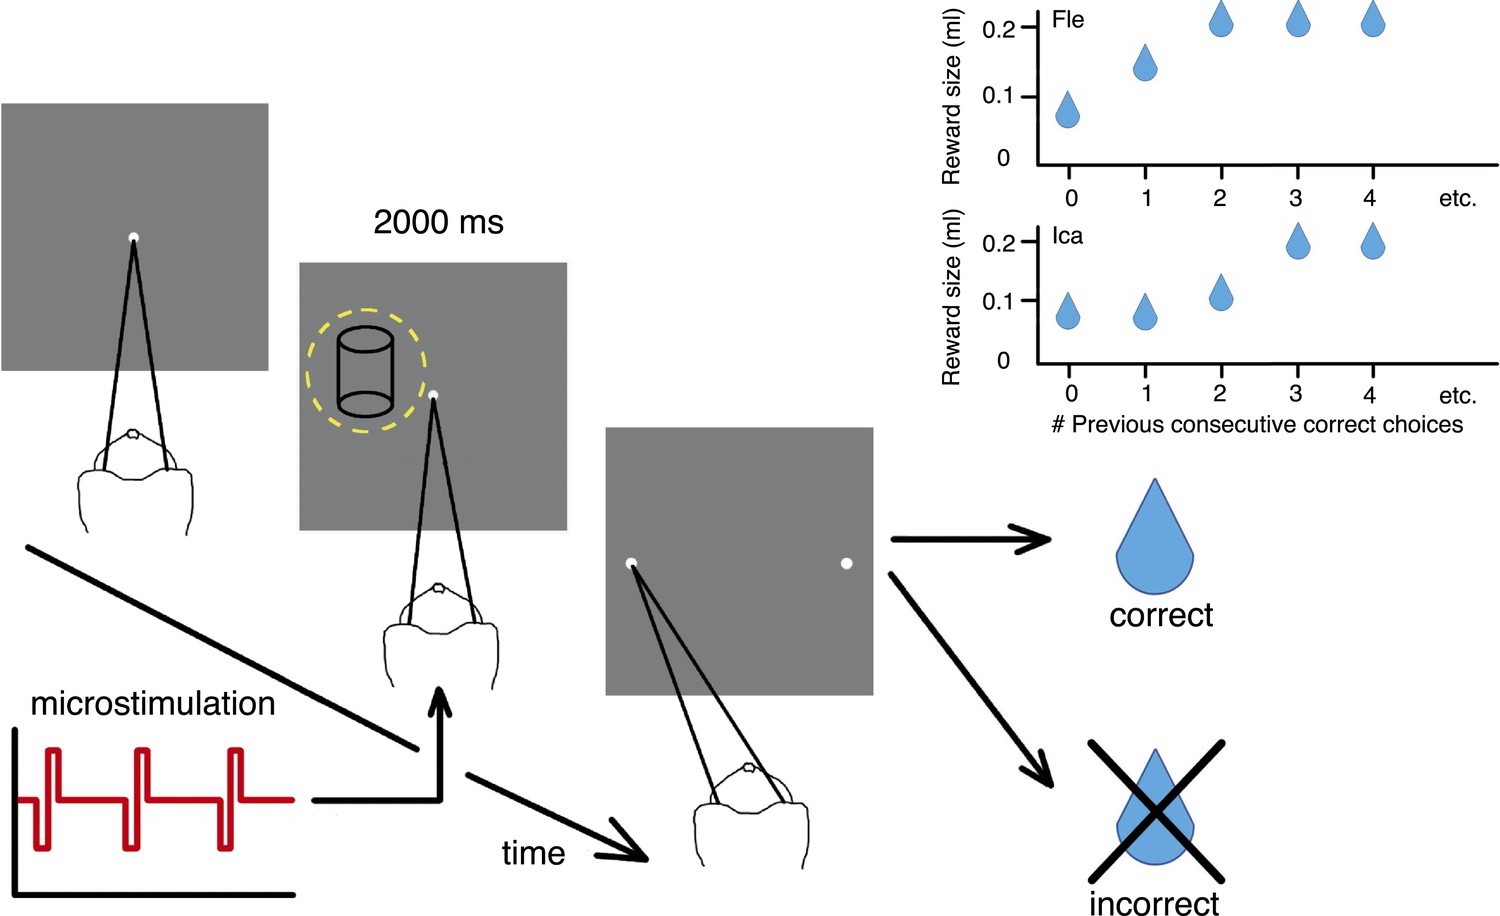
Cylinder discrimination task with electrical microstimulation and variable reward schedules.
At the beginning of each trial, the monkey looked at the fixation point. The visual stimulus was then presented for 2000 ms, within the receptive field (RF) of the V5/MT multi-unit site selected for microstimulation (yellow dashed circle indicates RF location). Upon stimulus offset, two choice targets appeared. The monkey indicated its perceptual decision with an eye movement to one of the choice targets (left for clockwise [CW] rotation and right for counter-clockwise [CCW]). If the response was correct, the animal received a fluid reward; if incorrect, it received no reward and a time-out. On 50% of trials (pseudo-randomly chosen), electrical microstimulation was added to the V5/MT multi-unit site during visual stimulus presentation. Inset panels: Fluid reward volume increased in two steps up to a maximum depending upon the animal's performance history, that is, the number of immediately preceding consecutive correct choices. Reward size increased more quickly for Fle than Ica as a function of consecutive correct responses, but for both animals we categorized the trials into two conditions: maximal reward size (‘large’) and sub-maximal reward size (‘small’). The average size of sub-maximal rewards was half the maximal reward size for both animals.
Figure 3
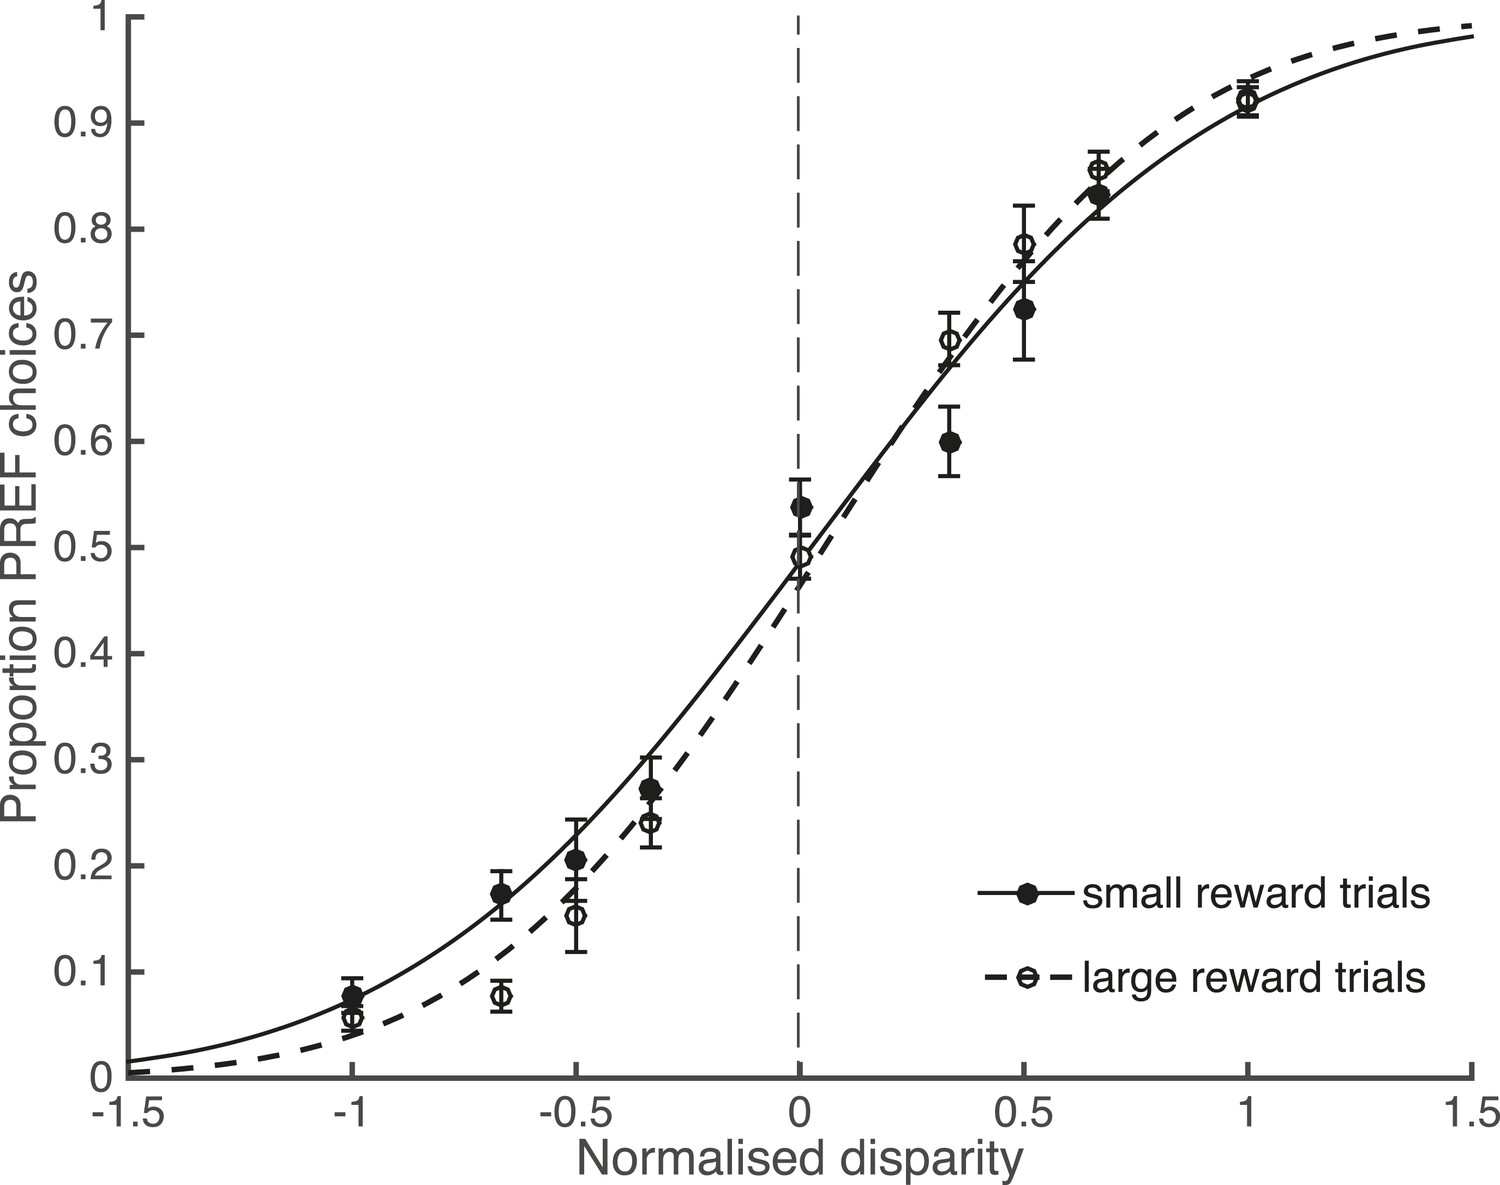
Large reward size is associated with improved performance.
Animals performed two blocks of the visual discrimination task at each site, prior to the introduction of electrical microstimulation. Trials were separated according to available reward size (small or large) and pooled across all sites over both animals. Psychometric functions are fit with cumulative Gaussians. There is a significant interaction between reward size and steepness of the slope (s.d. of the fitted function; χ2 likelihood-ratio test of nested models Equations 2a,b: p = 0.001). For large reward trials the slope is steeper, indicating better performance accuracy. Error bars show the standard error of the mean (s.e.m.).
Figure 4
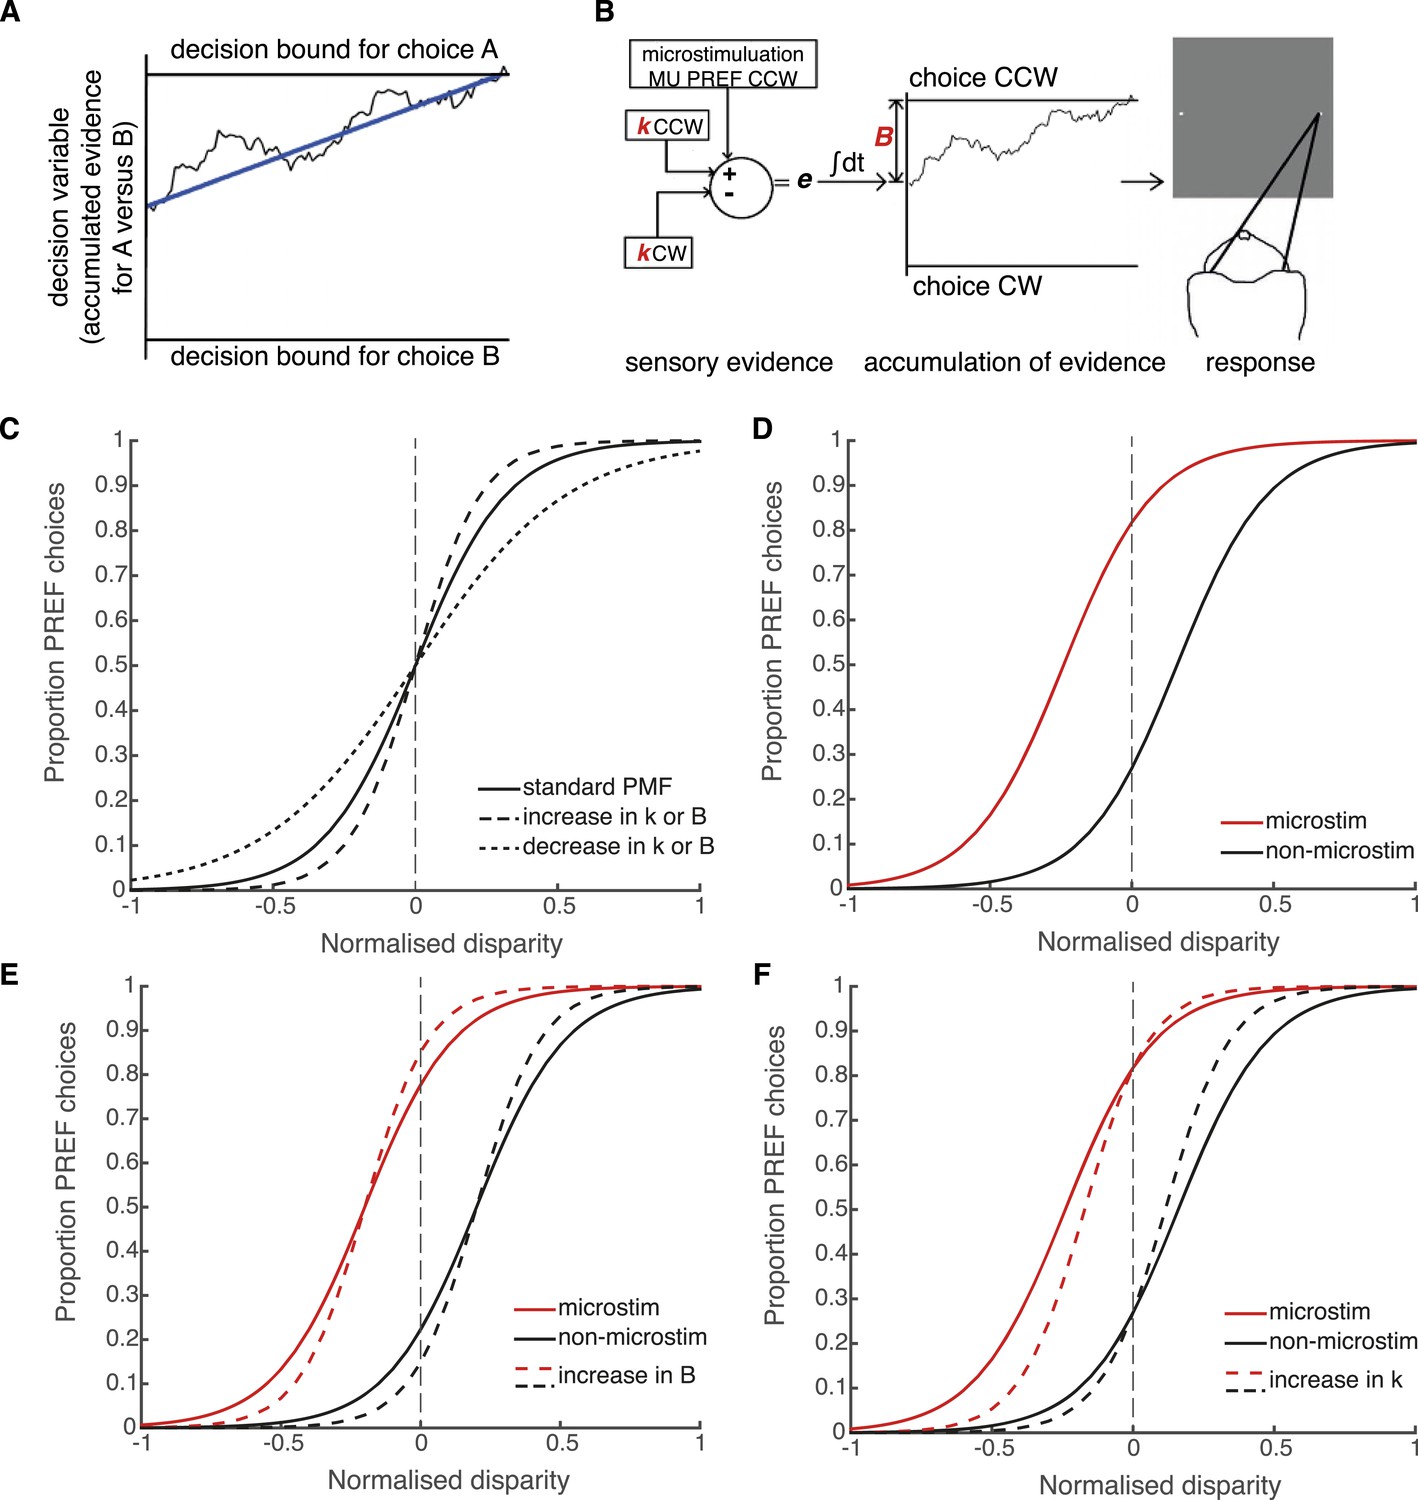
Schematic illustration of possible interactions between microstimulation, reward and the parameters of the bounded accumulation model of perceptual decision-making.
(A) Momentary evidence, in favour of choice ‘A’ over choice ‘B’, is accumulated over time. The time-varying accumulation of evidence is termed the decision variable (DV; black line). (B) The bounded accumulation model applied to the cylinder task with microstimulation. The momentary evidence (e) is the difference in activity between two neuronal pools, one selective for CW rotation and one for CCW rotation. Parameter k represents the sensitivity of these sensory representations to the cylinder disparity C (Palmer et al., 2005). In each trial, the DV follows a stochastic ‘drift-diffusion’ path with an average drift rate dependent on the mean of e = kC. Parameter B represents the distances to the CW and CCW decision bounds, which are assumed to be equal. Microstimulation contributes to e as additional evidence in favour of the sensory preference of the stimulated V5/MT multi-unit site (CCW in this example). The perceptual decision depends on which bound was first reached, or, if neither is reached, which bound the DV is nearest to at the end of stimulus viewing. (C) Model simulations illustrate that the slope of the psychometric function, fitted by a simple logistic model of bounded accumulation (Equation 3a), can be affected by changes in either parameter k or B; for example, an increase in either parameter will steepen the slope, indicating improved performance. (D) Model simulations illustrate how insertion of additional sensory evidence by electrical microstimulation in visual cortex biases perceptual choices toward the preferred (PREF) cylinder disparity of the stimulated multi-unit (MU), which is revealed as a shift of the psychometric function. (E) An increase in parameter B steepens the slope of the psychometric functions, but does not change the size of microstimulation shift. This is because by the evidence-accumulation stage, visually evoked and electrically evoked signals are combined and cannot be differentially affected (see panel B). (F) An increase in parameter k also steepens the slope of the psychometric function. However, improved perceptual sensitivity to the stimulus affects only the visually-evoked sensory representations (see panel B), so the relative contribution of the electrically-evoked signals is decreased, which results in a decrease in the microstimulation-induced shift of the psychometric function.
Figure 5
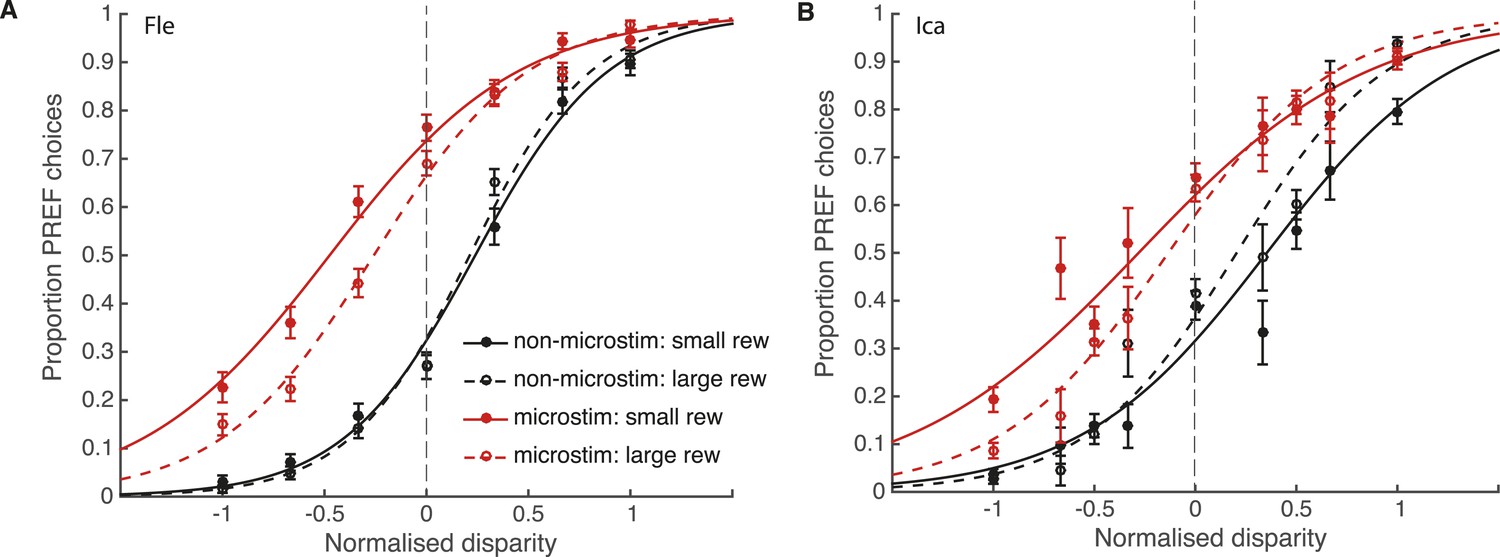
Reward modulates the effect of visual cortical microstimulation on perceptual decisions.
Trials were pooled across significant PREF microstimulation sites separately for monkeys Fle (A) and Ica (B). Psychometric functions were fit with the bounded accumulation model (Equation 3a). In both cases, the effect of microstimulation (horizontal shift between red and black psychometric functions) was smaller in large reward trials (dashed lines) compared to small reward trials (smooth lines). For both animals, the best-fitting model allowed both parameter k (stimulus sensitivity) and parameter B (distance to decision bounds) to be affected by reward condition (χ2 likelihood-ratio tests of nested models Equations 3b,c, p < 0.05 in all cases, see main text for details). This suggests that reward can affect sensory representations as well as evidence integration during perceptual decision-making. Error bars show s.e.m.
Figure 6 with 1 supplement
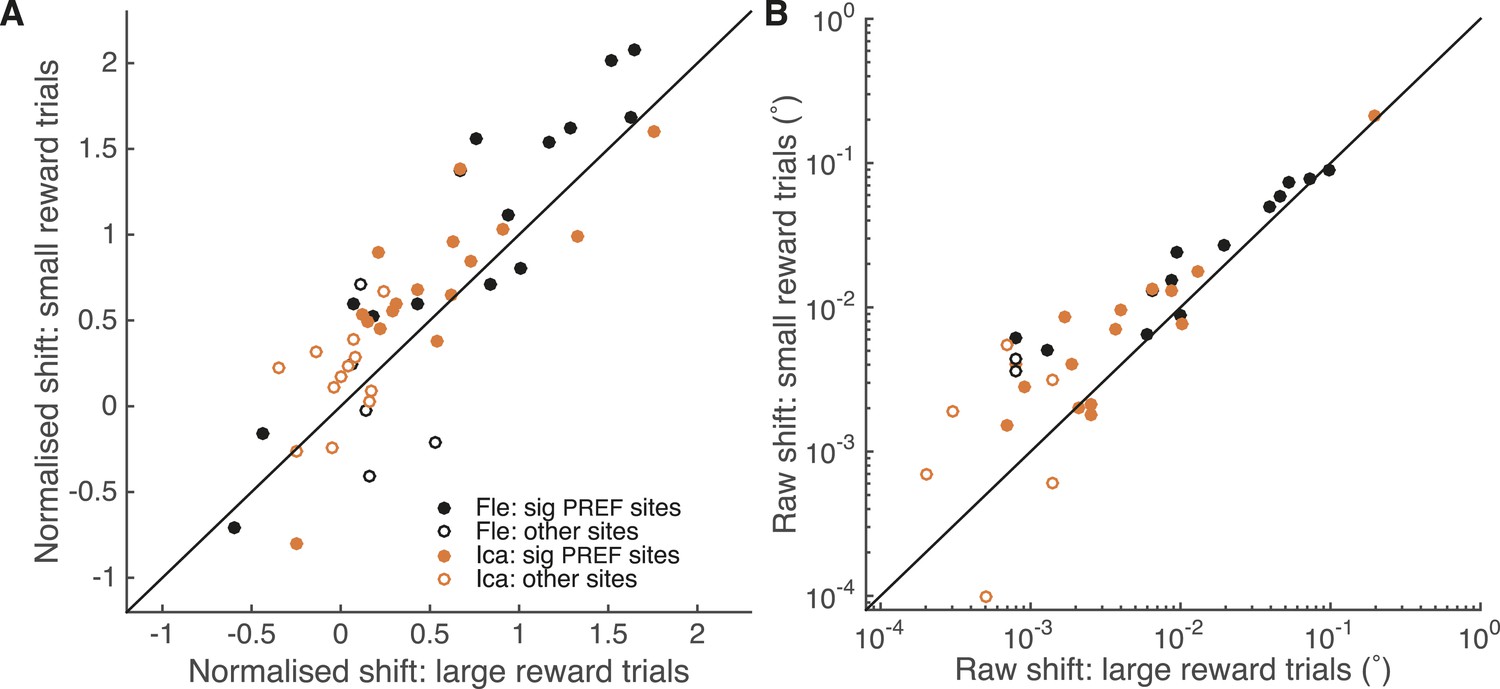
A site-by-site analysis confirms that visual cortical microstimulation is less effective at biasing perceptual choices in trials with large expected reward compared to trials with small expected reward.
This is significant over both animals for microstimulation shifts normalised by discrimination threshold at each site (A; Wilcoxon sign-rank test: p < 0.001) and also for the raw microstimulation shifts (B; p < 0.001). This is also significant for each animal separately (see ‘Results’ for details). Raw microstimulation shifts (B) are plotted on a log-scale; please note that the effect of reward is comparable across different microstimulation effect sizes (see Figure 8). Black lines indicate the identity relationship.
Figure 6—figure supplement 1
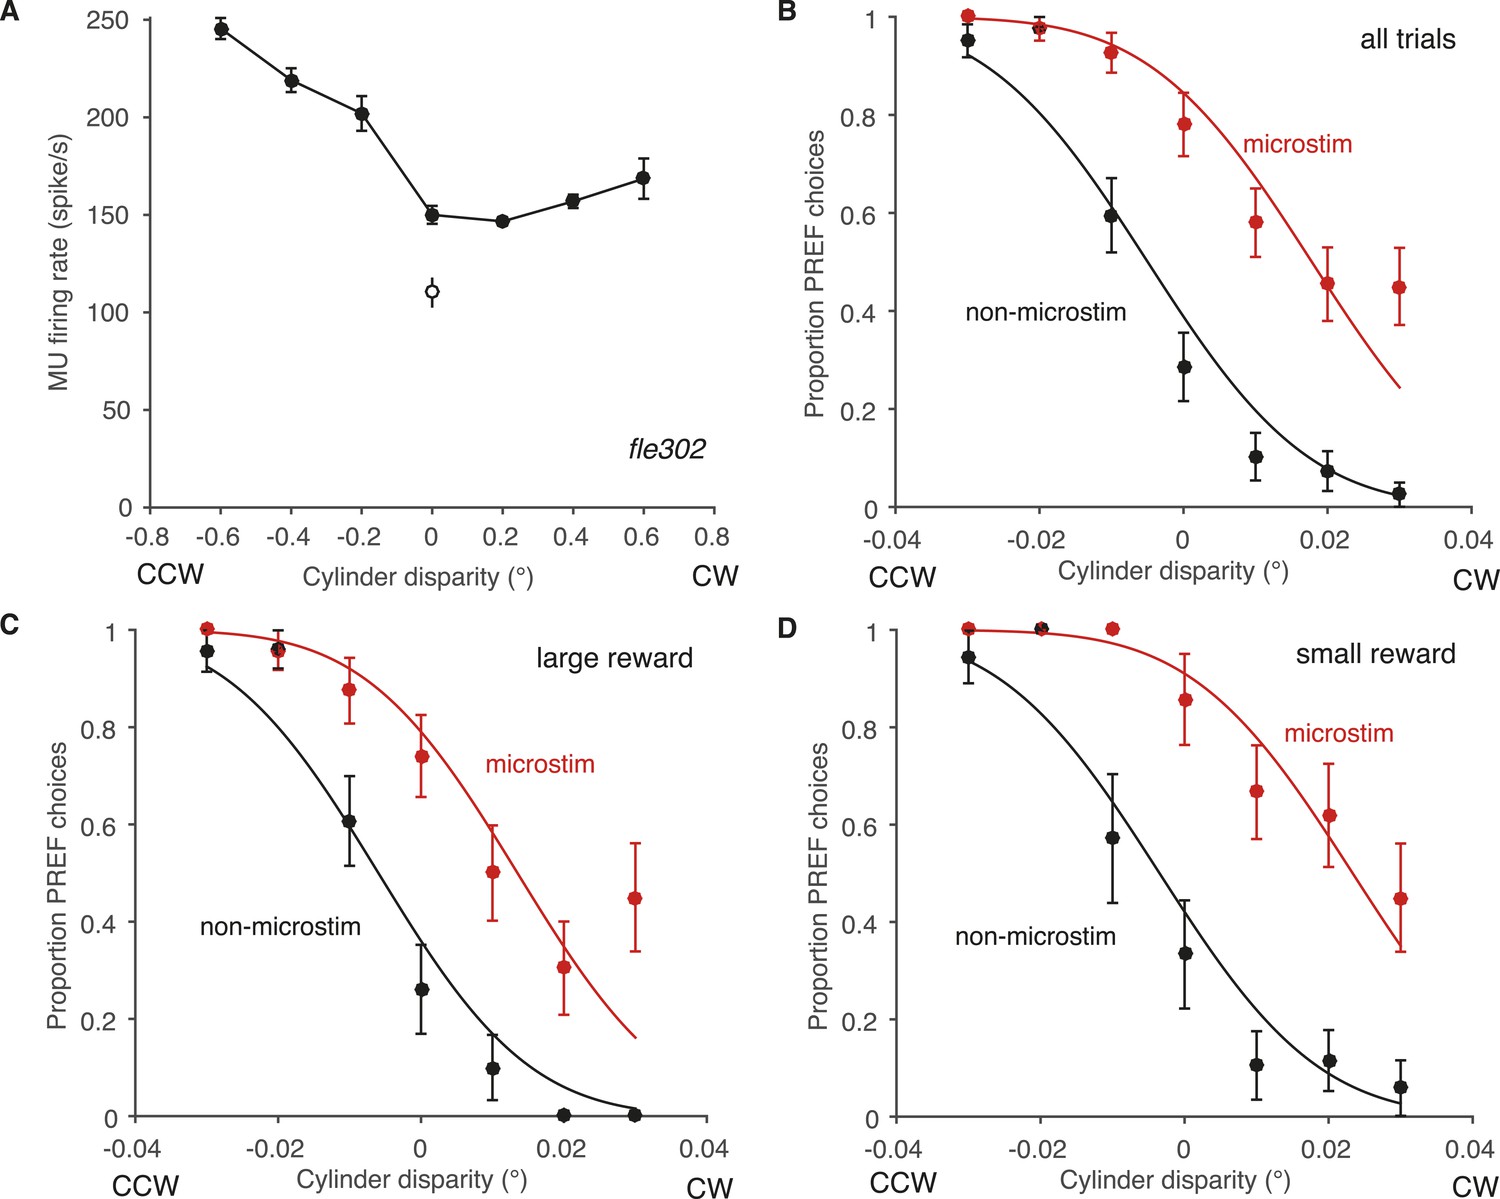
Effect of reward on visual cortical microstimulation at an example V5/MT site, fle302.
(A) At this site, the MU tuning had a preference for counter-clockwise rotating cylinders (PREF direction = CCW). Filled circles: response to cylinder stimulus. Open circle: baseline (blank screen). (B) Electrical microstimulation consistently increased the proportion of choices in the PREF direction. The proportions of PREF responses with and without microstimulation were fitted with a pair of cumulative Gaussians, constrained so that both curves had the same standard deviation (s.d.) but different means. The two-mean fit was better than a single function describing both microstimulated and non-microstimulated data, indicating a significant microstimulation effect at this site (χ2 likelihood-ratio test of nested models Equations 1a,b, p < 0.001). The horizontal shift between the fitted curves is a measure of microstimulation effect size. Here the effect is equivalent to adding a binocular disparity of −0.023° to the stimulus, such that the cylinder would appear to rotate more strongly in the PREF direction, CCW. Division by the s.d. gives the normalized microstimulation effect (here, 1.298). (C) In trials where available reward was large, microstimulation was decreased, equivalent to adding −0.019° of disparity (normalized shift = 1.165). (D) In trials where available reward was small, microstimulation was equivalent to adding −0.027° of binocular disparity (normalized shift = 1.542). All error bars show s.e.m.
Figure 7

Effect of reward on visual cortical microstimulation cannot be explained by a change in the animal’s strategy.
A control experiment was run with animal Ica, in which microstimulation was simulated by insertion of an additional disparity signal (‘∆dx’) into the cylinder stimulus. The animal was rewarded only for correct choices with respect to cylinder disparity before insertion of ∆dx. Inset panels illustrate the colour change of cylinder dots from all black in trials with no additional disparity added (A) to all white dots in ∆dx trials (B). Performance in the ∆dx control was significantly better in large reward compared to small reward trials (χ2 likelihood-ratio test of nested models Equations 2a,b: p < 0.001), but there was no significant effect of reward on the shift induced by additional ∆dx disparity (χ2 likelihood-ratio test of nested models Equations 2a,c: p > 0.05). Therefore, even when trials that contain additional disparity were clearly signalled, the animal did not make an adjustment to counter this additional signal more on large relative to small reward trials. By contrast, under the same model, reward significantly reduced the electrical microstimulation shift for both Fle and Ica (see main text). This suggests that the change in microstimulation shift with reward was not likely to be due to the animals adopting a decision criterion that depended both on reward size and on detecting microstimulation. Error bars show s.e.m.
Figure 8 with 3 supplements
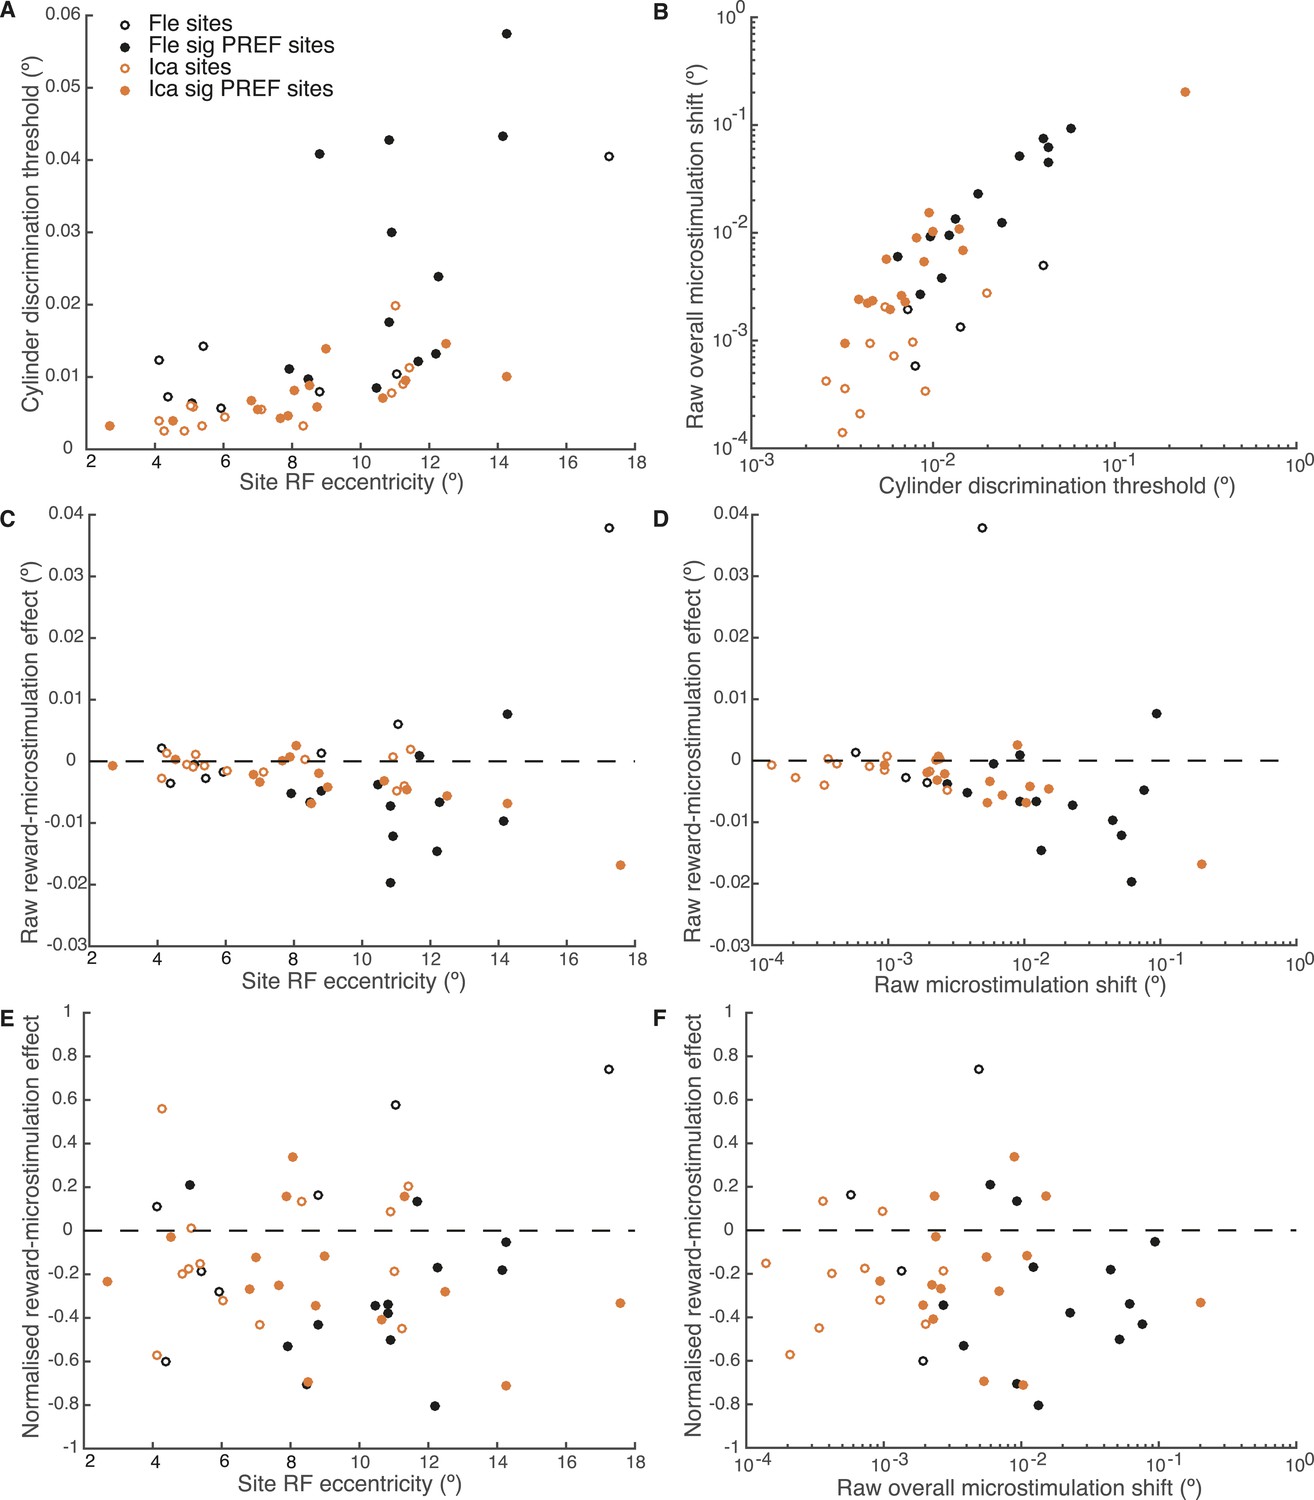
Effect of reward on visual cortical microstimulation is constant over stimulus eccentricity and over raw overall microstimulation effect size.
(A) Cylinder discrimination threshold (s.d. of the cumulative Gaussian fitted to the psychometric function) significantly correlates with stimulus eccentricity, which is determined by the MU receptive field (RF) location at the microstimulation site (Fle: p = 0.001; Ica: p = 0.001). (B) Raw overall microstimulation effect at each site is significantly correlated with discrimination threshold (Ica: p < 0.001; Fle: p < 0.001). (C) Effect of reward on the raw microstimulation shift (i.e. the raw microstimulation shift in large reward trials minus the raw shift in small reward trials) significantly correlates with stimulus eccentricity for both animals considered together (p = 0.018) and also for Ica alone (p < 0.001). (D) Effect of reward on the raw microstimulation shift significantly correlates with the raw overall microstimulation effect for both animals considered together (p = 0.028) and also for Ica alone (p < 0.001). (E) When the effect of reward is considered over microstimulation shifts normalised by discrimination threshold, the correlation with stimulus eccentricity disappears (p > 0.05 in all cases). (F) When the effect of reward is normalised by discrimination threshold at each site, the correlation with raw overall microstimulation effect disappears (p > 0.05 in all cases). (E, F) show that the reward effect is constant when expressed as a fraction of discrimination threshold. All correlation tests use Pearson's product–moment correlation coefficient.
Figure 8—figure supplement 1

Fluctuations in performance do not explain effect of reward on visual cortical microstimulation.
(A) Time-series analysis of performance over the microstimulation session at example site fle300. Smoothed performance accuracy (proportion correct choices) was calculated over a sliding time window of 30 trials. The horizontal line indicates mean performance accuracy at the site. Smoothed performance accuracy fluctuates above and below this mean, perhaps reflecting fluctuations in task engagement. The amount of performance fluctuation at each site was calculated as the area between the smoothed performance curve and the horizontal line, normalised by total number of trials. Epochs of good and bad performance were identified, marked in green and red respectively. (B) There is no correlation between normalised reward effect size and the amount of performance fluctuation across microstimulation sites, either for animals separately or together (Pearson's product–moment correlation: p >> 0.05 in all cases), suggesting that performance fluctuation cannot explain the reward effect on microstimulation. Next, we tested whether the effect of reward on microstimulation remained in good epochs (C) and bad epochs (D), combined across sites and animals. For both types of epoch, the effect of microstimulation was significantly smaller in large compared to small expected reward trials (χ2-test of nested models Equations 2a,c: good epochs: p < 0.001; bad epochs: p < 0.001), showing that the effect of expected reward on microstimulation remains present in different states of task engagement. Although it might be expected that there may be fewer difficult (small disparity) trials in good epochs than bad epochs, it can be seen that all disparities are represented in both epoch types, allowing the psychometric functions to be fitted.
Figure 8—figure supplement 2

Waning of microstimulation does not explain reward effect.
The microstimulation effect may wane over time in some experiments (Salzman et al., 1992). Microstimulation might be less effective near the end of each experimental session, simultaneously with the occurrence of a greater proportion of large reward trials near the end of the session – for example, owing to a training effect that increases the number of consecutive correct responses. Such a co-variation could explain the difference in microstimulation effect by reward. A running average of the proportion of large reward trials was calculated for each experimental session at each significant PREF microstimulation site (significant shift in the PREF stimulus direction), across both animals. The normalised reward effect on microstimulation shift is plotted against the gradient of the best-fit line of the running-average proportion of large reward trials over time, for each site. A positive gradient indicates an increased proportion of large reward trials towards the end of the microstimulation session. There was no correlation between reward effect and proportion of large reward trials at the end of the session over the two animals (Spearman's rank correlation: n = 28, p > 0.05; Pearson's linear correlation: n = 28, p > 0.05).
Figure 8—figure supplement 3
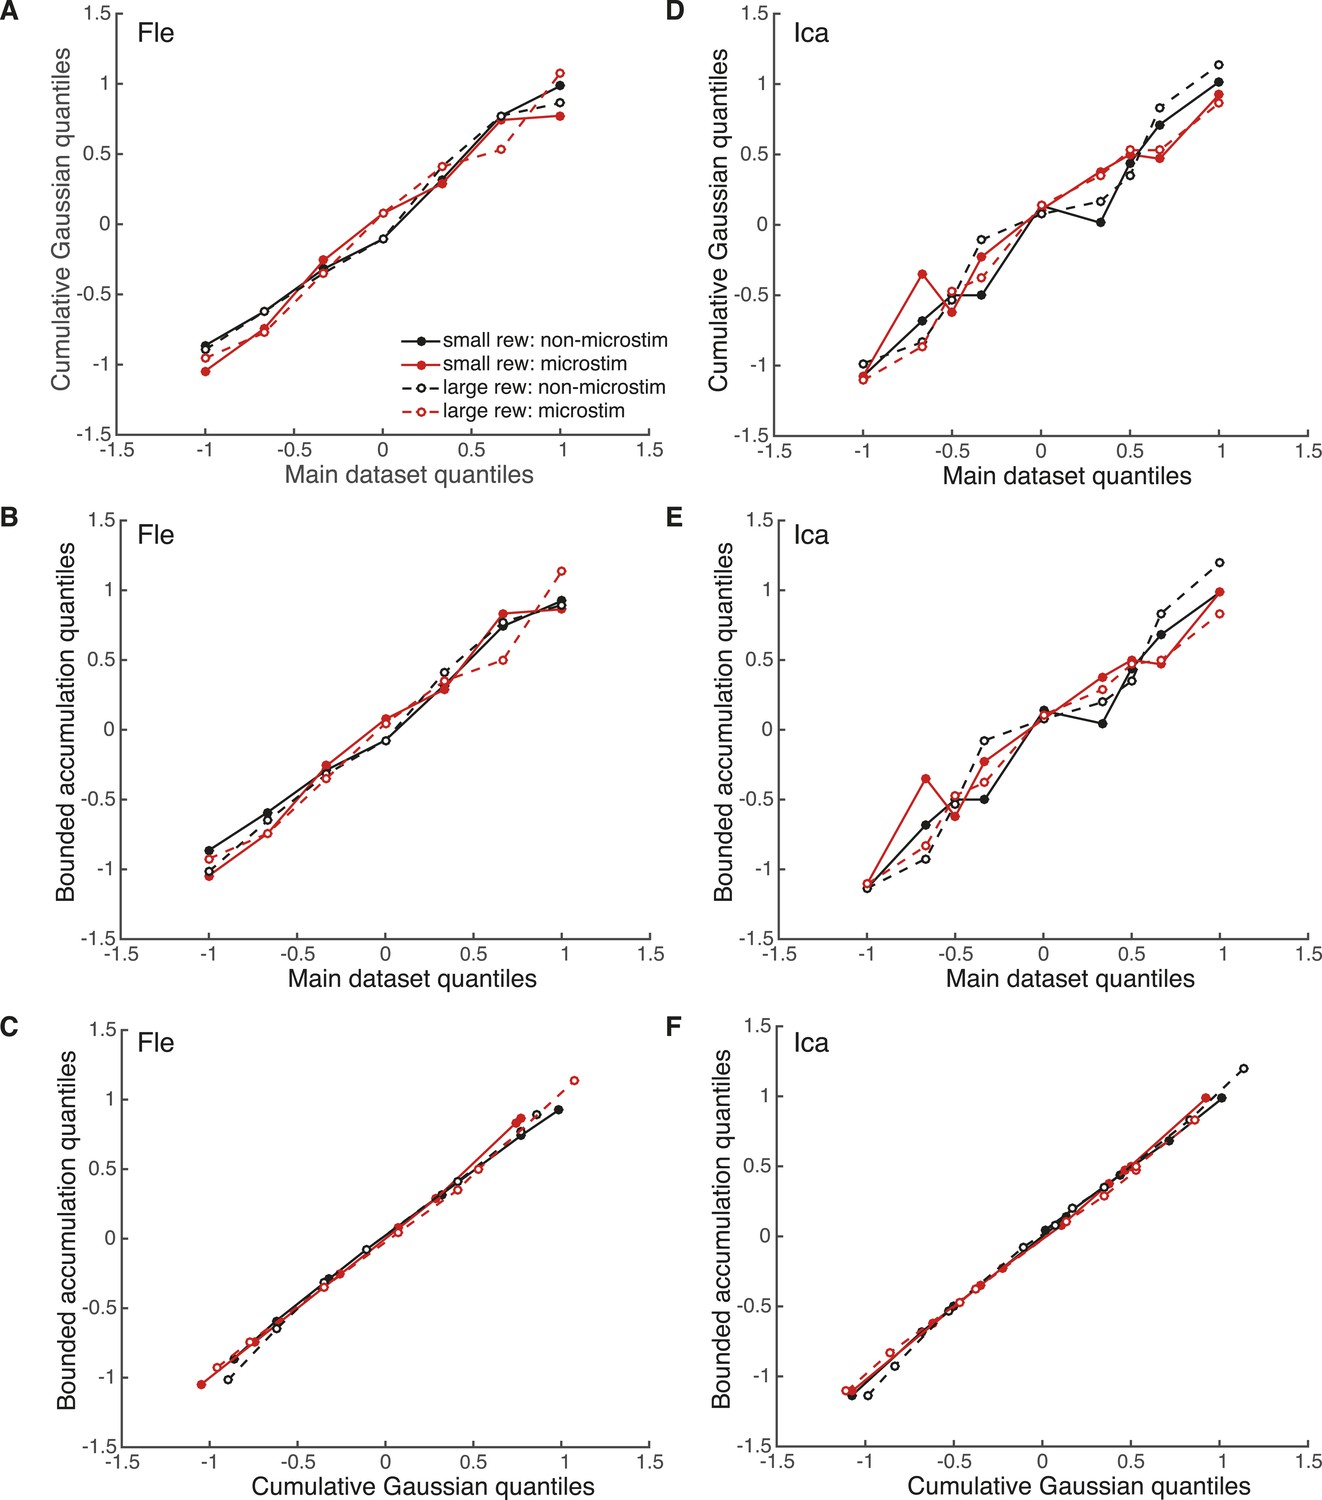
Evaluation of model fits with quantile–quantile comparisons.
Pair-wise quantile–quantile comparison plots between the electrical microstimulation data (pooled over significant PREF sites), fitted cumulative Gaussian model (Equation 2a), and fitted bounded accumulation model (Equation 3a) for Fle (A, B, C) and Ica (D, E, F). ‘Quantile’ values are the proportions of PREF choices for each stimulus disparity data point, taken from the real datasets. For each such quantile value, the corresponding cylinder disparity value was extracted from the fitted psychometric function for each model. These model-simulated disparity values were plotted against the disparities obtained from the microstimulation data, and against each other. A linear quantile–quantile relationship indicates a reasonable fit of the model to the microstimulation data for model-data comparisons, and a reasonable correspondence between model fits for model–model comparisons.
Videos
Video 1
The structure-from-motion rotating cylinder stimulus.
An illustration of the SFM rotating cylinder stimulus used in the study. This example video shows the ambiguously rotating zero-disparity version of the cylinder, for which perception of the direction of rotation is bistable.
Tables
Table 1
Parameter values for bounded accumulation model fit to data combined over significant PREF microstimulation sites
| Animal | Parameter | Estimated value (small reward) | Estimated value (large reward) | % Change in estimate by reward | −logL* for frozen parameter model | −logL* for full model | χ-value of model comparison | p value of χ2-test† |
|---|---|---|---|---|---|---|---|---|
| Fle | k | 1.74 | 2.41 | +38.3 | 3045.0 | 3034.3 | 21.4 | 0.00002 |
| Ica | k | 1.94 | 3.50 | +80.4 | 2398.9 | 2389.2 | 19.4 | 0.00001 |
| Fle | B | 1.77 | 1.40 | −20.7 | 3037.9 | 3034.3 | 7.2 | 0.0073 |
| Ica | B | 1.29 | 0.79 | −38.4 | 2394.8 | 2389.2 | 11.2 | 0.0008 |
-
*
Negative log likelihoods (−logL) reported for each model fit, that is, with all parameters allowed to vary by reward condition (Equation 3a) compared with each parameter frozen (Equations 3b,c).
-
†
p values were obtained from a χ2 likelihood-ratio test comparing the fit of the full bounded evidence-accumulation model to a restricted version of the model in which the specified parameter was not allowed to change value for different reward conditions (nested models Equations 3a,b,c, ‘Materials and methods’; Figure 5A,B).
Additional files
-
Supplementary file 1
Large and small reward conditions do not differ in the proportion of microstimulated trials, nor in the distribution of stimulus disparities.
The nature of the reward contingencies in this experiment meant that the reward size for any particular trial was dictated by the monkey's accumulated performance on the previous trials. Therefore, the distribution stimulus disparities and the proportion of microstimulated trials were not a priori balanced between large and small reward conditions. Any systematic difference between the distributions of these factors in the two reward conditions might contribute to the reported effect of reward on microstimulation shift. We compared the mean absolute disparity and the percentage of microstimulated trials in small reward versus large reward trials. We found no significant difference in the distribution of stimulus disparities between the reward conditions in either monkey across all sites (Wilcoxon sign-rank test, Fle: n = 20, p = 0.263; Ica: n = 28, p = 0.187) nor when significant PREF sites are considered alone (Fle: n = 13, p = 0.127; Ica: n = 15, p = 0.169). We also found no significant difference in the proportion of microstimulated to non-stimulated trials in the two reward conditions in either monkey across all sites (Wilcoxon sign-rank test, Fle: n = 20, p = 0.737; Ica: n = 28, p = 0.075), nor when significant PREF microstimulation sites were considered alone (Fle: n = 13, p = 0.735; Ica: n = 15, p = 0.064).
- https://doi.org/10.7554/eLife.07832.017
Download links
A two-part list of links to download the article, or parts of the article, in various formats.
Downloads (link to download the article as PDF)
Open citations (links to open the citations from this article in various online reference manager services)
Cite this article (links to download the citations from this article in formats compatible with various reference manager tools)
Reward modulates the effect of visual cortical microstimulation on perceptual decisions
eLife 4:e07832.
https://doi.org/10.7554/eLife.07832


