Intermolecular epistasis shaped the function and evolution of an ancient transcription factor and its DNA binding sites
- University of Oregon, United States
- University of Chicago, United States
Figures
Figure 1
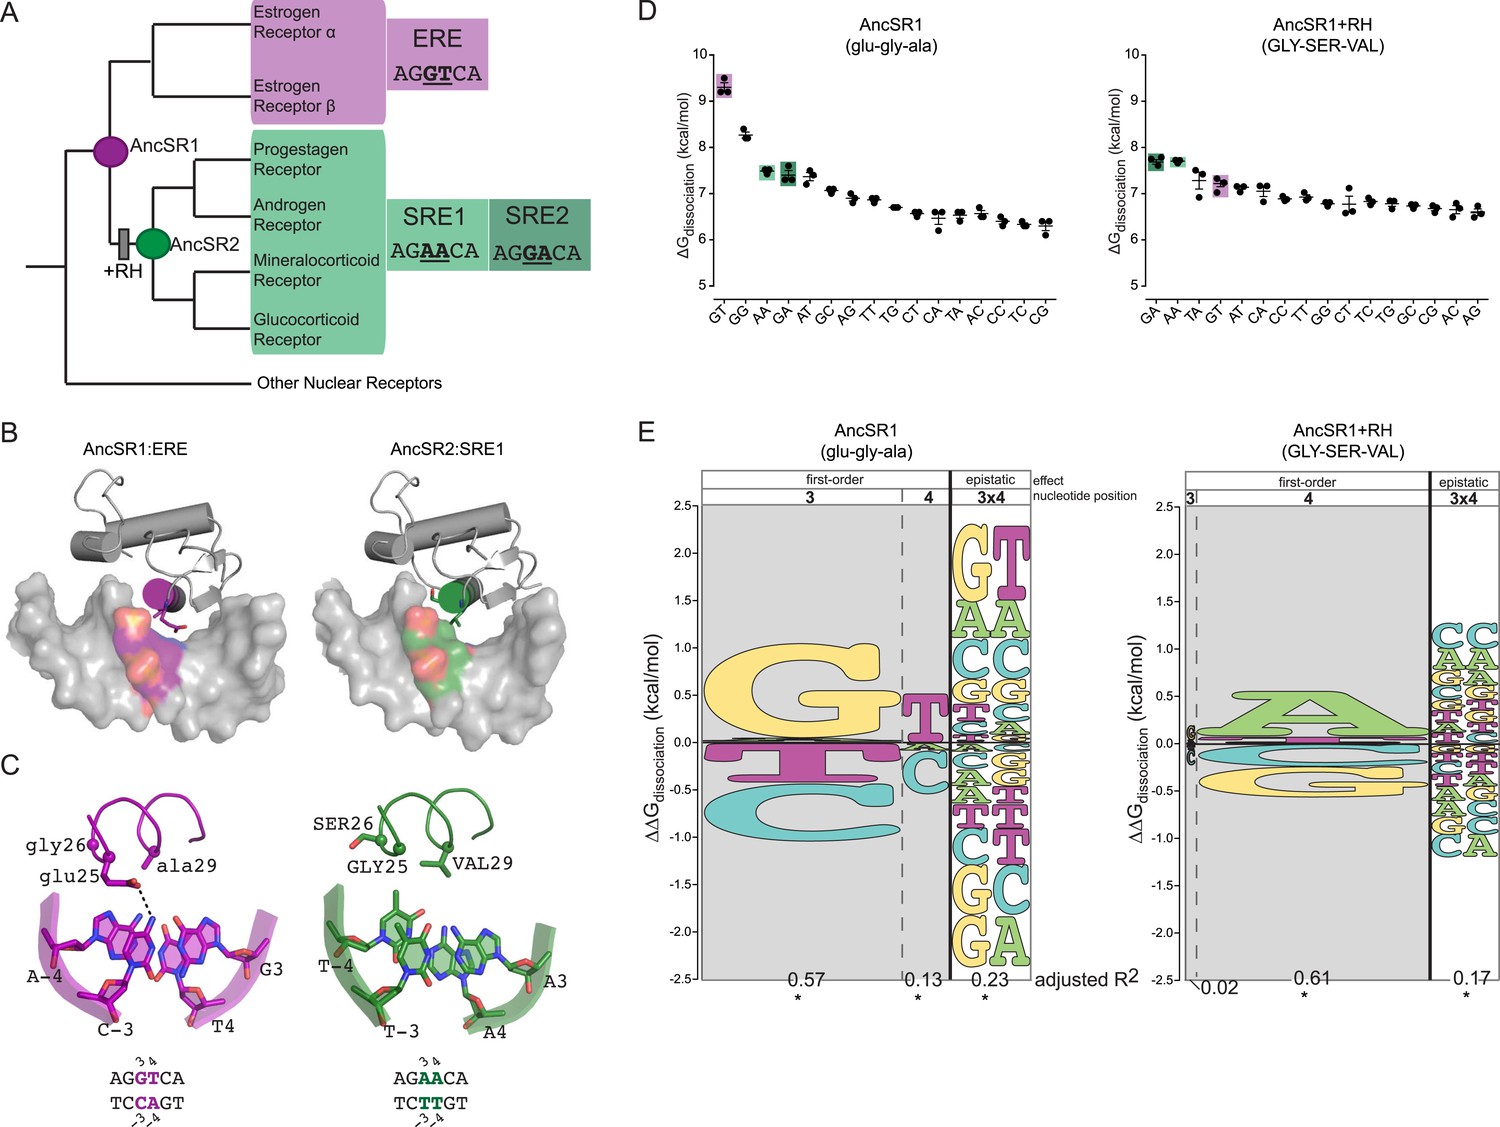
Recognition helix (RH) substitutions change DNA-binding affinity and specificity.
(A) Phylogenetic relationships of modern-day vertebrate SRs are shown, with ancestral proteins AncSR1 and AncSR2 marked. Each protein's preferred response element (RE) is shown: estrogen RE (ERE; purple) or steroid REs (SRE1, SRE2; light and dark green, respectively), with the half-site sequence of each. Gray box indicates evolutionary interval in which SRE specificity evolved (McKeown et al., 2014). (B) Interface of steroid hormone receptor DNA-binding domains (DBDs) with their preferred RE half-sites. X-ray crystal structures of AncSR1 with ERE (left, 4OLN) and AncSR2 with SRE1 (right, 4OOR). The RH is shown as a colored cylinder; sticks, side chains that differ between AncSR1 and AncSR2. Colored surface, nucleotides that differ between REs. (C) Close-up of protein-DNA interface for AncSR1:ERE (left) and AncSR2:SRE1 (right). In the DBD, the RH is shown as ribbon, with side chains of variable amino acids shown as sticks and Cα as spheres. In the RE, variable nucleotides are shown as sticks with backbone as cartoon. Atoms are colored by element. Dashed lines, polar interactions between variable amino acids and nucleotides. (D) Historical RH replacements change AncSR1's affinity for REs. Binding energies of AncSR1 (left) and AncSR1+RH replacements were measured using fluorescence polarization to single half-site REs containing all possible combinations of nucleotides at the sites that vary between ERE and SREs. ERE, SRE1 and SRE2 are highlighted in purple, light green and dark green, respectively. ΔGdissociation is the free energy of dissociation, calculated from dissociation constant (Kd). Technical replicates (dots) with mean and SEM (lines) are shown. (E) RH replacements change the genetic determinants of affinity within the RE. Energy logos for AncSR1 (left) and AncSR1+RH (right) show the effects of nucleotide states on binding energy relative to the average across all REs tested; states with ΔΔGdissociation > 0 are associated with higher affinity binding. Main effects of nucleotides at variable positions 3 and 4 are shown, as is the epistatic effect of nucleotide combinations, defined as the excess effect beyond that predicted under additivity. The height of each state indicates the magnitude of their effect on binding energy; states are ranked from top to bottom by the magnitude of its effect. Each column's width shows the portion of variation in binding energy attributable to the effects of states in that column, calculated as the increase in the adjusted R2 when terms corresponding to those states are added to a linear regression model and fit to the experimental binding data. *, significant improvement in model fit (likelihood ratio test, p < 0.05 Bonferroni-corrected). For complete explanation of linear modeling approach, see ‘Materials and methods’.
Figure 2

Protein intermediates between AncSR1 and AncSR1+RH are promiscuous or weak transcription factor proteins (TFs).
Binding energies of AncSR1 variants containing all combinations of ancestral and derived states at the RH sites with historical replacements are shown for all 16 REs as measured by fluorescence polarization. Single-replacement neighbors of AncSR1 are shown in the top row; two-replacement proteins are shown in the bottom row. ERE, SRE1 and SRE2 are highlighted with purple, light green and dark green bars, respectively. Dashed line, mean binding energy across all protein genotypes and all REs. Data points show three replicates; mean and SEM are shown with lines.
Figure 3
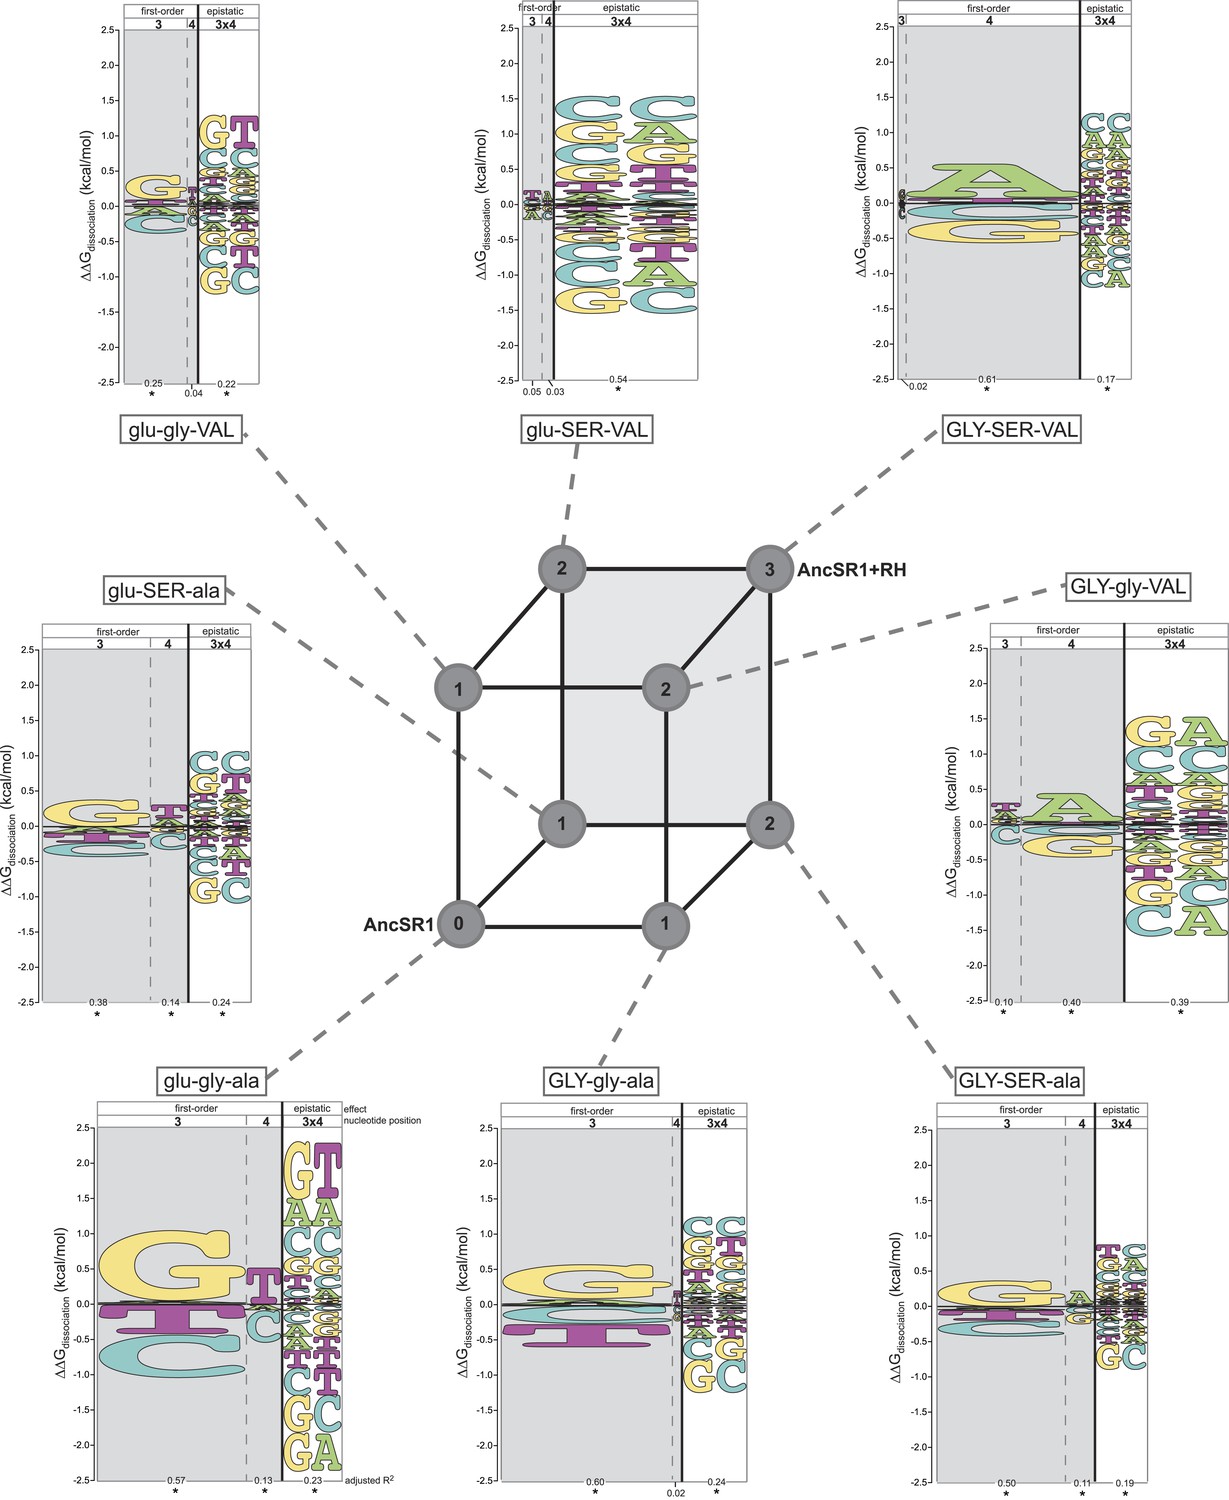
Each amino acid replacement contributes to the evolution of novel DNA specificity.
For each protein intermediate in the sequence space between AncSR1 and AncSR1+RH, the energy logo depicts the main and epistatic effects of the RE nucleotide states and combinations on binding affinity by each TF (for details, see Figure 1E). Vertices of the cube indicate protein genotypes; the number of amino acid differences from AncSR1 is indicated in the circle at each node. Edges represent single replacements between TF genotypes.
Figure 4
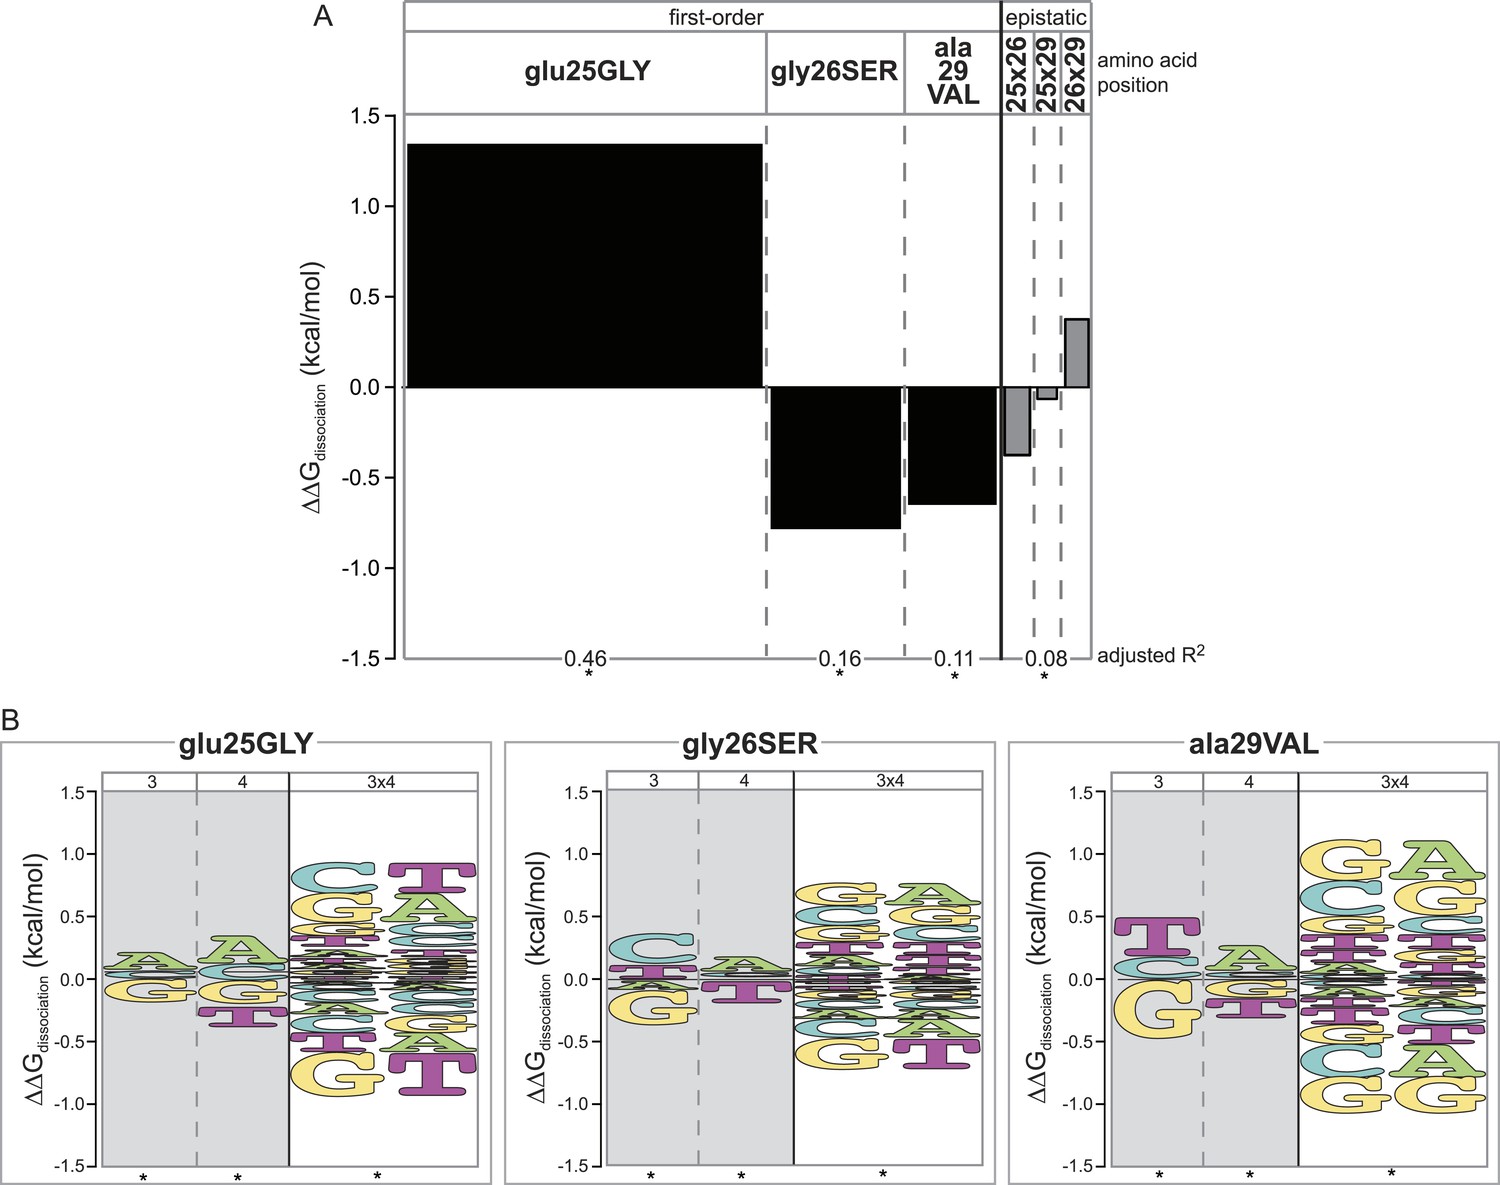
Epistasis across the protein-DNA interface: effect of historical replacements in the TF on DNA determinants of affinity in the RE.
(A) Main and epistatic effects of RH replacement on DNA affinity. Bars indicate the mean change in binding energy caused by each amino acid change in the RH, averaged across all TF:RE combinations measured; epistatic effects represent the additional effect of pairs of replacements on average binding energy beyond that predicted by their main effects. Bar width depicts the portion of variation in binding energy attributable to each main or epistatic effect, calculated as the increase in the adjusted R2 of the fit to the experimental binding data when each term is added to a linear regression model. *, significant improvement in model fit (likelihood ratio test p < 0.05 after Bonferroni correction). (B) Intermolecular epistasis. Energy logos indicate the effect of each amino acid replacement on the genetic determinants of binding within the RE. For each amino acid replacement, the size of each letter indicates the change the replacement causes in the main (or epistatic) effects of nucleotide states (or combinations) on relative binding energy.
Figure 5
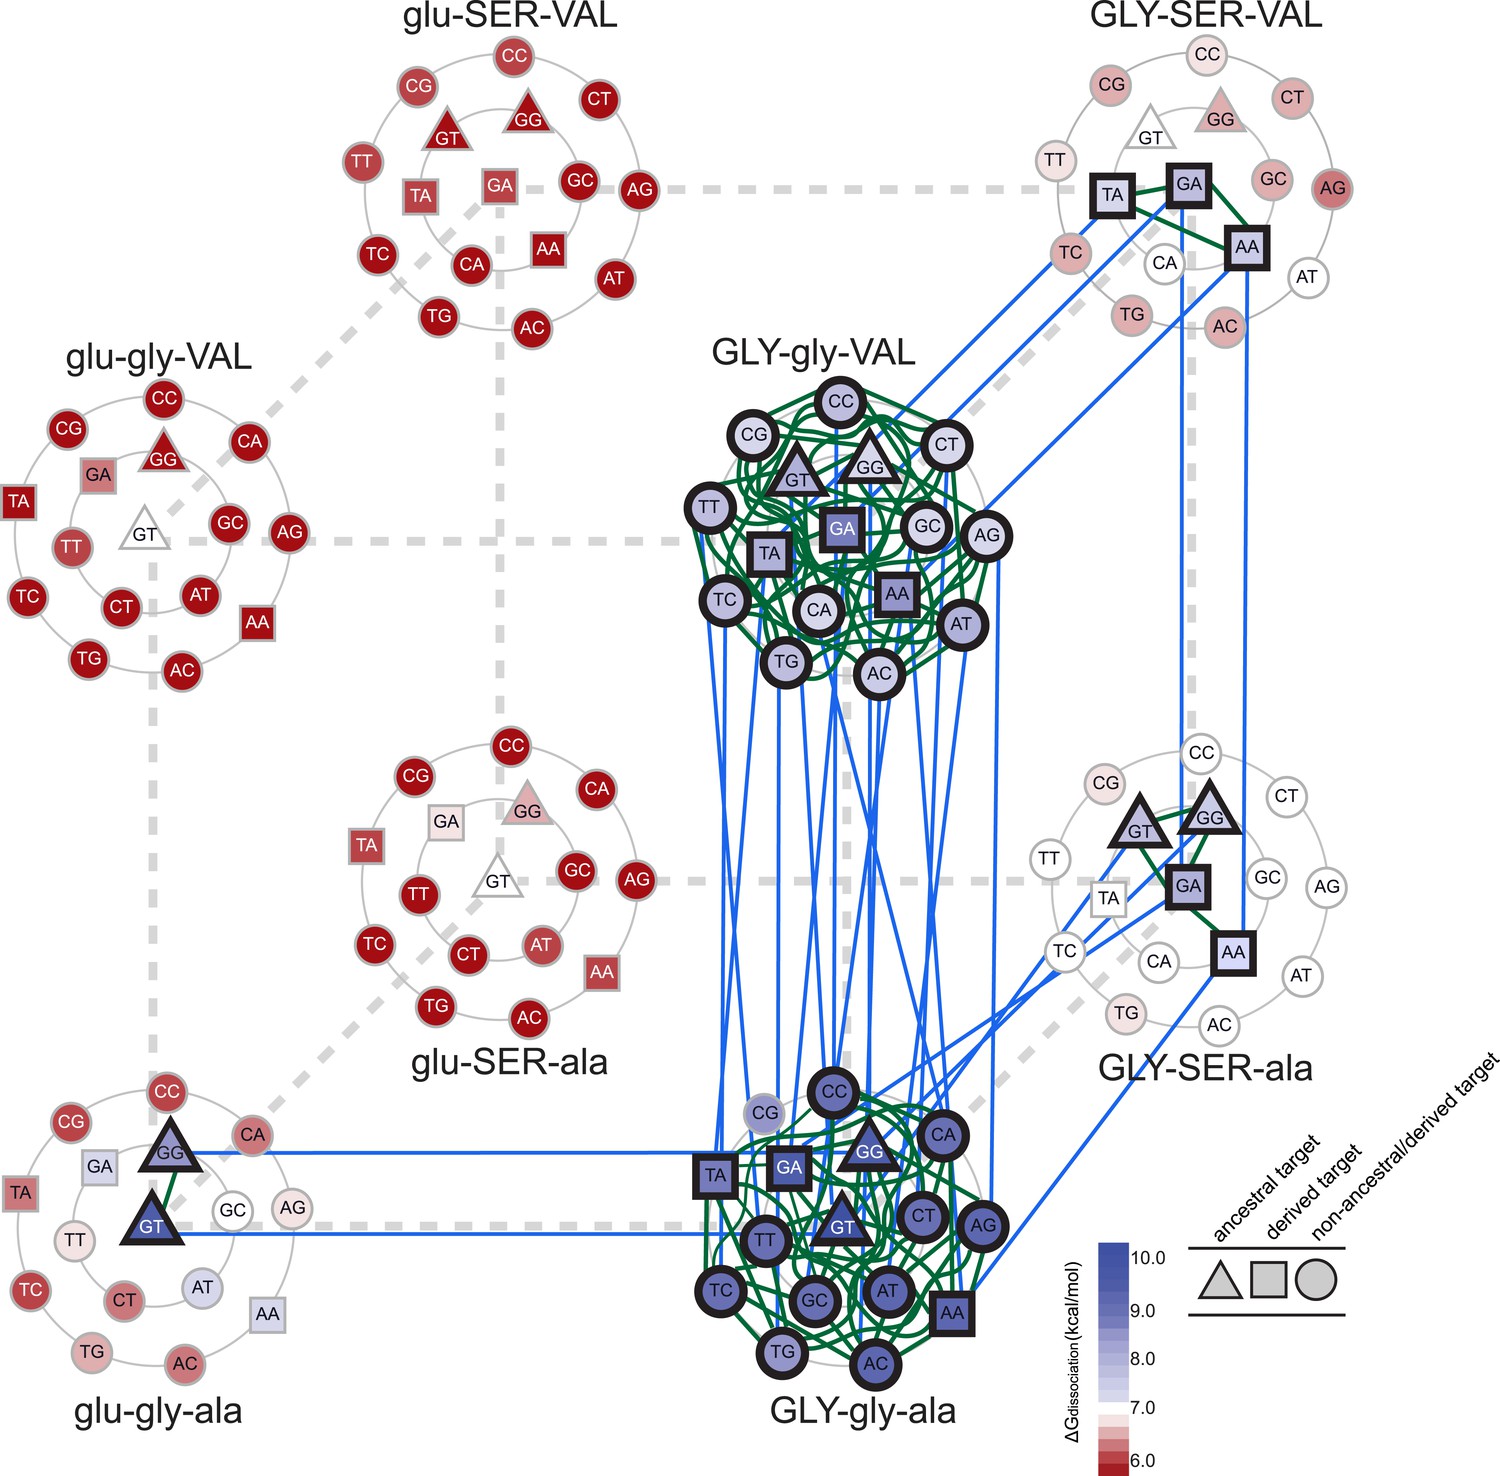
Accessible mutational pathways in the joint TF-RE sequence space.
Each vertex of the cube represents a protein genotype between AncSR1 and AncSR1+RH; amino acid states at variable RH residues are shown; lower and upper case denote ancestral and derived states, respectively. Each protein's affinity for the 16 REs is shown using the color gradient from red to blue (low to high ΔGdissociation). The genotype at the center of each cluster of REs is that protein's highest-affinity target. REs preferred by AncSR1 or AncSR1-RH are shown in triangles or squares, respectively; circles show other REs. TF-RE complexes with high affinity and occupancy (binding energy greater than the average of all TF-RE complexes and affinity within tenfold of that TF's best target) are outlined in bold. Blue lines represent amino acid replacements in the TF that maintain high-affinity/occupancy binding to a RE; green lines represent nucleotide substitutions in the RE that maintain high-affinity/occupancy binding to a TF. Nodes connected by blue or green lines represent the neutral network between the ancestral TF and its RE targets and the derived TF and its distinct targets.
Figure 6 with 2 supplements

Hydrogen bonding and packing efficiency do not explain TF-RE affinity.
(A) The number of hydrogen bonds formed between atoms in the RH and atoms in the RE in molecular dynamic (MD) simulations is not positively correlated with the experimentally measured binding energy of TF-RE complexes. Each data point represents the number of hydrogen bonds formed by one of the 128 TF-RE pairs (8 variants of AncSR1 with 16 variant REs), each averaged over three replicate 50 ns simulations; error bars show SEM. Red line indicates best-fit linear regression model. For p-value and R2, see panel C. (B) The efficiency of packing interactions across the RH-RE interface in MD simulations is not positively correlated with the experimentally measured binding energy of TF-RE complexes. In MD simulations, the number of protein-DNA atom pairs within 4.5 Å of each other was calculated for all 128 TF:RE complexes. Points and error bars show the mean and SEM over three replicate MD simulations. Red line indicates best-fit linear regression model; p-value and R2 are shown in C. (C) Correlation of hydrogen bonding and packing efficiency with binding energy for individual protein genotypes. For each TF, the experimentally measured binding energy for each of the 8 REs was regressed against either the number of hydrogen bonds formed from RH to RE or the efficiency of packing between RH and RE. The presence of positive (blue), negative (red), or non-significant (NS) correlations is indicated, along with the p-value of the correlation and the fraction of variation in binding energy explained by each dependent variable (R2). For full data sets and regressions, see Supplementary file 1.
Figure 6—figure supplement 1
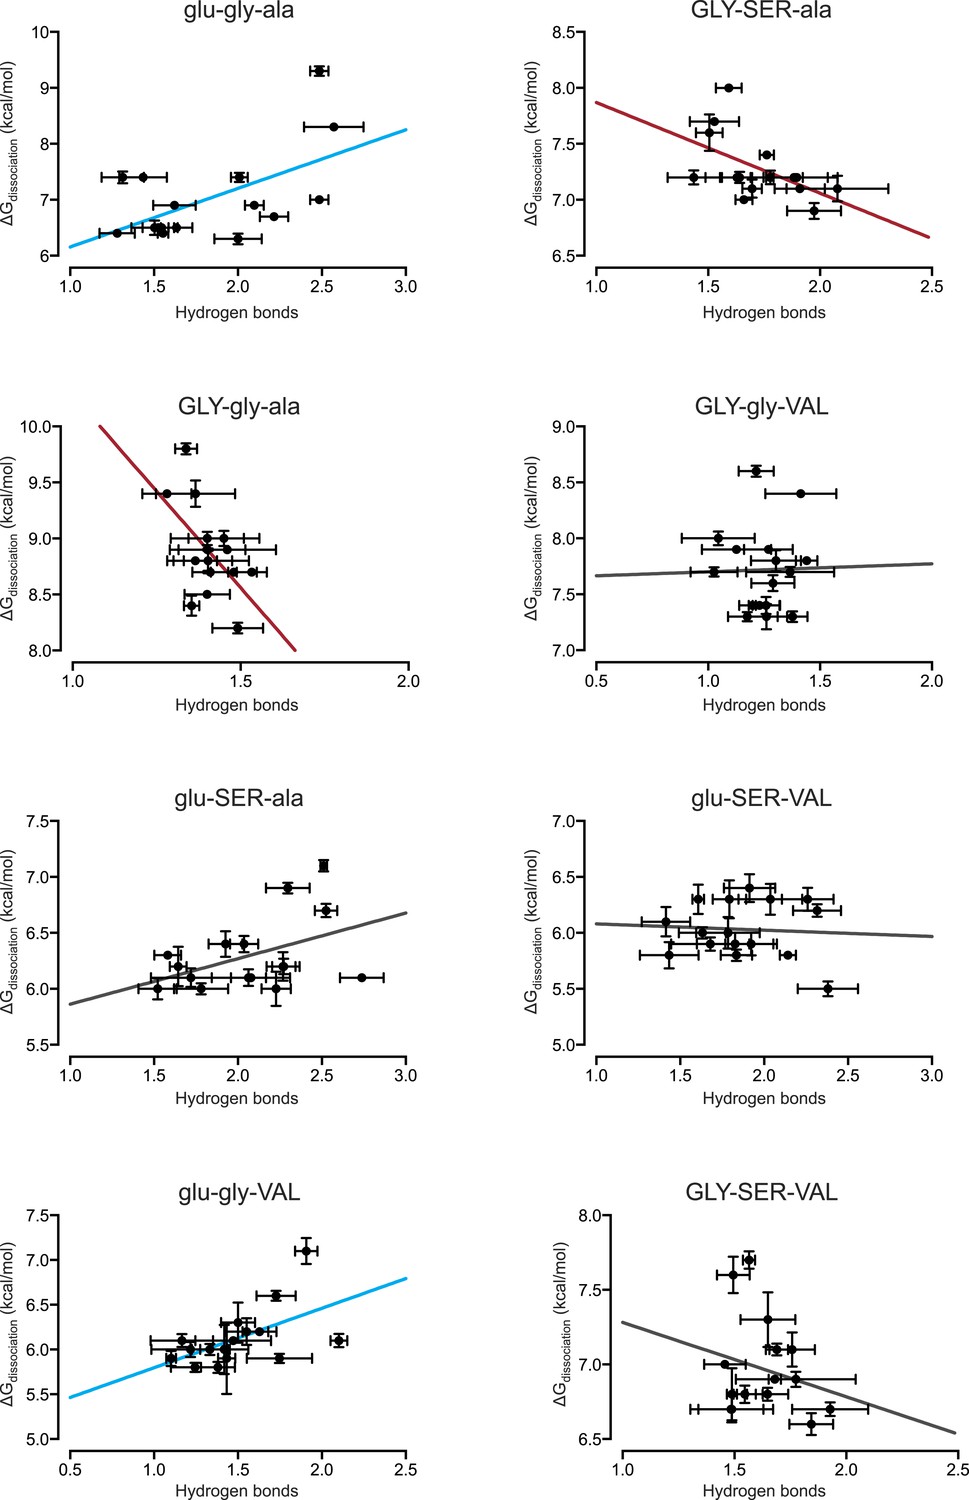
Direct hydrogen bonding at the protein-DNA interface positively correlates with binding affinity for only 2 out of 8 protein genotypes.
From MD simulations, the number of direct hydrogen bonds formed at the protein-DNA interface was calculated for each protein genotype across all 16 REs. The best-fit linear regression was determined for each data set. Blue and red lines show significant positive and negative correlations, respectively (p < 0.05). For best-fit linear regression terms, see Figure 6C.
Figure 6—figure supplement 2
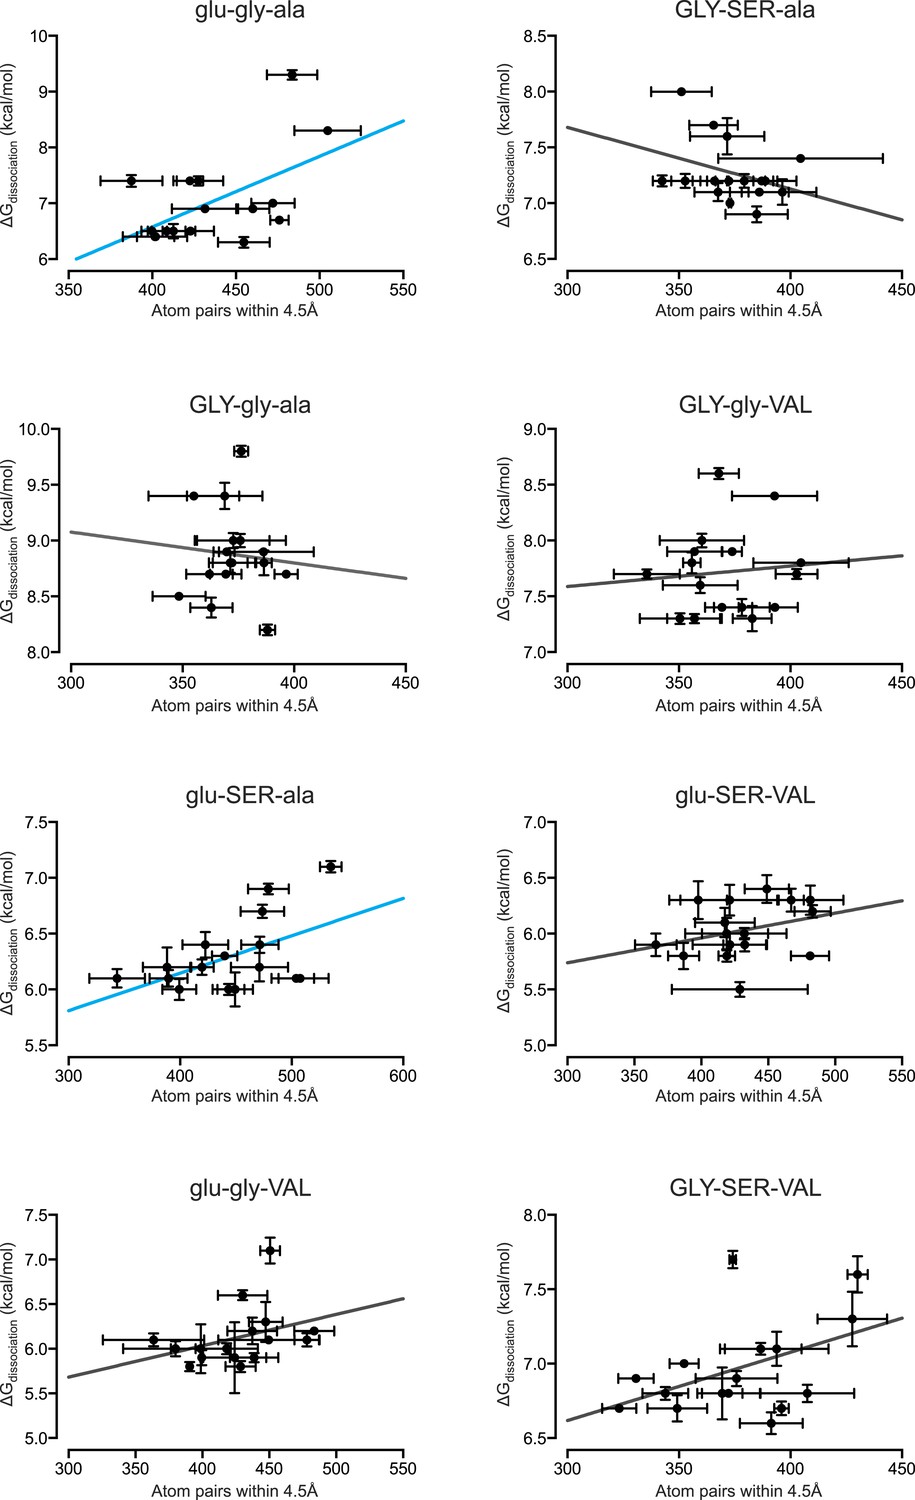
Packing efficiency at the protein-DNA interface positively correlates with binding affinity for only 2 out of 8 protein genotypes.
From MD simulations, the number of protein-DNA atom pairs within 4.5 Å of one another was calculated for each protein genotype across all 16 REs. The best-fit linear regression was determined for each data set. Of the 8 genotypes, 2 showed a positive correlation while the remaining 5 genotypes showed no significant correlation (p < 0.05). For linear regression terms, see Figure 6C.
Additional files
-
Supplementary file 1
First-order and epistatic genetic determinants of binding affinity. First-order effects indicate the difference in binding energy relative to the mean across all data, while the second-order effects are the marginal addition to the additive sum of the first-order effects. Third-order effects are the marginal addition to the additive sum of all lower-order effects. (A) The energetic effects of binding for all first-order and epistatic terms in the RE as determined by linear modeling for each protein genotype. (B) The energetic effects for amino acid replacements averaged across all 16 REs. (C) The energetic effects from a global model, including all possible first-, second-, and third-order effects within and between the protein and DNA.
- https://doi.org/10.7554/eLife.07864.011
-
Supplementary file 2
abc/WYK- encoding of sequence characters for linear modeling of genetic effects. (A) One-dimensional vectors for ancestral versus derived state at variable amino acid positions 25, 26, and 29 in the protein are shown. (B) Three-dimensional vectors for A, C, G, or T at variable positions 3 and 4 in the RE are shown. The encoding methods shown in panels A and B ensure that the origin in each vector space will be associated with the mean value of the independent variable (in this case, the delta-G of dissociation) across all the data. (C) Terms used in the linear model using abc/WYK coding. Each row shows the expression for the effect on the independent variable of a nucleotide state, amino acid replacement, or interaction among them. Each genetic effect is calculated using the expression shown and the optimized values of the linear coefficients as described in ‘Materials and methods’.
- https://doi.org/10.7554/eLife.07864.012
Download links
A two-part list of links to download the article, or parts of the article, in various formats.
Downloads (link to download the article as PDF)
Open citations (links to open the citations from this article in various online reference manager services)
Cite this article (links to download the citations from this article in formats compatible with various reference manager tools)
Intermolecular epistasis shaped the function and evolution of an ancient transcription factor and its DNA binding sites
eLife 4:e07864.
https://doi.org/10.7554/eLife.07864


