Distinct roles of NMDA receptors at different stages of granule cell development in the adult brain
- Huazhong University of Science and Technology, China
- Collaborative Innovation Center for Brain Science, China
- Salk Institute for Biological Studies, United States
- University of Lausanne, Switzerland
- Tsinghua University, China
Figures
Figure 1 with 1 supplement

NR1 KO cells display decreased spine growth but enhanced spine maturation and AMPAR activity at 4 weeks of age.
(A) Co-injection of rv CAG-mcherry (red) and CAG-GFP-ires-cre (green) for the simultaneous labeling of wild-type (WT) and NR1 KO newborn granule cells (GCs). (B) Left: mCherry+ newborn GCs respond to perforant path stimulation in the absence (upper panel) and presence (lower panel) of the AMPAR antagonist DNQX. Right: GFP+ Cre-expressing newborn GCs respond to perforant path stimulation in the absence (upper panel) but not in the presence (lower panel) of DNQX. (C, D) Representative images of WT (C) and NR1 KO (D) newborn GCs at 4 weeks of age. (E) Representative images of dendritic processes of newborn WT (GFP) and NR1 KO (cre) GCs in the outer molecular layer. (F) Total spine density is decreased in NR1 KO newborn GCs. (G) Comparison of the percentage of each spine type relative to total spine numbers in adult-born WT and NR1 KO GCs. (H) Mushroom spine density is increased in NR1 KO newborn GCs. (I) Cumulative plot of spine size in NR1 WT and KO GCs. (J) Representative traces of AMPAR-mediated miniature excitatory postsynaptic currents (mEPSCs) in mCherry+ WT and GFP+ NR1 KO newborn GCs. (K, L) Quantitative analysis of mEPSCs by amplitude (K) and frequency (L).
Figure 1—figure supplement 1
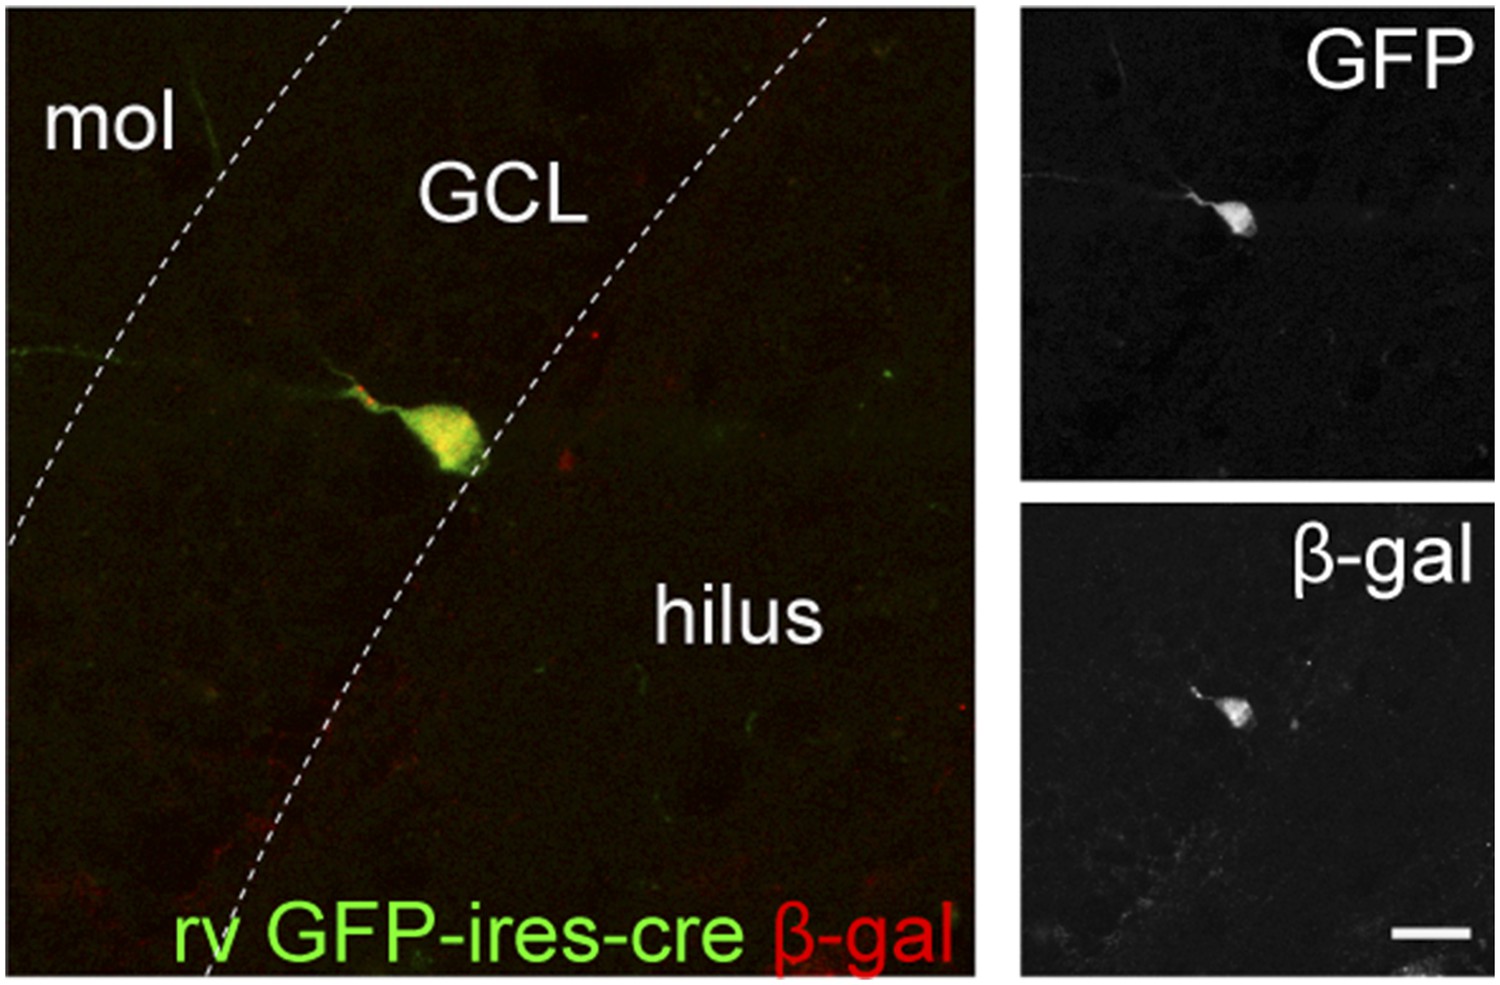
Retrovirus rv CAG GFP-ires-cre was delivered to the dentate gyrus (DG) of ROSA-lacZ mice and the recombination efficiency was examined by the expression of β-gal (red) in Cre-expressing cells (GFP+, green).
Insets on the right side represent GFP− and β-gal-expressing cells, respectively. Scale bar: 50 µm.
Figure 2
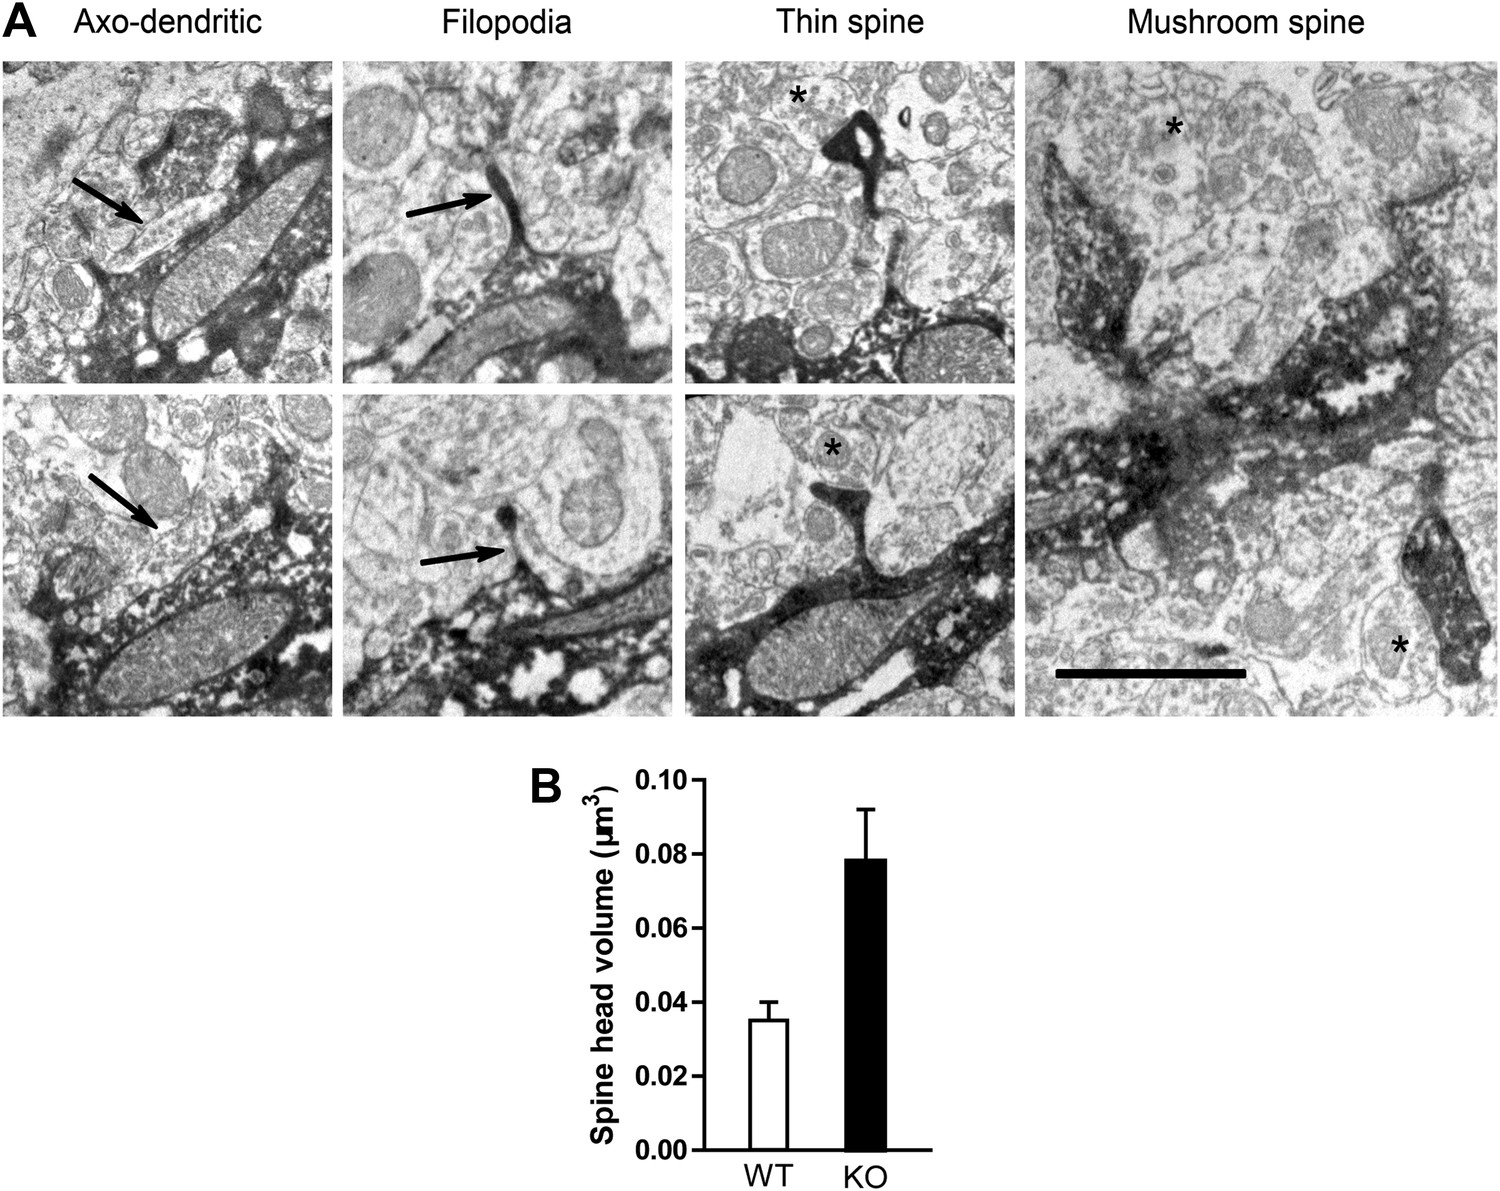
Electron microscopic description of dendritic spines.
(A) Electron micrograph illustrating dendrites of newborn NR1 KO neurons. Panels show examples of symmetric axo-dendritic synapses (left panels, arrows), filopodia (middle left panels), thin spines (middle right panels) and mushroom spines (right panel). Darkly immunolabeled GFP+ dendritic spines are each contacted by GFP− axon terminals (asterisks) containing numerous presynaptic vesicles. Scale bars: 1 μm. (B) Comparison of total spine volumes in NR1 KO and WT cells.
Figure 3 with 1 supplement

NR1 KO cells rescued by expression of the pro-survival gene Bcl2 had an unusually low spine density.
(A) Bcl2 expression was able to rescue newborn GCs from naturally occurring cell death in C57Bl/6 mice. (B) Bcl2 expression was able to rescue NR1 KO newborn GCs from cell death. (C) For morphological analysis of GFPBcl2-ires-cre-targeted cells, rv GFPBcl2-ires-cre was co-injected with rv GFP. Bcl2-ires-cre-targeted cells were identified by immunohistochemistry using an antibody against the cre recombinase. The arrow and asterisk show GCs transfected by both rv GFPBcl2-ires-cre and rv GFP. Insets on the right side represent GFP− (green) and Cre-expressing (red) GCs, respectively. (D–G) Analysis of dendritic growth of newborn GCs at 28 dpi. Bcl2-rescued newborn GCs had a decreased total dendritic length in both C57Bl/6 and Grin1f/f mice (D, F), whereas branching points were not changed (E, G). (H) Representative images of dendritic processes in the outer molecular layer of newborn GCs at 28 dpi in C57Bl/6 mice labeled by rv GFP, GFP-ires-cre and GFPBcl2-ires-cre. (I, J) Total spine density was similar in GFP and GFP-ires-cre targeted newborn GCs but significantly decreased in GFPBcl2-ires-cre targeted newborn GCs. (K) The density of mushroom spines did not change significantly in newborn GCs targeted by the three retroviruses. (L) Comparison of the percentage of each spine type relative to total spine numbers in new GCs of C57Bl/6 mice infected by the three retroviruses. (M) Representative images of dendritic processes in the outer molecular layer of newborn GCs at 28 dpi in Grin1f/f mice labeled by rv GFP, GFP-ires-cre and GFPBcl2-ires-cre. (N, O) Total spine density was significantly lower in surviving NR1 KO cells (Cre) and further decreased in Bcl2-rescued cells. (P) Mushroom spine density was increased in NR1 KO cells (Cre) but not in Bcl2-rescued cells. (Q) Comparison of the percentage of each spine type relative to total spine numbers in new GCs of Grin1f/f mice infected by the three retroviruses. Scale bars: 20 µm (C) and 2 µm (H, M).
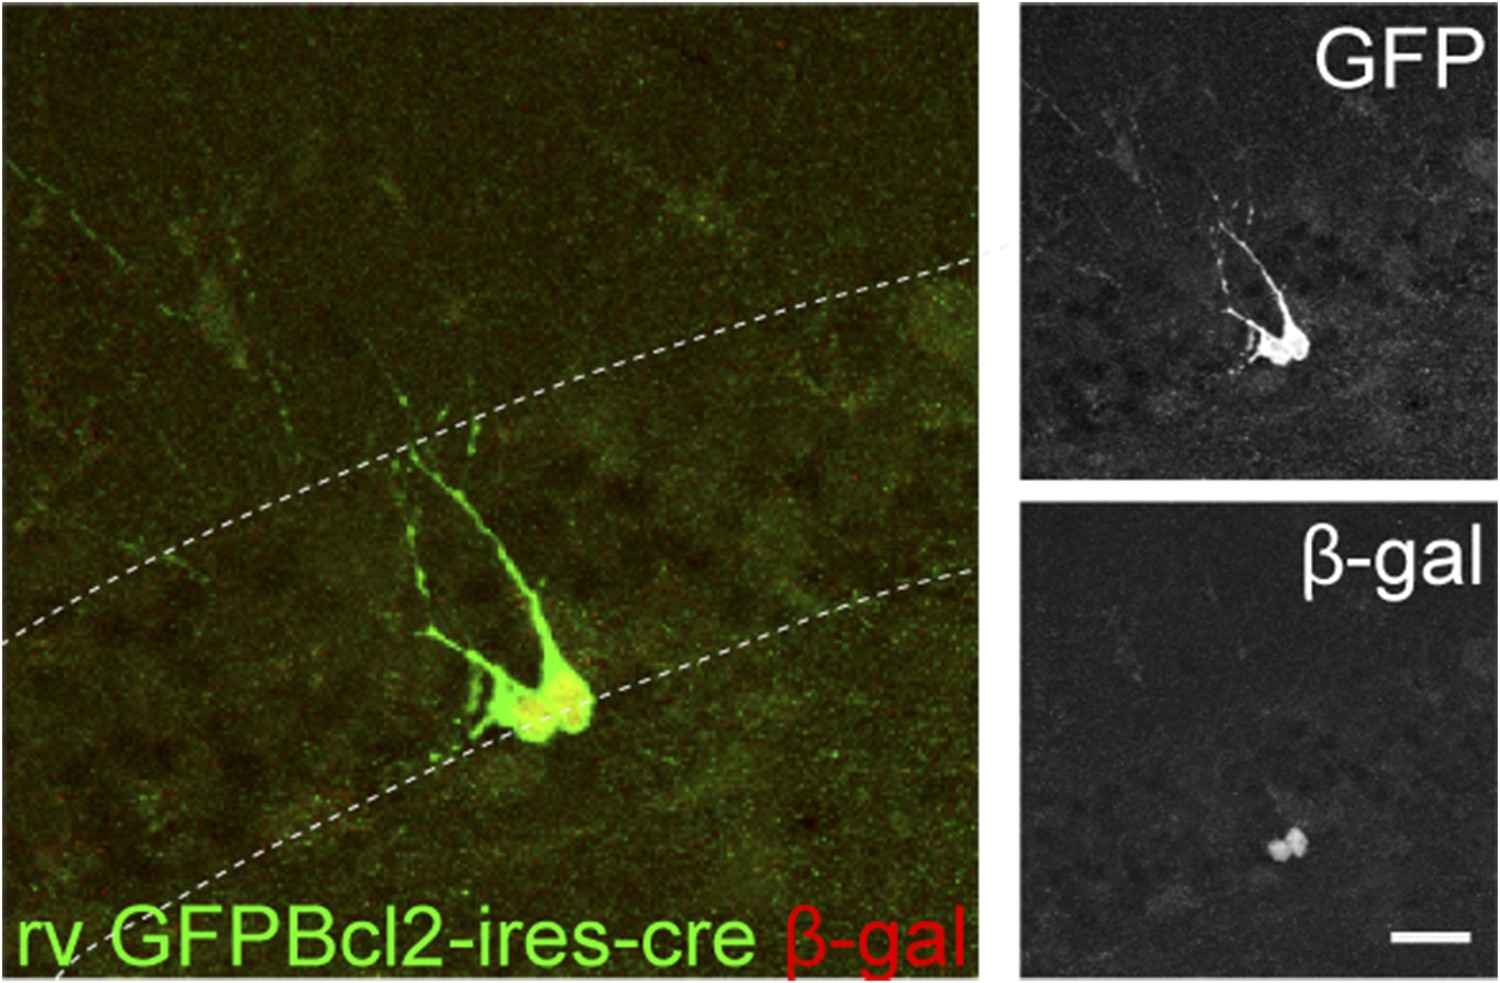
Figure 3—figure supplement 1
GCs infected by rv GFP Bcl2-ires-cre in ROSA-lacZ reporter mice.
Green—GFP, red—β-gal. Insets on the right side represent GFP− and β-gal-expressing cells, respectively. Scale bar: 50 µm.
Figure 4 with 1 supplement
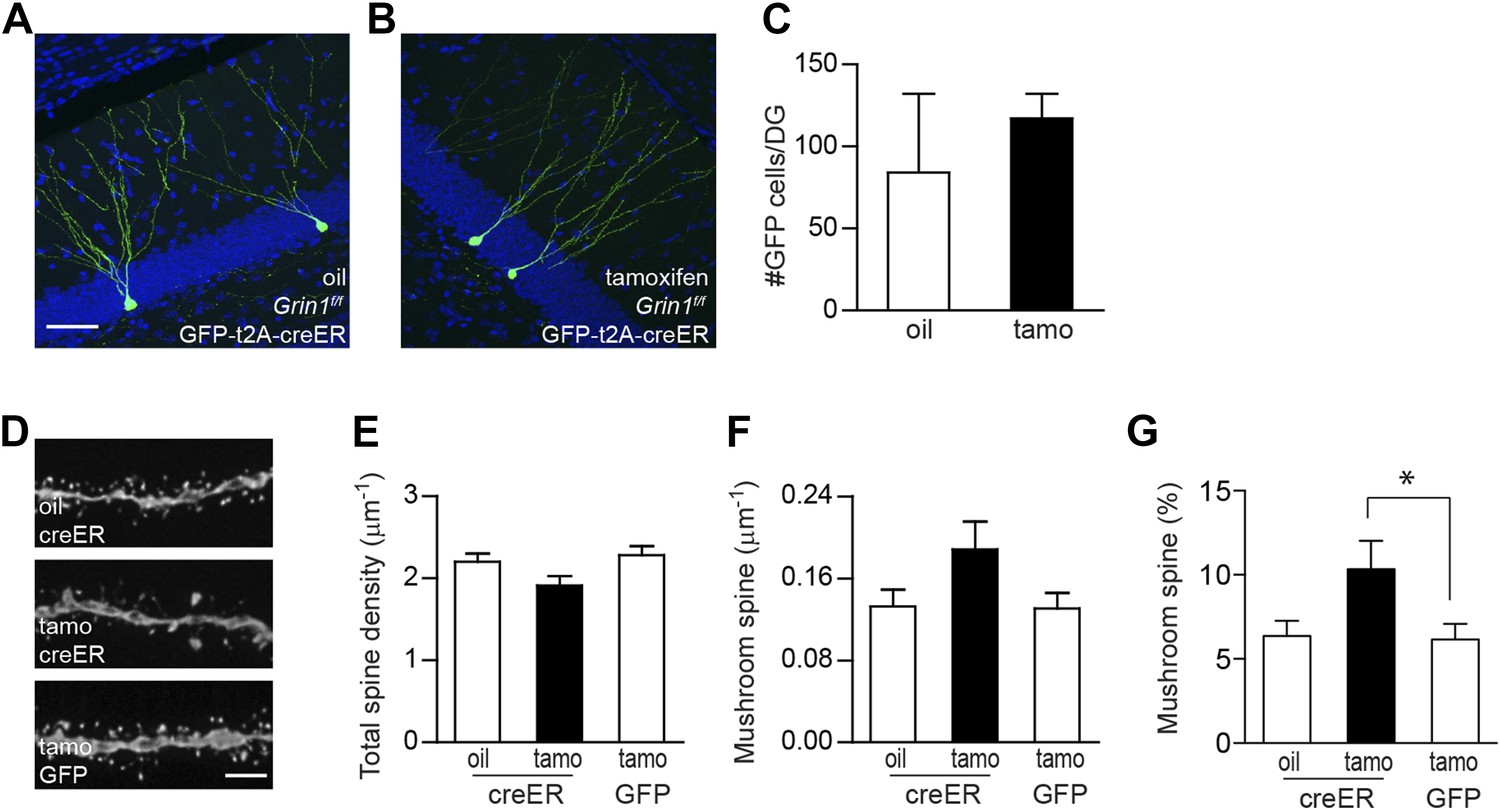
Using inducible cre to bypass the critical NMDAR-dependent cell survival.
(A, B) Representative images of newborn GCs in Grin1f/f mice that were infused with rv CAG GFP-t2A-creER and treated with oil (A) or tamoxifen (B). (C) Deletion of the Grin1 gene initiated in 4-week-old newborn GCs did not affect cell survival. (D) Representative images of dendritic processes in the outer molecular layer of rv GFP-t2A-creER-targeted newborn GCs treated with oil and tamoxifen, and of rv GFP-targeted newborn GCs treated with tamoxifen. (E–G) Quantification of total spine density (E), mushroom spine density (F) and mushroom spine percentage (G) in rv GFP-t2A-creER- and rv GFP-targeted newborn GCs (*p < 0.05). Scale bars: 50 µm (A, B) and 5 µm (D).
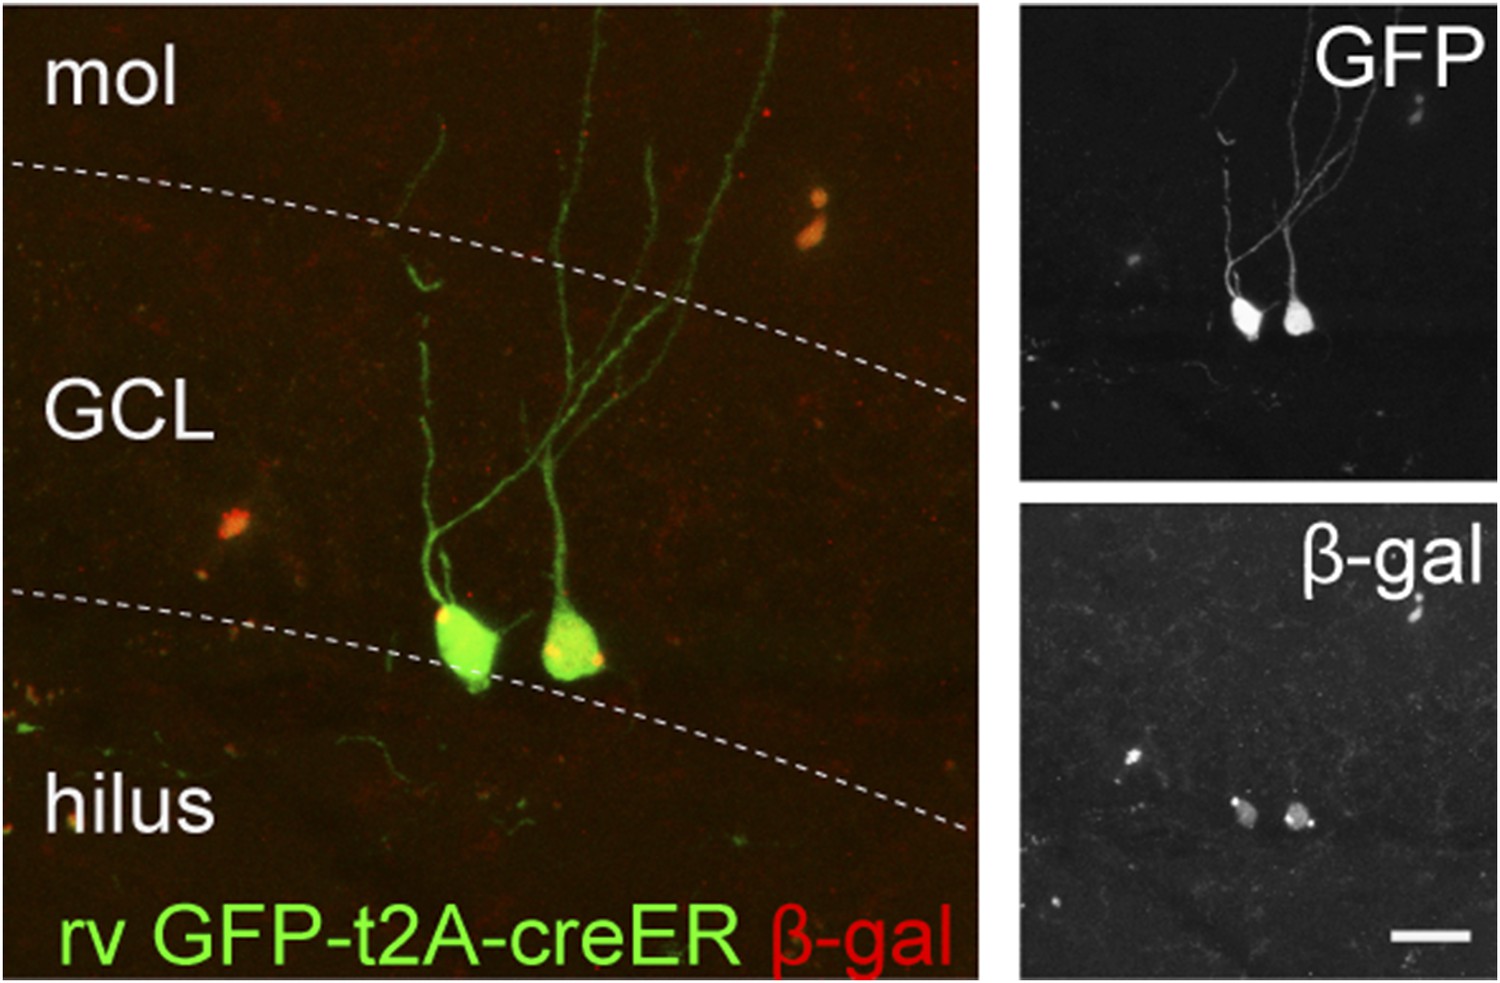
Figure 4—figure supplement 1
The recombination efficiency of rv CAG GFP-t2A-creER was tested in the ROSA-lacZ mice.
ROSA-lacZ reporter mice received stereotaxic delivery of retrovirus into the DG and subsequently tamoxifen daily for 5 days starting at 2 weeks after virus injection. Reporter gene expression was analyzed at 2 weeks after the first dose of tamoxifen. Insets on the right side represent GFP− and β-gal-expressing cells, respectively. Scale bar: 50 µm.
Figure 5 with 1 supplement
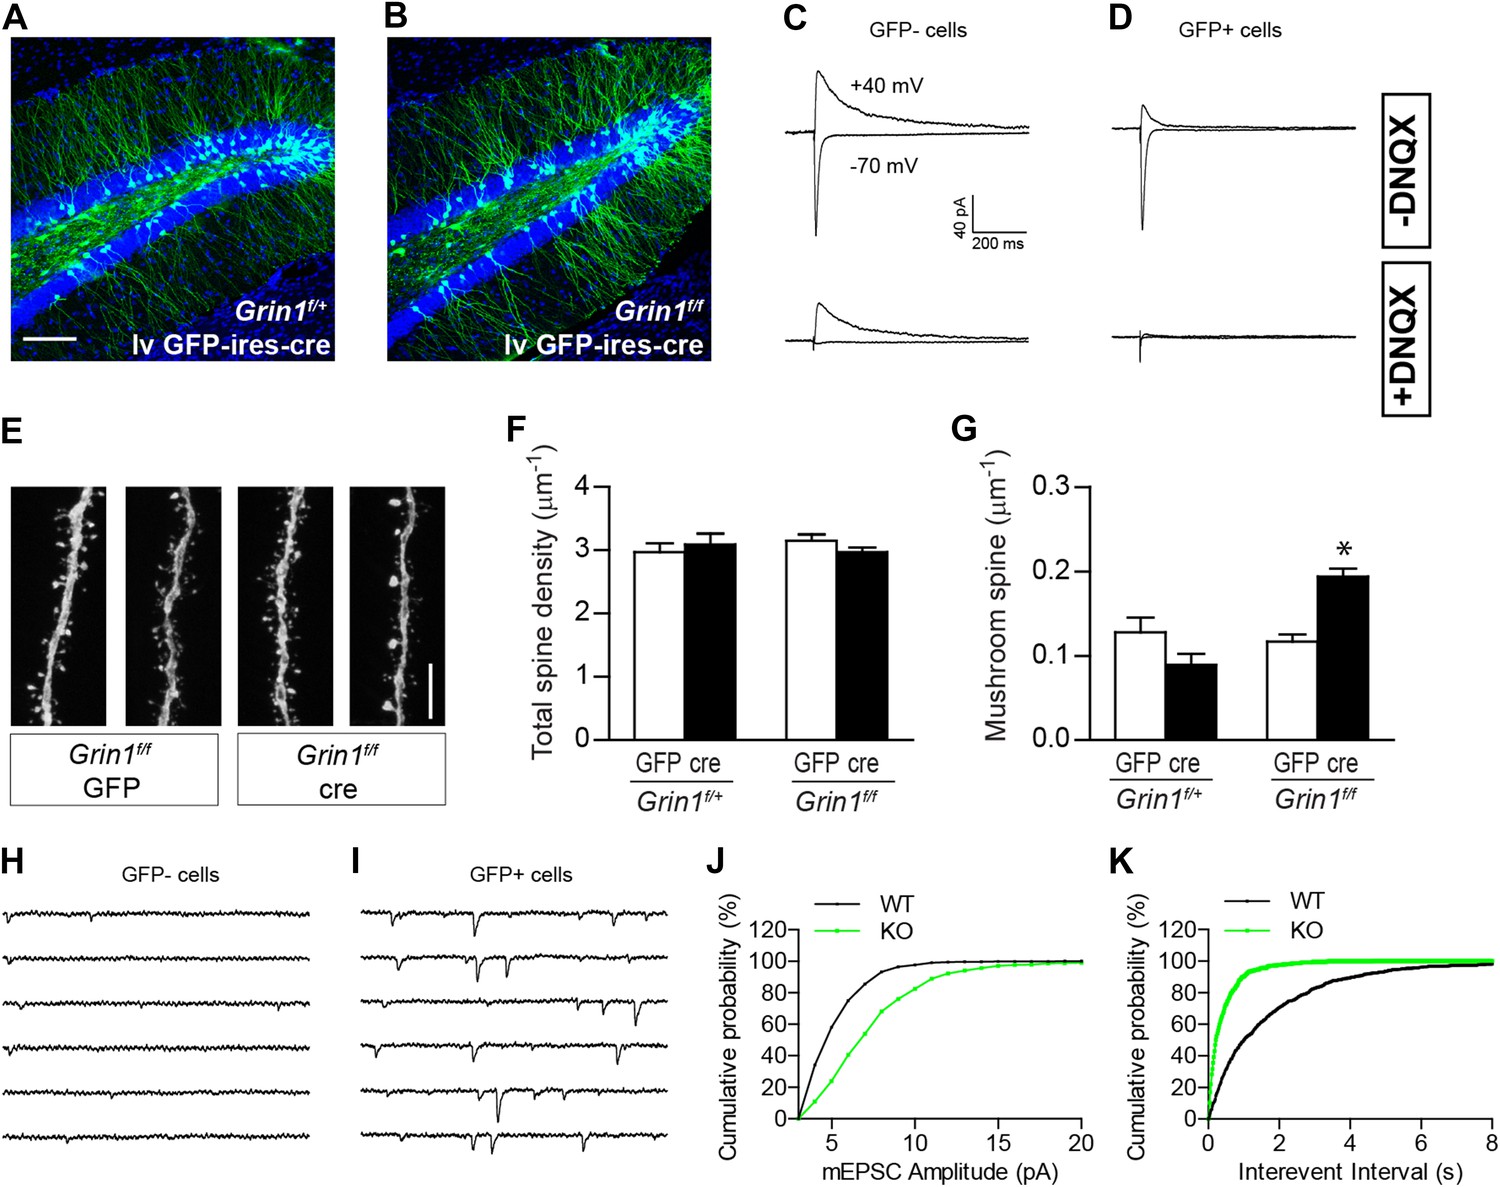
The effect of NR1 KO in mature GCs.
(A, B) Representative images of mature GCs in Grin1f/+ (A) and Grin1f/f (B) mice targeted by lv CAG-GFP-ires-cre. (C, D) Electrophysiological recordings of mature GCs in lv CAG-GFP-ires-cre-targeted mice. GFP− and GFP+ cells represent NR1 WT and KO GCs, respectively. (E) Representative images of dendritic processes in the outer molecular layer of GFP+ cells targeted by lv CAG-GFP and GFP-ires-cre. (F) NR1 KO mature GCs display similar total spine density as wild type GCs. (G) Mushroom spine density was increased in NR1 KO mature GCs (*p < 0.0001). (H, I) Sample traces of AMPAR-mediated mEPSCs in GFP− and GFP+ mature GCs in Grin1f/f mice targeted by lv CAG GFP-ires-cre. (J, K) Cumulative plots of mEPSC amplitude (J) and frequency (K) confirmed that AMPAR-mediated activity was enhanced in NR1 KO mature GCs. Scale bars: 100 µm (A, B) and 5 µm (E).
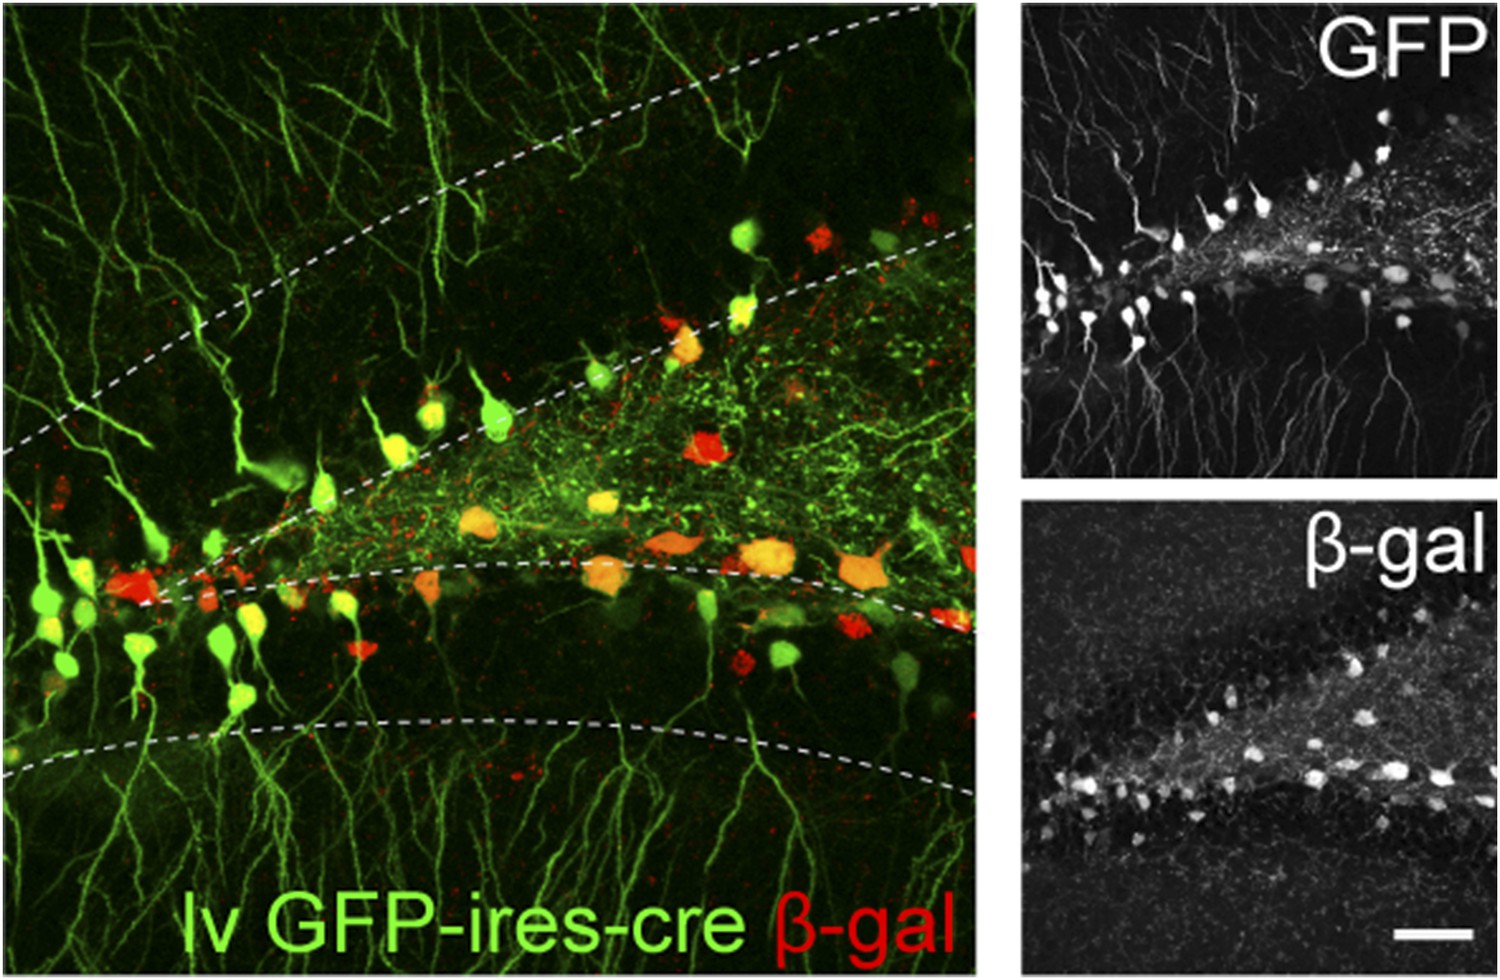
Figure 5—figure supplement 1
The recombination efficiency of lv CAG GFP-ires-cre was tested in ROSA-lacZ reporter mice 4 weeks after virus delivery.
Insets on the right side represent GFP− and β-gal-expressing cells, respectively. Scale bar: 100 µm.
Figure 6
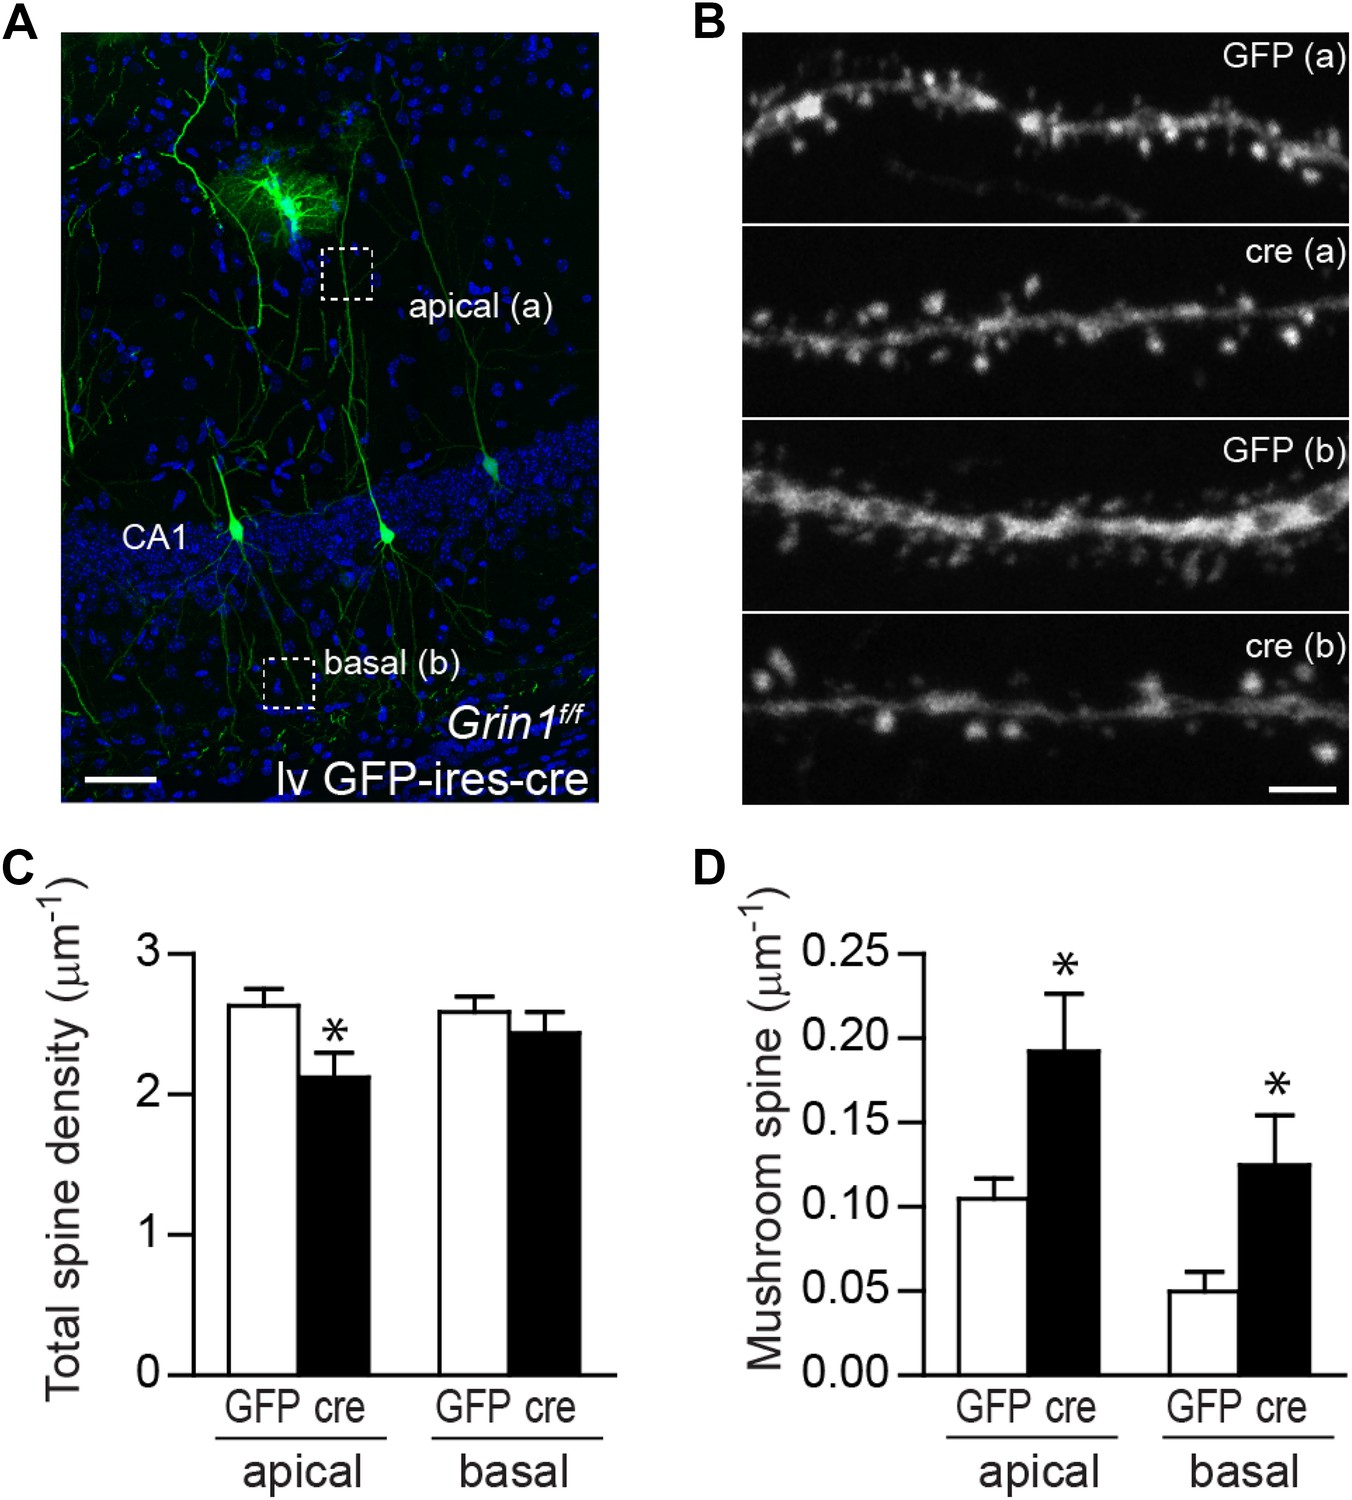
Mushroom spine density was increased in CA1 pyramidal cells in response to NR1 deletion in adult mice.
(A) Representative image of CA1 pyramidal cells labeled by lv GFP-ires-cre. Dotted boxes indicate typical apical and basal dendrite segments for spine analysis. (B) Representative images of apical (A) and basal (B) dendrites in wild type and NR1 KO CA1 pyramidal cells. (C) Total spine density was decreased in the apical but not basal dendrites in CA1 pyramidal cells in response to NR1 deletion (*p < 0.05). (D) Mushroom spine density was increased in both apical and basal dendrites in NR1 KO pyramidal cells (*p < 0.01). Scale bars: 50 µm (A) and 2 µm (B).
Tables
Table 1
Total number of spines evaluated in Figure 1G
| Spine classes | WT | KO |
|---|---|---|
| Stubby | 742 | 391 |
| Mushroom | 44 | 97 |
| Thin | 3884 | 1643 |
| Filopodia | 202 | 121 |
Table 2
Total number of spines evaluated in Figure 3L
| Spine classes | GFP | cre | Bcl2 |
|---|---|---|---|
| Stubby | 306 | 164 | 248 |
| Mushroom | 23 | 12 | 24 |
| Thin | 2545 | 1635 | 1835 |
| Filopodia | 65 | 59 | 104 |
Table 3
Total number of spines evaluated in Figure 3Q
| Spine classes | GFP | cre | Bcl2 |
|---|---|---|---|
| Stubby | 572 | 208 | 222 |
| Mushroom | 101 | 108 | 60 |
| Thin | 6901 | 1984 | 2342 |
| Filopodia | 160 | 78 | 164 |
Download links
A two-part list of links to download the article, or parts of the article, in various formats.
Downloads (link to download the article as PDF)
Open citations (links to open the citations from this article in various online reference manager services)
Cite this article (links to download the citations from this article in formats compatible with various reference manager tools)
Distinct roles of NMDA receptors at different stages of granule cell development in the adult brain
eLife 4:e07871.
https://doi.org/10.7554/eLife.07871


