T-box3 is a ciliary protein and regulates stability of the Gli3 transcription factor to control digit number
- University of Utah, United States
- Geisinger Clinic, United States
Figures
Figure 1 with 2 supplements
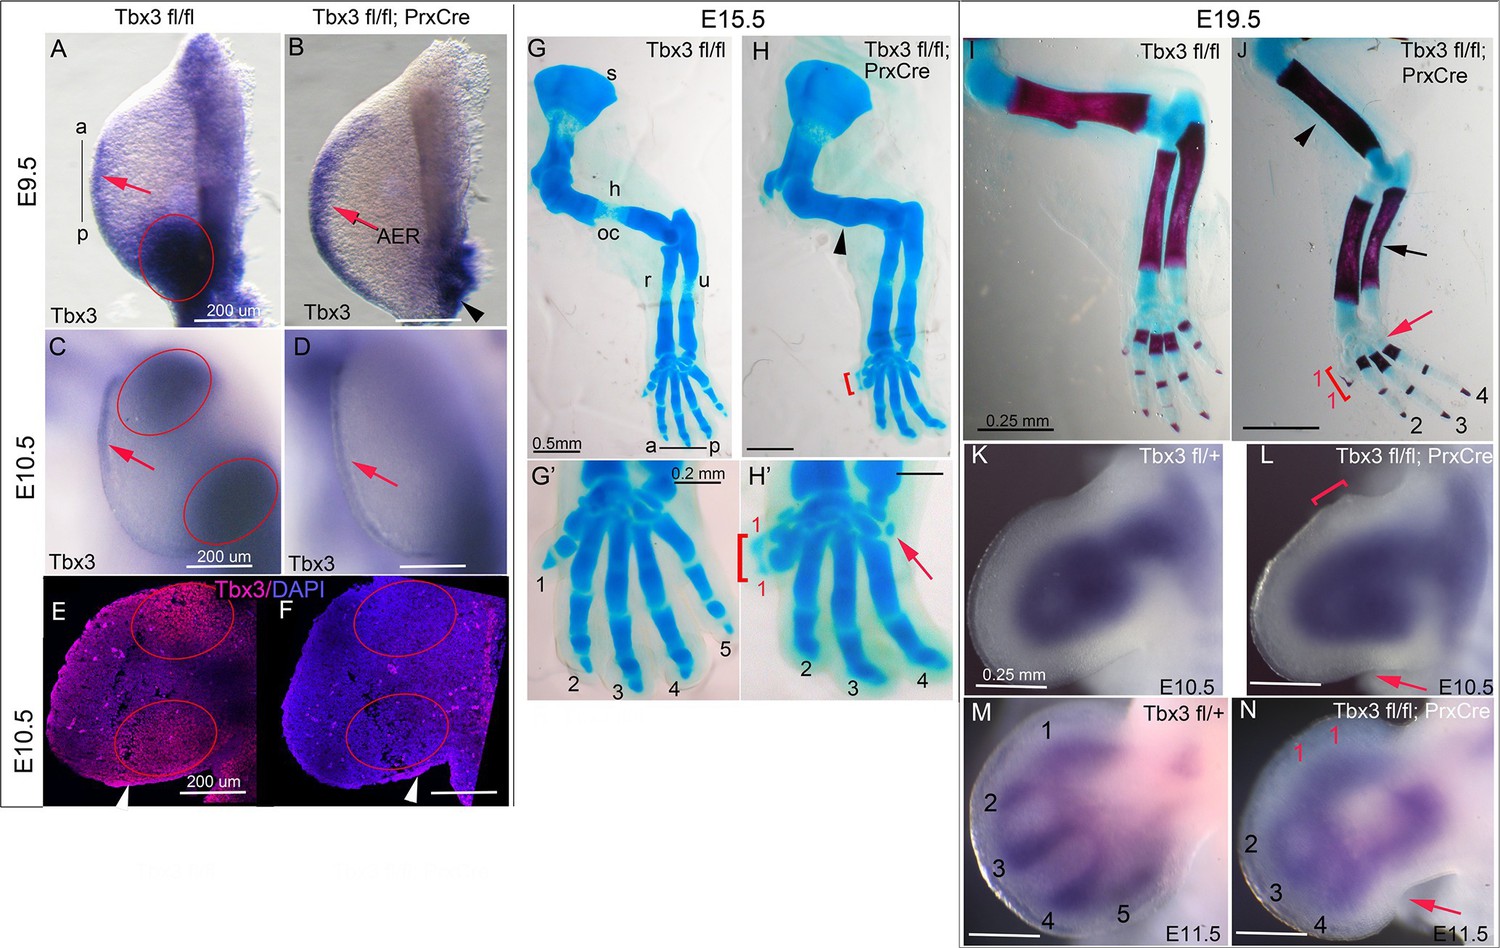
Tbx3 regulates anterior and posterior digit development.
(A) Tbx3 expression assayed by mRNA in situ hybridization in E9.5 forelimb bud (black line from a-p shows anterior-posterior axis). Red arrow points to Tbx3 expression in apical ectodermal ridge (AER). Red ellipse encloses posterior mesenchymal expression domain. (B) Tbx3 transcripts are absent in the limb bud mesenchyme of E9.5 Tbx3fl/fl;PrxCre mutants. Tbx3 expression persists in the AER (red arrow) and adjacent posterior-lateral body wall (black arrowhead). (C, D) As in A and B except limb buds are E10.5. Red ellipses enclose anterior and posterior mesenchymal expression domains which are Tbx3 negative in the mutants. Red arrows highlight expression in AER. (E, F) Tbx3 immunohistochemistry on sectioned E10.5 limb. Tbx3 protein is lost in mesenchyme of Tbx3fl/fl;PrxCre mutants (F, red ellipses) but AER staining persists as expected (white arrowhead). Please see also Figure 1—figure supplement 1. (G–J) Skeleton preparations reveal preaxial polysyndactyly (duplicated/fused digit 1,red bracket, H, H’, J) and postaxial oligodactyly (absent digit 5, red arrows in H’ and J) in Tbx3fl/fl;PrxCre mutants at E15.5 (H, H’) and E19.5 (J). Note delayed ossification of the humerus (H, black arrowhead), loss of deltoid tuberosity (J, black arrowhead) and short, bowed ulna (J, black arrow) in mutant. s, scapula; h, humerus; oc, ossification center; dt, deltoid tuberosity r, radius; u, ulna; digits numbered 1–5 (K–N) Sox9 mRNA expression shows evolving skeletal defects are already evident in Tbx3fl/fl;PrxCre mutants at E10.5- E11.5. Digit condensations are numbered. Bracket in L shows broadening of digit 1 forming region; red arrows highlight indentation in digit 5 forming region (L, N) and absence of Sox9 digit 5 condensation (N).
Figure 1—figure supplement 1
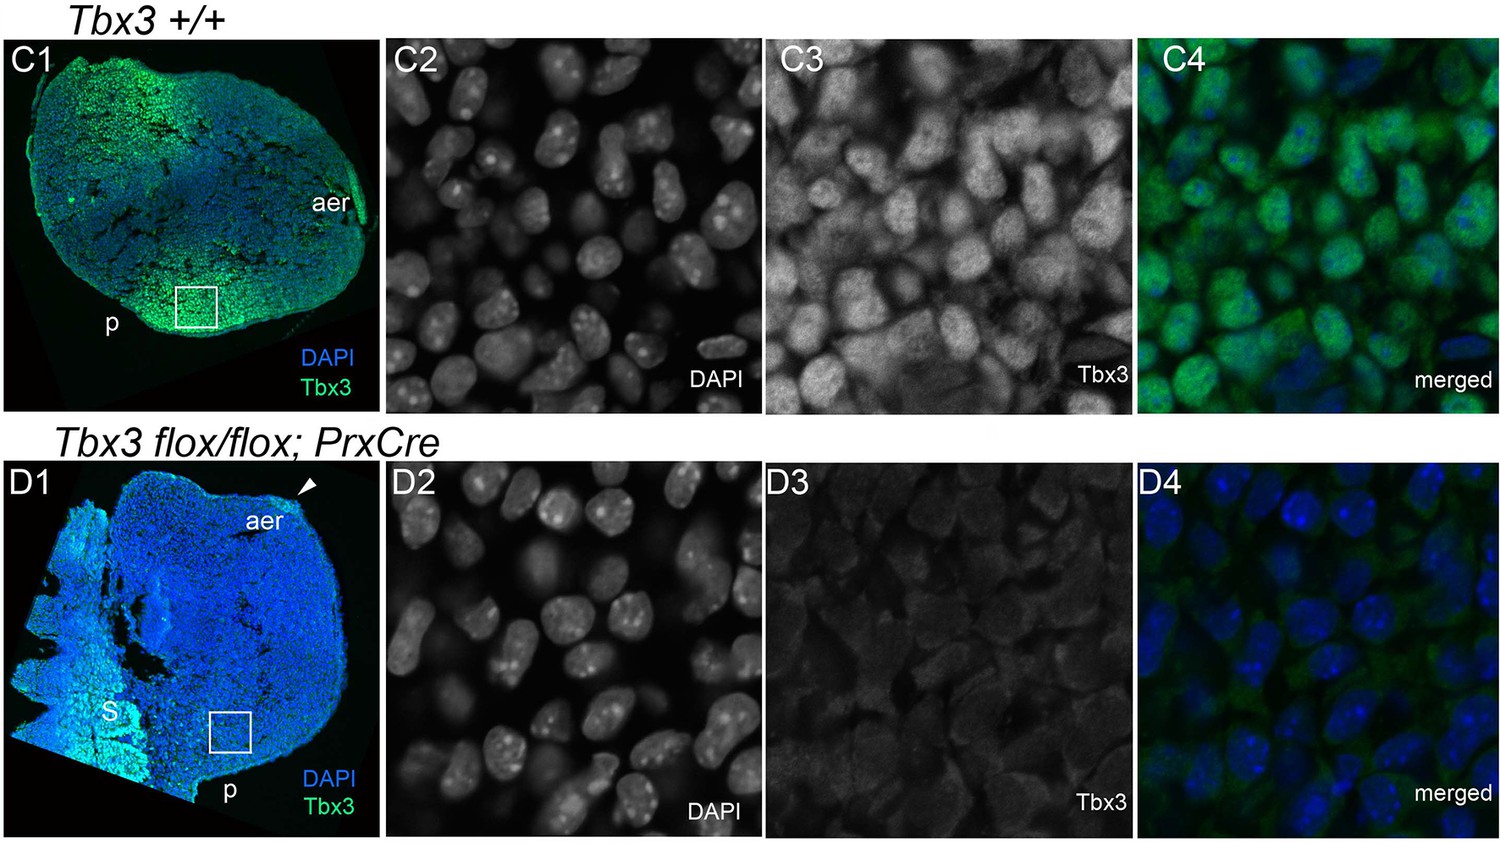
Ablation of Tbx3 with PrxCre eliminates anterior and posterior mesenchymal protein production.
From Frank et al., PLoSOne 2013, with permission. Confocal micrographs of sectioned E10.0 forelimb buds after fluorescent immunohistochemical detection of Tbx3 using custom antibody to its C-terminus. (C1–C4) Tbx3+/+ limb bud. C1) Merged color view of DAPI and FITC channels at 10X magnification. (C2–C4) 60X magnification of white boxed region in C1. (C2) DAPI channel showing DNA immunoreactivity. (C3) FITC channel showing Tbx3 immunoreactivity. (C4) Merged view. (D1–C4) Tbx3fl/fl;PrxCre limb bud. (D1) Merged color view of DAPI and FITC channels at low magnification. (D2–C4) 60X magnification of white boxed region in D1. (D2) DAPI channel showing DNA immunoreactivity. (D3) FITC channel showing lack of Tbx3 immunoreactivity in nucleus and cytoplasm. (D4) Merged view.
Figure 1—figure supplement 2
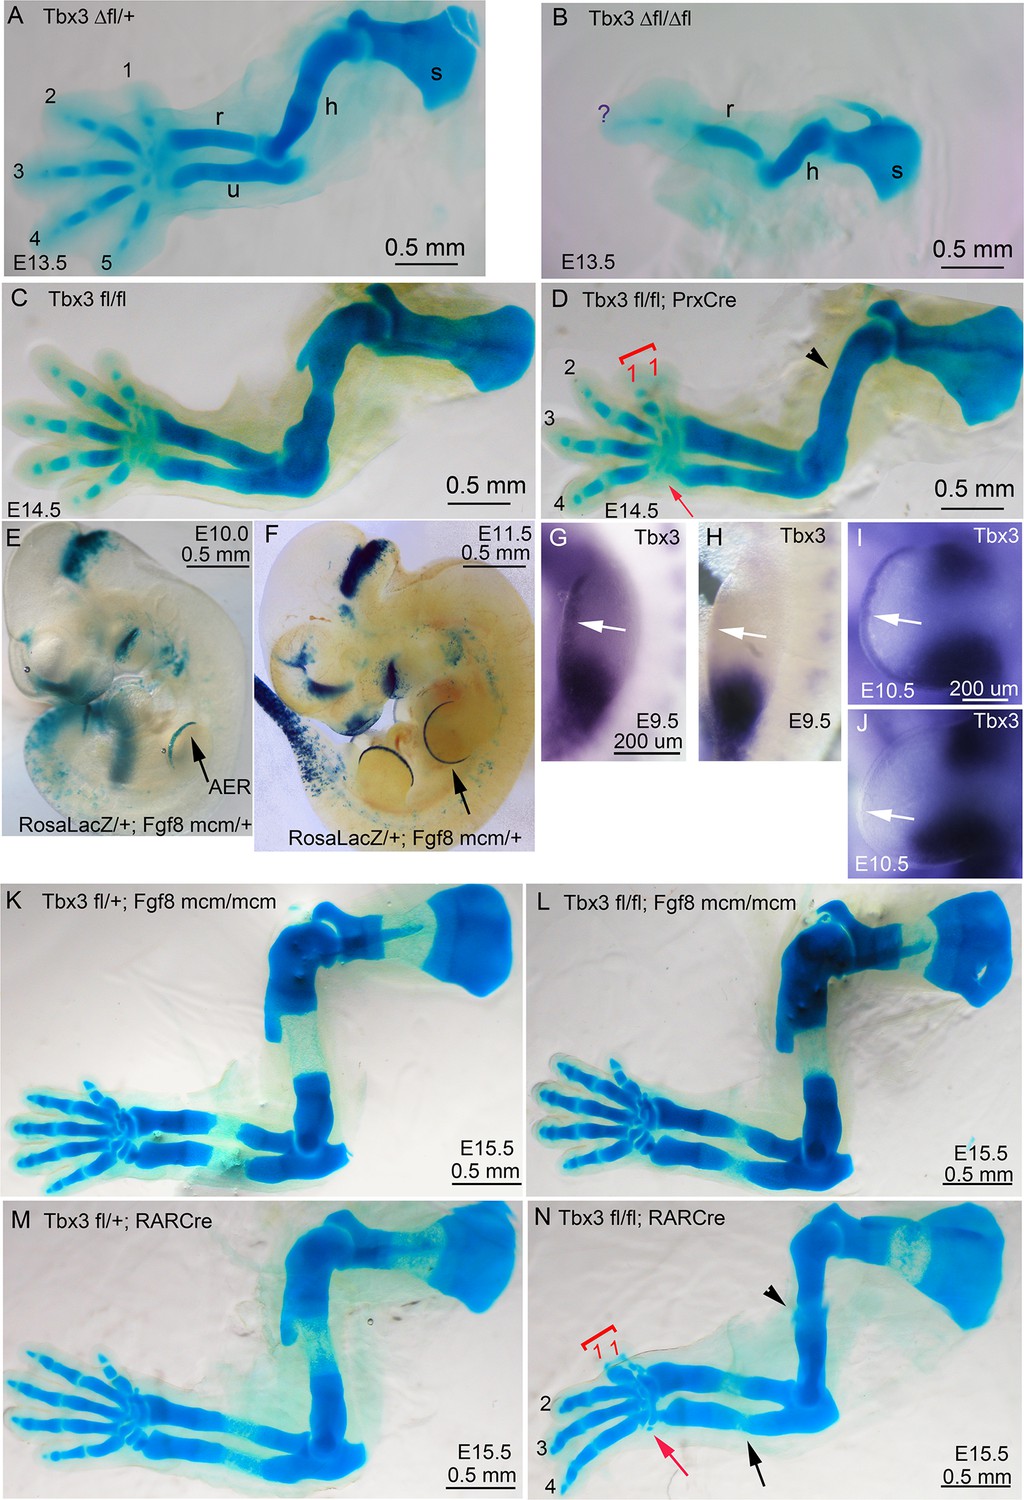
Increased severity of limb phenotypes in Tbx3 null mutants (Tbx3Δfl/Δfl) compared to Tbx3;PrxCre is independent of Tbx3 in the AER.
(A–D) Skeleton preparations comparing control (A: Tbx3Δfl/+, C:Tbx3fl/fl), Tbx3Δfl/Δfl (B, null), Tbx3fl/fl and Tbx3fl/fl;PrxCre (D, conditional mutant) forelimbs. Note single digit, absent ulna, and shortened humerus in Tbx3Δfl/Δfl mutant (B) compared to preaxial polysyndactyly and absent digit 5 in Tbx3;PrxCre mutants (D). s, scapula; h, humerus; r, radius; u, ulna; digits are numbered; red arrowhead highlights loss of digit 5. (E, F) X-gal stained E10.0 (E) and E11.5 (F) RosaLacZ/+;Fgf8mcm/+embryos after the administration of tamoxifen at E8.5; black arrow indicates staining indicative of previous Cre activity in the AER. (G–J) mRNA in situ for Tbx3 expression shows the absence of signal in the AER of Tbx3fl/fl;Fgf8mcm/mcmE9.5 and E10.5 mutants (H, J, respectively) compared to controls (G, I). White arrows point to AER in G–J; note persistent mesenchymal Tbx3 expression as expected. (K–N) Skeleton preparations comparing E15.5 control (K,M), and Tbx3 fl/fl;Fgf8mcm/mcm (L) and Tbx3fl/fl;RarCre (N) mutants. Forelimbs of Tbx3 fl/fl;Fgf8mcm/mcm mutants are normal (L), while defects in Tbx3fl/fl;RarCre (N) phenocopy those of Tbx3;PrxCre mutants (compare panel N to D and also to Figure 1, panel H).
Figure 2 with 1 supplement
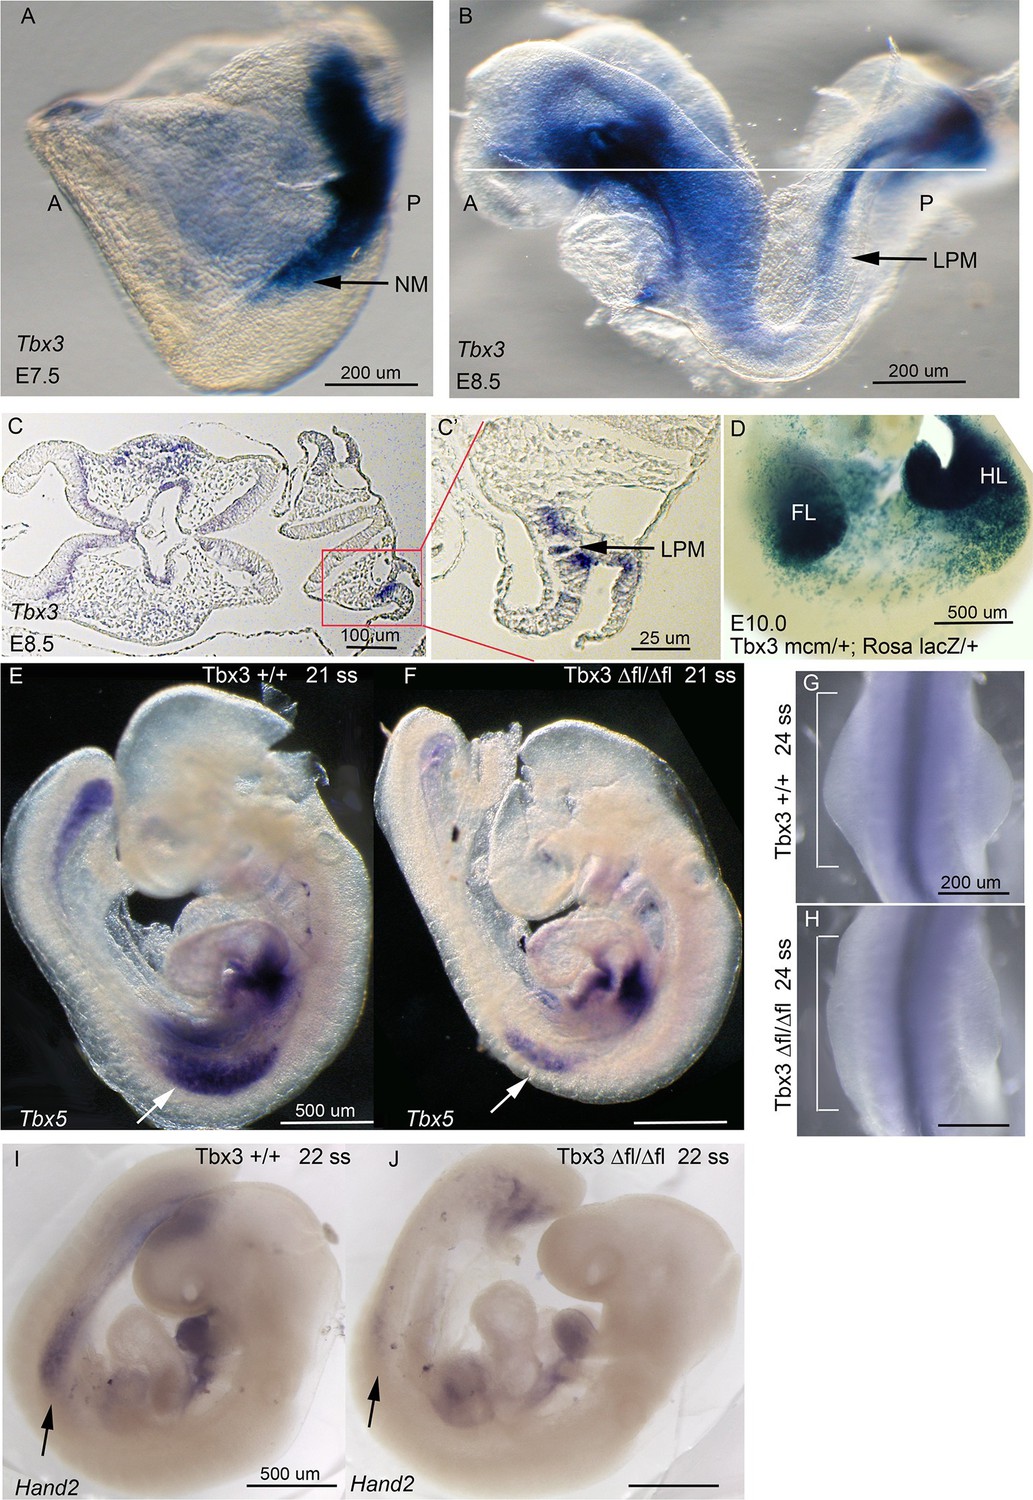
Tbx3 is required for normal limb bud initiation.
(A, B) Tbx3 expression at E7.5 (A) and E8.5 (B). Anterior on left (A), posterior on right (P). NM (black arrow) indicates nascent mesoderm exiting primitive streak in panel A. (C, C’) Tbx3 expression in the LPM (black arrow) of sectioned E8.5 embryo. Plane of section indicated by line in B. Panel D is magnification of red-boxed area in C. (D) X-gal stained E10.0 Tbx3MCM/+; Rosa LacZ/+ embryo after Cre induction at E8.5. FL, forelimb; HL, hindlimb. (E, F) 21 somite stage (ss) embryos assayed for Tbx5 mRNA. White arrows denote forelimb bud. Left sided view. (G, H) Dorsal view of budding forelimbs of 24 ss embryo forelimbs (neural tube stained for Shh expression). Note abnormal shape and size of Tbx3Δfl/Δfl mutant forelimb buds indicative of disrupted initiation; white brackets are of equal size in both panels. (I, J) 22 ss embryos assayed for Hand2 expression. Black arrows denote emerging forelimb bud.
Figure 2—figure supplement 1

Early Tbx5 expression is normal in Tbx3fl/fl;PrxCre mutants.
(A–B’) In situ hybridization for Tbx5 mRNA on E9.5 control (A, A’) embryo versus Tbx3;PrxCre mutant (B, B’). Left sided views in A and B and dorsal views of dissected torsos with forelimbs in A’, B’. Tbx5 expression and limb initiation are normal after conditional loss of Tbx3 in the limb bud mesenchyme. (C–D’) In situ hybridization for Hand2 mRNA on E9.5 control (A, A’) embryo versus Tbx3;PrxCre mutant (B, B’). Left- sided views in C and D and dorsal views of dissected limbs in C’, D’. Hand2 expression is affected by conditional loss of Tbx3 in limb bud mesenchyme, but not as severely as in Tbx3Δfl/Δfl mutants shown in Figure 2J. Boxed area in D encloses forelimb forming region shown from dorsal view in D’.
Figure 3 with 5 supplements
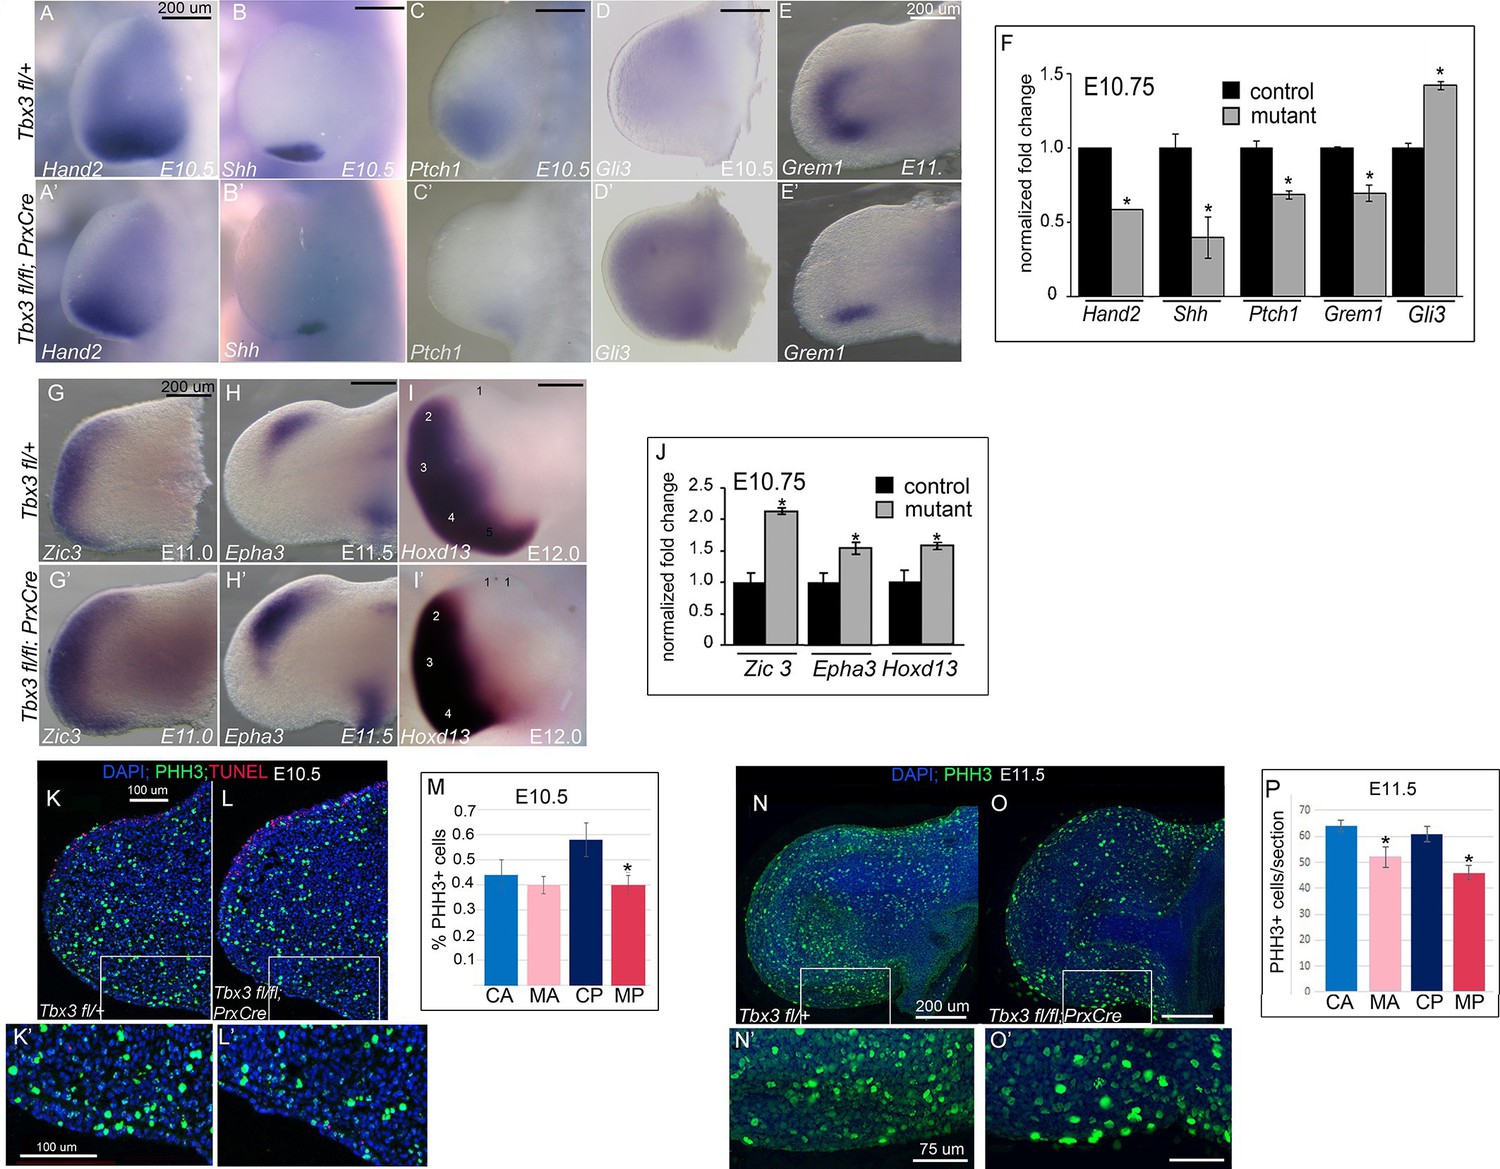
Loss of mesenchymal Tbx3 disrupts Shh signaling in the posterior limb bud and decreases Gli3 protein stability.
(A–E’) In situ hybridization of control and mutant forelimb buds with probes and at embryonic stages as labeled. (F) qPCR of E10.75 (36-39ss) limb buds for transcripts listed confirms findings by detected by in situ. (G–I’) In situ hybridization for Zic3, Epha3 and Hoxd13 transcripts in forelimb buds of Tbx3 fl/+controls (K–M) and Tbx3;PrxCre mutants (G’–I’) at ages noted on panels. J) qPCR assay of Zic3, Epha3, Hoxd13 transcript levels confirms findings detected by in situ. (K–L’) Representative images of E10.5 forelimb buds stained for DAPI (blue), pHH3 (green), TUNEL (red). K is Tbx3 fl/+ control and K’ is digital zoom of posterior mesenchymal boxed area in K. Panel L is Tbx3;PrxCre mutant and L’ is digital zoom of boxed area in L. This experiment is representative of data obtained from five biologic replicates. (M) Quantification of proliferating cells in anterior and posterior mesenchymal regions encompassing digit 1 and digit 5 progenitors from 20 control and 15 mutant sections. *p=0.02. Control anterior limb (CA), Tbx3;PrxCre mutant anterior limb (MA), control posterior (CP), and mutant posterior (MP). (N–O’) Representative images of E11.5 whole mount forelimb buds stained for DAPI (blue) and pHH3 (green). N is Tbx3 fl/+ control and N’ is digital zoom of boxed area. Panel O is Tbx3;PrxCre mutant and O’ is digital zoom of boxed area in O. Note decreased pHH3+ cells in mutants, particularly cells in prophase and anaphase, which have the faint and speckled patterns compared to the bright staining of highly condensed S-phase chromatin. (P) Quantification of proliferating cells in anterior and posterior mesenchymal regions encompassing digit 1 and digit 5 progenitors from 50 control and 44 mutant sections at E11.5. *p<0.1. Control anterior limb (CA), Tbx3;PrxCre mutant anterior limb (MA), control posterior (CP), and mutant posterior (MP).
Figure 3—figure supplement 1

Decreased Shh expression in E10.5 forelimb buds of Tbx3;PrxCre mutants.
(A, B) Whole mount in situ hybridization for Shh transcripts on E10.5 embryos; left -sided views. (C, D) Dissected limbs from whole mount in situ hybridization for Shh transcripts on E11.0 embryos; dorsal views of left limb buds are shown.
Figure 3—figure supplement 2
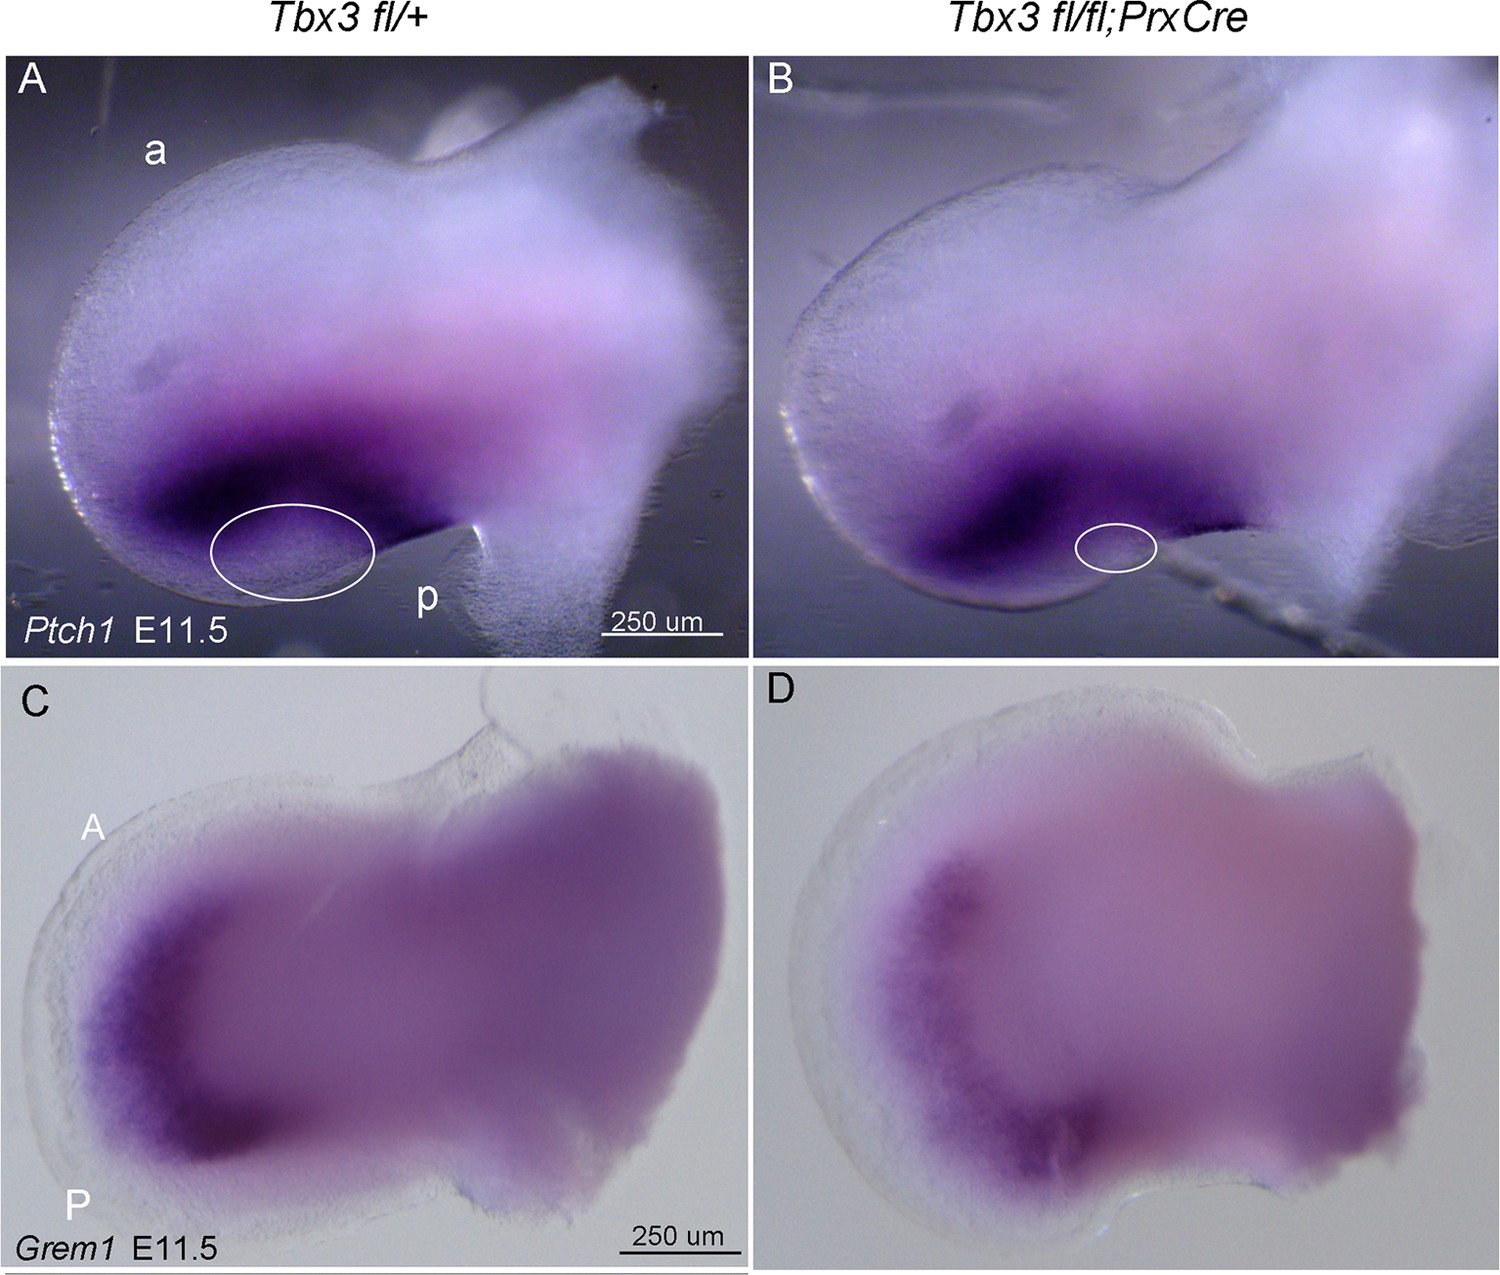
No evidence of ectopic hedgehog pathway activity in Tbx3;PrxCre mutant forelimbs.
(A, B) In situ hybridization for Ptch1 at E11.5 in control (A) versus Tbx3;PrxCre mutant (B) limb buds. Ptch1 expression is decreased in posterior mesenchyme, consistent with results in Figure 3. There is no ectopic Ptch1 signal in anterior mesenchyme. Note decreased size of Ptch1 negative zone in posterior mesenchyme (white ellipses), consistent with loss of digit 5 progenitors which are unresponsive to Shh signaling at this stage (Scherz et al., 2004) Ahn and Joyner, 2004). a, anterior; p, posterior (C, D). In situ hybridization for Grem1 at E11.5 reveals decreased expression throughout limb, consistent with qPCR and in situ results shown in Figure 3 at E10.75.
Figure 3—figure supplement 3
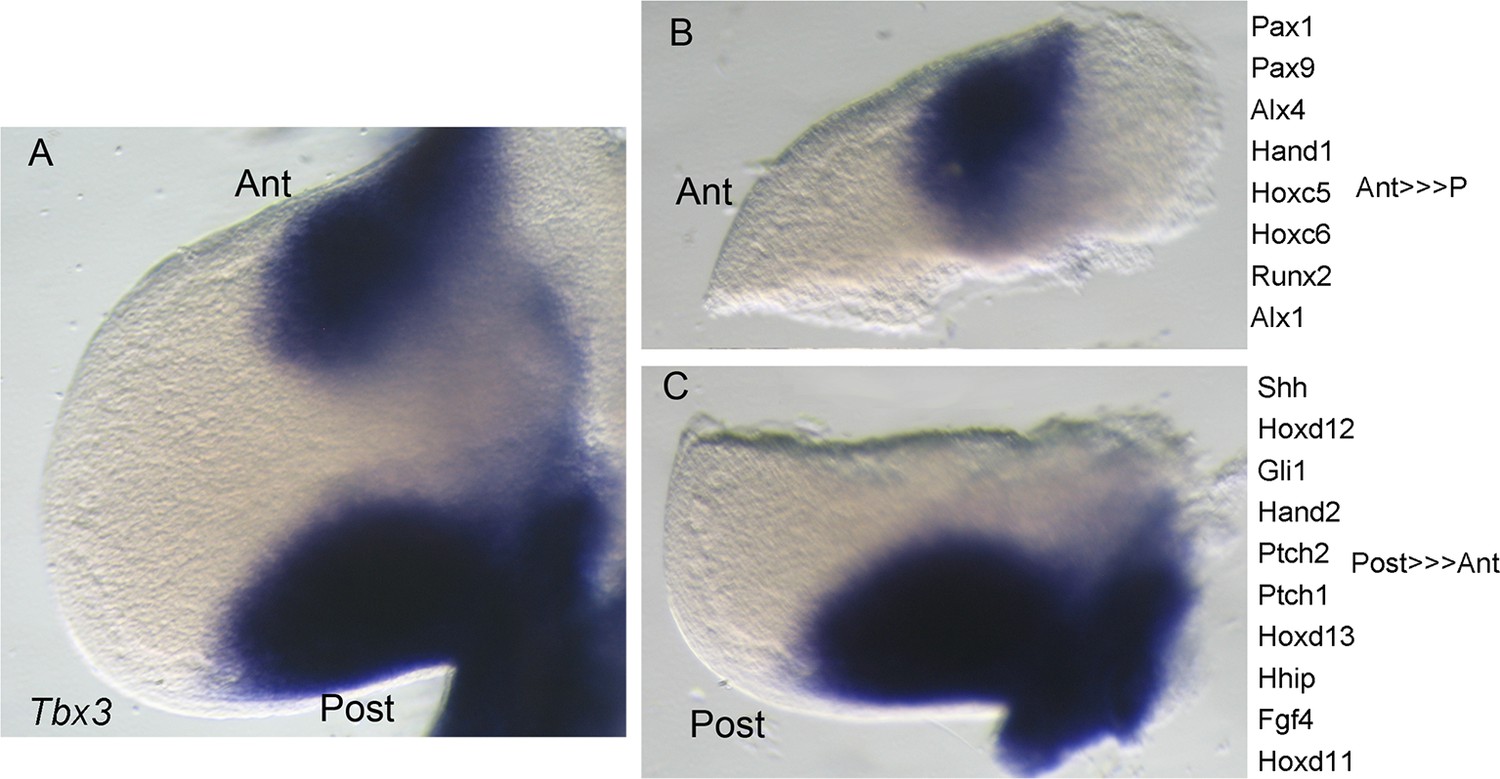
Microdissection of E11 forelimb buds into anterior and posterior compartments for gene and protein expression analyses.
(A) Intact left limb bud after in situ hybridization for Tbx3 mRNA. Anterior (ant) at top, posterior (post) at bottom. (B, C) Microdissected anterior and posterior Tbx3+ compartments and list of example genes whose expression is confined to, or enriched in, each compartment.
Figure 3—figure supplement 4
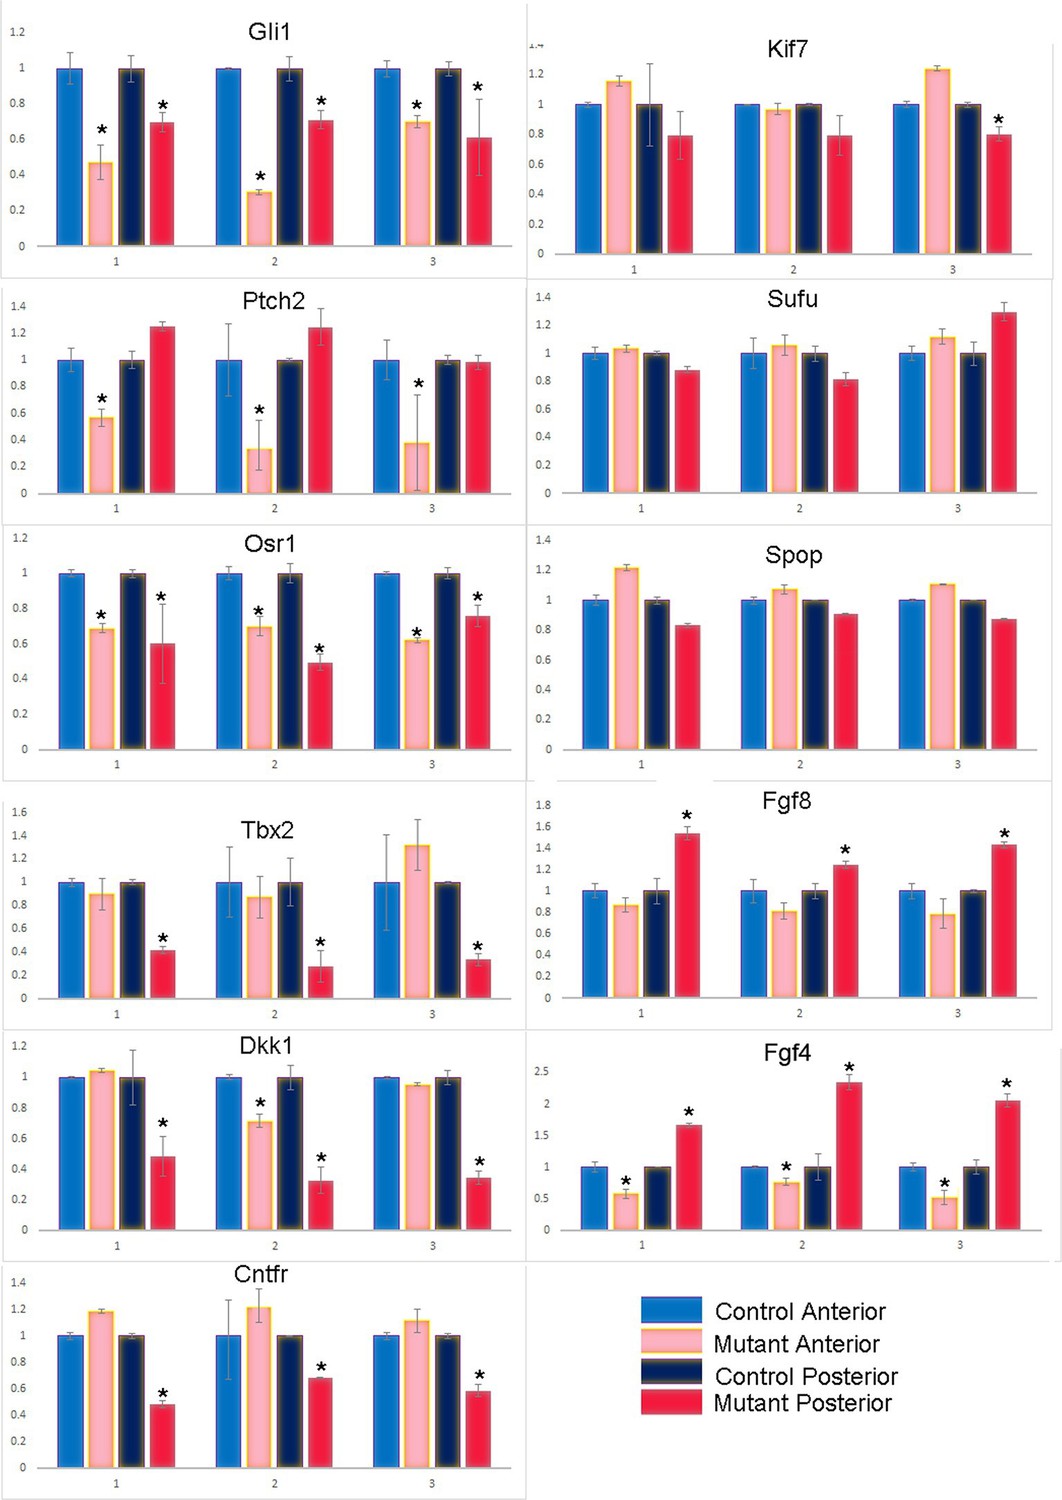
qPCR of additional key transcripts in anterior and posterior forelimb compartments at E10.5–10.75 (36–39 somite stages).
https://doi.org/10.7554/eLife.07897.014
Figure 3—figure supplement 5
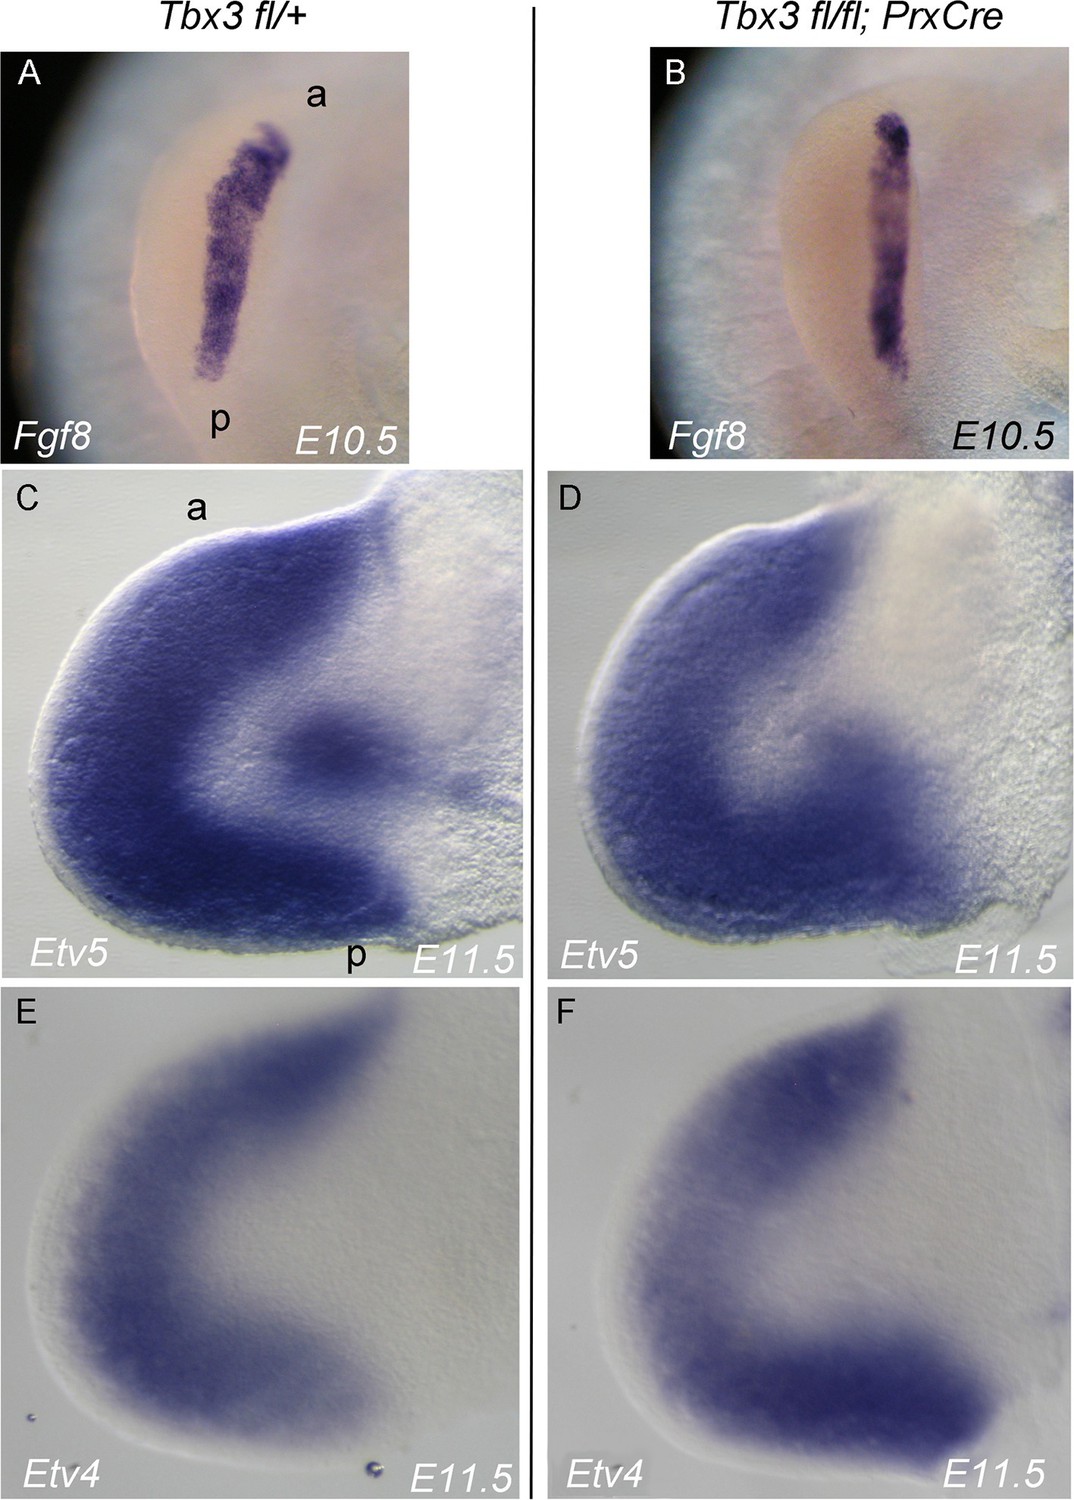
Fgf8 expression and downstream in Tbx3;PrxCre mutant forelimb buds.
(A–F) In situ hybridization for the transcripts listed on panels at ages specified. (A, B) View of AER stained for Fgf8. (C–F) Dorsal view of left forelimb buds stained for Erm (Etv5) and Pea3 (Etv4) transcripts which are regulated by FGF signaling in the limb bud.
Figure 4 with 2 supplements
Loss of Tbx3 results in Gli3 protein instability and aberrant localization of Kif7 in limb bud cilia.
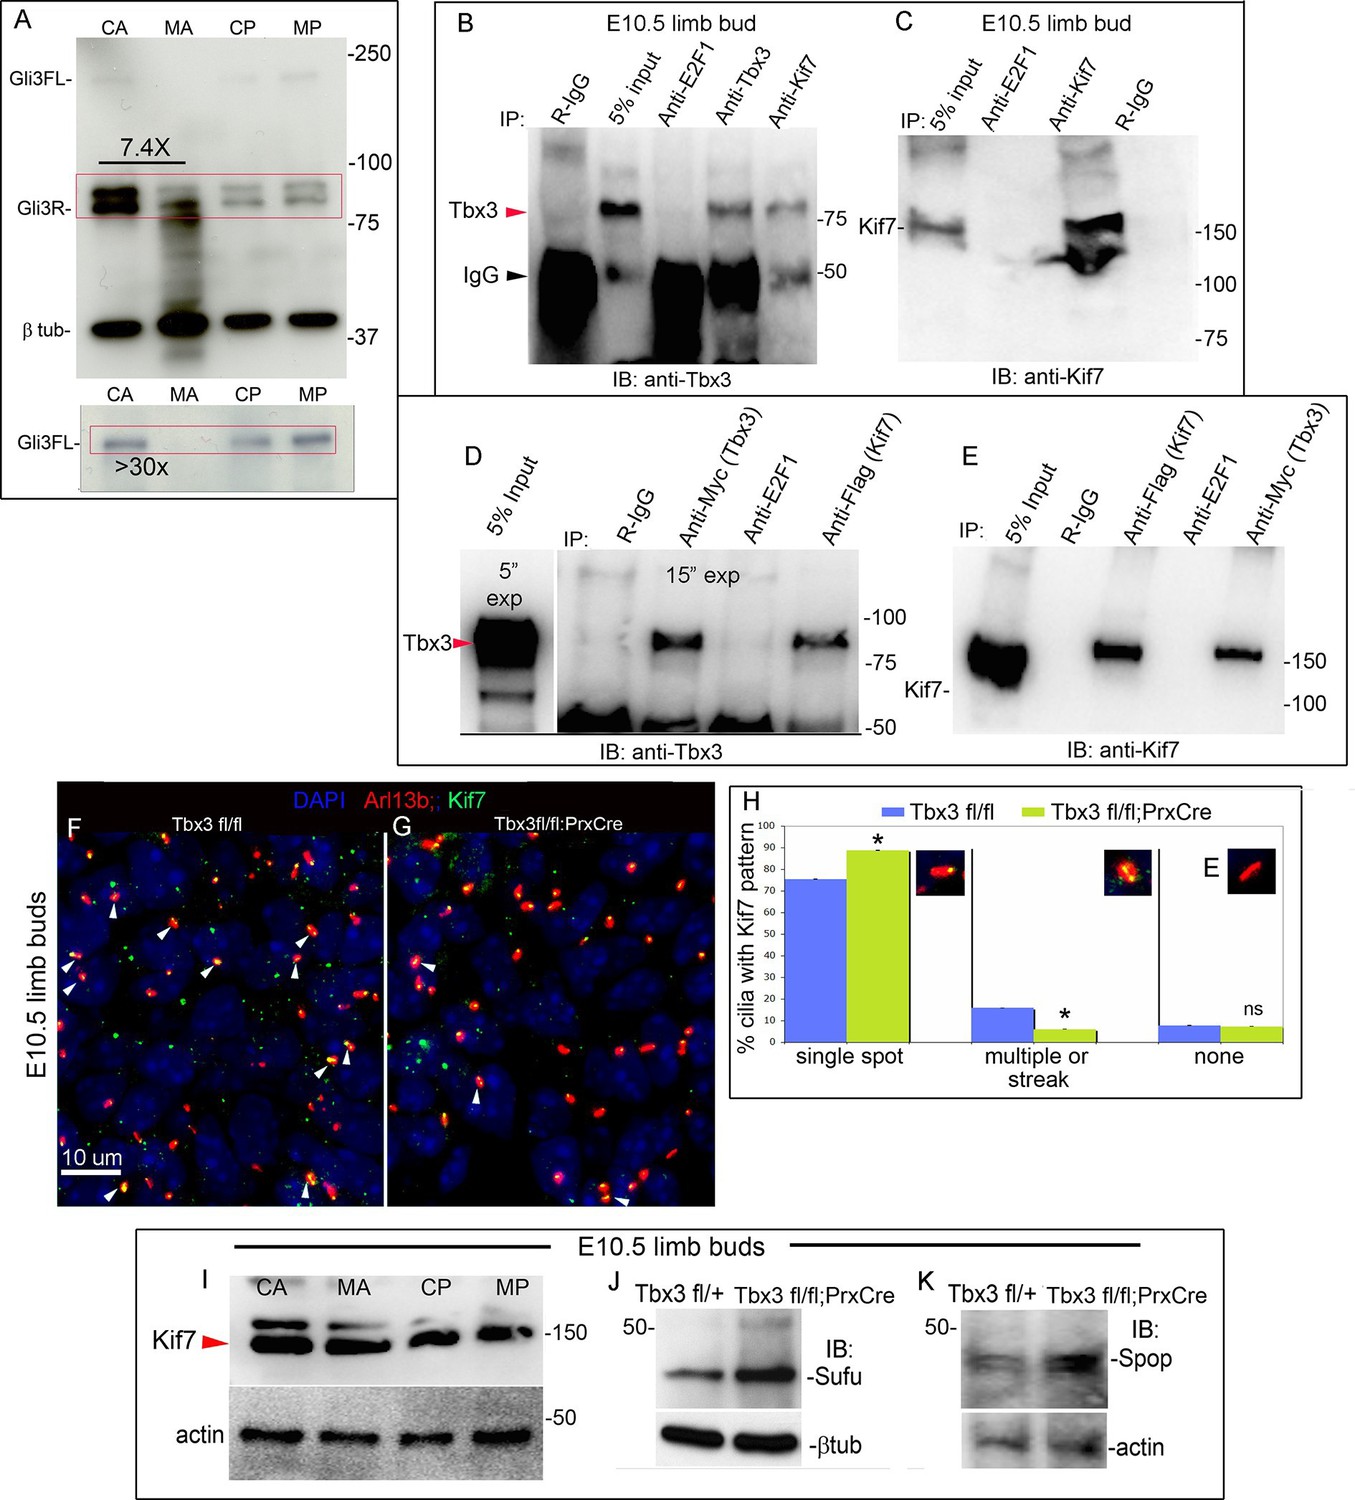
(A) Representative immunoblot (N=3) blot of E10.75 forelimb bud lysates prepared from microdissected Tbx3fl/+ control anterior limb (CA), Tbx3;PrxCre mutant anterior limb (MA), control posterior (CP), and mutant posterior (MP) probed for Gli3 and βtubulin loading control. Note decreased level of Gli3FL and Gli3R, and multiple bands of lower molecular weight than Gli3R in MA sample. Densitometry of Gli3R bands in red box in N revealed that in this representative experiment, the level of Gli3R was 7.4 fold decreased in mutant anterior relative to control anterior. (A’) Longer exposure of top of blot shown in panel A to examine Gli3FL band. The control (CA) Gli3FL band is 31 fold more intense than mutant (MA, virtually undetectable). (B) Immunoblot of lysates from E10.5 forelimb buds immunoprecipitated (IB) with antibodies listed at top and immunoblotted (IB) for Tbx3. Lane 5 shows that immunoprecipitation with anti-Kif7 antibody co-IPs Tbx3. (C) As in panel B, but assayed for Kif7. (D) Co-IP assay of Myc-tagged Tbx3 and Flag-tagged GFP overexpressed in HEK293 cells. IP was performed with antibodies listed at top and immunoblotted for Tbx3. Myc-tagged Tbx3 co-IPs with Flag-tagged Kif7. Input lane was 5 s exposure (5” exp) while other lanes were 15 s (15” exp). (E) As in D, but in this case, blot probed for Kif7; confirms interaction of tagged, overexpressed proteins. (F, G) Representative images of anterior mesenchyme in sectioned forelimbs of control (F, Tbx3fl/fl) and mutant (G, Tbx3fl/fl;PrxCre) E10.5 embryos stained for the ciliary marker Arl13b (red), Kif7 (green) and DAPI (DNA, blue). White arrowheads highlight cilia with multiple punctae or streak of ciliary Kif7 immunoreactivity (yellow) indicating translocation of Kif7 within the cilia. Please also see Figure 5—source data 2 for z-stacks of additional Kif7 stained limb section. (H) Quantification of Kif7 staining pattern from multiple limb sections and three embryos of each genotype scored blinded to genotype. 10% fewer cilia have evidence of Kif7 translocation (multiple punctae or streak of Kif7 immunoreactivity) in Tbx3fl/fl;PrxCre mutants. N=1785 and 1792 cilia scored in controls and mutants, respectively. * p<0.001 There was no difference in the number of Kif7- cilia. Insets show digital zoom of cilia with representative pattern used for scoring. (I) Immunoblot assaying for Kif7 and b tubulin loading control in control anterior (CA), mutant anterior (MA), control posterior (CP) and mutant posterior (MP) e10.5 forelimb bud lysates. This is representative of four such experiments. (J) Western blot assaying for Sufu protein and b tubulin loading control in eE10.5 forelimb buds. Like Kif7 mutants,Tbx3;PrxCre mutants have increased Sufu protein. Sufu is increased 1.8 fold when normalized to loading control in this representative immunoblot; N=4. K) Western blot assaying for Spop protein and actin loading control in E10.5 forelimb buds. Spop is increased 1.5 fold when normalized to loading control in this representative immunoblot; N=3. Both Sufu and Spop protein levels are increased in mutant forelimbs although their transcript levels are unchanged (Figure 3—figure supplement 4).
-
Figure 4—source data 1
CZI file containing z-stack of E10.5 sectioned limb shown in Figure 4—figure supplement 1.
Kif7 is green, Arl13b red, DNA blue. Gli3 signal can be viewed if desired in the violet channel (channel 2). The entire z stack can be viewed using the free download of Zen software: http://www.zeiss.com/microscopy/en_de/downloads/zen.html.
- https://doi.org/10.7554/eLife.07897.017
Figure 4—figure supplement 1
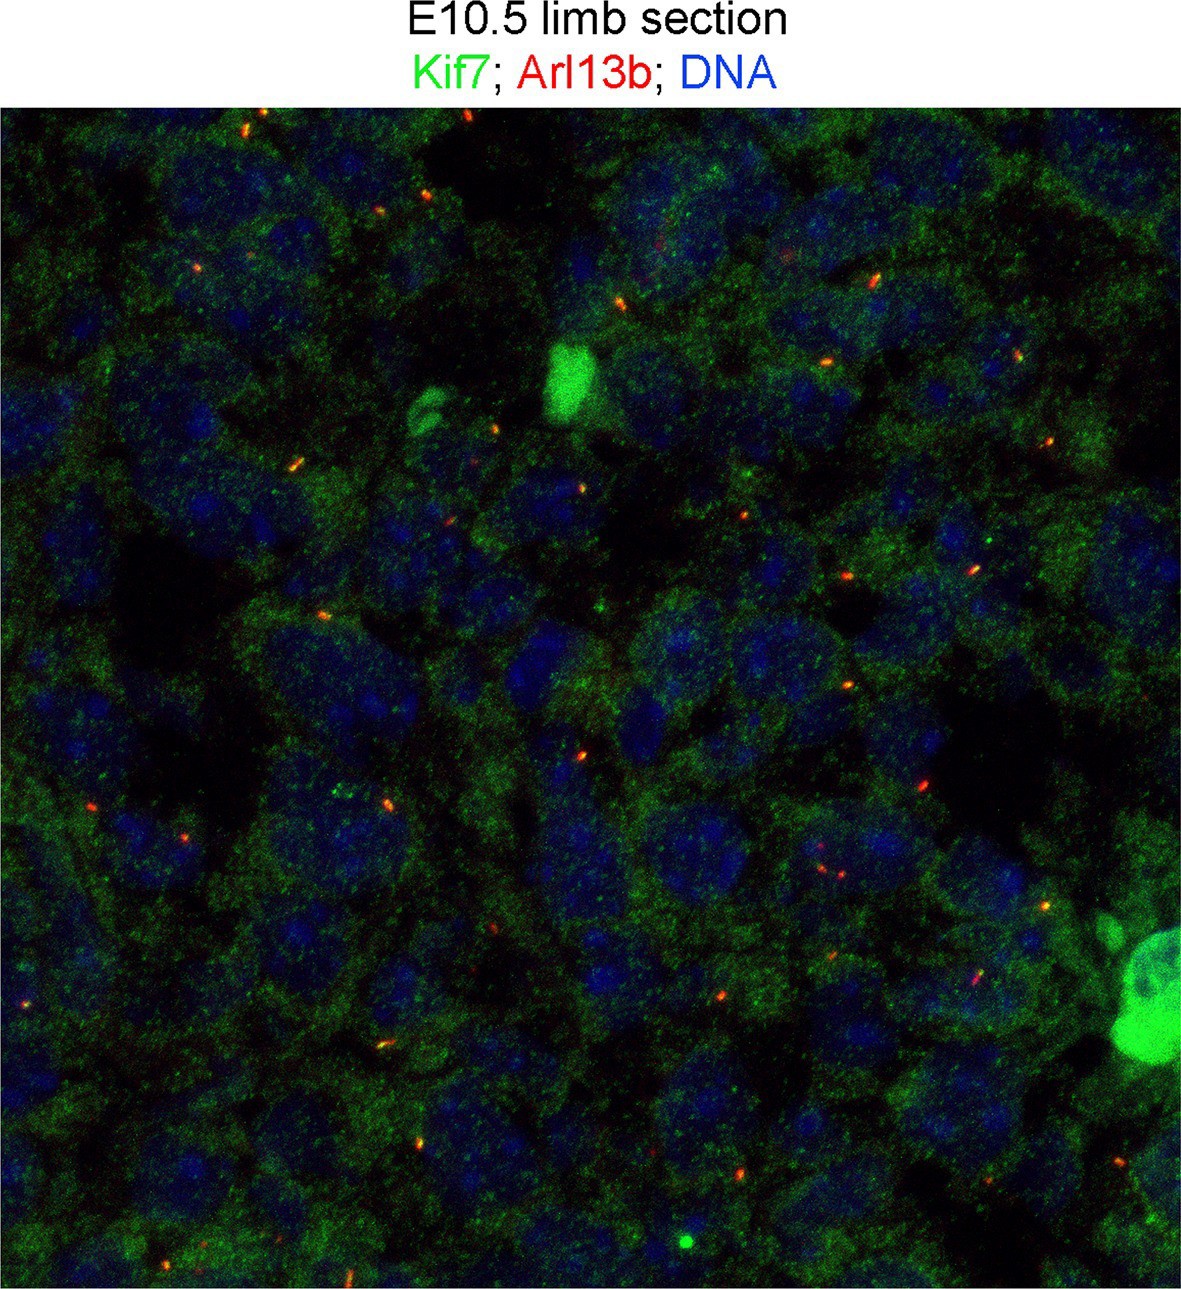
Kif7 is also present in cytoplasm and nucleus.
100 X confocal maximum image projection of E10.5 sectioned limb stained for Kif7 (green), Arl13b (red) and DNA (blue). Please also see Figure 5—source data 2 for z-stack.
Figure 4—figure supplement 2
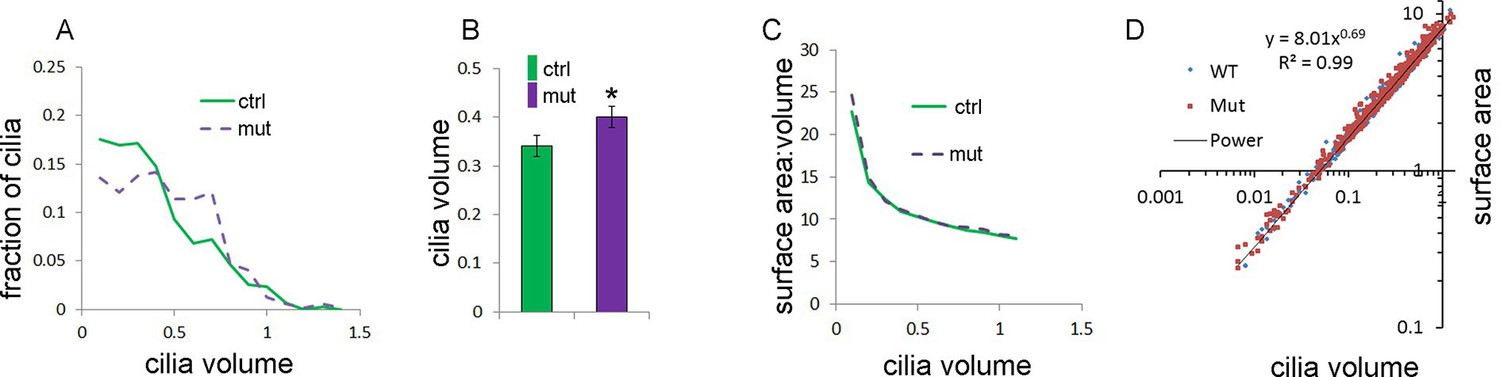
Anterior mesenchymal limb cilia are bigger in Tbx3;PrxCre mutants compared to controls.
(A) Distribution of cilia volumes in control and mutant limb buds. (B) Average cilia volumes and 95% confidence intervals. (C) Average surface area to volume ratios over the range of cilia volumes measured. (D) Calculated of surface area and volume of both WT and mutant cilia fit the equation: Surface=8.01 X Volume0.69
Figure 5 with 2 supplements
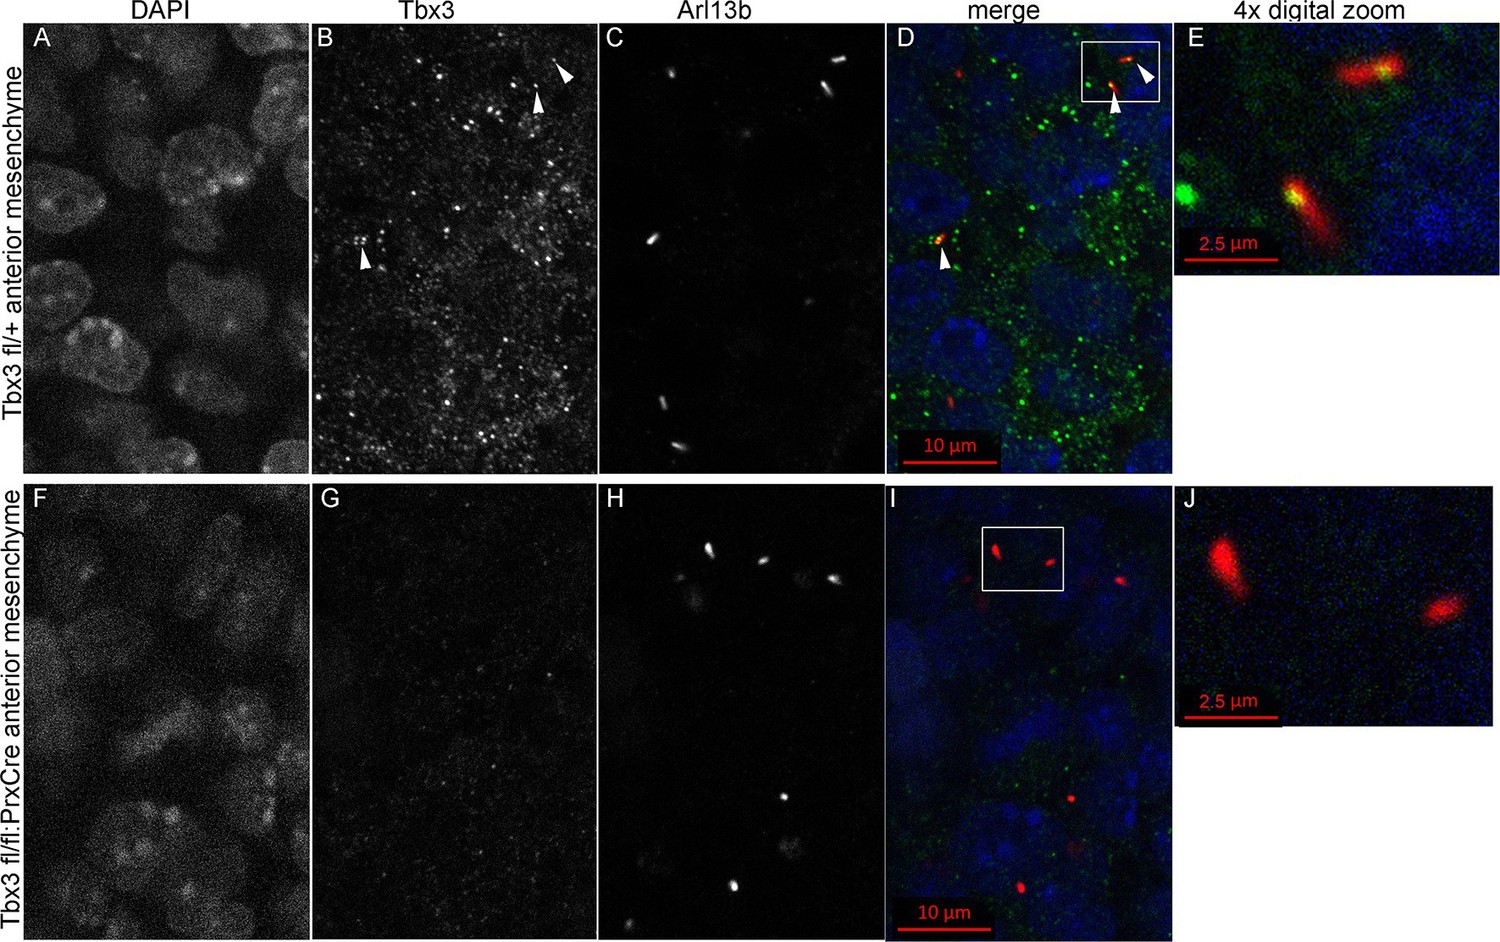
Tbx3 localizes to the primary cilia in limb mesenchyme.
(A–D, F–I) Confocal 100X single Z-plane immunofluorescence images from optically sectioned E10.5 control (top panels A–D) and Tbx3;PrxCre (F–I) anterior limb buds after immunostaining with: Hoechst (DNA, blue), C-terminal anti-Tbx3 antibody (green, Frank et al., 2013), anti-Arl13b (red, cilia). Arrowheads demarcate Tbx3 colocalization with cilia marker. Panels E and J are further digital zooms of white boxed cells in D and I. The entire z-stacks containing these planes are in Figure 5—source data 1,2.
-
Figure 5—source data 1
Czi file of z-stack through the region of control anterior limb shown in Figure 5A–E.
The entire z stack can be viewed using the free download of Zen software http://www.zeiss.com/microscopy/en_de/downloads/zen.html.
- https://doi.org/10.7554/eLife.07897.021
-
Figure 5—source data 2
Czi file of z-stack through region of mutant anterior limb shown in Figure 5F–J.
Please view as described above.
- https://doi.org/10.7554/eLife.07897.022
Figure 5—figure supplement 1
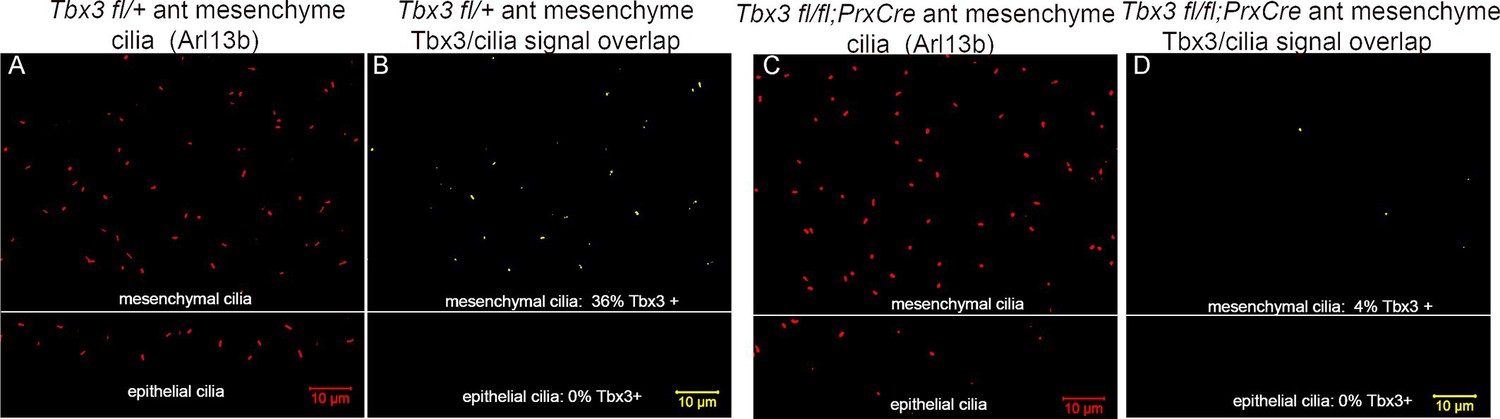
Digital image overlap of Tbx3 and Arl13b in limb bud anterior mesenchyme.
(A) Maximum image projection of Arl13b channel from control limb z-stack shown in Figure 5—source data 1. Both mesenchymal and epithelial cilia are apparent in the maximum projection. (B) Calculated digital image overlap of Arl13b (cilia) and Tbx3 positive pixels in control limb bud. Note that all epithelial cilia in the stack are Tbx3 negative and of the 50 mesenchymal cilia, 18 (36%) are Tbx3 positive. Please see Experimental Procedures for use of Zen and Image J software to calculate pixel overlap in separate channels. (C) Maximum image projection of Arl13b channel from control limb z-stack shown in Figure 5—source data 2. Both mesenchymal and epithelial cilia are apparent in the maximum projection. (D) Calculated digital image overlap of Arl13b (cilia) and Tbx3 positive pixels in Tbx3;PrxCre limb bud. Note that all epithelial cilia in the stack are Tbx3 negative and of the 54 mesenchymal cilia, 2 (4%) are Tbx3 positive consistent with low level of background antibody staining in mutant (Figure 5, panels G, I).
Figure 5—figure supplement 2
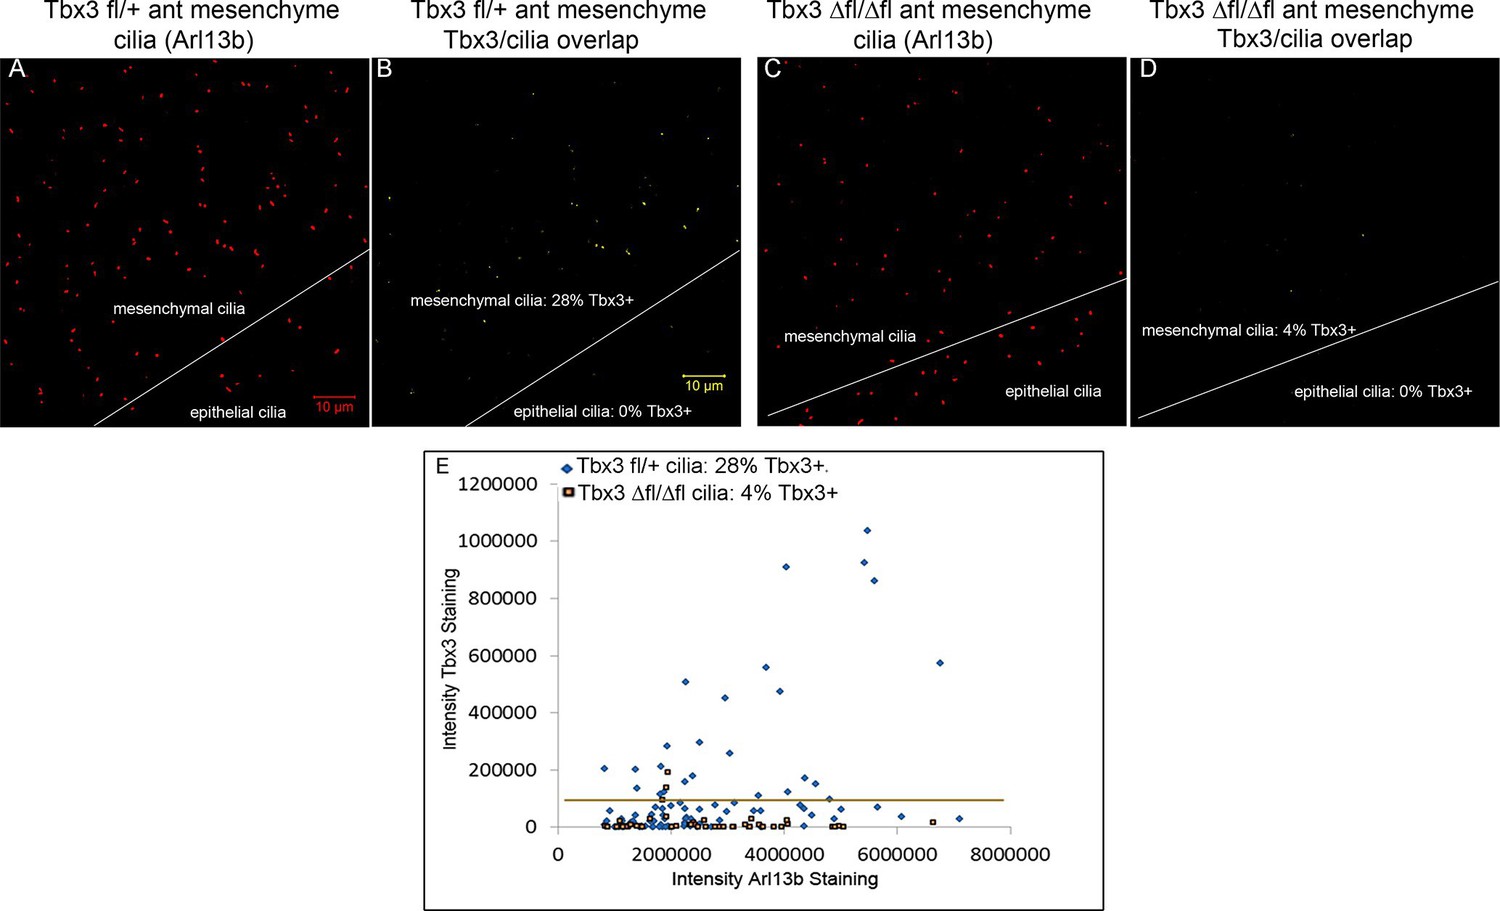
Tbx3 immunoreactivity in limb cilia is also detected by a commercial anti-Tbx3 antibody against the N-terminus of Tbx3.
(A) Maximum image projection of Arl13b channel from control forelimb z-stack. (B) Calculated digital image overlap (see Methods section) of Arl13b (cilia) and Tbx3 positive pixels in control limb bud shown above using Abcam (Abcam ab99302) anti-Tbx3 antibody to the N-terminus of mouse Tbx3. 27/97 (28%) of mesenchymal cilia are Tbx3+. (C) Maximum image projection of Arl13b channel from Tbx3;PrxCre mutant forelimb z-stack. (D) Calculated digital image overlap of Arl13b (cilia) and Tbx3 positive pixels in Tbx3;PrxCre forelimb bud shown above. 2/52 mesenchymal cilia are Tbx3+. (E) Scatter plot obtained using ImageJ comparing Tbx3 and Arl13b intensities from control and mutant anterior forelimb buds stained with Abcam anti-Tbx3 antibody shown in A–D.
Figure 6 with 1 supplement
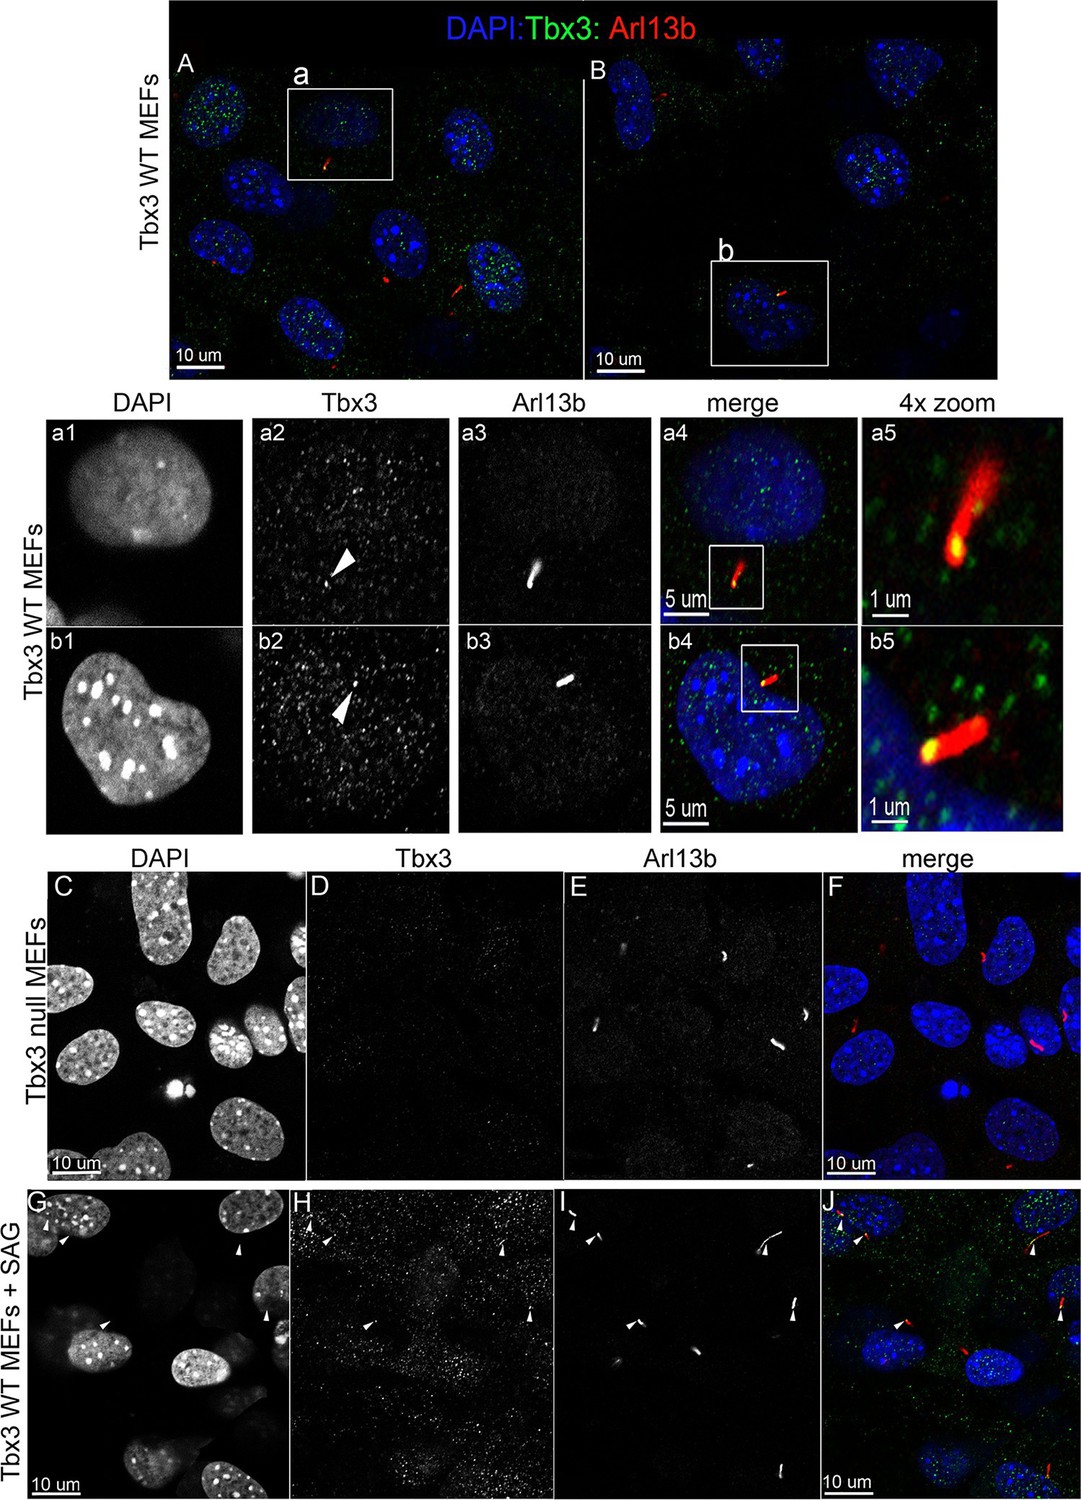
Tbx3 is present in some cilia at baseline in Murine Embryonic Fibroblasts and trafficks to cilia in response to hedgehog pathway activation.
(A, B) Confocal, 100X single z-plane immunofluorescence images from two different fields of wild type MEFS after immunostaining for: DAPI (DNA, blue), Tbx3 (green, c-terminal anti-Tbx3 antibody; Frank et al., 2013), Arl13b (red, cilia). White boxed regions outline single cells that are shown at higher magnification in panels a1–a5 and b1–b5. Please see Figure 6—source data 1,2 for z-stacks. a1–a4, b1–b4) Single cells from white boxed areas in panels A and B. Individual cilia are shown in a5 and b5. White arrowheads highlight Tbx3+ cilia. (C–F) Tbx3 null MEFs show loss of Tbx3 immunoreactivity in cilia and other cellular locations. Please see Figure 6—source data 3 for z-stack. (G–J) As in A and B, but MEFs were treated with smoothened agonist (SAG). White arrowheads highlight Tbx3+ cilia. Please see Figure 6—source data 4 for z-stack.
-
Figure 6—source data 1
Czi file showing z-stack of wild type MEFs imaged in Figure 6 panel A.
- https://doi.org/10.7554/eLife.07897.026
-
Figure 6—source data 2
Czi file showing z-stack of wild type MEFs imaged in Figure 6 panel B.
- https://doi.org/10.7554/eLife.07897.027
-
Figure 6—source data 3
Czi file showing z-stack of Tbx3 null MEFs imaged in Figure 6 panel C–F.
- https://doi.org/10.7554/eLife.07897.028
-
Figure 6—source data 4
Czi file showing z-stack of SAG treated MEFs imaged in Figure 6 panel G–J.
- https://doi.org/10.7554/eLife.07897.029
-
Figure 6—source data 5
Czi file showing z-stack of SAG treated MEFs imaged in Figure 6—figure supplement 1 panel C.
- https://doi.org/10.7554/eLife.07897.030
-
Figure 6—source data 6
Czi file showing z-stack of SHH treated MEFs imaged in Figure 6—figure supplement 1 panel D.
- https://doi.org/10.7554/eLife.07897.031
Figure 6—figure supplement 1
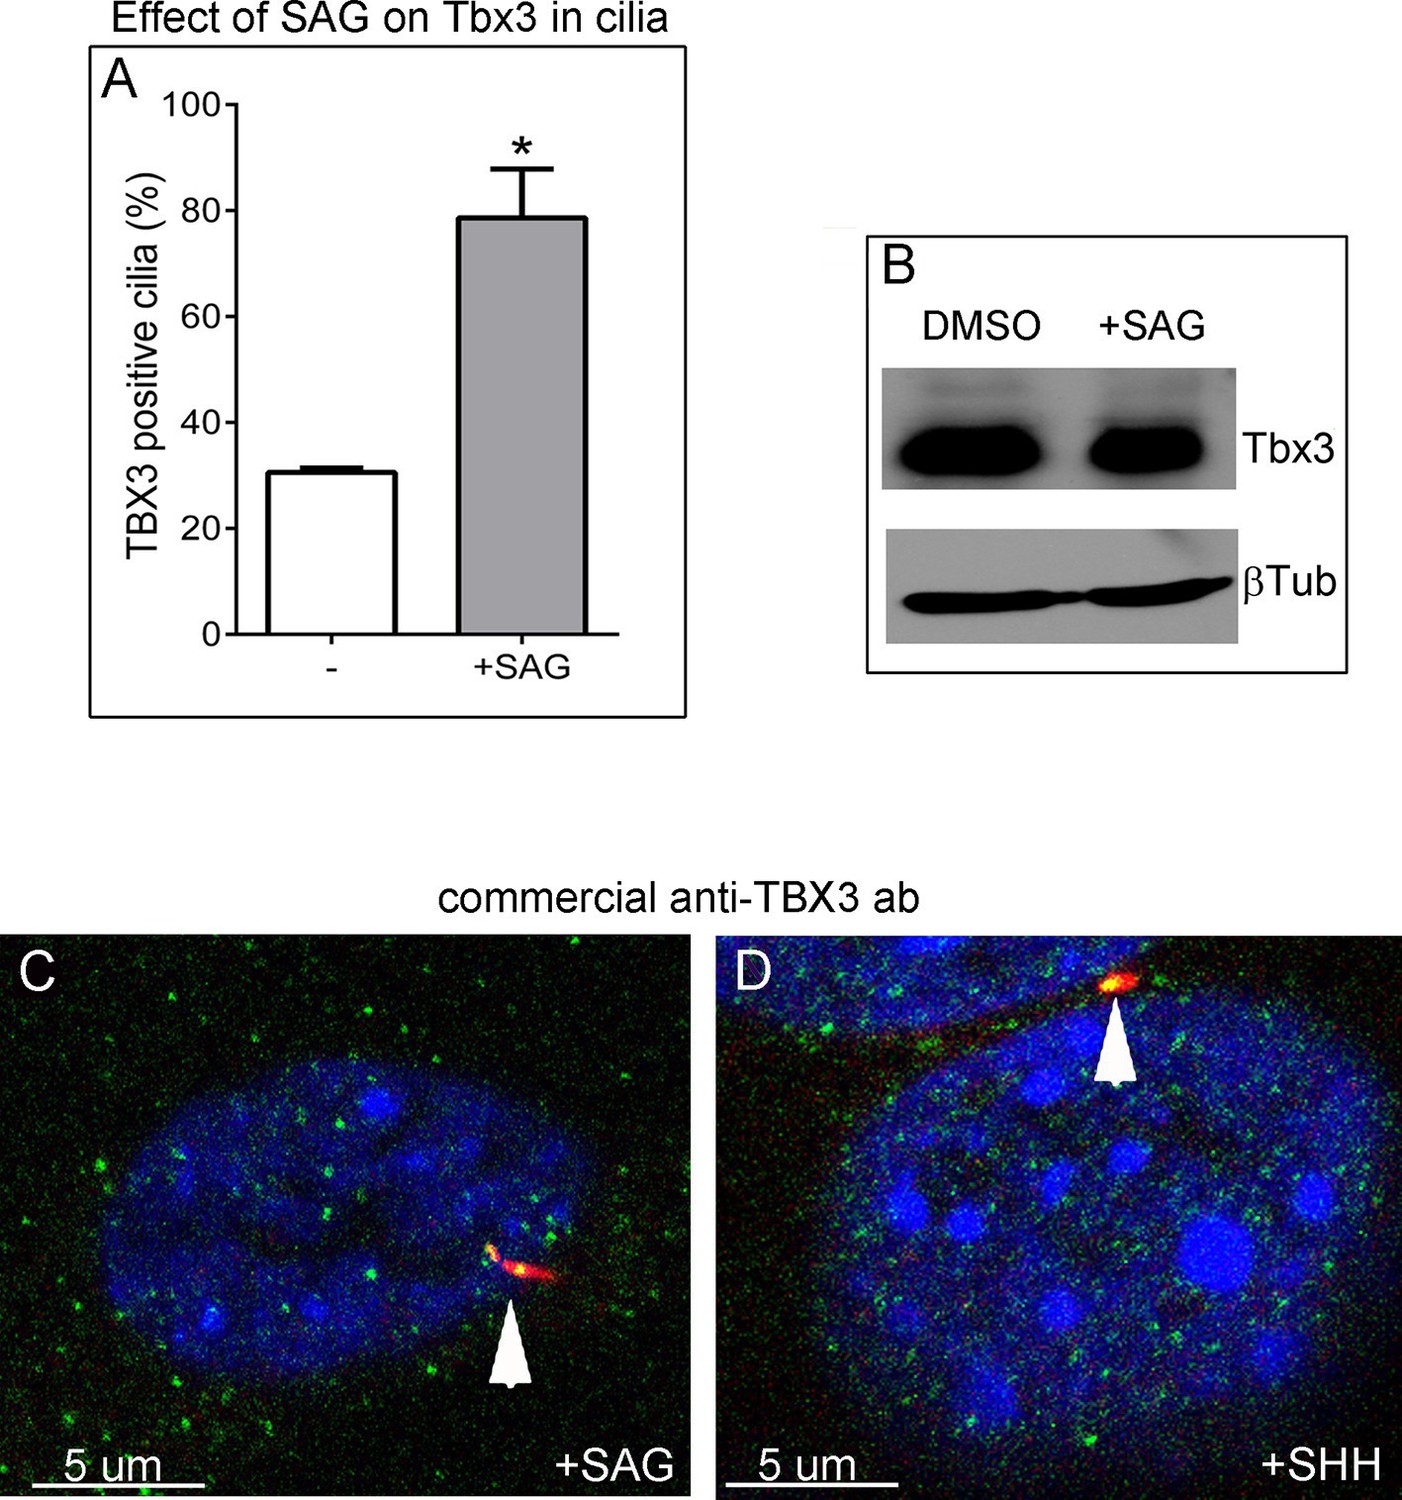
Tbx3 immunoreactivity in cilia increases in response to Hedgehog pathway stimulation without an overall increase in Tbx3 protein levels.
(A) Quantitation of Tbx3+ cilia in wild type MEFS -/+ SAG shows marked increase in Tbx3 immunoreactive cilia in response to SAG. B) Western blot assaying Tbx3 and btubulin (loading control) protein levels in MEFs +/- SAG; the increase in number of Tbx3+ cilia occurs without an increase in amount of total Tbx3 protein. (C, D) Immunofluorescence images of SAG-treated (C) or SHH (D) MEFs assayed with a Santa Cruz commercial anti-Tbx3 antibody (A20) raised against an internal Tbx3 epitope (green) confirm colocalization with cilia/Arl13b (red). These merged images include DAPI in blue; white arrowheads highlight ciliary Tbx3. Please see Figure 6—source data 5,6 for z-stacks.
Figure 7 with 3 supplements
Tbx3 interacts with Gli3 in the limb bud and trafficks with Gli3 in primary cilia.
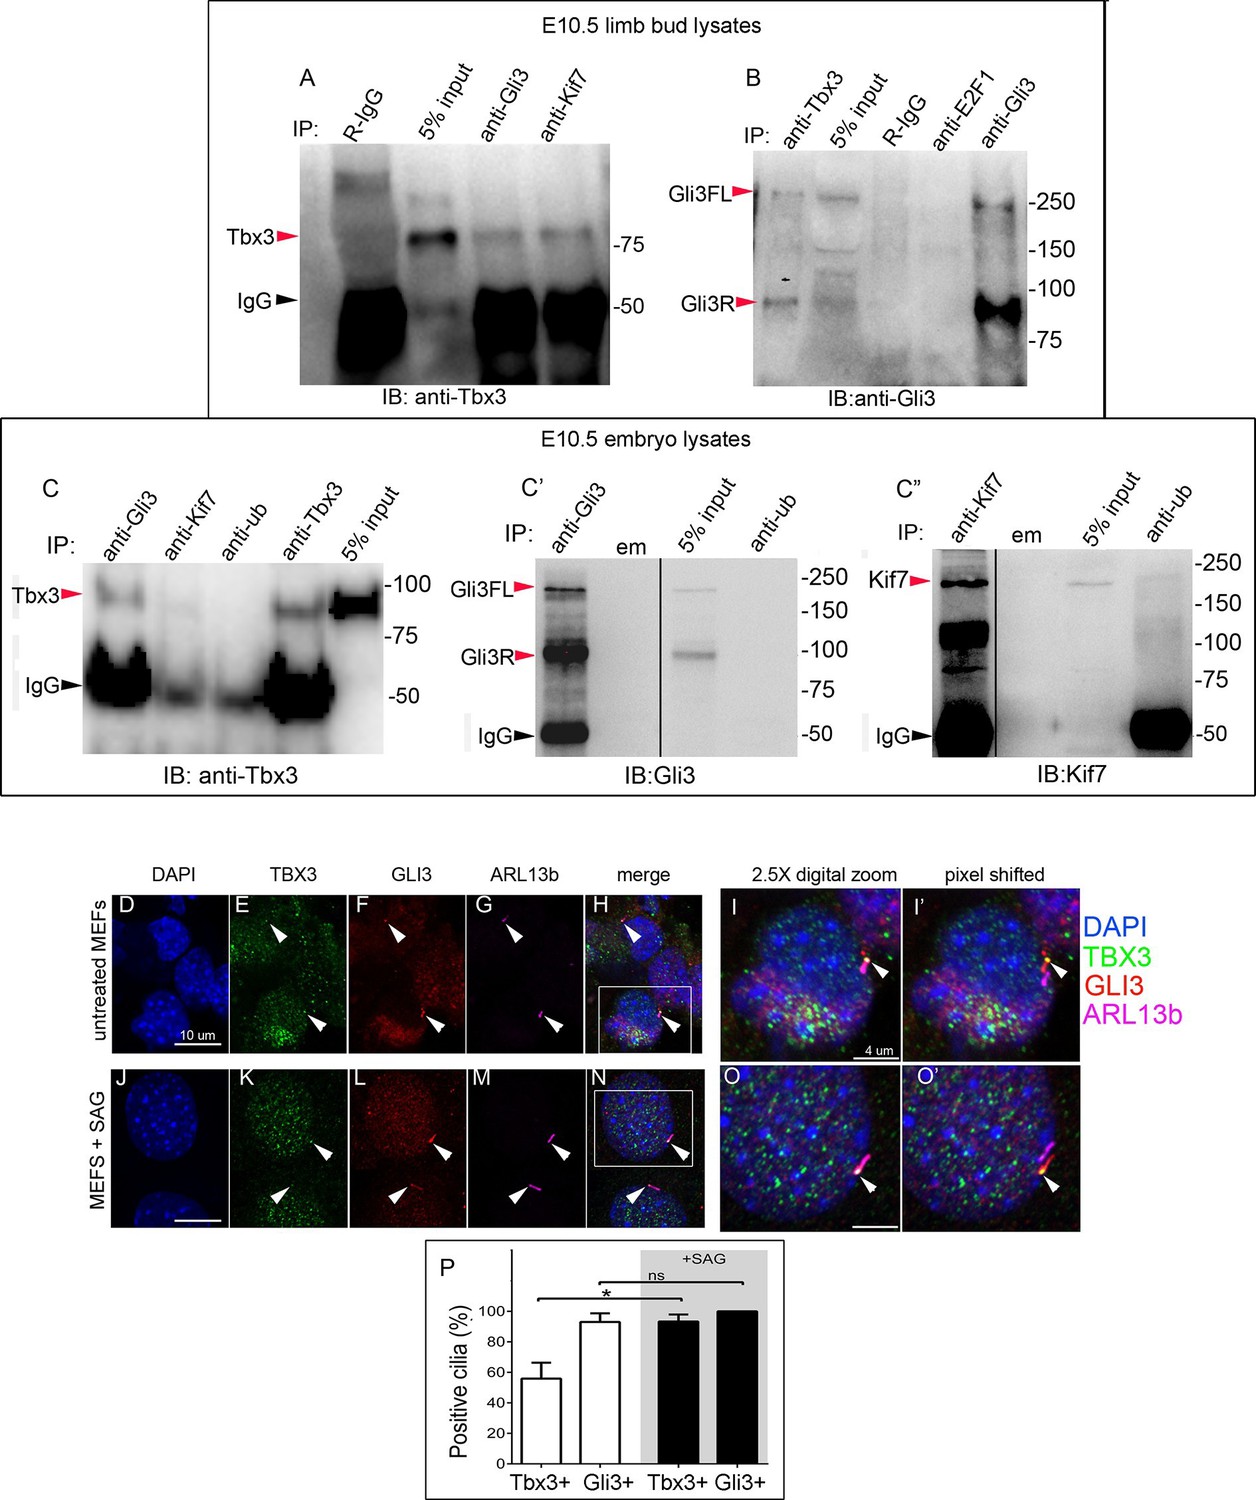
(A, B) Immunoprecipitation (IP) of E10.5 forelimb bud protein lysates with antibodies listed at the top of panel and immunoblotted (IB) to detect Tbx3 (A) or Gli3 (B). Black arrowhead indicates IgG. Gli3FL and Gli3R (red arrowheads in B) both co-immunoprecipitate with Tbx3. (C) Immunoprecipitation (IP) of E10.5 whole embryo protein lysates with antibodies listed at the top of panel and immunoblotted to detect Tbx3. Tbx3 co-IPs with Gli3. Specificity and efficiency of anti-Gi3 and anti-Kif7 antibodies in whole embryo lysates tested are shown in panels C’ and C”. Additional experiments demonstrating Tbx3/Gli3 interactions are in Figure 7—figure supplement 1. Em, empty lane (D–I’) Confocal 100X single Z-plane immunofluorescence images of vehicle (DMSO) treated MEFS after immunostaining for: DAPI (DNA, blue), Tbx3 (green, Frank et al., 2013), Gli3 (red), Arl13b (pink, cilia). Panel H is merged image of (D–G). Panel I is 2.5X digital zoom of the boxed cell in panel H, and I’ shows the pink (cilia) channel pixel shifted to permit visualization of colocalized Tbx3 and Gli3 (yellow) within the cilia. White arrowheads highlight Gli3/Tbx3 colocalization. Please see Figure 7—source data 1 for z-stacks. (J–O’) As above, but MEFS were treated with SAG in DMSO. Please see Figure 7—source data 2 for z-stack. (P) Quantitation of Tbx3+ and Gli3+ cilia in MEFS -/+ SAG. SAG treatment causes the majority of cilia to become Tbx3+ and these ciliary Tbx3 signals all colocalize with Gli3.
-
Figure 7—source data 1
Czi file showing z-stack of wild type MEFs imaged in Figure 7 panel D-I’.
- https://doi.org/10.7554/eLife.07897.034
-
Figure 7—source data 2
Czi file showing z-stack of SAG treated MEFs imaged in Figure 7 panel J-O’.
- https://doi.org/10.7554/eLife.07897.035
Figure 7—figure supplement 1
Tbx3 and Gli3 coimmunoprecipitate in whole embryo protein lysates.
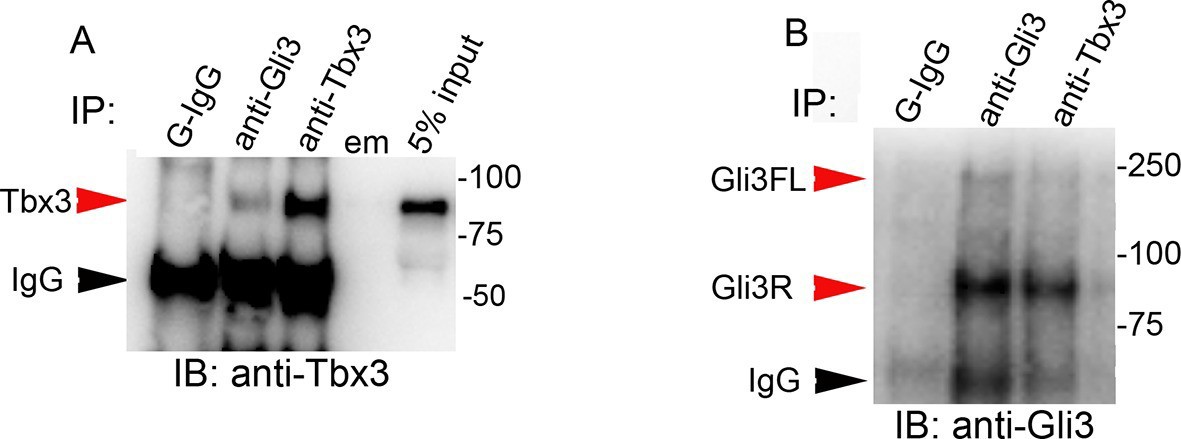
(A, B) Immunoprecipitation (IP) of E10.5 whole embryo protein lysates with antibodies listed at top of panels and immunoblotted (IB) to detect Tbx3 (A) or Gli3 (B). Black arrowhead indicates IgG. Gli3FL and Gli3R (red arrowheads in B) both co-immunoprecipitate with Tbx3. Em, empty lane
Figure 7—figure supplement 2

Tagged Tbx3 does not co-IP with tagged Gli3 in HEK293 cells.
Co-IP assay of Myc-tagged Tbx3 and Flag-tagged Gli3 overexpressed in HEK293 cells. IP was performed with antibodies listed at top and immunoblotted for Gli3. Myc-tagged Tbx3 does not interact with tagged Gli3.
Figure 7—figure supplement 3

Tbx3 does not co-IP with Sufu or Spop in mouse embryo lysates.
(A, B) Immunoprecipitations/Immunoblot assaying for interaction between endogenous Tbx3 and Sufu in E10.5 mouse embryo lysates. Sufu did not co-IP Tbx3 (A) nor did Tbx3 co-IP Sufu (B). (C) Immunoprecipitations/Immunoblot assaying for interaction between Tbx3 and Spop in control and Tbx3Δfl/Δfl E10.5 mouse embryo lysates. No interaction was detected. Note increased Spop in mutant, consistent with previous result in Figure 4J and data in Figure 8—figure supplement 1.
Figure 8 with 2 supplements
Altered stoichiometry of interactions between Gli3 and members of its processing/degradation complex.
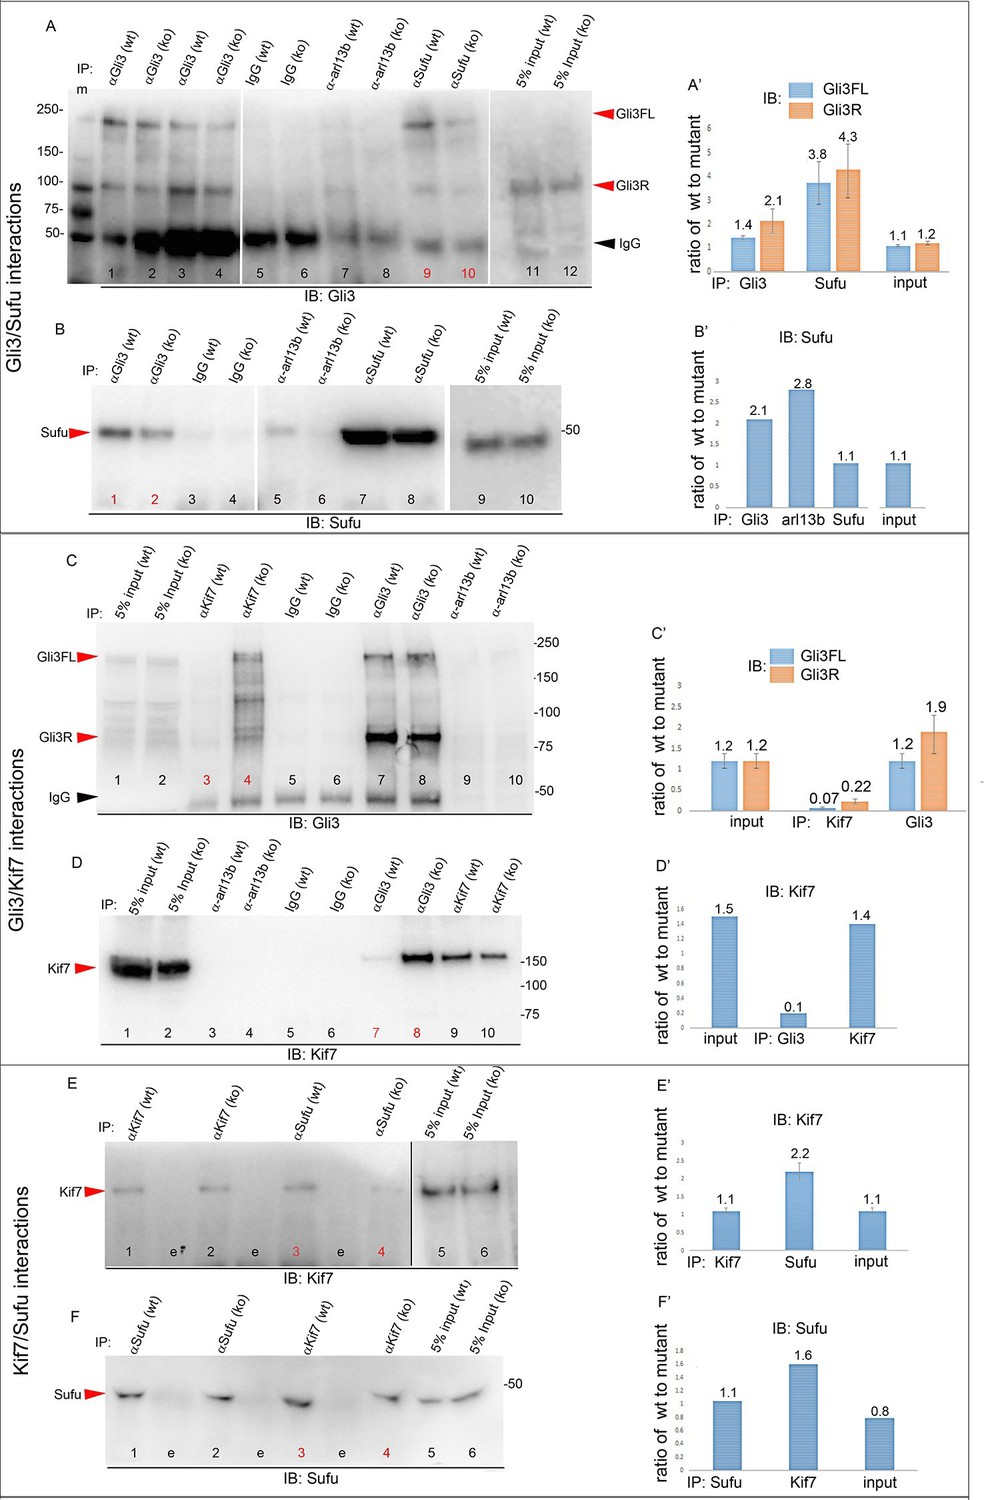
(A) Anti-Gli3 immunoblot (IB) on immunoprecipitates (IP) from antibodies listed at top on lysates from E10.5 control (wt) and Tbx3Δfl/Δfl (ko) embryos. Gli3FL and Gli3R are denoted by red arrowheads, IgG heavy chain with black arrowhead. Note decreased levels of IP’d Gli3FL and Gli3R in mutants compared with controls; the IPs in lanes 1–2 and 3–4 are two independent biologic replicates and the band intensity ratio of control to mutant for both GliFL and Gli3R was ~1.6. The interaction between Gli3 and Sufu is decreased more than can be explained by the overall decrement in Gli3 protein levels: in this representative experiment Sufu co-IPs 4.6X more Gli3FL in controls than in mutants (lane 9 versus 10). (A’) Bar graphs show the results of quantitation of band intensities from three3 replicate experiments measured with densitometry and presented as the ratio of signal detected in controls relative to mutants. (B) As in A but immunoblot probed for Sufu. Comparison of lanes 1 and 2 confirms decreased interaction between Gli3 and Sufu, despite preserved levels of Sufu in the mutants (lane 10). (C) Anti-Gli3 immunoblot with IPs as listed at top. Note increased interaction between Kif7 and Gli3 in mutants (lane 4), despite overall decreased level of Gli3 (lane 8). (C’) Quantitation of band intensities from three replicate experiments measured with densitometry and presented as a ratio of signal detected in control relative to mutant. Even though there is less total Gli3 protein, since there is increased interaction between Gli3 and Kif7 in mutants, the Kif7 co-IP control to mutant ratios are <1. (D) Anti-Kif7 immunoblot with IPs as listed at top. Confirms increased interaction between Gli3 and Kif7 in mutants. (D’) Quantitation of experiment in D. (E) Anti-Kif7 immunoblot with IPs as listed at top. The interaction of Kif7 and Sufu is decreased in the absence of Tbx3 (lane 4) despite preserved levels of both proteins (lane 6; Figure 8, panels B, D and F; Figure 8—figure supplements 1 and 2). (E’) Quantitation of band intensities from two replicate experiments measured with densitometry and presented as ratio of signal detected in control relative to mutant. There is 2 fold less interaction between Kif7 and Sufu in mutants. (F) Anti-Sufu immunoblot with IPs as listed at top. The interaction of Kif7 and Sufu is decreased in the absence of Tbx3 (lane 3 versus 4). (F’) Quantitation of findings in F.
Figure 8—figure supplement 1
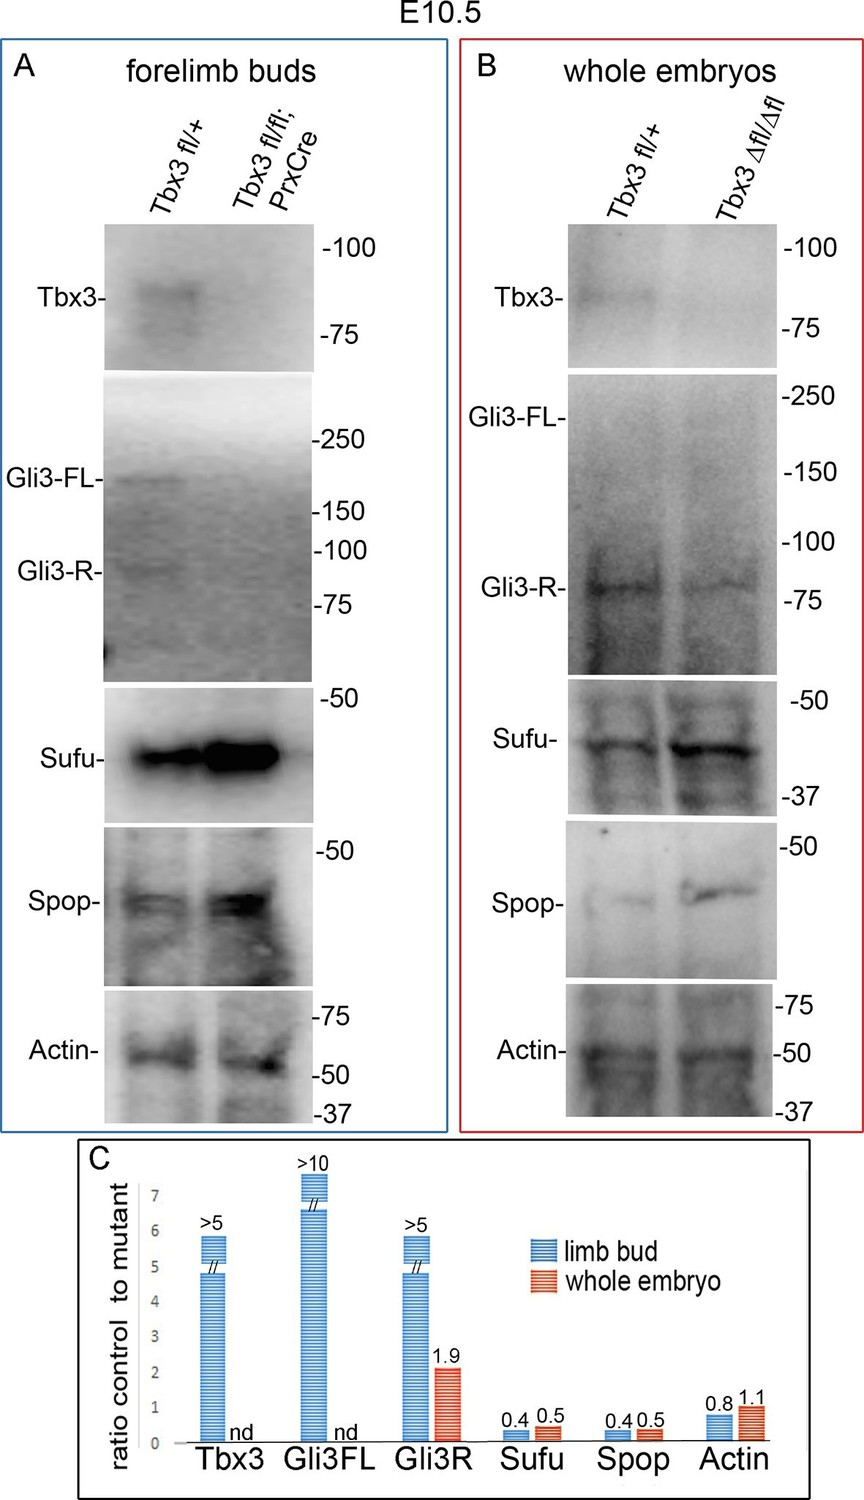
Altered protein levels observed in mutant limb buds are also apparent in whole embryos.
(A, B) Immunoblots on protein lysates prepared from E10.5 forelimb buds (A) and whole embryos (B). Actin is loading control. (C) Quantitation of protein levels in A and B comparing amount detected in control to mutant. Note increased levels of Sufu and Spop in mutant limbs and embryos that results in ratios of control to mutant <1. nd, not detected
Figure 8—figure supplement 2
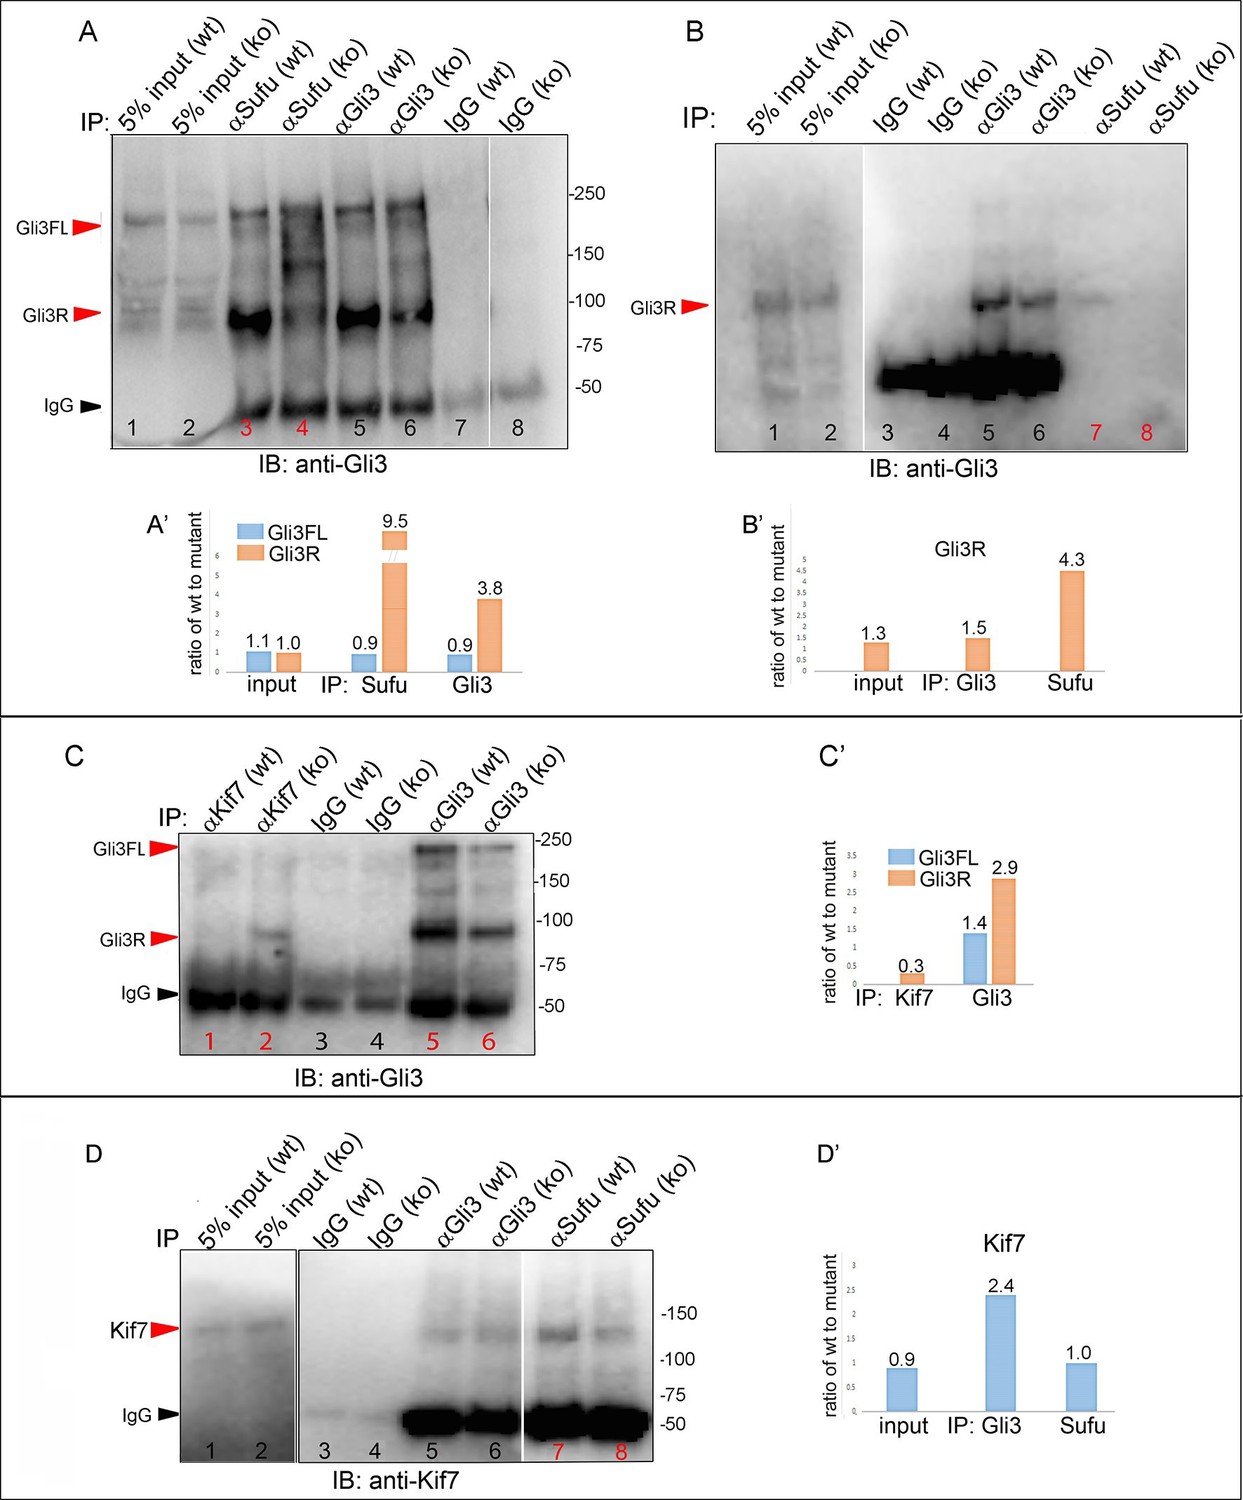
Replicate experiments confirming altered stoichiometry of interactions between Gli3 and members of its processing complex in Tbx3 mutants.
(A) Anti-Gli3 immunoblot (IB) on immunoprecipitates (IP) from antibodies listed at top on lysates from E10.5 control (wt) and Tbx3Δfl/Δfl (ko) embryos. Gli3FL and Gli3R are denoted by red arrowheads, IgG heavy chain by black arrowhead. Note decreased levels of IP’d Gli3R in mutants (lane 4) compared with control (lane 5). (A’) Quantitation of IPd proteins detected in A. The interaction between Gli3R and Sufu is decreased more than can be explained by the overall decrement in Gli3R protein levels: in this experiment, >9 fold more Gli3R co-IPs with Sufu in controls than mutants (lanes 3 versus 4), whereas the decrement in Gli3R is only 3.8 fold (lanes 5 versus 6). (B, B’) Additional replicate co-IP experiment confirming decreased interaction between Gli3R and Sufu (lanes 7 and 8) in excess of decrement in overall Gli3R level (lanes 5 and 6). (C, C’) Anti-Gli3 immunoblot (IB) and quantitation of IPs from antibodies listed at top on lysates from E10.5 control (wt) and Tbx3Δfl/Δfl (ko) embryos. 3.3 fold more Gli3R co-IPs with Kif7 in mutants (lane 2) than in controls (lane 1), despite an overall 2.9 fold decrease in Gli3R levels (lanes 5 versus 6). (D, D’) Anti-Kif7 immunoblot (IB) and quantitation of IPs from antibodies listed at top on lysates from E10.5 control (wt) and Tbx3Δfl/Δfl (ko) embryos. In this example, the amount of Kif7 that co-IPs with Sufu is decreased in 2.4 fold in Tbx3 mutants, consistent with previous results shown in Figure 8 panels E and F.
Figure 9
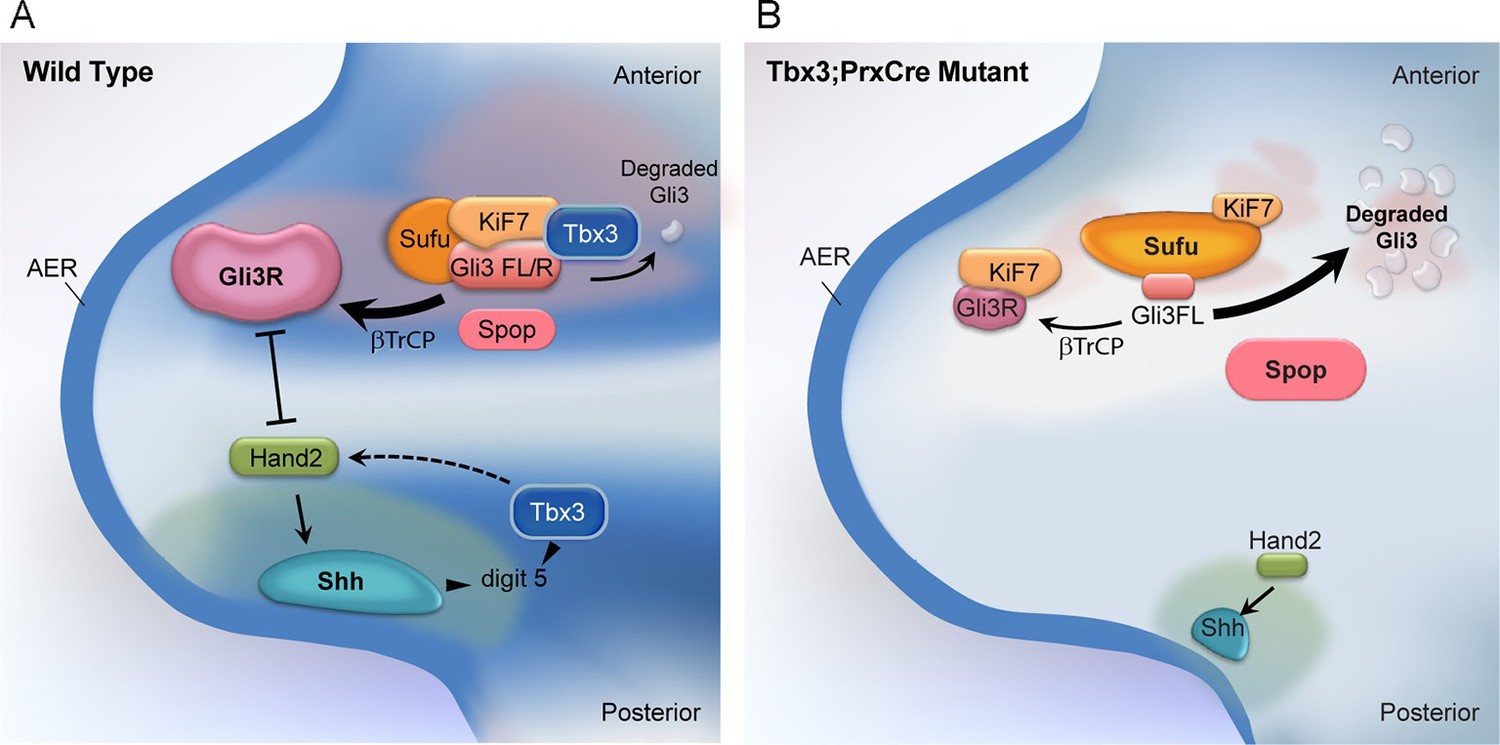
Model of compartment specific functions of Tbx3 in forelimb bud mesenchyme and altered interactions and stoichiometry of the Kif7/Sufu Gli3 processing complex in Tbx3;PrxCre mutants.
In posterior forelimb mesenchyme, Tbx3 is required for normal levels of Hand2 upstream of Shh. Shh pathway activity and other Tbx3-reponsive factors promote digit 5 formation. In the absence of Tbx3, there is decreased expression of Hand2 and Shh and other digit 5 promoting pathways. In anterior mesenchyme, Tbx3 is in a complex with Gli3 proteins, Kif7 and Sufu and required for the stability of Gli3 FL and Gli3R. In the absence of Tbx3, Sufu and Spop protein levels are increased yet there is decreased interaction between Sufu and Kif7, and Sufu and Gli3. In mutant anterior mesenchyme, Gli3FL is barely detected: it is either degraded or converted to Gli3R. Levels of Gli3R are abnormally low due to a combination of decreased amount of Gli3FL precursor and its processing to Gli3R, and excess degradation. These findings are consistent with decreased function of cilia and Kif7 (required for processing of Gli3FL to Gli3R), and of Sufu (required for stability of both Gli3FL and Gli3R).
Videos
Video 1
Adult Tbx3;PrxCre mutant mouse is healthy and mobile despite forelimb deformities.
https://doi.org/10.7554/eLife.07897.007Tables
Table 1
Increased severity of left limb defects in Tbx3;PrxCre mutants.
| Skeletal phenotypes: E13.5-adult | |||
|---|---|---|---|
| Loss of digit 5 | Bilateral | Left only | Right only |
| Tbx3 fl/+ or fl/fl | 0 | 0 | 0 |
| Tbx3fl/fl;PrxCre | 6 | 12 | 0 |
| Molecular phenotypes: gene expression | |||
|---|---|---|---|
| Expression pattern or level | Left = Right | Left >Right | Right > Left |
| Tbx3 fl/+ or f/fl | control | control | control |
| Tbx3fl/fl;PrxCre | 19 | 30 | 1 |
Additional files
-
Supplementary file 1
Differentially expressed transcripts detected by microarray of E10.25 control and Tbx3;PrxCre mutant forelimb buds.
Table contains statistically significant differentially expressed genes determined as described in Methods section. Column 1 contains mean processed signal intensity of 3 biologic replicates from control limb, column 2 contains mean processed signal intensity of 3 biologic replicates from mutant limb. Fold changes are shown in Column E (Ratio). Yellow highlight of Gene ID (column N) indicates finding reproduced by RNA-Seq.
- https://doi.org/10.7554/eLife.07897.043
-
Supplementary file 2
Differentially expressed transcripts detected by RNA-Seq of E11 control anterior forelimb buds versus control posterior forelimb buds.
Transcripts that are differentially expressed +/- 1.3 fold (+/- 0.38 in log base 2, column L) based on mean FPKM values in control posterior (CP, column O) compared to control anterior (CA, column P) limb segments. Values for each biologic replicate are in columns Q-T.
- https://doi.org/10.7554/eLife.07897.044
-
Supplementary file 3
Differentially expressed transcripts detected by RNA-Seq of E11 control posterior forelimb buds versus Tbx3;PrxCre posterior forelimb buds.
Transcripts that are differentially expressed +/- 1.3 fold (+/- 0.38 in log base 2, column L) based on mean FPKM values in mutant posterior (MP, column O) compared to control posterior (CP, column P) limb segments. Values for each biologic replicate are in columns Q-T.
- https://doi.org/10.7554/eLife.07897.045
-
Supplementary file 4
Differentially expressed transcripts detected by RNA-Seq of E11 control anterior forelimb buds versus Tbx3;PrxCre anterior forelimb buds.
Transcripts that are differentially expressed +/- 1.3 fold (+/- 0.38 in log base 2, column L) based on mean FPKM values in mutant anterior (MA, column O) compared to control anterior (CA, column P) limb segments. Values for each biologic replicate are in columns Q-T.
- https://doi.org/10.7554/eLife.07897.046
-
Supplementary file 5
qPCR primer sequences.
- https://doi.org/10.7554/eLife.07897.047
Download links
A two-part list of links to download the article, or parts of the article, in various formats.
Downloads (link to download the article as PDF)
Open citations (links to open the citations from this article in various online reference manager services)
Cite this article (links to download the citations from this article in formats compatible with various reference manager tools)
T-box3 is a ciliary protein and regulates stability of the Gli3 transcription factor to control digit number
eLife 5:e07897.
https://doi.org/10.7554/eLife.07897


