Enhancer additivity and non-additivity are determined by enhancer strength in the Drosophila embryo
- University of California, Berkeley, United States
- Princeton University, United States
Figures
Figure 1 with 1 supplement
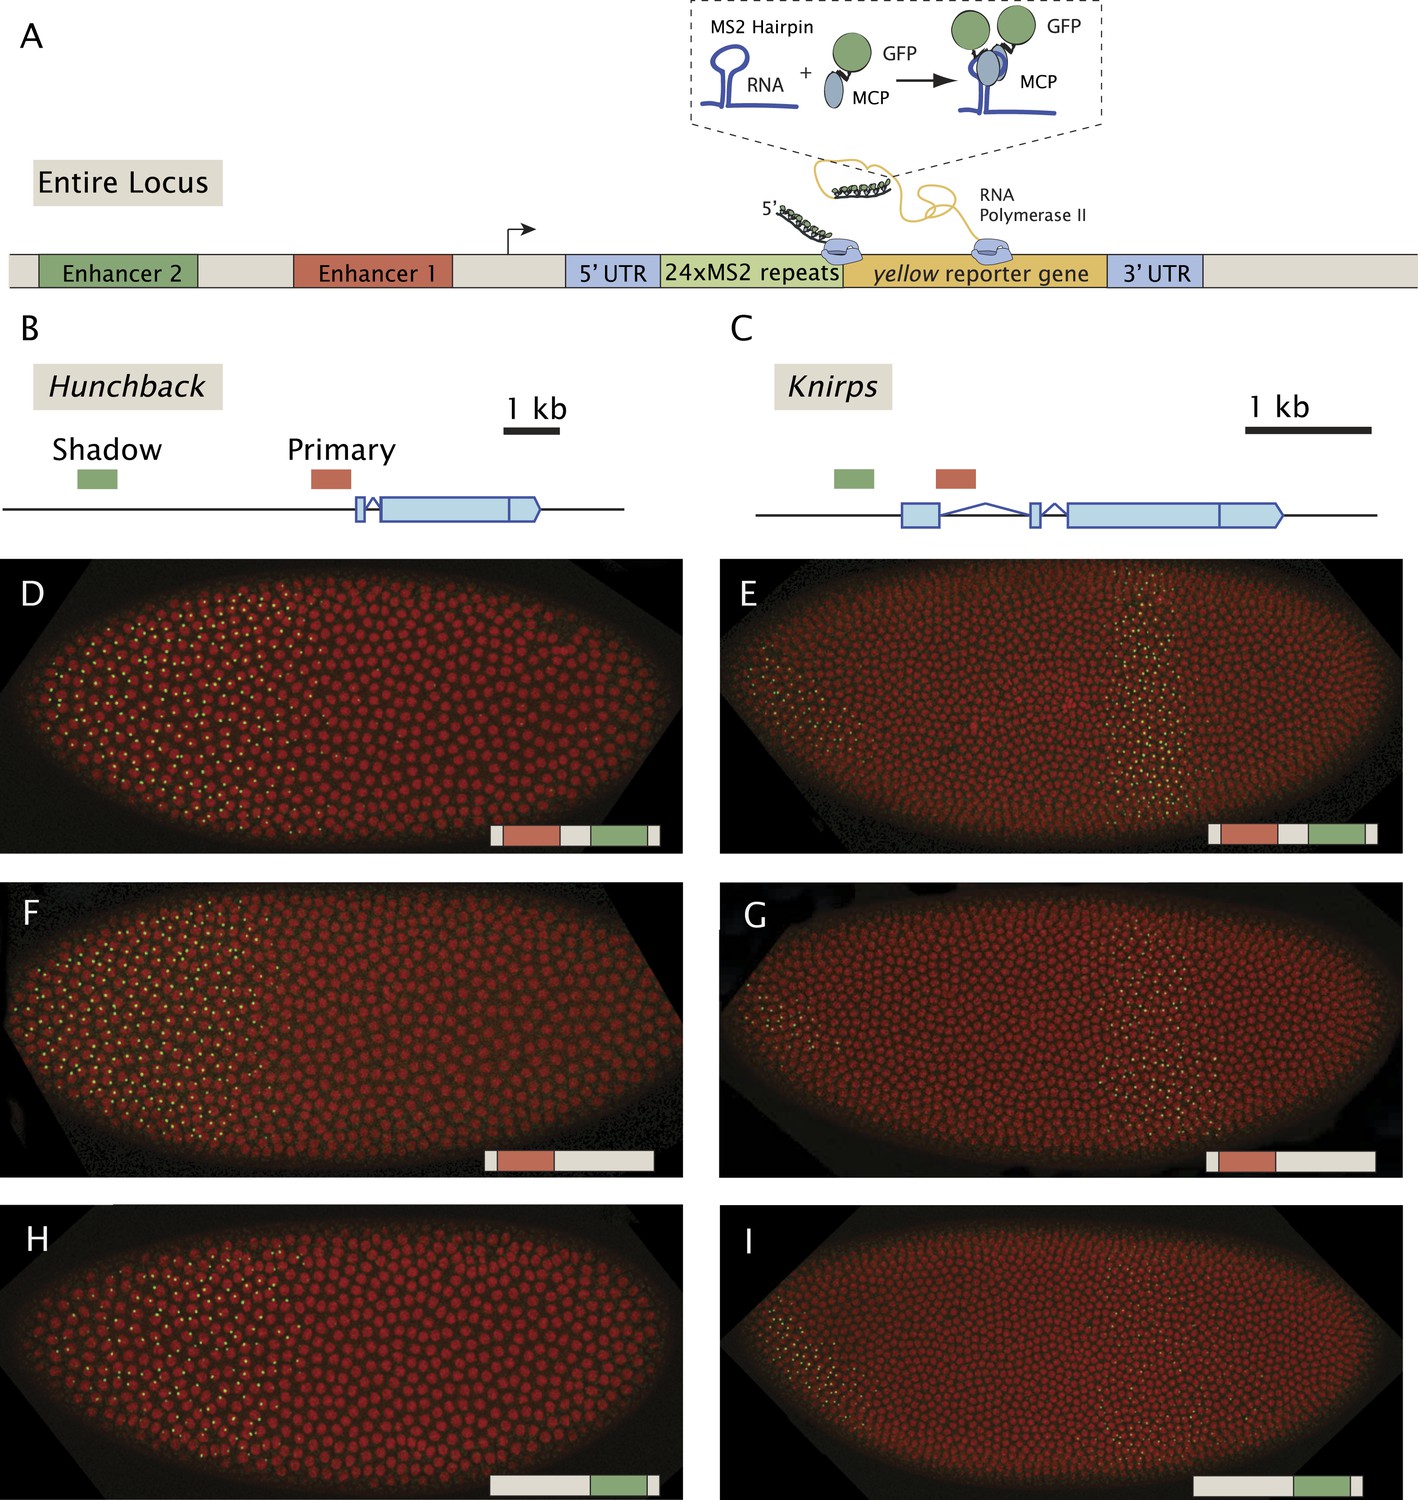
Live-imaging of transcriptional activity of hb and kni loci lacking different enhancers.
(A) General structure of the reporter constructs. A reporter construct with 24 repeats of the MS2 stem loops and the yellow gene was recombined into BACs spanning the hb and kni loci. The 5′ UTR and 3′ UTR of the endogenous genes were left intact. The MCP::GFP protein that binds to the MS2 stem loops is present in the unfertilized egg and in the early embryo. Gene models of (B) the hb and (C) kni loci showing the location of the primary and shadow enhancers (Perry et al., 2011). (D, F, H) Snapshots of Drosophila embryos expressing different versions of the hb BAC>MS2 reporter containing different combinations of the two enhancers 10 min into nuclear cleavage cycle 13 (nc13). The colored bar on the bottom right indicates which enhancer was removed. (E, G, I) Snapshots of Drosophila embryos expressing different versions of the kni BAC>MS2 reporter containing different combinations of the two enhancers in nc14.
Figure 1—figure supplement 1
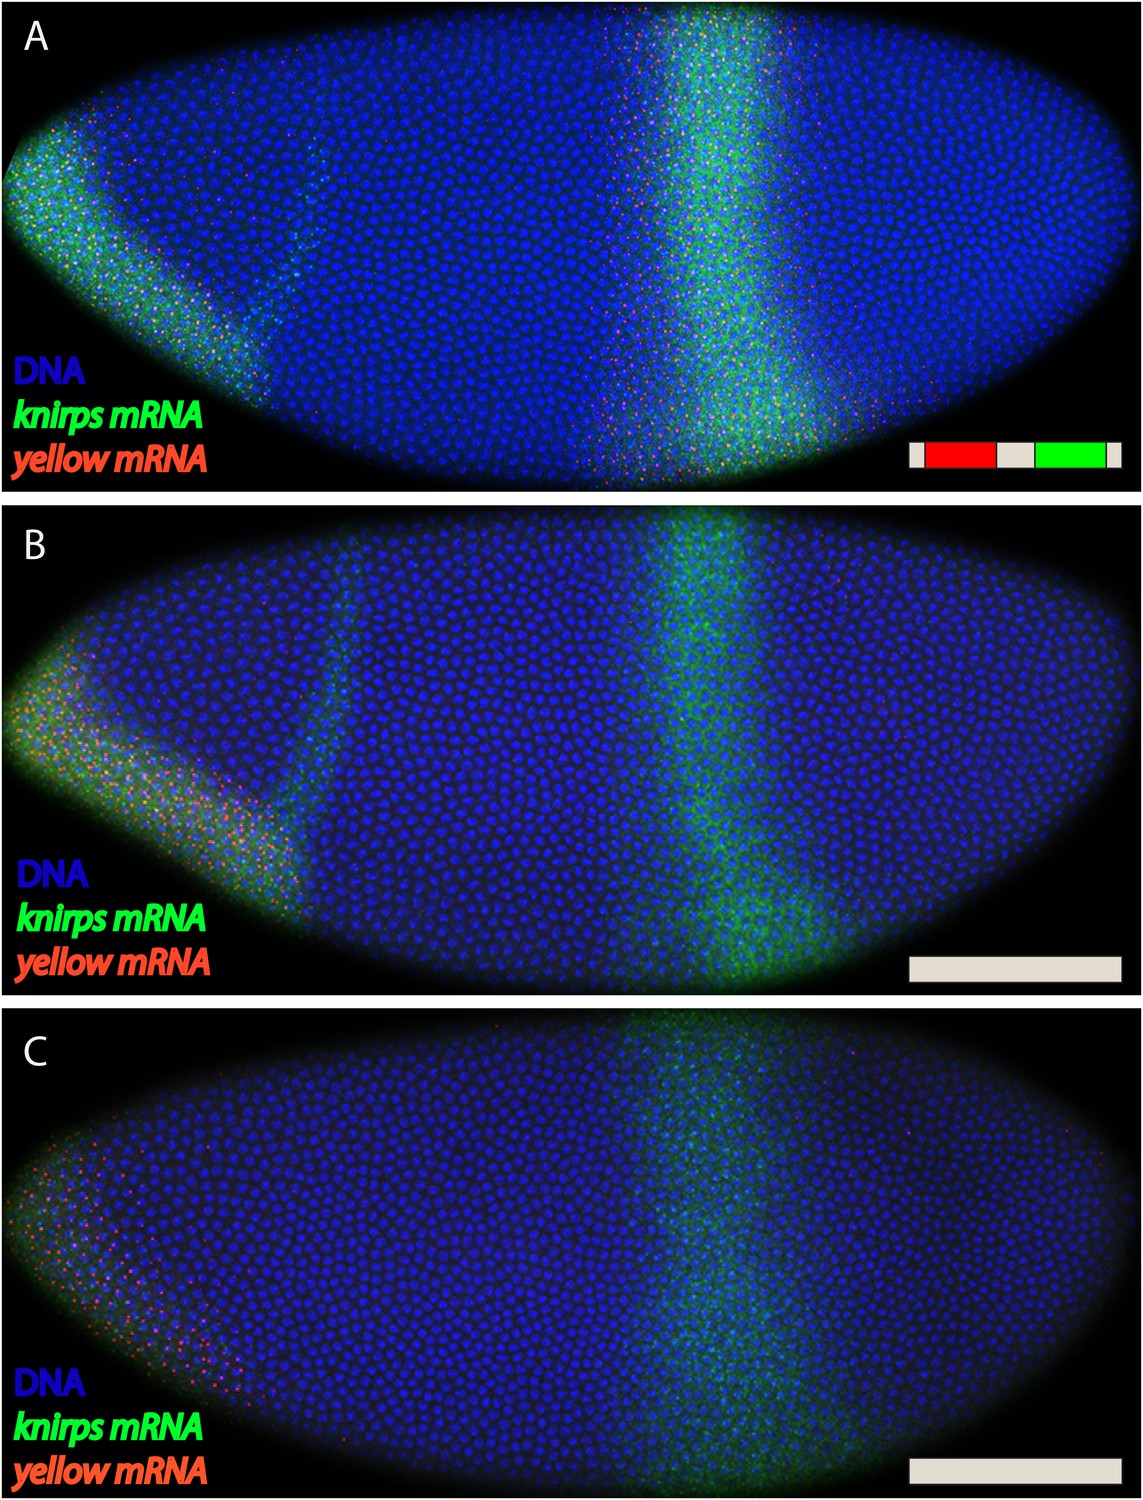
kni BAC expression lacking both shadow and primary enhancers.
Fluorescent in situ hybridization of endogenous kni and kni BAC>yellow transgenes. (A) Shows an embryo with the fully intact kni BAC>yellow transgene in late nc 14. (B, C) Show embryos with the kni BAC>yellow transgene lacking both primary and shadow enhancers, removing both enhancers abolishes all activity in the stripe domain. In (A) an embryo is in late nc14 and (B) shows and embryo in early nc 14.
Figure 2
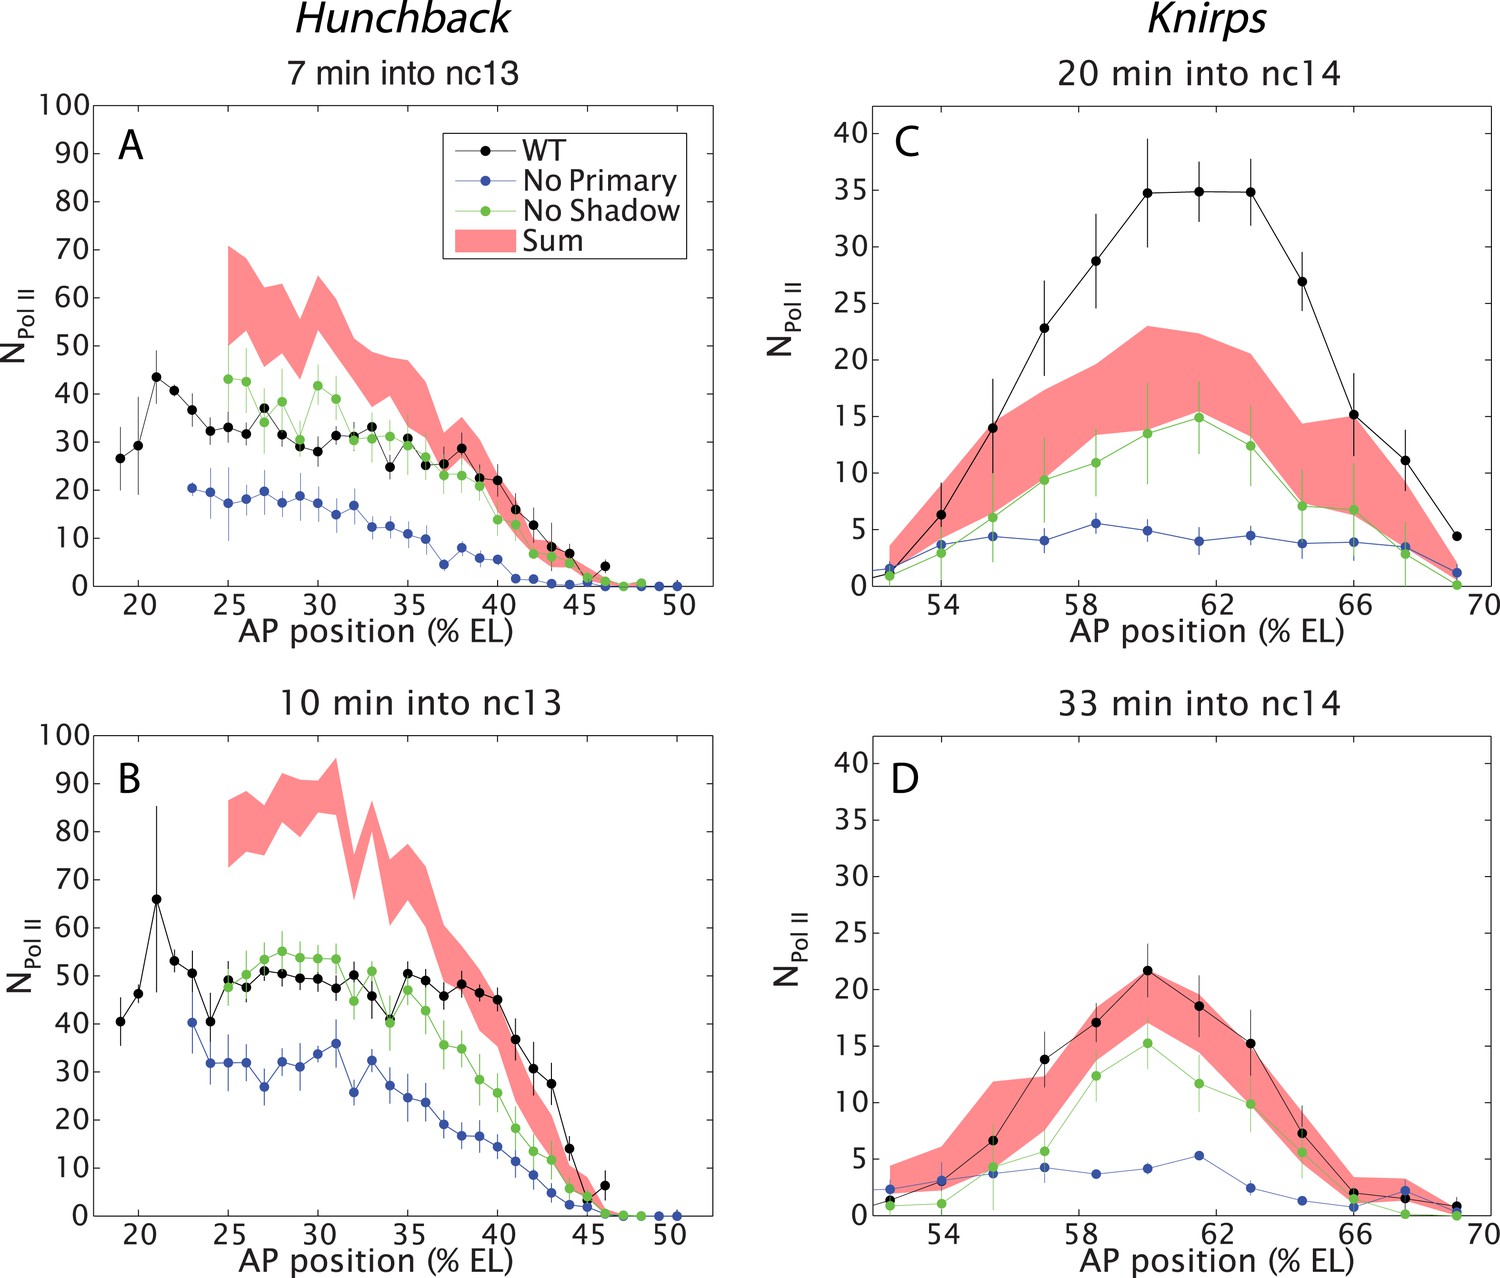
Combined effect of multiple enhancers as a function of AP position.
(A, B) Mean number of Pol II molecules transcribing per nucleus (NPol II) in the hb BAC reporters containing different combinations of enhancers as a function of AP position for two time points in nc13. NPol II is calculated by averaging data from at least three embryos at each AP position. The predicted sum of the individual enhancers is also shown. Note the additivity at the boundary vs the sub-additivity at the core, anterior domain of the pattern. (C, D) Mean number of Pol II molecules transcribing per nucleus (NPol II) in the kni BAC reporters in nc14 as a function of AP position. For kni, we see super-additive behavior in the beginning of nc14 which then becomes additive later in nc14. The absolute number of transcribing Pol II molecules was estimated following a previous calibration (Garcia et al., 2013). Error bars are the standard error of the mean over multiple embryos.
Figure 3
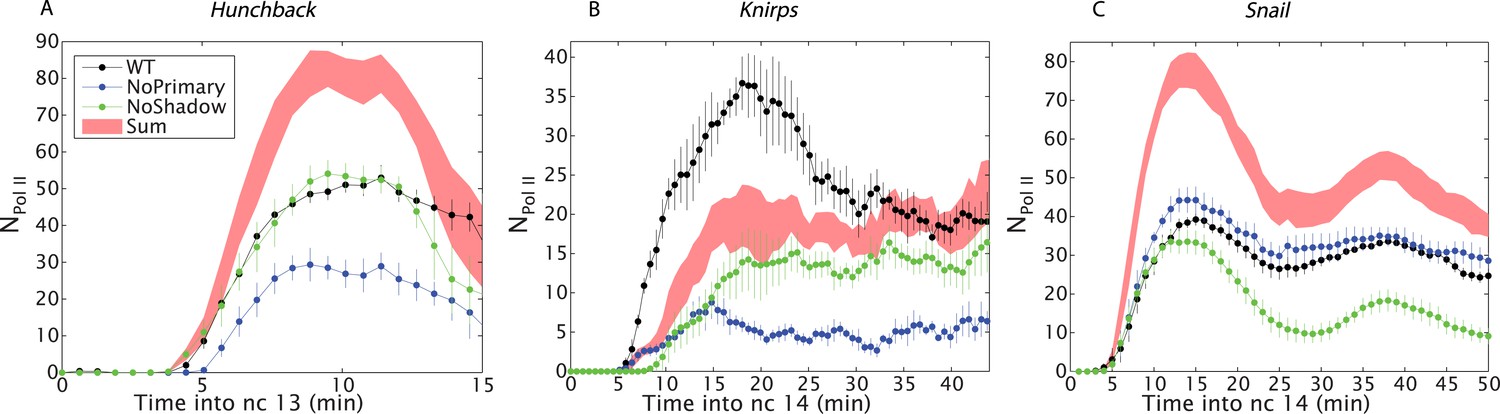
Combined effect of multiple enhancers as a function of time.
(A) Time course of the mean number of Pol II molecules transcribing per nucleus (NPol II) for the different hb BAC transgenes and sum of individual enhancers at 27% EL for the duration of nc13. (B) kni BAC transgenes activities and the sum of individual enhancer activity at 60% EL for the first 50 min of nc14. (C) sna BAC transgenes and the sum of individual enhancer activities averaged over the central mesoderm for the initial 50 min of nc14. Error bars are the standard error of the mean over multiple embryos.
Figure 4
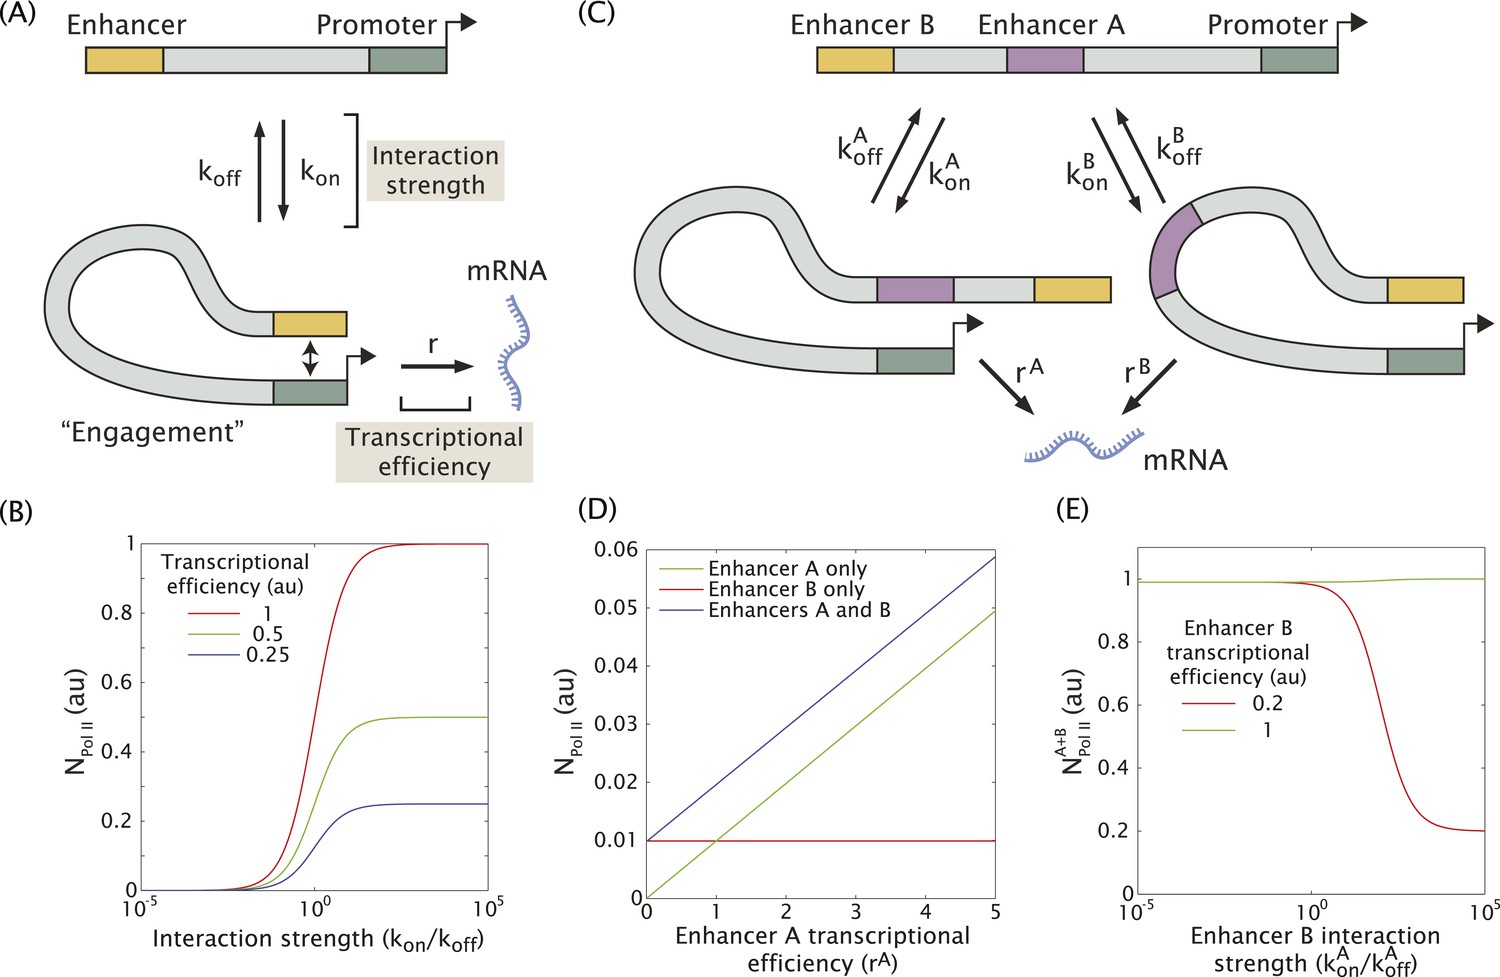
Model of enhancer–promoter interactions and its predictions for mRNA production.
(A) Minimal model of one enhancer engaging a promoter. kon and koff are the rates of promoter engagement and disengagement, respectively, and determine the interaction strength. r is the rate of mRNA production when the promoter is engaged and is a measure of the transcriptional efficiency. The mean number of Pol II molecules transcribing per nucleus (NPol II) is proportional to the rate of mRNA production. (B) As the interaction strength of a single enhancer is increased, the amount of mRNA produced increases up to a maximum value dictated by the transcriptional efficiency. (C) The model in (A) can be generalized to allow for multiple enhancers interacting with the same promoter. (D) In the regime where the interaction strength of both promoters is weak (kon/koff = 0.01), the amount of mRNA produced by having both A and B is simply the sum of the individual contributions of A and B, (r = 1). (E) In the regime where the interaction strength is large, the combined activity of both enhancers can be significantly less than the sum the individual enhancers. A less efficient enhancer A (rA = 0.2 au) can interfere with the more efficient enhancer B (rB = 1 au) such that their combined activity is significantly less than the sum of the activities of individual enhancers.
Figure 5
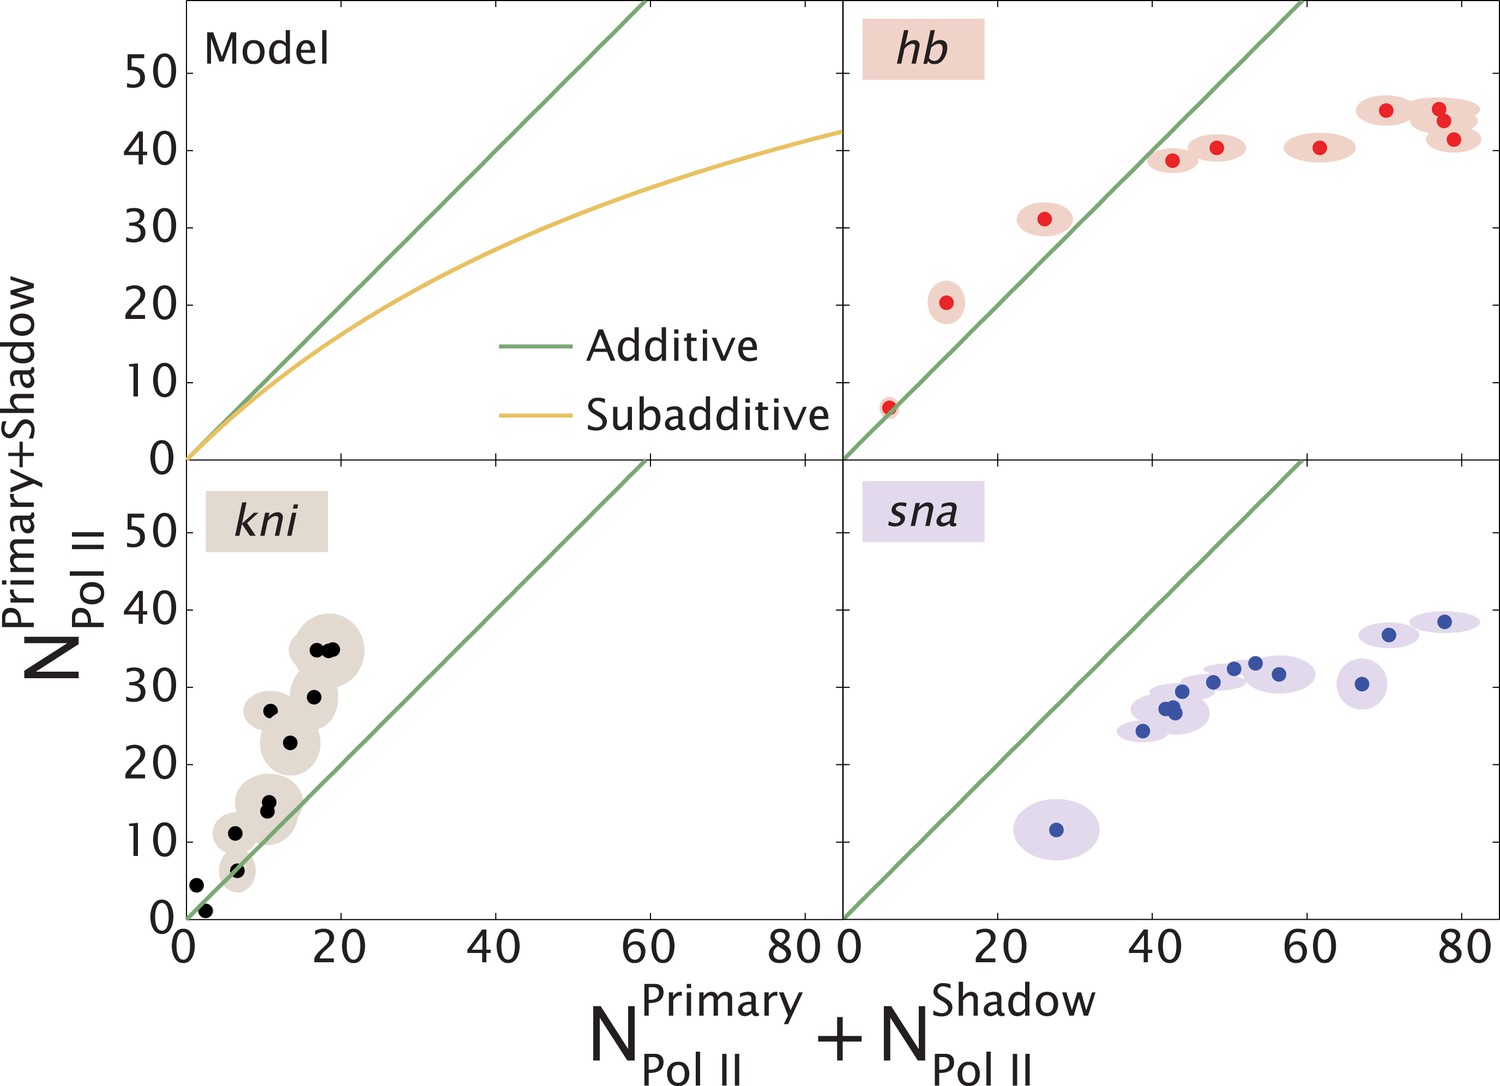
Theoretical expectation and experimental results showing different regimes of combined enhancer action.
(Upper left) Theoretical predictions (yellow) illustrating how the rate of mRNA production from both enhancers, , varies with the sum of the activity of the individual enhancers, (yellow). Mean number of Pol II molecules transcribing per nucleus (NPol II) is proportional to the rate of mRNA production. The green line shows perfect additivity for comparison. The model predicts additive behavior () when the rate of production is low and sub-additive behavior ( as the production rate increases. As the interaction strength of individual enhancers increases so does the rate of mRNA production, but the combined activity of both enhancers becomes sub-additive. (Upper right, lower left, lower right) Transcriptional activity of intact loci vs the sum of activities of individual enhancers for hb, kni, and sna at different times. A green line has been drawn in to indicate where is equal to . For hb and kni, the plots show data taken at different AP positions at 10 min into nc 13 and 20 min into nc 14, respectively, while for sna the datapoints were at different times. Ellipses indicate standard error of the mean.
Videos
Video 1
Dynamics of hunchback expression.
Maximum projection of hb BAC>MS2 transgene from nc10 to gastrulation, MCP::GFP in green and histone in red, anterior to the left and ventral view up. Time elapsed since the start of imaging is indicated in top left. The initial pattern is restricted to the anterior where expression is driven by the primary and shadow enhancers. In late nc13 the central domain enhancer starts to be expressed.
Video 2
Dynamics of knirps expression.
Maximum projection of kni BAC>MS2 transgene from nc10 to gastrulation, MCP::GFP in green and histone in red, anterior to the left and ventral view down. Time elapsed since the start of imaging is indicated in top left. The dynamics of the anterior and central parts of the pattern are evident.
Video 3
Dynamics of snail expression.
Maximum projection of snail BAC>MS2 transgene from nc10 to gastrulation, MCP::GFP in green and histone in red, anterior to the left and ventral view up. Time elapsed since the start of imaging is indicated in top left.
Download links
A two-part list of links to download the article, or parts of the article, in various formats.
Downloads (link to download the article as PDF)
Open citations (links to open the citations from this article in various online reference manager services)
Cite this article (links to download the citations from this article in formats compatible with various reference manager tools)
Enhancer additivity and non-additivity are determined by enhancer strength in the Drosophila embryo
eLife 4:e07956.
https://doi.org/10.7554/eLife.07956


