Inter-individual stereotypy of the Platynereis larval visual connectome
- Max Planck Institute for Developmental Biology, Germany
Figures
Figure 1 with 1 supplement
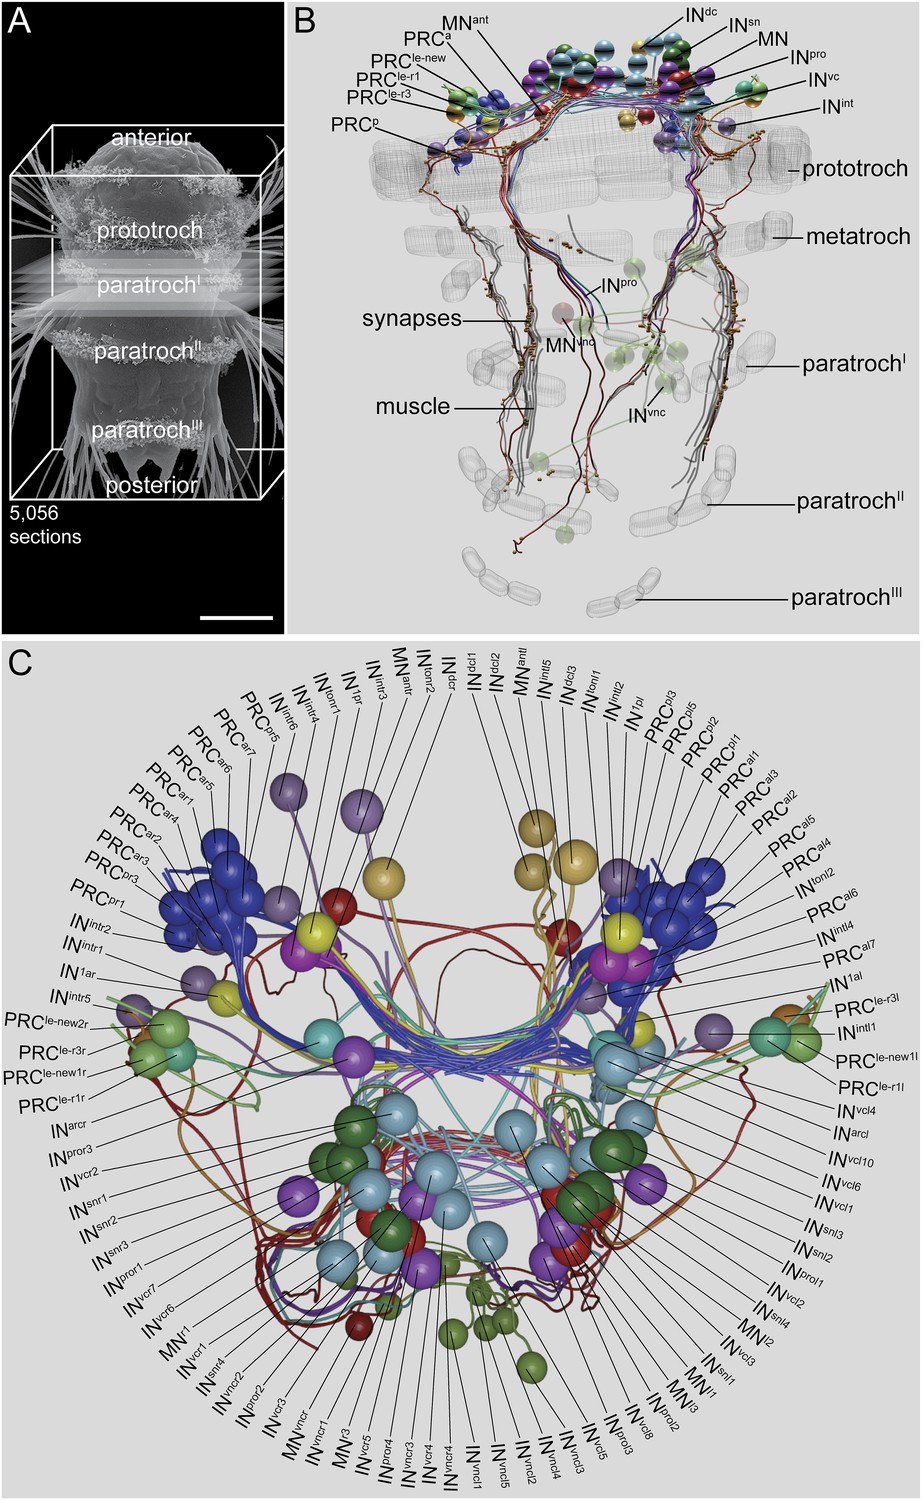
Visual eye and larval eyespot circuit reconstructed from a full-body dataset (HT9-4).
(A) Scanning electron micrograph of a 72 hpf larva, dorsal view. (B, C) Blender visualization of the cell complement in ventral (B) and anterior (C) views. IN1, primary interneuron; INarc, arc interneuron; INdc, dorsal interneuron; INint, intrinsic interneuron; INsn, Schnörkel-interneuron; INton, trans-optic neuropil interneuron; INpro, projection interneuron; INvc, ventral interneuron; INvnc, ventral nerve cord interneuron; MN, ventral motor neuron; MNant, anterior motor neuron; MNvnc, ventral nerve cord motor neuron; PRC, photoreceptor cell of the visual eye; PRCle-r1/3, photoreceptor cell of the larval eye, expressing r-opsin3 or r-opsin1; a, anterior; p, posterior; l, left; r, right. Scale bar in (A) 50 μm.
-
Figure 1—source data 1
Layer accounts of the sections and images of HT9-4.
- https://doi.org/10.7554/eLife.08069.003
Figure 1—figure supplement 1

Full connectivity matrix of the visual and larval eye circuit of the fully reconstructed larva HT9-4.
https://doi.org/10.7554/eLife.08069.004
Figure 2 with 2 supplements

Comparative analysis of HT9-3 and HT9-4 visual eye circuits.
(A) Geometric mean of the neuron types between both individuals, using the averaged synapse number of neuronal groups and the total synapse number on effectors. (B) Connectivity graph of the visual and larval eye circuit. Edges are weighted by averaged synapse number (neurons) or by sum of synapses (effectors). Nodes are colored using the color scheme of the neuron types. (C) Spearman correlation of the presynaptic and postsynaptic connections of cell groups in HT9-3 and HT9-4. Abbreviations are shown in Figure 1.
-
Figure 2—source data 1
Full, grouped, and reciprocal connectivity matrices of the eye circuit in HT9-4.
- https://doi.org/10.7554/eLife.08069.007
Figure 2—figure supplement 1
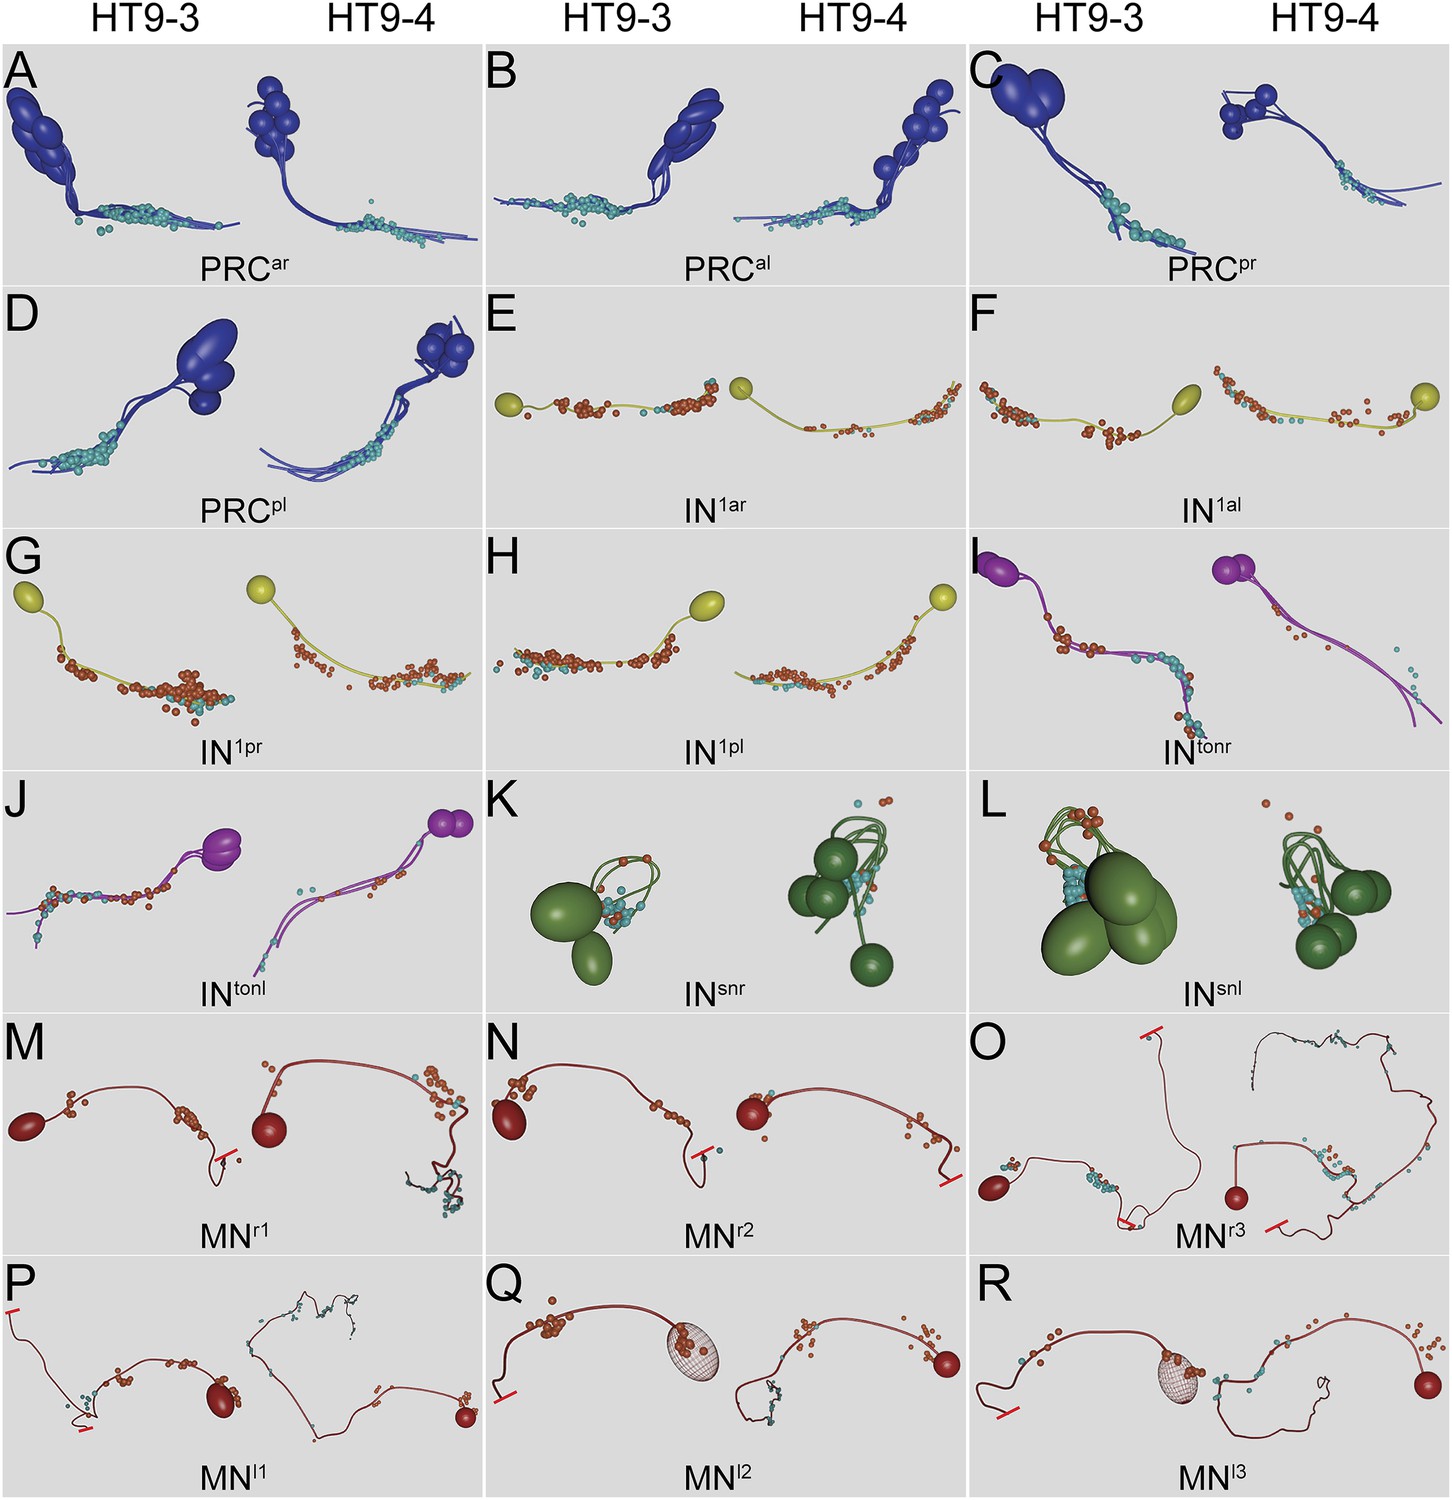
Comparison of the neuronal projections and synapse positions of both individuals.
Neuronal projections and synapse positions of (A) PRCar, (B) PRCal, (C) PRCpr, (D) PRCpl, (E) IN1ar, (F) IN1al, (G) IN1pr, (H) In1pl, (I) INtonr, (J) INtonl, (K) INsnr, (L) INsnl, (M) MNr1, (N) MNr2, (O) MNr3, (P) MNl1, (Q) MNl2, and (R) MNl3 cells in HT9-3 and HT9-4.
Figure 2—figure supplement 2
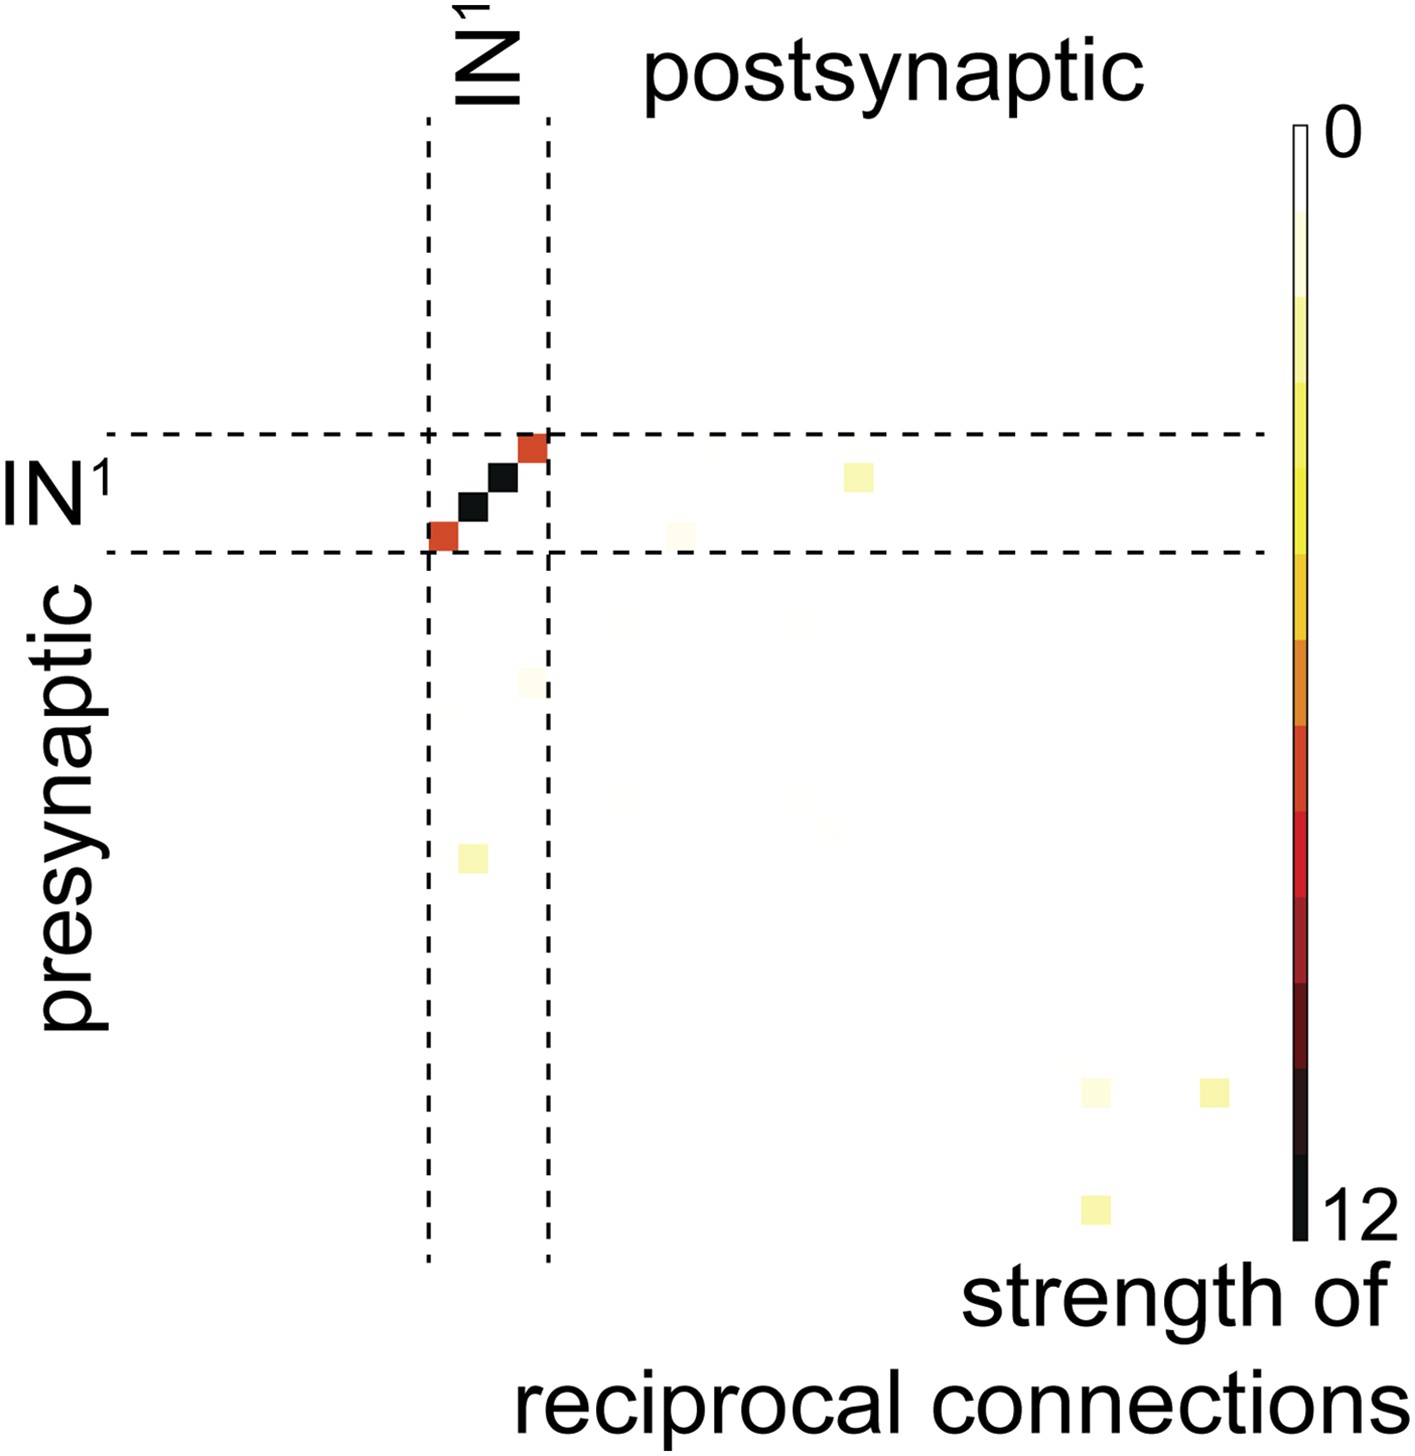
Reciprocal connection strength between all neuron pairs in the complete visual circuit (HT9-4).
Strength is defined as the geometric mean of the number of synapses of a given neuron ‘A’ on another neuron ‘B’ and the number of synapses of neuron ‘B’ on neuron ‘A’. Single neuron identifiers are not shown for simplicity.
Figure 3 with 1 supplement
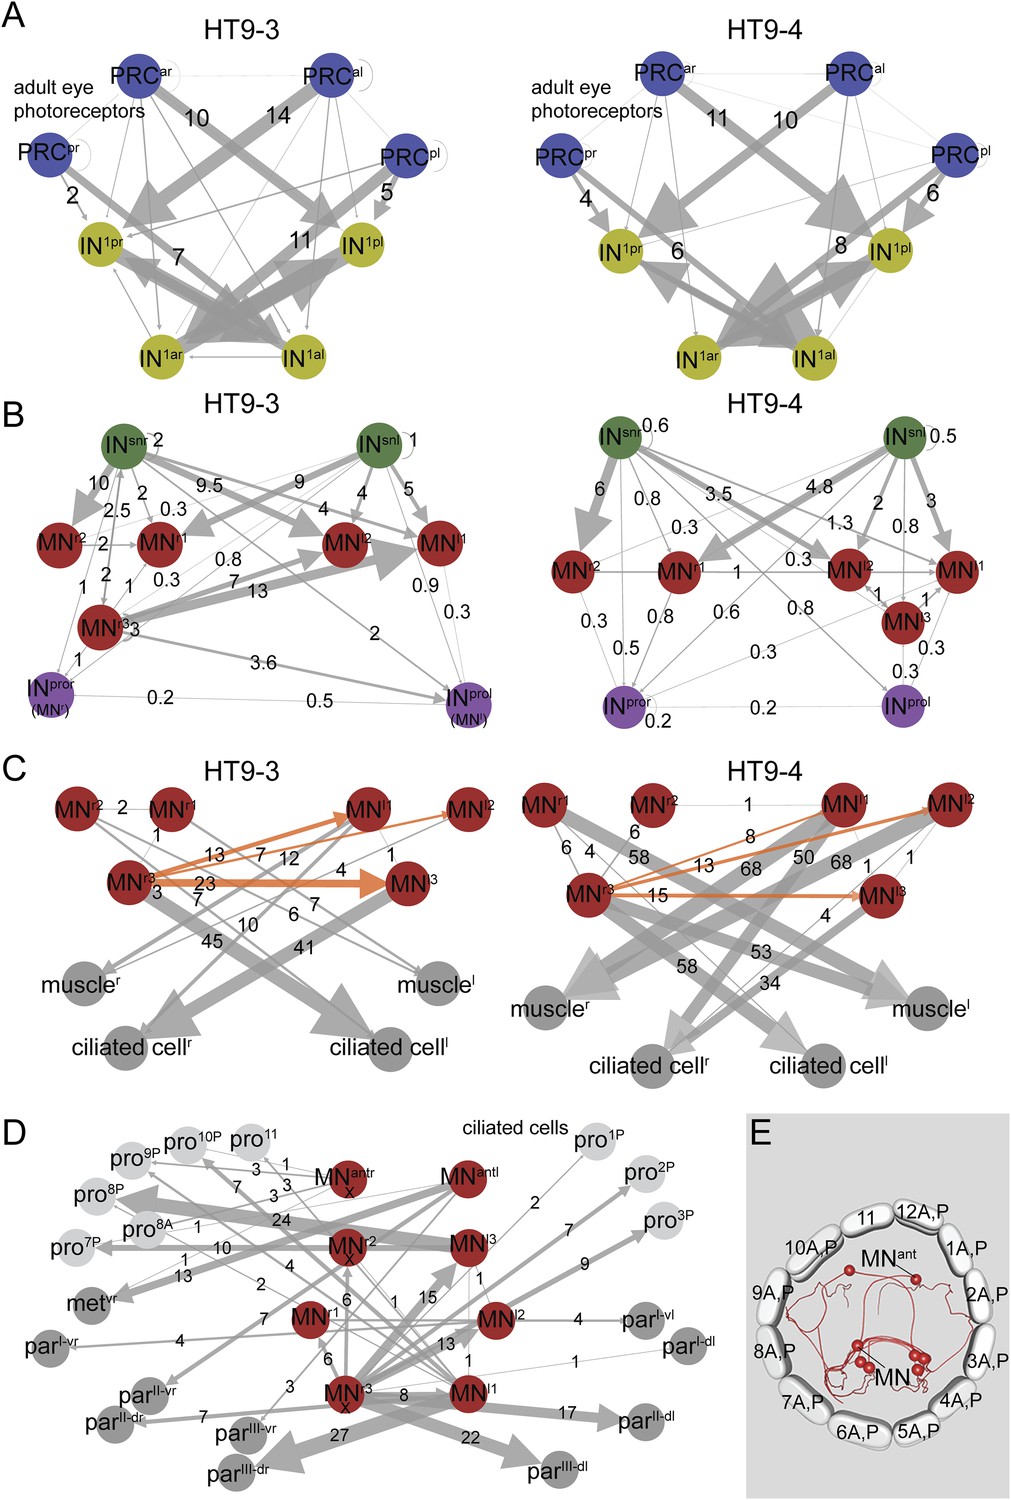
Subcircuits of the visual eye connectome of both individuals and the innervation of all ciliary bands in the fully reconstructed second larva (HT9-4).
(A–D) Connectivity graphs show the connectivity between selected neuron groups and effectors. Edges are weighted by the number of synapses. The number of synapses is also shown for each edge. Nodes are colored using the color scheme of the neuron types. In A–C, HT9-3 is left and HT9-4 right. (A) Connectivity graph of the grouped PRCs of the visual eyes with IN1 cells. The synapses of the PRCs from each eye are averaged. (B) Connectivity graph of INsn cells with MNs and INpro cells. The previous nomenclature of the INpro cells in HT9-3 identified as MNs is shown in brackets. (C) Connectivity graph of MNs and their effectors. The synapse numbers shown for ciliated cells and muscles represent the total number of synapses on groups of effector cells. (D) Connectivity graph of the MNs of the visual and larval eye circuit of HT9-4 with all ciliary bands. The synapse number of the metatroch and paratrochs are summed. Incompletely traced MNs are labeled with ‘X’. (E) Blender visualization of the MNs and prototroch cells, apical view. The prototroch cells are numbered in a clockwise fashion. The numbering of the MNs of the left and the right body side within a single larva is not consistent with anatomical pairs, to stick to the nomenclature introduced for HT9-3. Note that the prototroch cell in position 11 is unpaired. met, metatroch; par, paratroch; pro, prototroch; A, anterior; P, posterior. Additional abbreviations are shown in Figure 1.
Figure 3—figure supplement 1
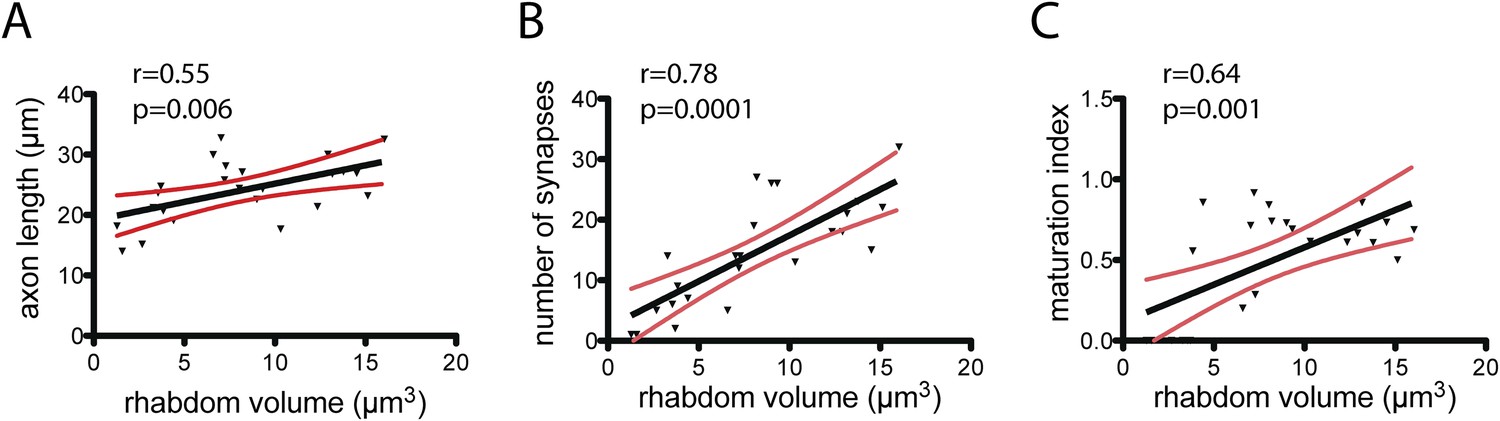
Maturation of photoreceptor connections in HT9-4.
(A) Relationship of rhabdom volume to photoreceptor axon length. (B) Relationship of rhabdom volume to photoreceptor synapse number. (C) Relationship of photoreceptor connectivity-maturation index to rhabdom volume. In A–C the black line shows linear regression with 95% confidence interval (red lines). Pearson r and p-value are shown.
-
Figure 3—figure supplement 1—source data 1
Development of photoreceptor connectivity in HT9-4.
- https://doi.org/10.7554/eLife.08069.012
Figure 4
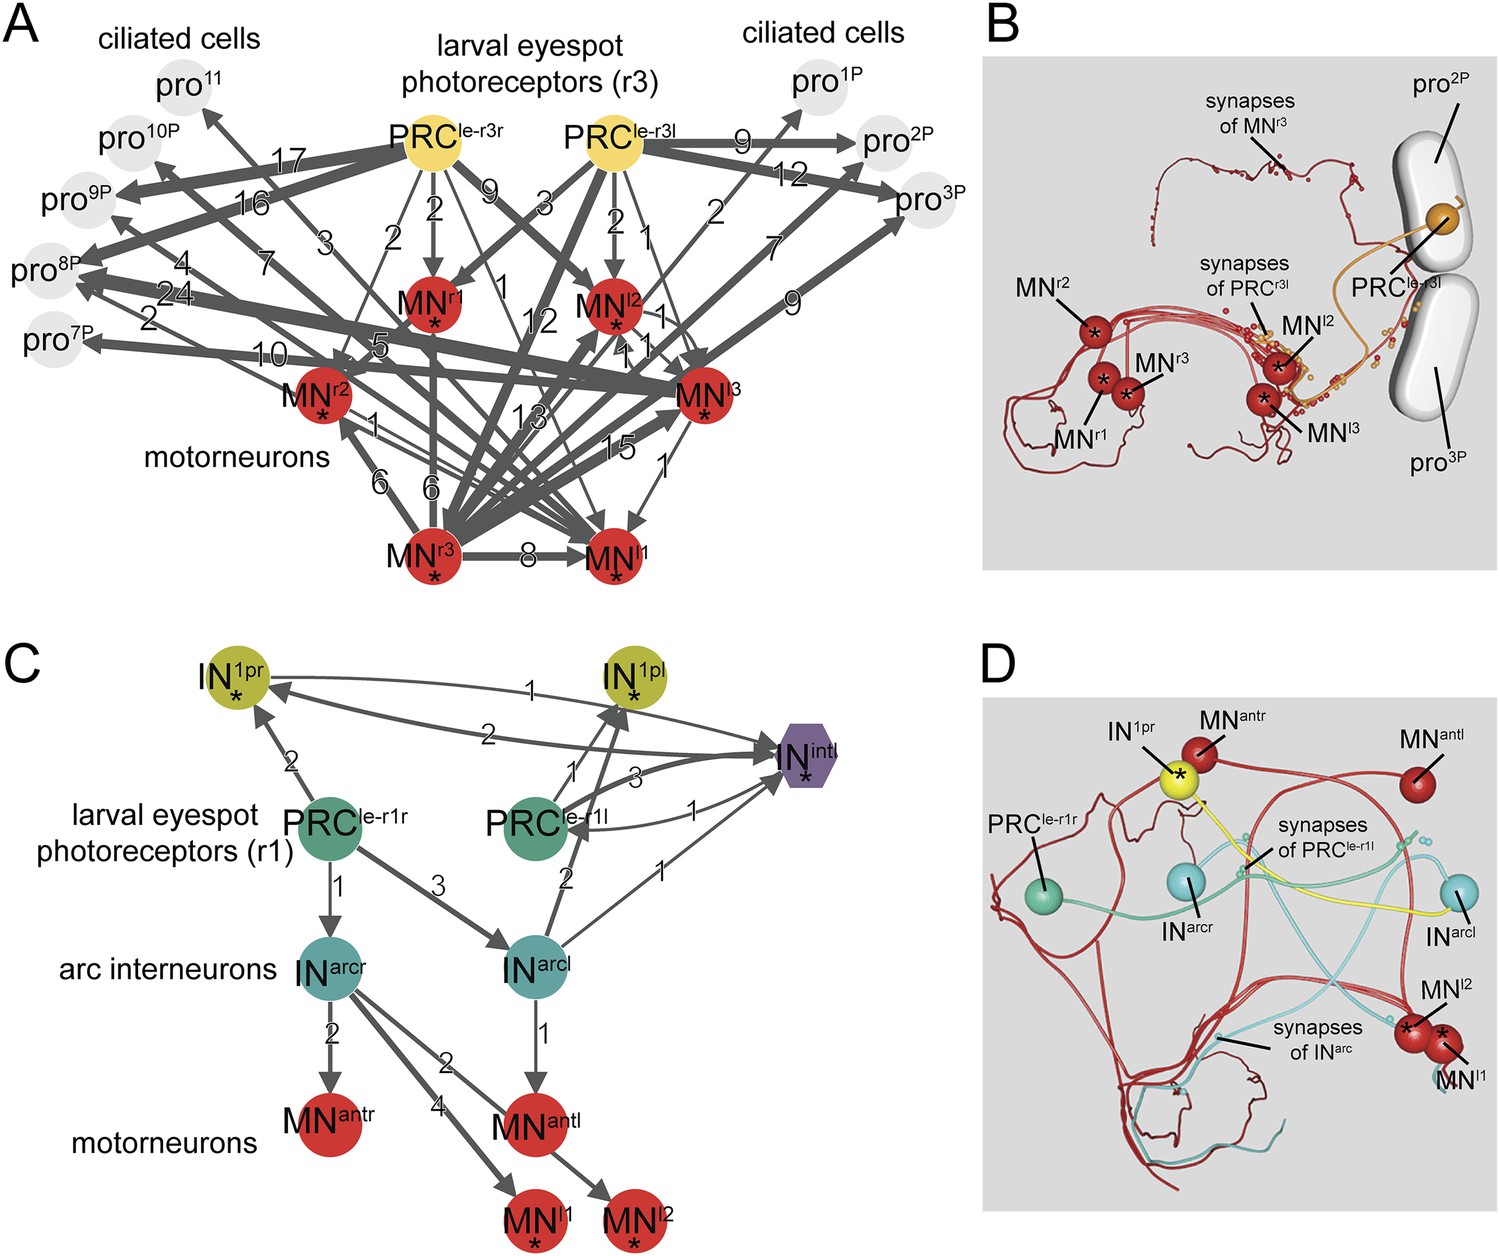
Minimal eye circuit of the larval eye.
Neurons that are also part of the visual eye circuit are marked by an ‘asterisk’. Connectivity graph of the r-opsin3-expressing PRCr3 (A) and r-opsin1-expressing PRCr1 (C). Connectivity graph edges are weighted by the number of synapses and synapse numbers are shown. Blender visualization of the left PRCr3l cell (B) and PRCr1r circuitry (D). Abbreviations are shown in Figure 1.
Videos
Video 1
3D visualization of the cell complement of the Platynereis larval visual and larval eye circuit.
https://doi.org/10.7554/eLife.08069.005Additional files
-
Source code 1
Blender file containing the visual eye and larval eyespot connectome reconstructed from HT9-4. The file contains the complete anatomical model and connectivity information of the reconstructed visual eye and eyespot circuit from the whole-body dataset of HT9-4. Blender can be downloaded from [http://www.blender.org/]. Display settings can be changed and the connectivity can be analyzed as described in (Asadulina et al., 2015).
- https://doi.org/10.7554/eLife.08069.014
Download links
A two-part list of links to download the article, or parts of the article, in various formats.
Downloads (link to download the article as PDF)
Open citations (links to open the citations from this article in various online reference manager services)
Cite this article (links to download the citations from this article in formats compatible with various reference manager tools)
Inter-individual stereotypy of the Platynereis larval visual connectome
eLife 4:e08069.
https://doi.org/10.7554/eLife.08069


