Episodic-like memory trace in awake replay of hippocampal place cell activity sequences
- Doshisha University, Japan
Figures
Figure 1 with 1 supplement
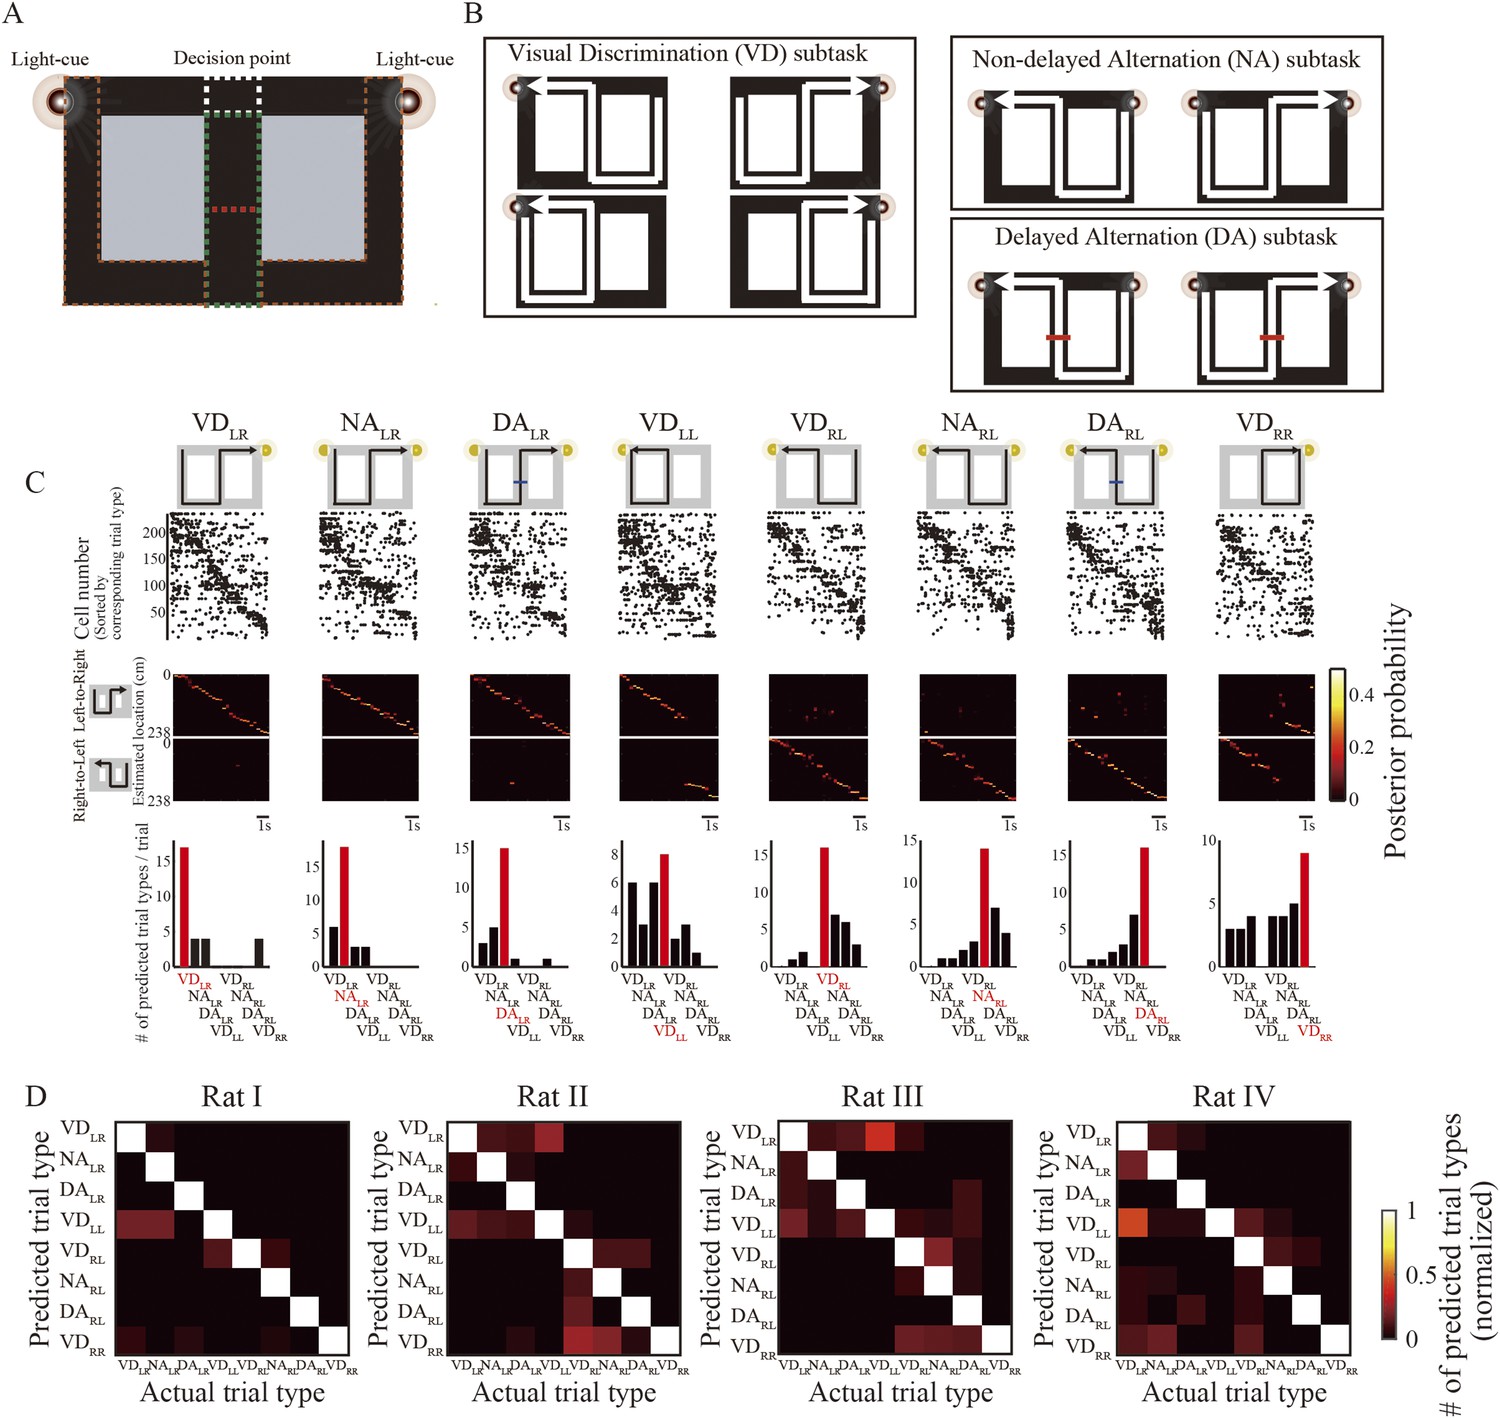
Decoding path and trial-type prediction during running.
(A, B) Task design and configuration. (A) Each task could only be identified at the decision point (junction; white dotted rectangle), because the rats could not see the visual cues until they reached that point even in the central maze stem (green dotted rectangle). If correct, the rats received electrical stimulation of the medial forebrain bundle (MFB) as a reward, beneath the visual cue. After receiving a reward, the rats always briefly stopped within the start zones (brown dotted rectangles). In the delayed spatial alternation (DA) subtask, the rats had to wait for 5 s in the maze stem, until the barrier wall (red dotted line) disappeared. (B) Visual cue configuration and possible journeys during task performance. In the visually guided discrimination (VD) subtask, one of the visual cues was illuminated to guide the rat towards its goal. However, in the non-delayed spatial alternation (NA) and DA subtasks, spatial memory retrieval was required for the rat to choose the opposite goal to the previous one, because both of the visual cues were illuminated. (C) Actual trial types are organized in eight columns. The topmost illustration describes actual trial type. Below that, representative raster plots show spiking activity recorded from rat I for each trial type in a single trial. Each dot represents an action potential. The middle graph in each column shows the posterior probability of paths decoded by the Bayesian decoder involving left-to-right (upper) and right-to-left (lower) journeys (values indicated by color bar at right). At the bottom of each column, a bar graph gives the number of predicted trial types by the trial-type prediction method. Note that the most frequently predicted trial type (red bar) matched the actual one (red label) for all trial types. (D) Confusion matrices between predicted and actual trial types for each rat during the entire session (values indicated by color bar at right). Note that the prominent diagonal line in each matrix shows that predicted trial type matched the actual one in most cases for all rats.
Figure 1—figure supplement 1
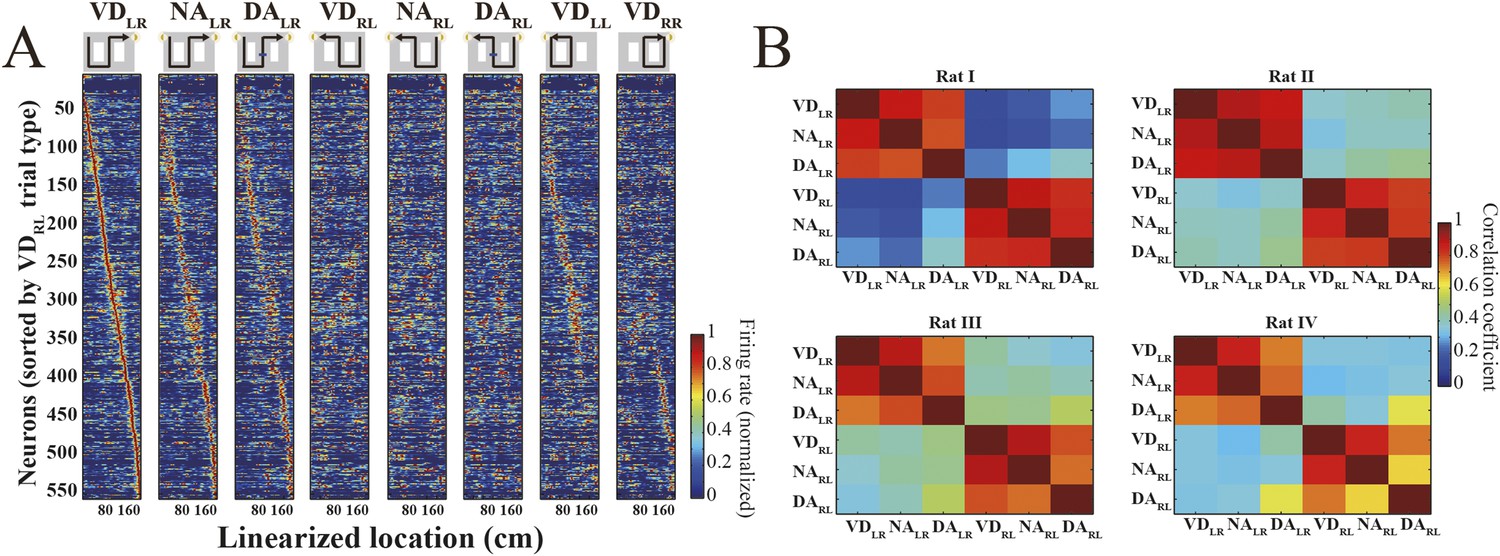
Spatial pattern of place cell activity.
(A) Actual trial types, as illustrated in the diagrams, are organized in eight columns. Normalized trial-type-specific firing rate maps for running periods, ordered by the latency of their peak firing rates during VDRL trials. Each line is a single neuron; neurons from all rats are combined. (B) Cross-correlation matrices of trial-type-specific firing rate maps. Note that the correlation coefficient between identical journeys was higher than that between different journeys, irrespective of subtask.
Figure 2
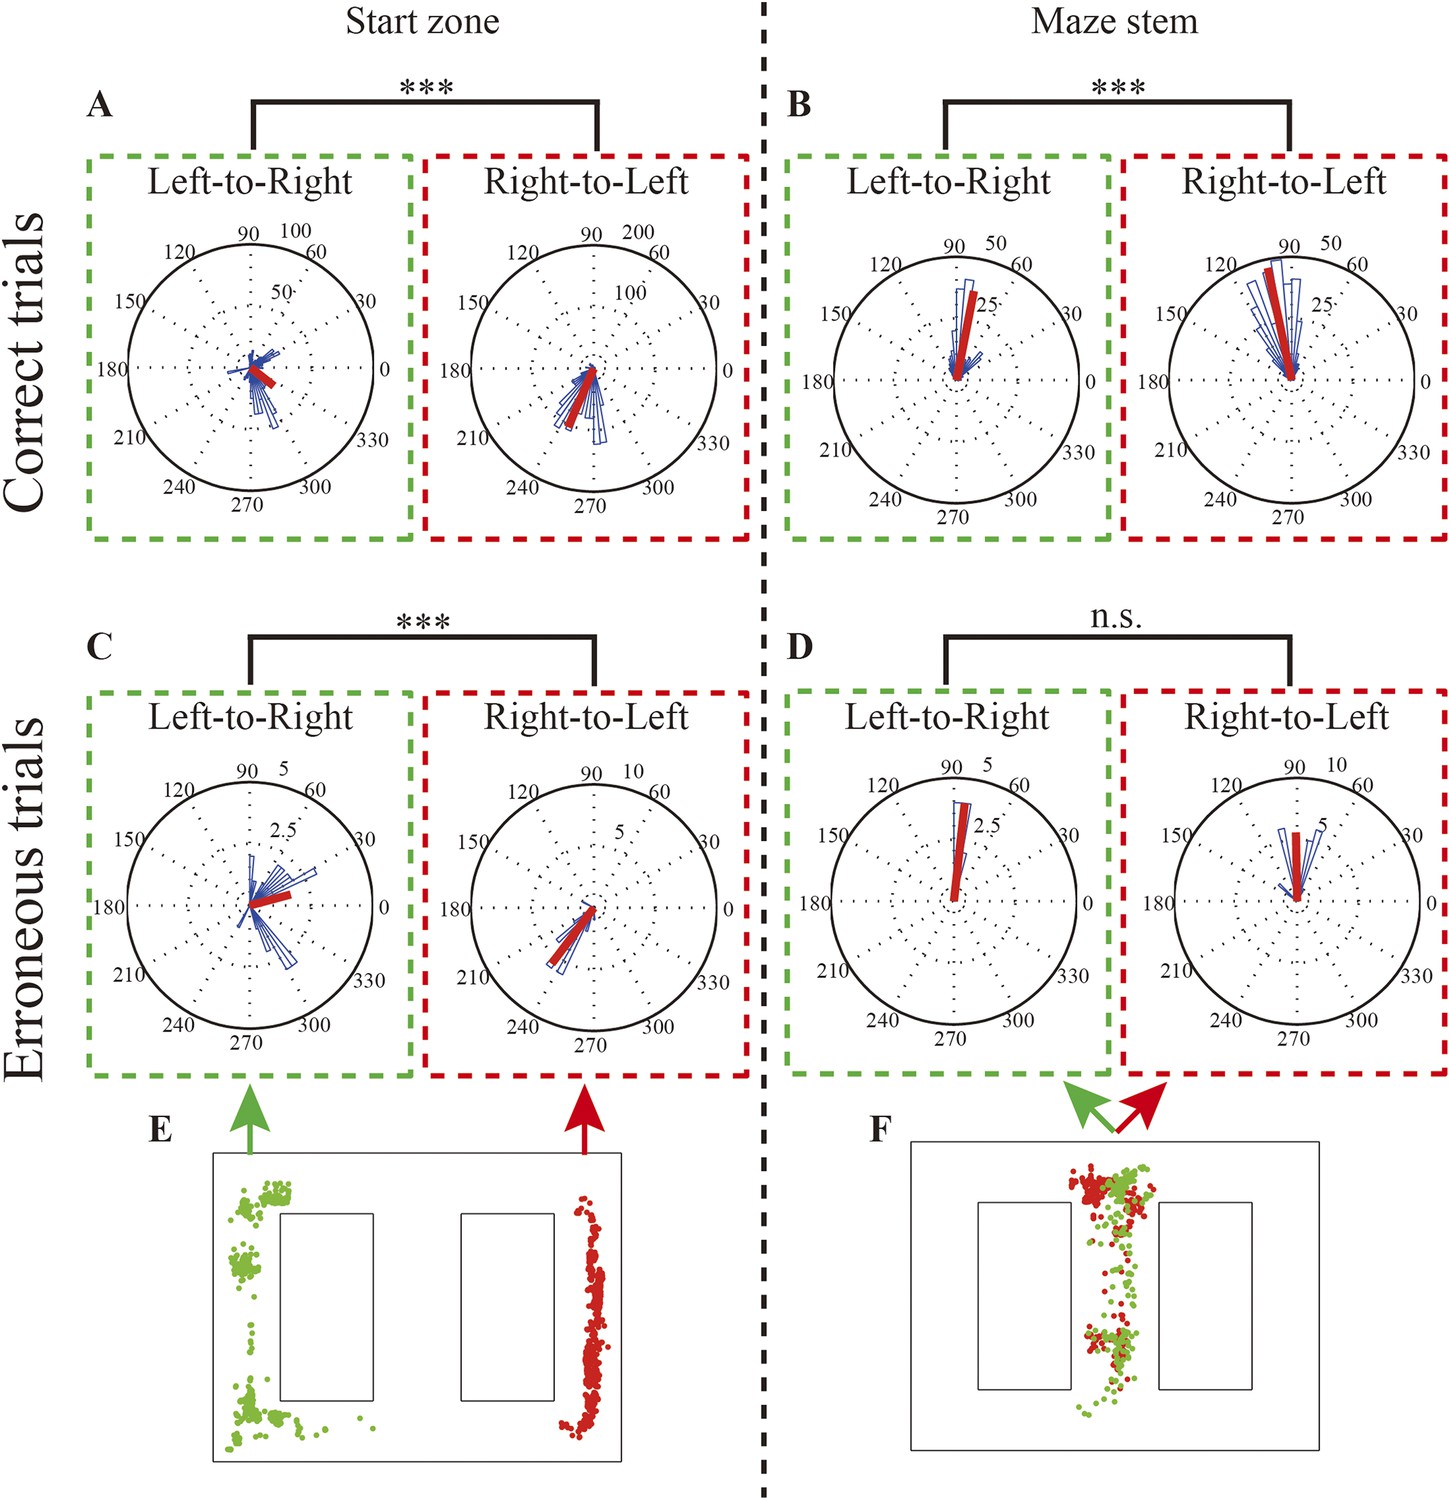
Rats' head direction during replays and replay location.
(A, B) Rose diagrams of rats' head directions in replays occurring during left-to-right and right-to-left journeys in the start zone (A) and within the maze stem (B) in correct trials. (C, D) as for (A, B) but for erroneous trials. Occurrence locations are organized in two columns. In each column, green and red dotted lines enclose left-to-right and right-to-left journeys, respectively. (E, F) Physical locations where the replays occurred (green dots: left-to-right journeys; red dots: right-to-left journeys). Note that circular medians (red bars) were oriented toward a memory-guided goal (i.e., a goal opposite to the current location), except in replays occurring in the maze stem during erroneous trials. The head directions during delay periods in the DA subtask within the maze stem were excluded. ***: p < 0.0001, n.s: p > 0.05.
Figure 3 with 3 supplements

Decoding path and trial-type prediction during periods of awake immobility.
Graphs are arranged in three columns according to the location at which the replay occurred (A: start zone; B: central maze stem; C: junction). Within each column is one subcolumn for each trial type. Each subcolumn consists of a raster plot of spiking activity of the place cells (top, left), the corresponding firing rates (top, right), the posterior probability of decoded paths (middle), and predicted trial types (bottom) for representative candidate replays during periods of immobility. The scale bars indicate 10ms. Values are indicated by color bars (middle, right). In the decoded paths (middle), the upper junctions in the maze are enclosed by two green dotted lines, and the rat's physical location when the replay occurred is indicated by a solid blue circle. In the trial-type prediction (bottom), red bars indicate the most frequently predicted trial type. Red and green labels indicate whether the most frequently predicted and actual trial types matched or not, respectively. The replays depicted an upcoming path to a memory-guided goal irrespective of where the replay occurred. In fact, the path representation ended at a memory-guided, opposite goal to the visually guided goal in the VDRR (green arrow). During replays that occurred at the junction in DARL and VDRL trials (rightmost, black arrows), the spike raster plots (top, left) and the decoded paths (middle) showed similar patterns. However, the firing rates (top, right) for DARL were greater than those for VDRL. Trial types predicted from the replays occurring at the junction (C, bottom) using the prediction method based on firing rates were accurate on the whole.
Figure 3—figure supplement 1
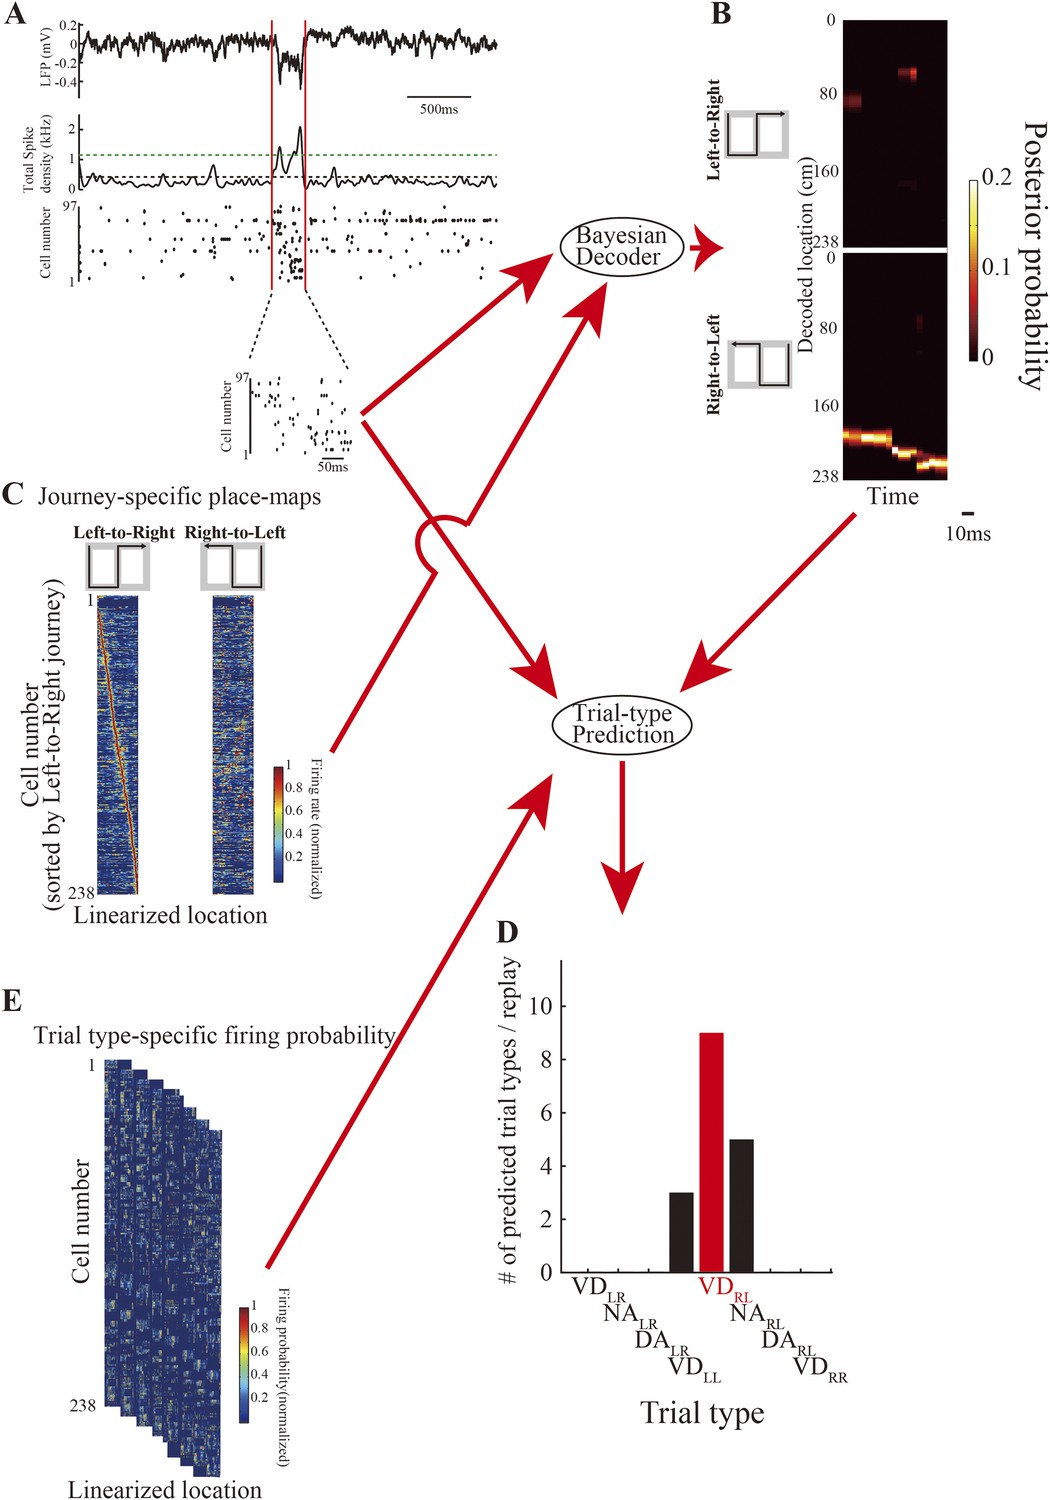
Procedure for Bayesian decoding of locations and trial-type prediction.
(A) Candidate replays were defined as periods when the smoothed (Gaussian kernel; SD: 10 ms) population activity (middle) was higher than the mean (black dotted line) and the peak was above the defined threshold (mean + 3SD, green dotted line). During candidate replays, the local field potential (LFP) (top) clearly showed SWRs (Table 2). Location and trial type were estimated based on the spiking activity (bottom, spike raster) enclosed by the red lines in the replay. (B) The memoryless Bayesian decoder was used to decode the posterior probability of the linearized location from spiking activity and journey-specific place maps (C) for every time window. (D) The trial-type prediction method based on firing rate was used to predict trial type from spiking activity (A, bottom) in conjunction with decoded locations as a maximum a posteriori probability for every time window (B), and the trial-type-specific firing probability map (E). The trial-type representation for each replay was defined as the most frequently predicted trial type across all time windows in that replay (red bar). Red labels indicate that predicted and actual trial types matched.
Figure 3—figure supplement 2
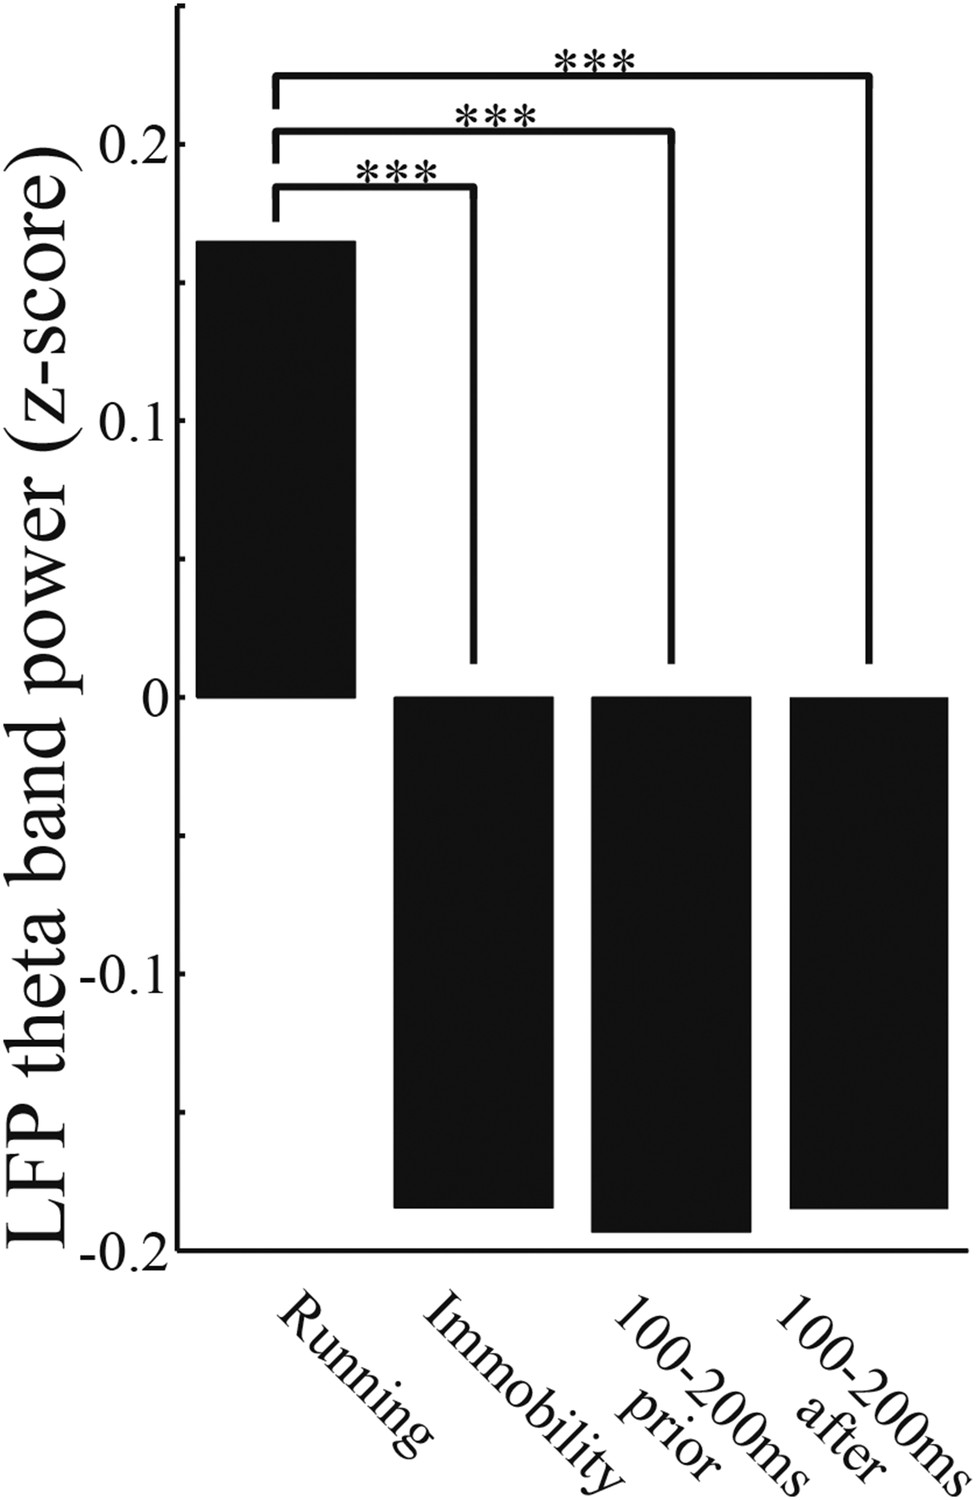
LFP theta power decrease in the replay.
The average LFP power in the theta band (4–12 Hz) during running (speed > 5 cm/s), and immobility (speed < 2 cm/s), and for 100–200 ms immediately before and after each replay throughout the entire session. (Kruskal–Wallis test, Tukey's post hoc multiple-comparison; ***: p < 0.0001).
Figure 3—figure supplement 3
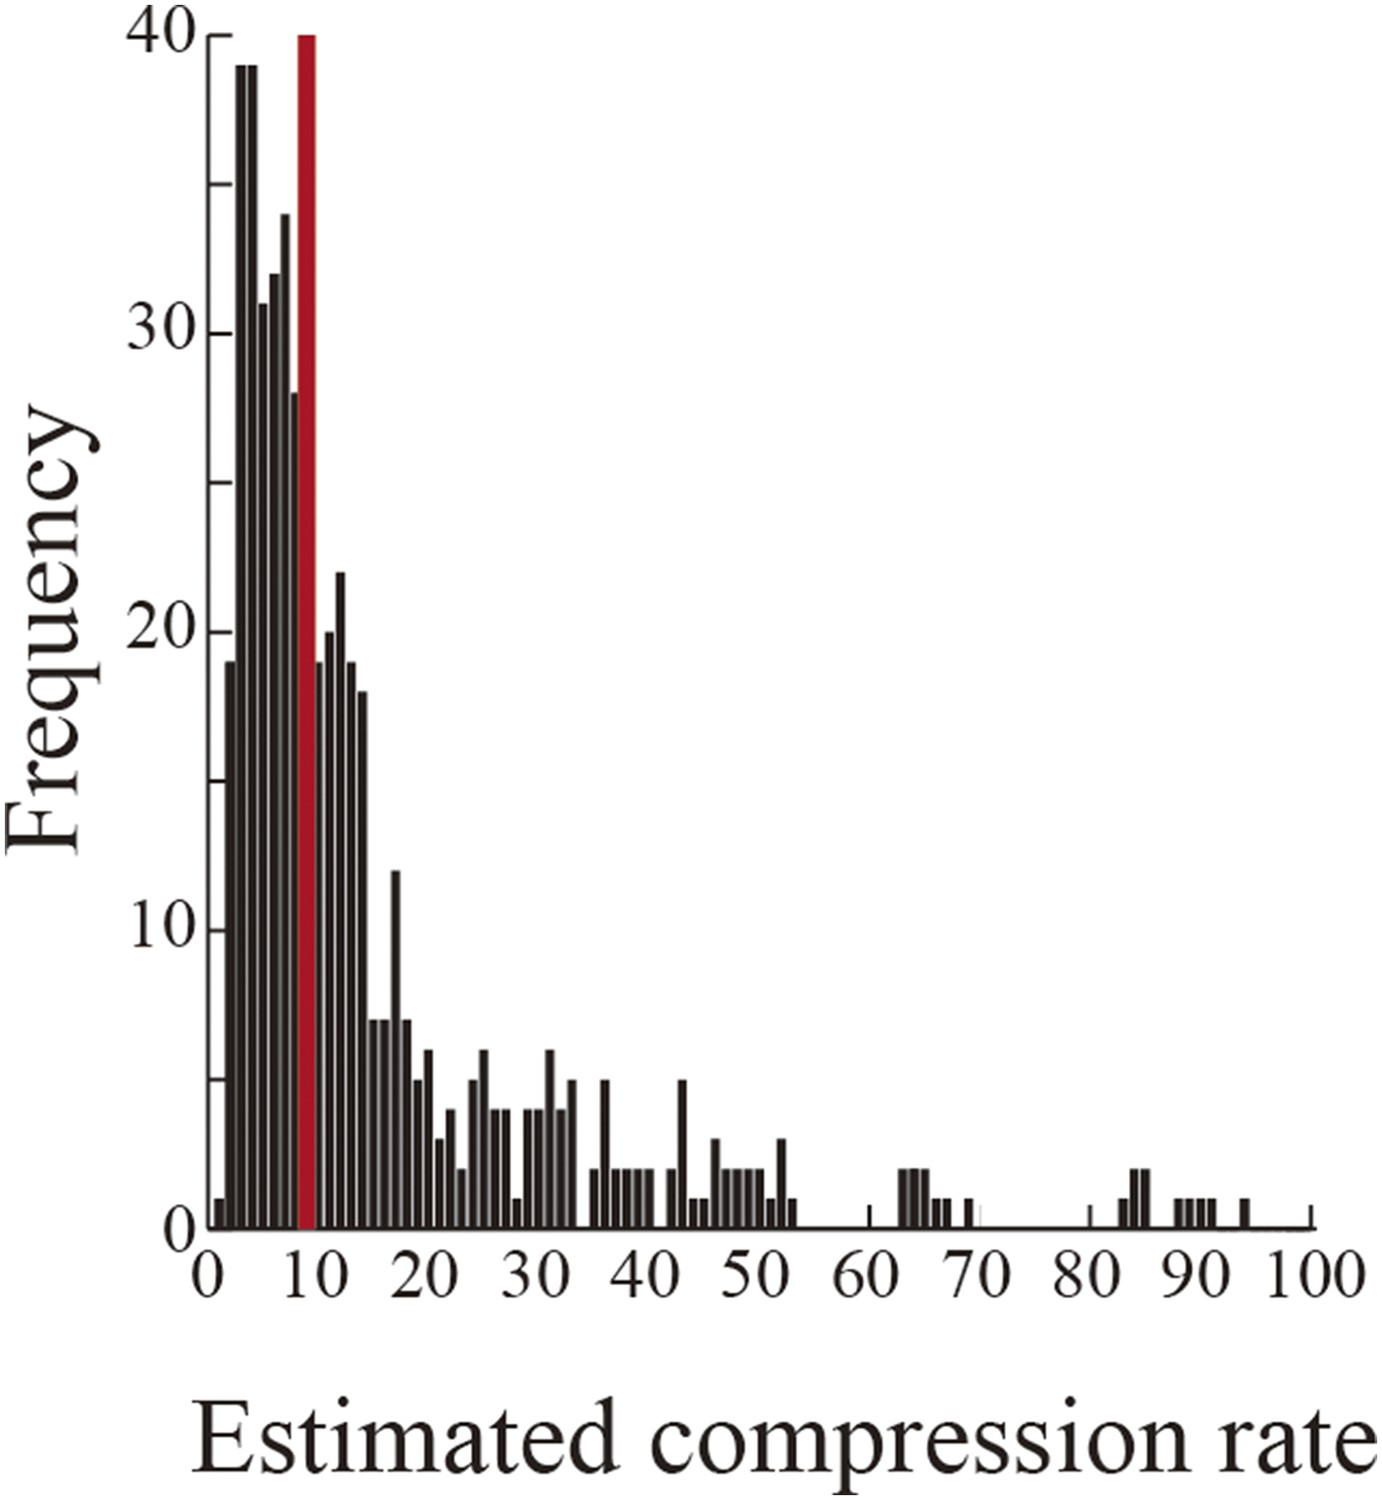
Estimated compression rate of firing during replays.
Histogram of the compression rate of firing during replays, estimated across all rats as the average interspike interval during candidate replays divided by that during the entire session excluding the candidate replays. The red line indicates the median (9.0).
Figure 4 with 1 supplement
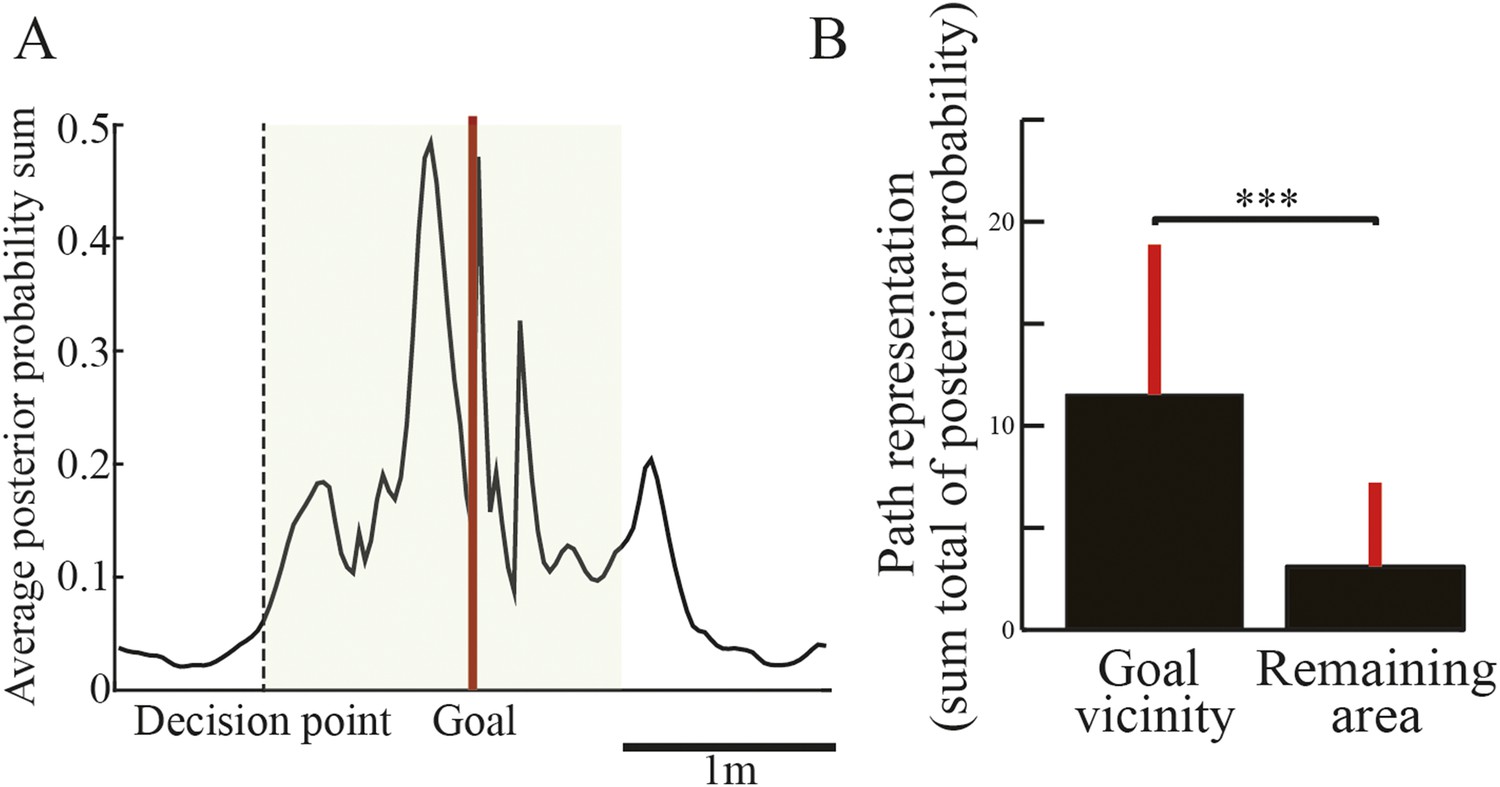
Spatial tendency of candidate replays.
(A) Sum of posterior probabilities of decoded locations for the candidate replays throughout the entire session averaged across all rats. The dotted line indicates the location of the decision point, and the red line indicates the location of the goal. The green shaded area shows the defined goal vicinity. (B) Path representation, that is, the sum total of the posterior probabilities of decoded locations, within the goal vicinity and in the remaining area. Red lines indicate SD. ***: p < 0.0001.
Figure 4—figure supplement 1
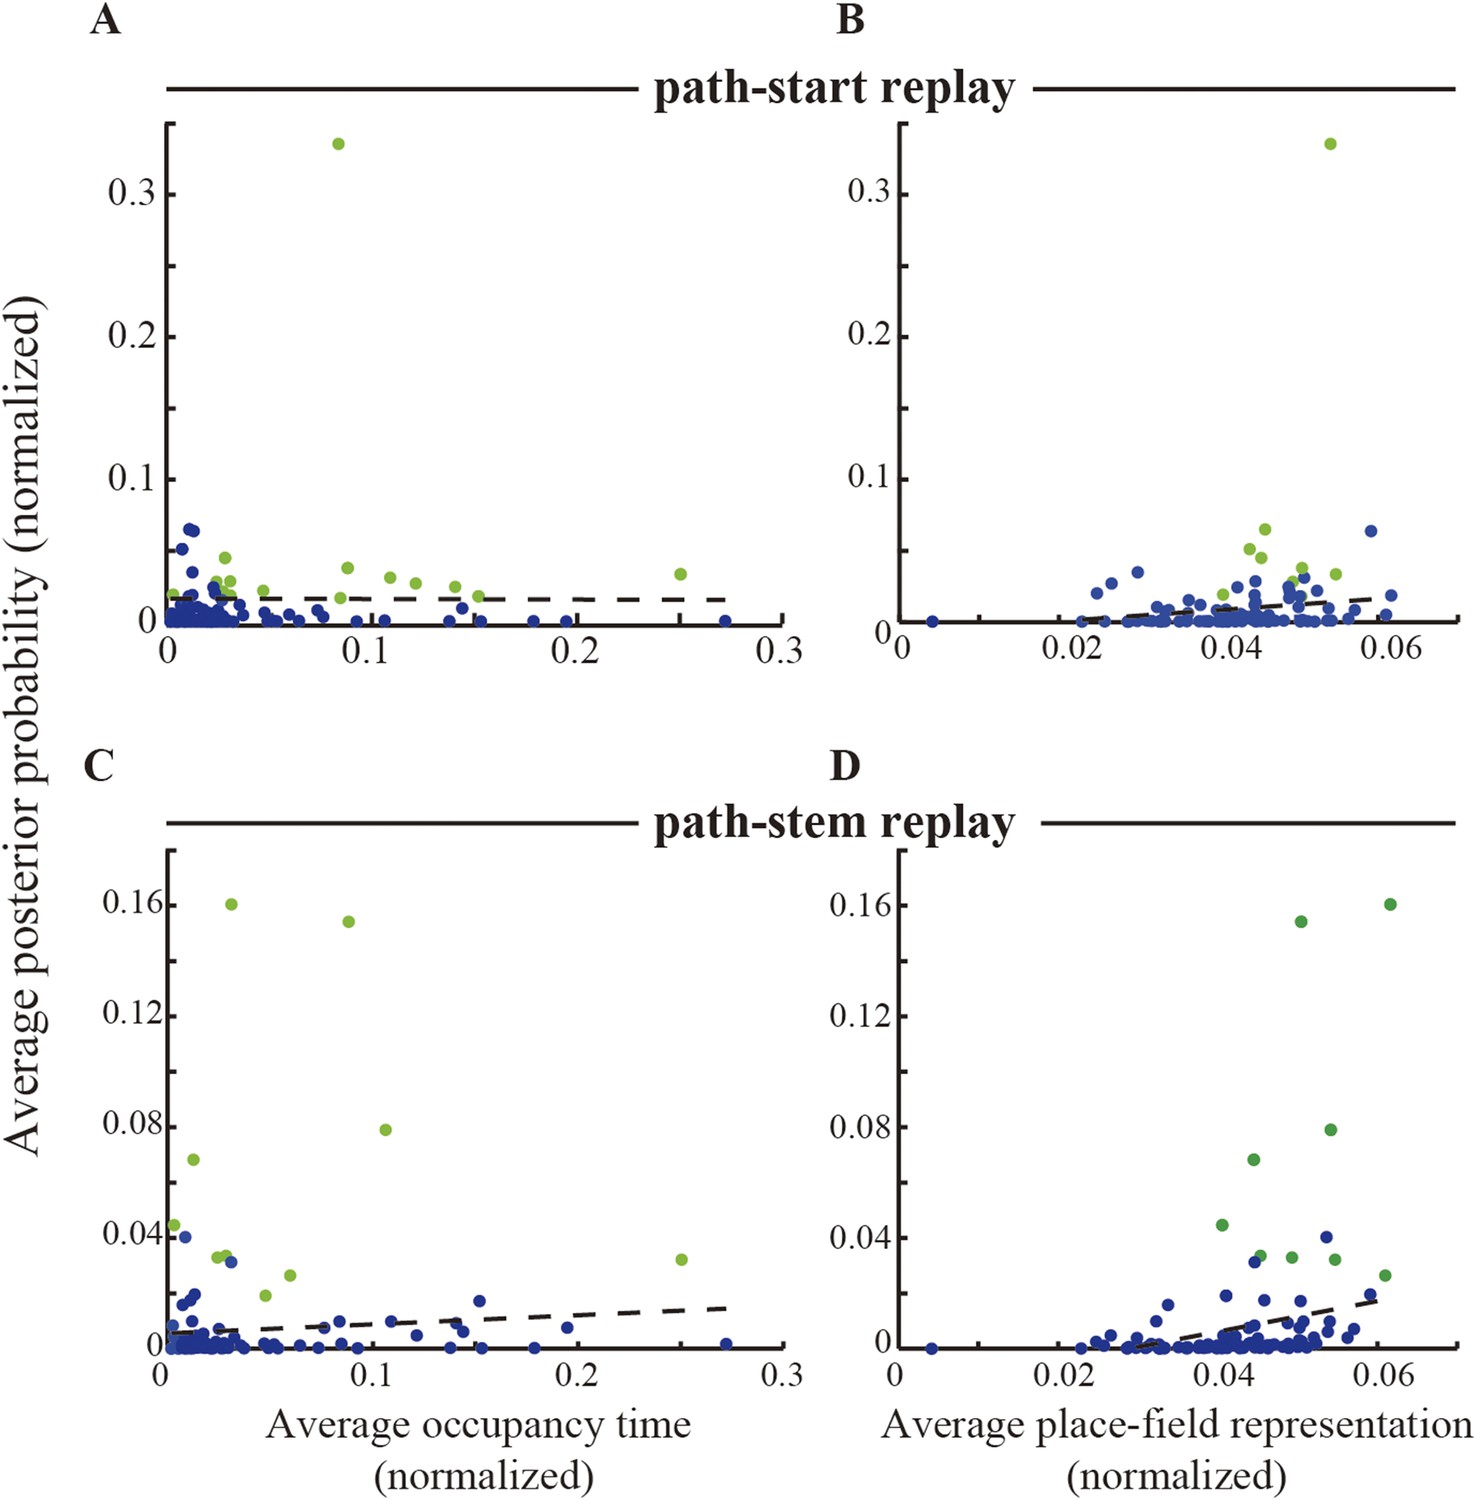
The relationship between occupancy time / place-field distribution and path replay representation.
(A, B) Average normalized posterior probability of decoded locations as a function of (A) average normalized occupancy time which the rat spent, and (B) average normalized place-field representation (i.e., firing rate), at the locations decoded by the Bayesian decoder for the path-start replays that occurred in the start zone. To examine whether the initiation bias could be correlated with either occupancy time or spatial distribution of place-field representation, replays were divided into two types: those for which the average normalized posterior probability of decoded locations was greater than the overall mean + SD (i.e., replays showing relatively higher probability; green dots) and the rest (blue dots). Black dashed lines indicate the best-fit lines (linear least squares) for the blue dots. Pearson's r: (A) −0.012 (p = 0.91), (B) 0.27 (p = 0.010). (C, D), as for (A, B), but for the path-stem replays that occurred within the maze stem. Pearson's r: (C) 0.087 (p = 0.41), (D) 0.27 (p = 0.0098). Replays showing relatively higher probability (green dots) did not lie along the best-fit lines. Thus, neither occupancy time nor place-field representation could account for the posterior probability of decoded locations for either the path-start or the path-stem replays.
Figure 5 with 1 supplement
Decoded paths in path replays.
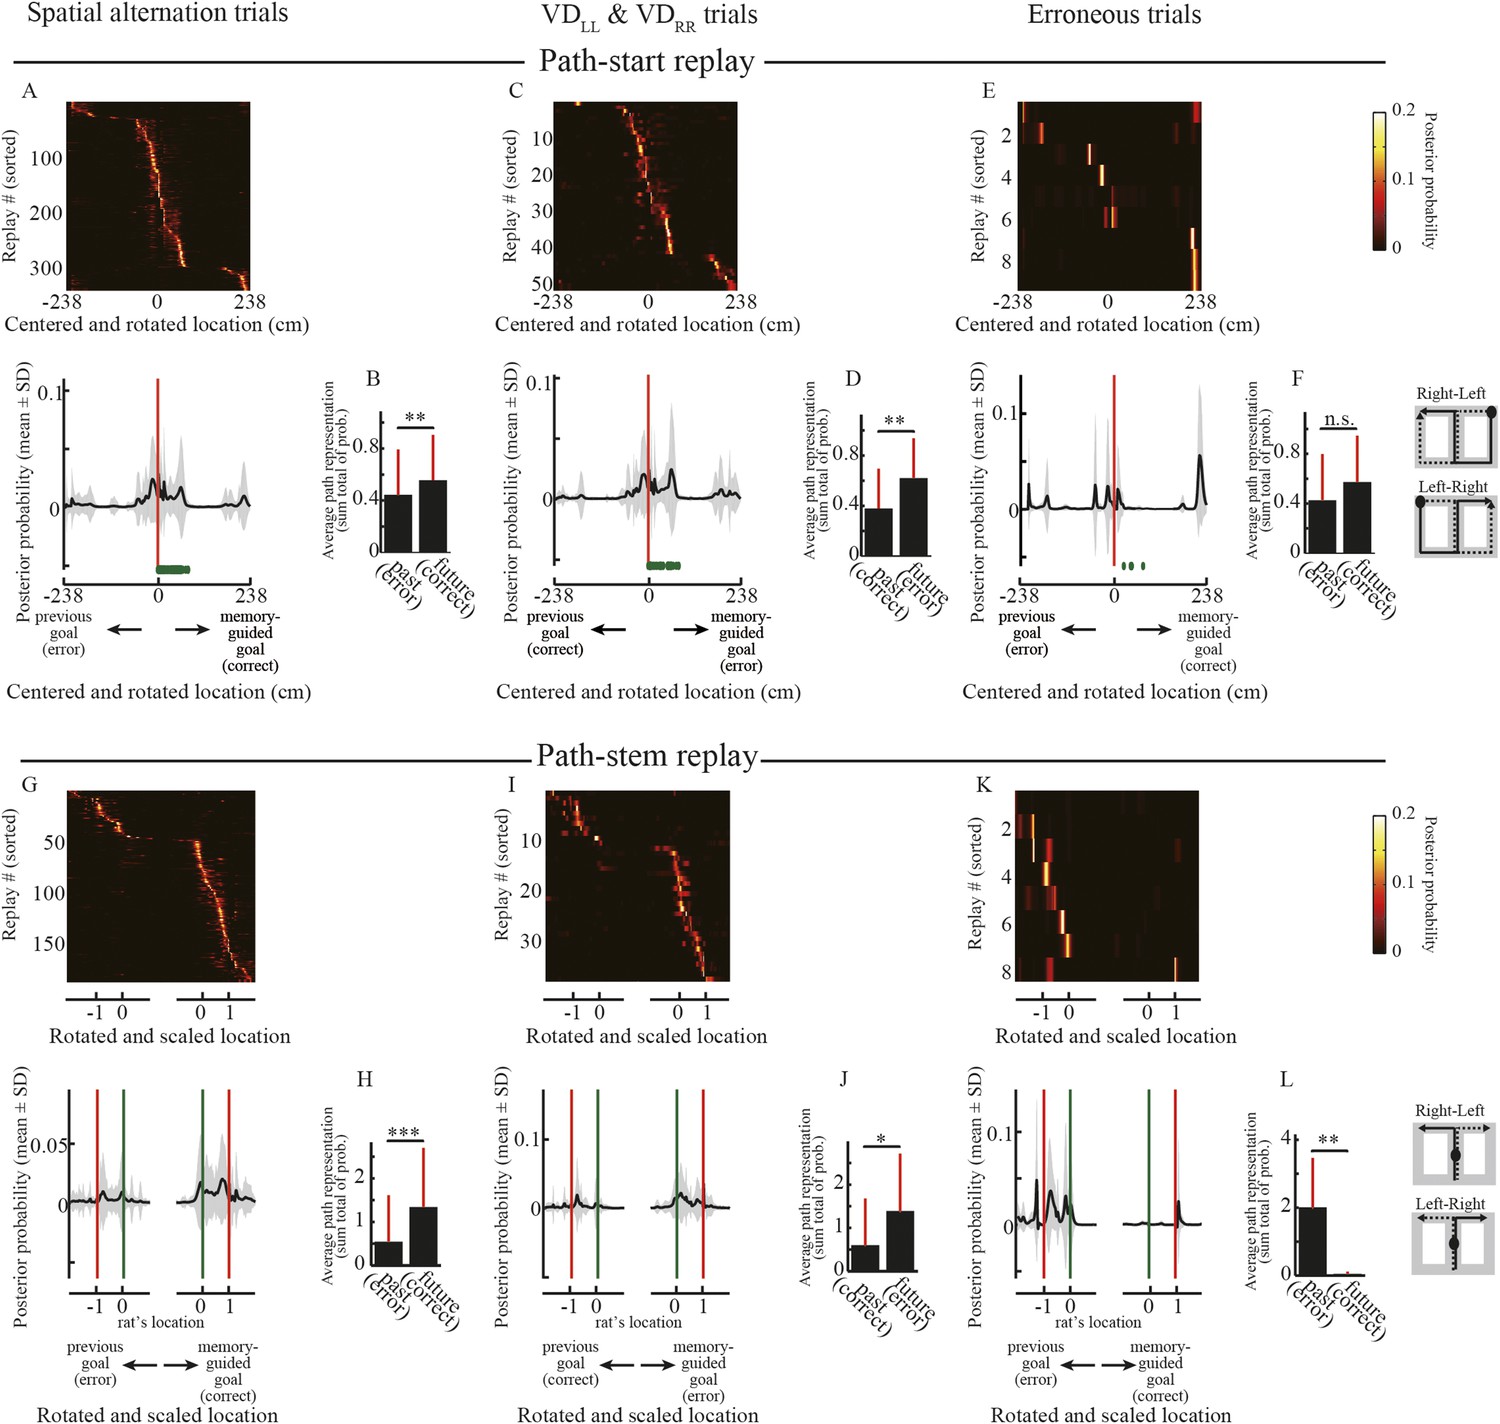
(A, C, E) Upper panels show the posterior probability of decoded locations for path replays that occurred in the vicinity of the start position in the spatial alternation trials (VDLR, VDRL, NALR, NARL, DALR, DARL) (A), the visually guided trials (VDLL, VDRR) (C), and erroneous trials (E), centered on the start position and rotated according to the direction of the memory-guided goal. The replays were ordered by the location showing the maximum posterior probability. Values are indicated by color bars (right). Lower panels show that the posterior probability of the decoded location averaged across all path replays. Distance was centered on the start position and rotated according to the direction of the memory-guided goal. The shaded area indicates SD, green dots indicate the rat's physical location, and red lines indicate the start position. The schematic diagrams of the maze on the right show the start position (black filled circles) and rotation direction (solid line: towards the memory-guided goal; dotted line: towards the previous goal). Note that in the visually guided trials (VDLL, VDRR), the rats could get rewards at the previous goal but were always under spatial memory demand due to the task design, so the choice to go toward the memory-guided goal (i.e., the goal opposite to the previous goal) was defined as an erroneous response. (B, D, F) Path representation (the sum total of posterior probabilities of decoded locations) averaged across all path replays within future and past regions, defined from the start position to memory-guided/previous goals, for the trials shown in A, C, and E. Red bars indicate SD. (G–L) as for (A–F), but for path replays occurring within the stem. Distance was centered on the rat's physical location at the time of occurrence, rotated according to the direction of the memory-guided goal, and scaled according to the distance from the rat's physical location to a memory-guided goal. Green lines indicate the rat's physical location, and red lines indicate the memory-guided/previous goals. Future and past regions were defined based on the rat's physical location and the memory-guided/previous goals, respectively. *: p < 0.05, **: p < 0.01, ***: p < 0.001, n.s.: p > 0.05.
Figure 5—figure supplement 1
Decoded paths with the highest a posteriori probability in path replays.
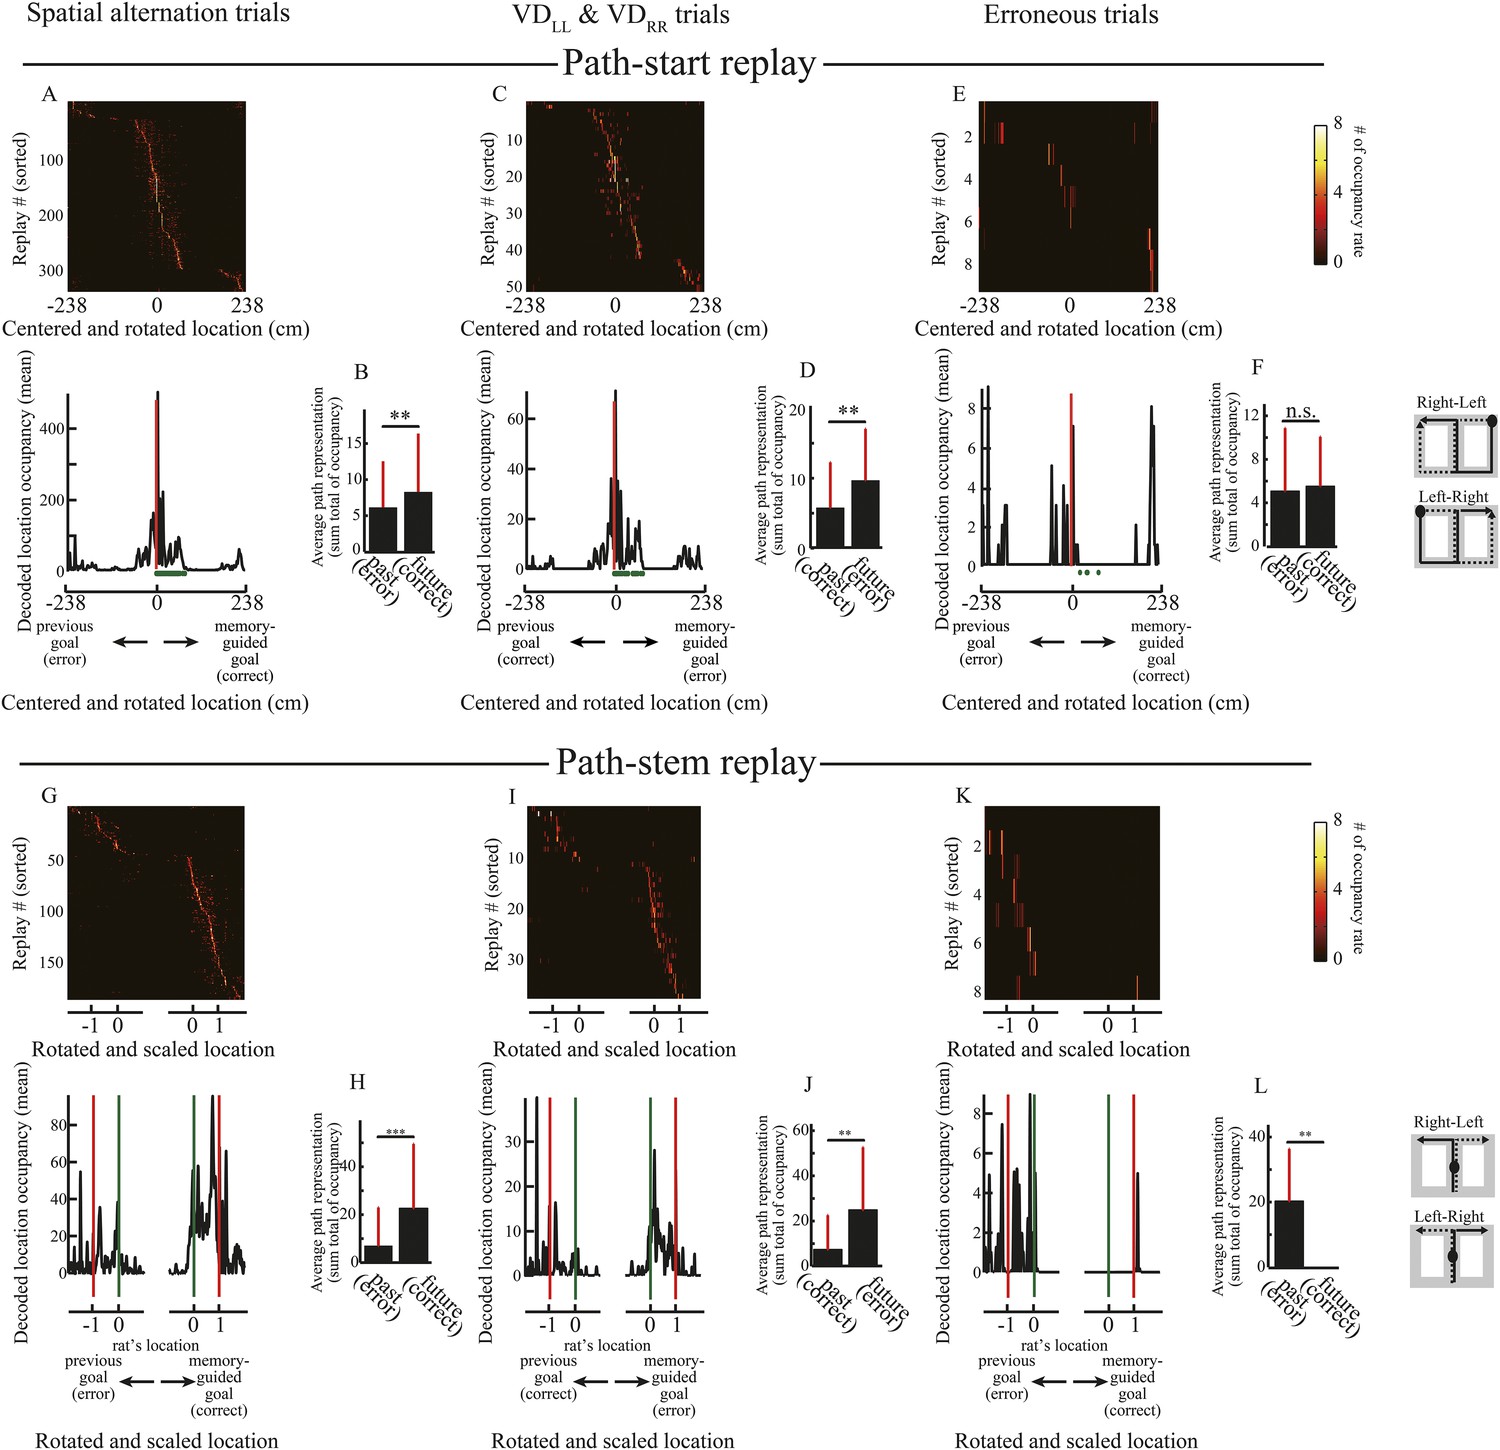
(A–L) As for Figure 5, but for occupancy of the decoded locations with the highest a posteriori probability for path replays. Wilcoxon signed-rank test, P: (B), 0.0022; (D), 0.0084; (F), 0.89; (H), 3.1 × 10⁻⁸; (J), 0.0085; (L), 0.0078. **: p < 0.01, ***: p < 0.001, n.s.: p > 0.05.
Figure 6
Estimated place preference in the path replays.
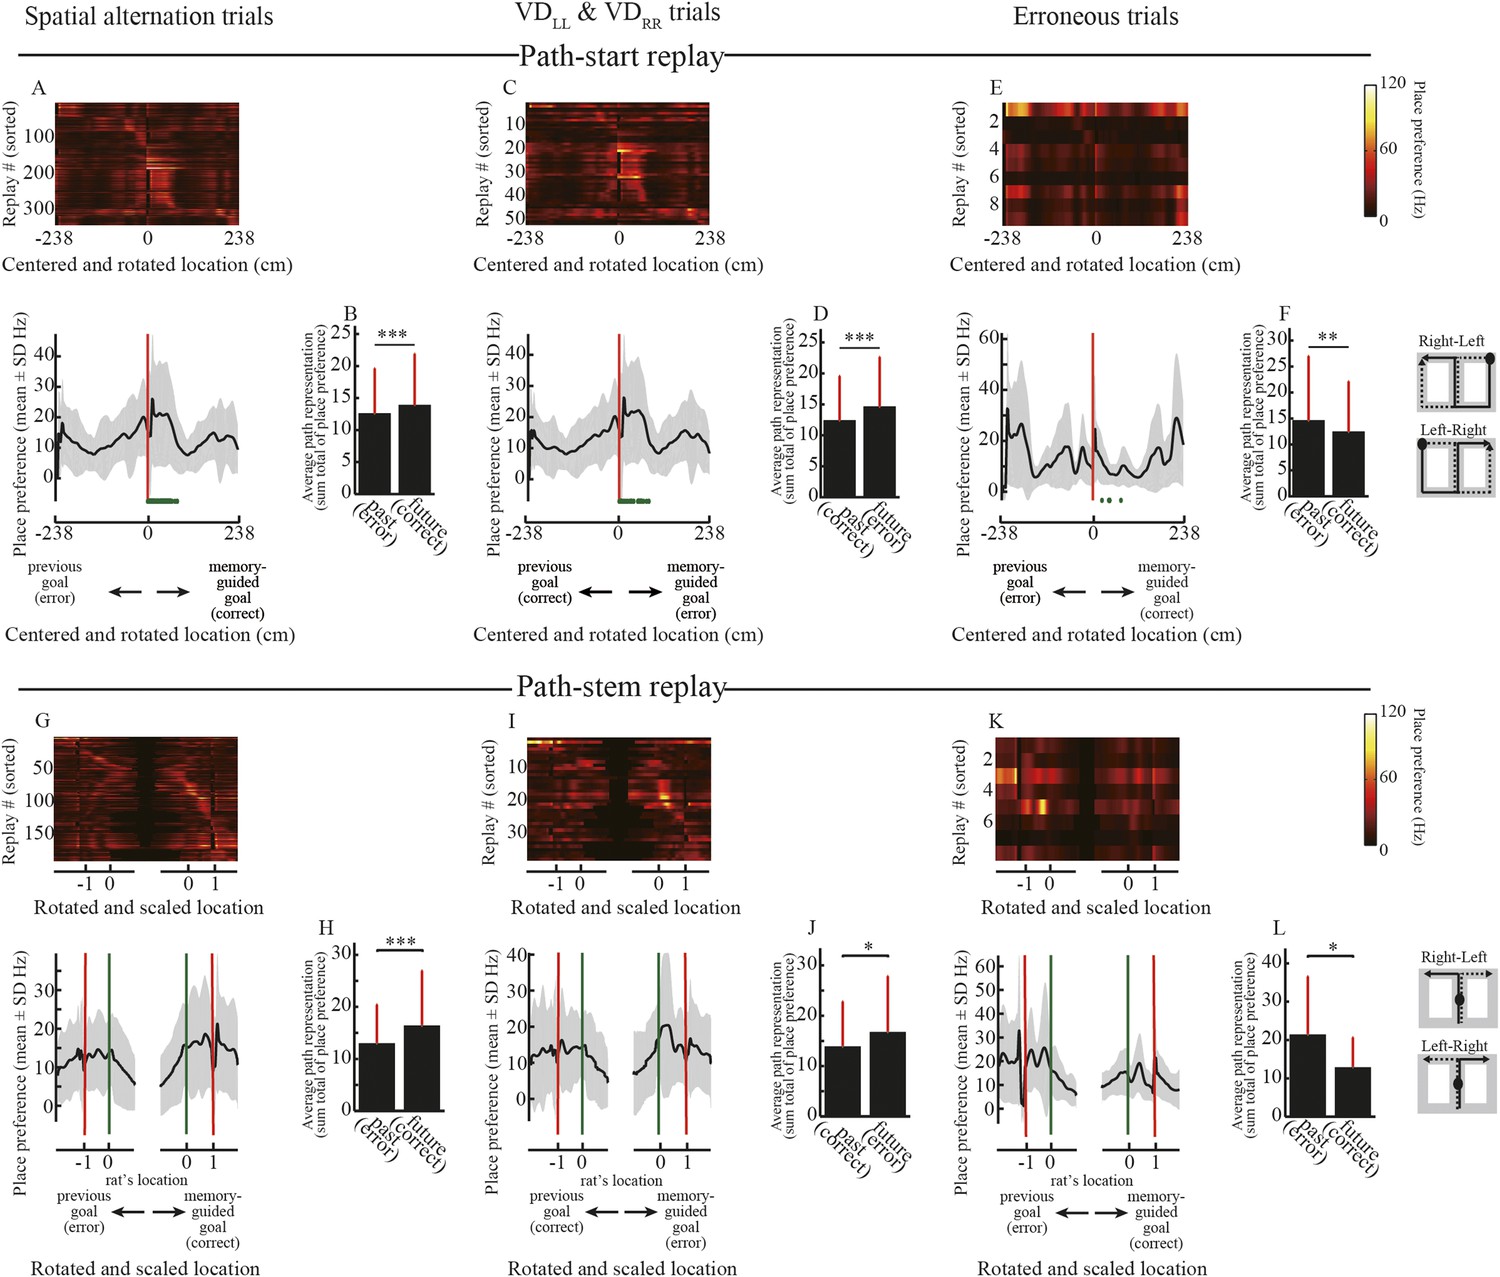
(A, C, E) Upper panels show the place preference estimated using the simple spatial reconstruction algorithm for path replays that occurred in the vicinity of the start position in the spatial alternation trials (VDLR, VDRL, NALR, NARL, DALR, DARL) (A), the visually guided trials (VDLL, VDRR) (C), and erroneous trials (E), centered on the start position and rotated according to the direction of the memory-guided goal. The replays were ordered by the location showing the maximum place preference. Values are indicated by color bars (right). Lower panels show that the place preference averaged across all path replays. Distance was centered on the start position and rotated according to the direction of the memory-guided goal. The shaded area indicates SD, green dots indicate the rat’s physical location, and red lines indicate the start position. The schematic diagrams of the maze on the right show the start position (black filled circles) and rotation direction (solid line: towards the memory-guided goal; dotted line: towards the previous goal). Note that in the visually guided trials (VDLL, VDRR), the rats could get rewards at the previous goal but were always under spatial memory demand due to the task design, so the choice to go toward the memory-guided goal (i.e. the goal opposite to the previous goal) was defined as an erroneous response. (B, D, F) Path representation (the sum total of place preferences) averaged across all path replays within future and past regions, defined from the start position to memory-guided/previous goals, for the trials shown in A, C, and E. Red bars indicate SD. (G–L) as for (A–F), but for path replays occurring within the stem. Distance was centered on the rat’s physical location at the time of occurrence, rotated according to the direction of the memory-guided goal, and scaled according to the distance from the rat’s physical location to a memory-guided goal. Green lines indicate the rat’s physical location, and red lines indicate the memory-guided/previous goals. Future and past regions were defined based on the rat’s physical location and the memory-guided/previous goals, respectively. Wilcoxon signed-rank test, *: P<0.05, **: P<0.01, ***: P<0.001.
Figure 7 with 3 supplements
Subtask preference and relationship between actual and predicted trial types.
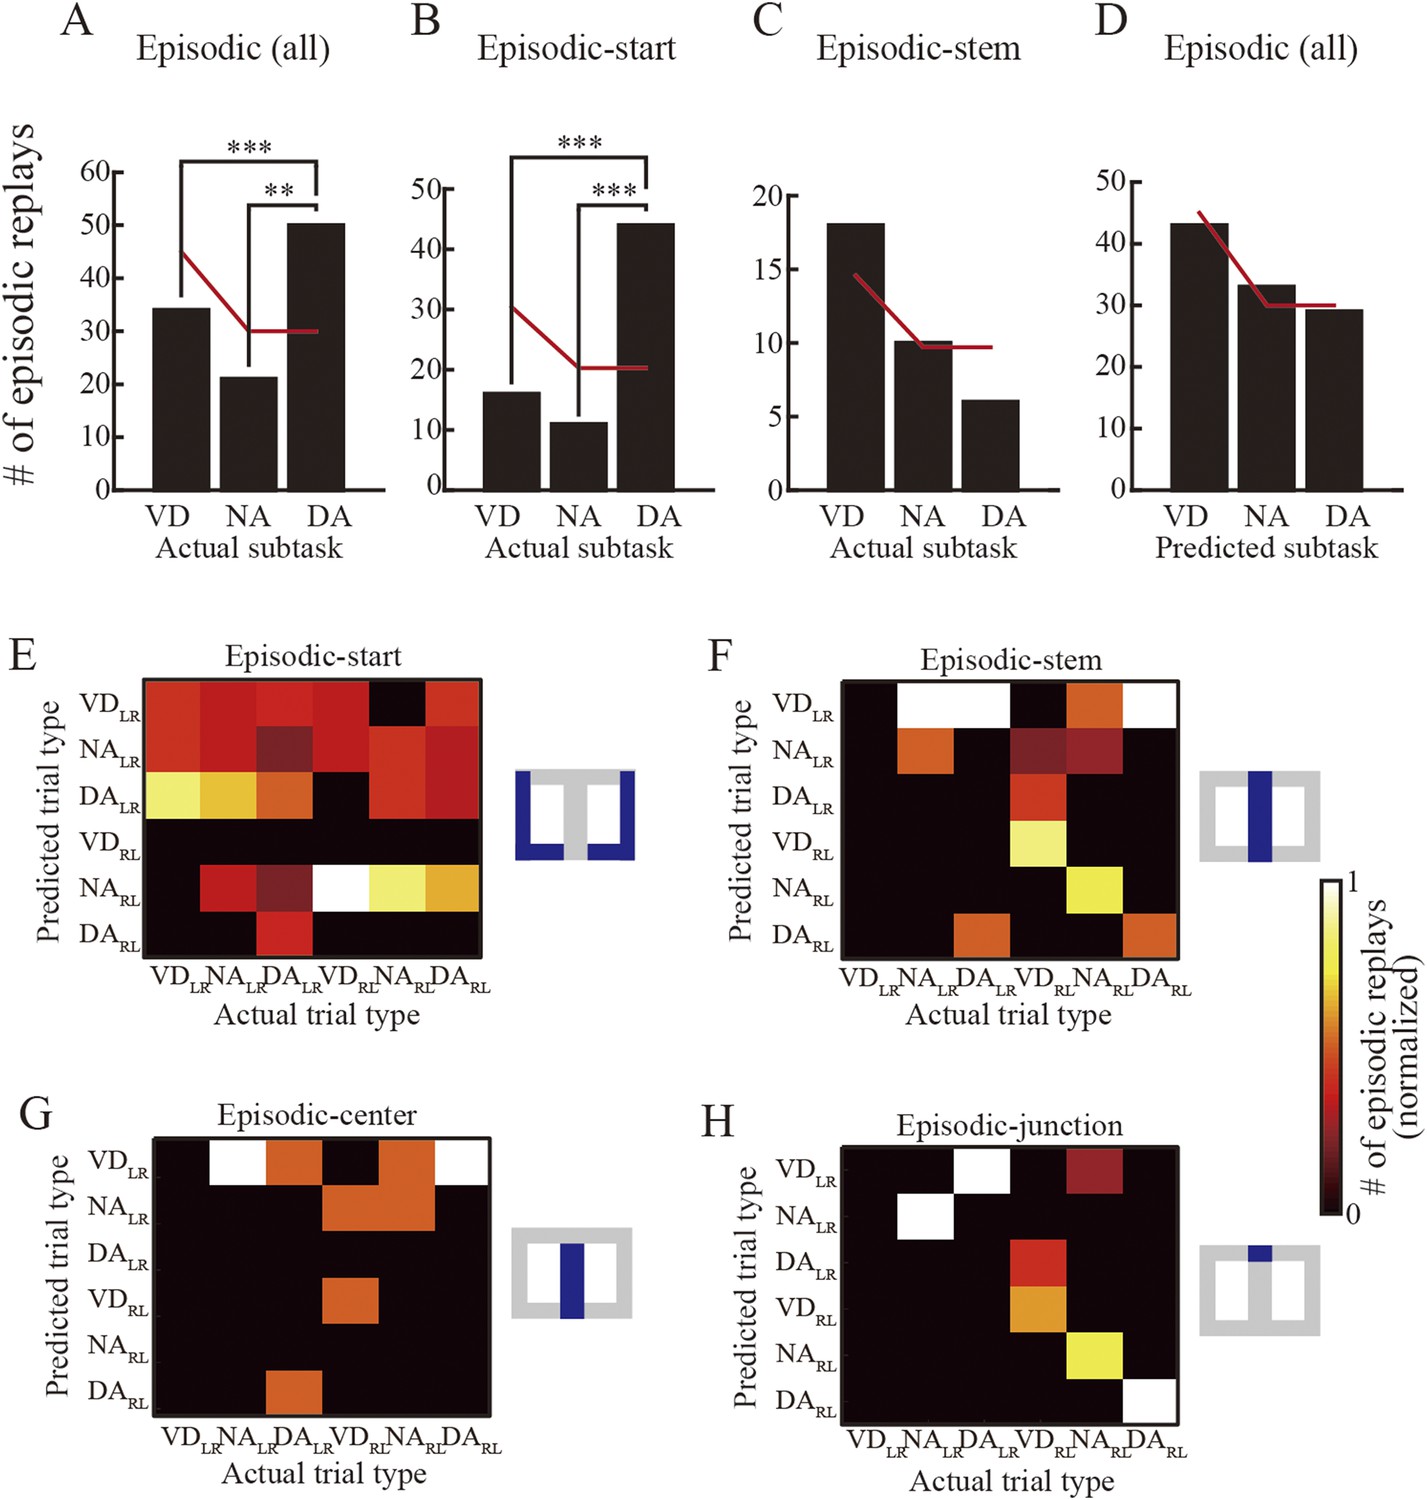
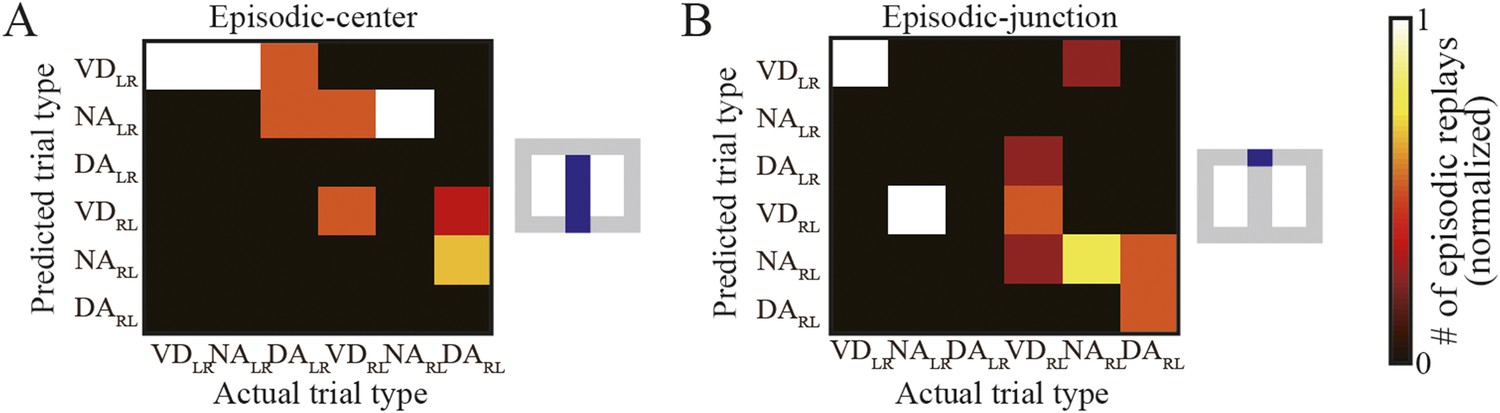
(A) The number of episodic replays across all rats as a function of actual subtasks to be rewarded. Red lines indicate the estimated numbers calculated by multiplying the total number of replays by the ratio of repeatedly experienced subtasks throughout the entire session (60: 40: 40; null hypothesis: the replays represent all subtasks evenly). (B, C) The number of episodic-start (B) and episodic-stem (C) replays across all rats as a function of actual subtasks. Red lines as in (A). (D) The number of episodic replays across all rats as a function of subtasks predicted from the replay. **: p < 0.001, ***: p < 0.0001. (E–H) The number of episodic replays across all rats normalized across predicted trial types of matches between actual and predicted trial types (for spatial alternation trials only) in episodic-start (E), episodic-stem (F), episodic-center (G), and episodic-junction (H) replays. Blue in the schematic diagrams to the right indicates the regions in which the replays occurred in the maze. Note that whereas VDRL and NALR trials were frequently predicted from the episodic replays in the central stem when the actual trial type was VDRL (G), such partial matching may be accidental. In contrast, in the junction (H), the trial types showing the largest predicted value matched the actual trial types well for NALR, VDRL, NARL, and DARL trials. The overall matching score across all trial types is significantly different from random matching (z test, p = 3.7 × 10⁻⁴), suggesting that episodic replays can accurately represent actual trial types, but only in the junction.
Figure 7—figure supplement 1
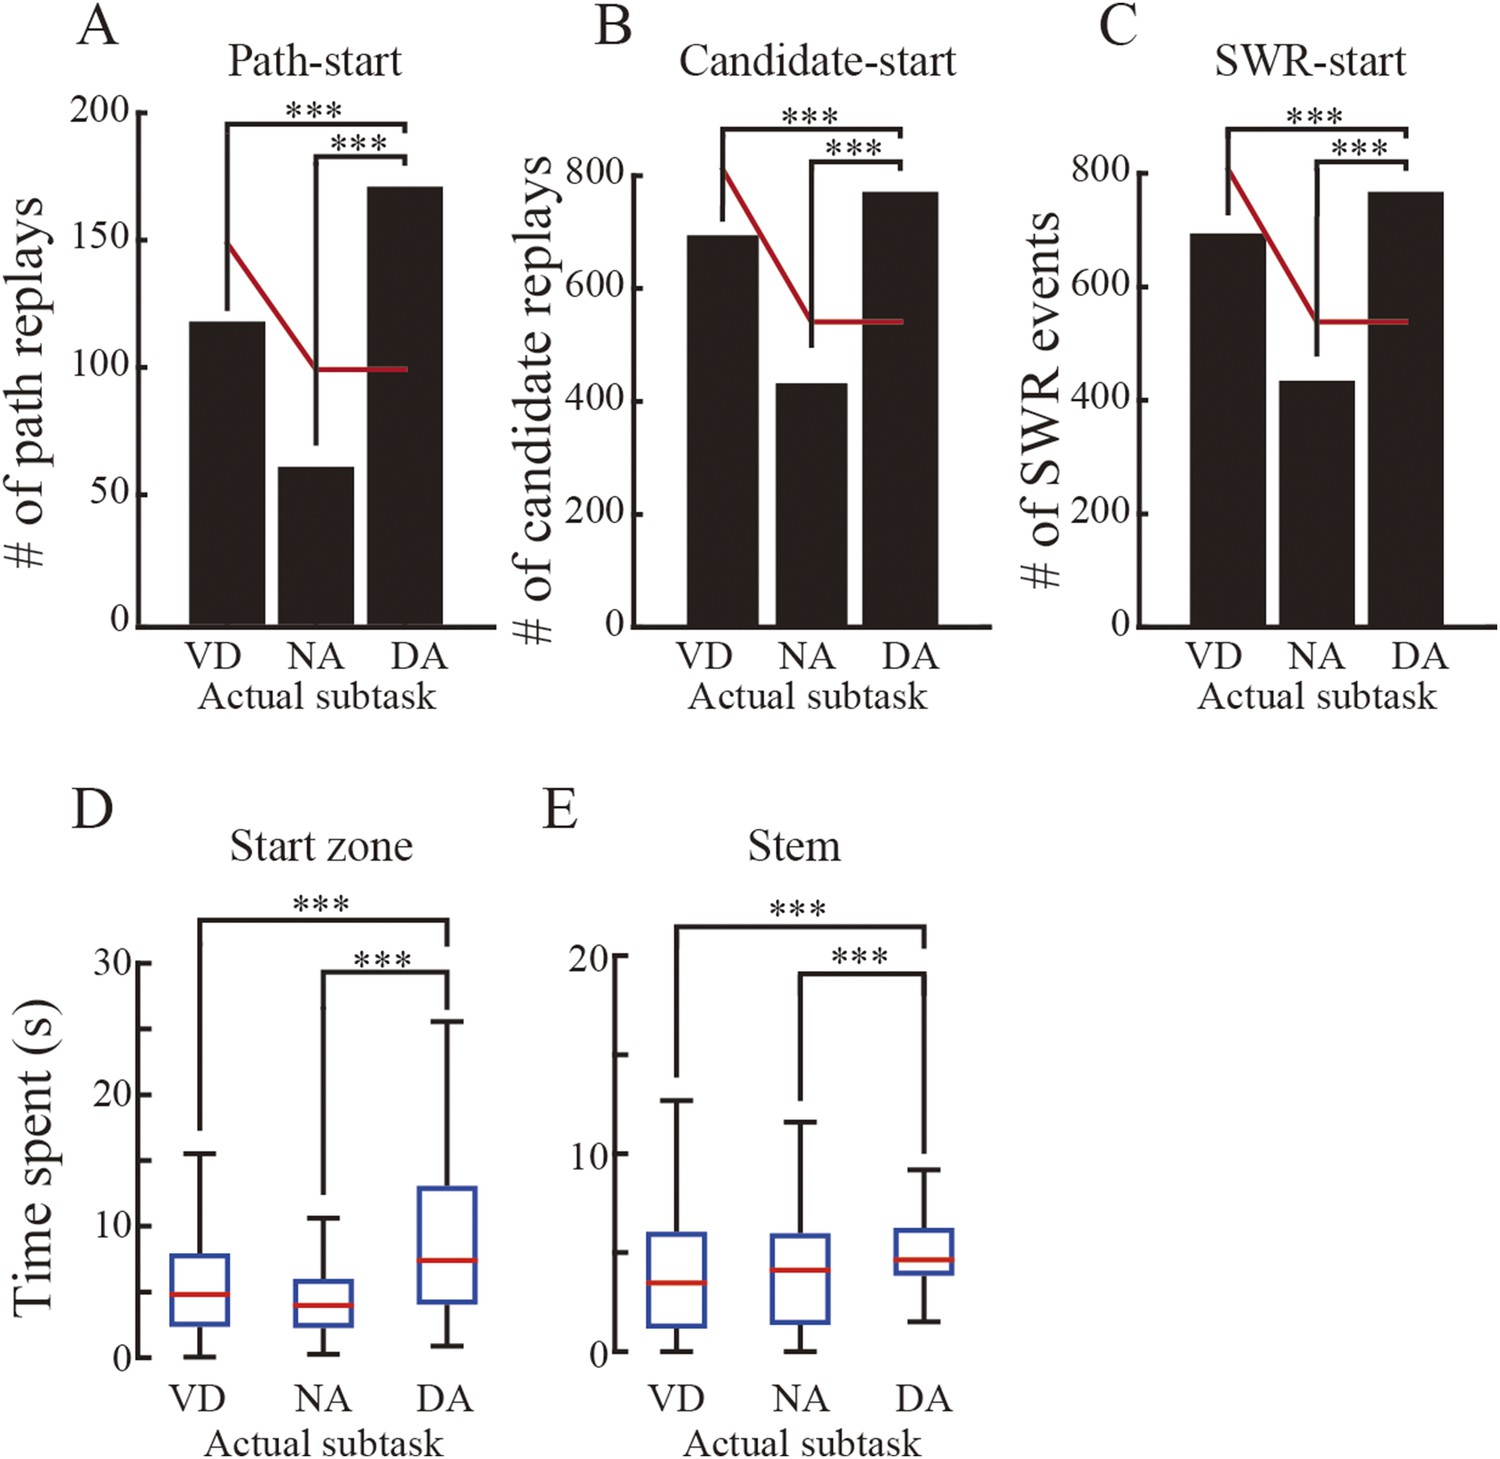
Subtask preference in replays occurring in the start zone, and time spent pausing.
(A–C) The number of path-start (A) and candidate (B) replays and SWR events (C) occurring in the start zone, across all rats, as a function of actual subtasks to be rewarded. Red lines as for Figure 7A. ***: p < 0.001 (Chi-square goodness-of-fit test, post hoc multiple binomial tests corrected by the Benjamini and Hochberg procedure). Note that the bias towards the DA subtask can be seen throughout all categories of replay events. (D–E) Time spent pausing (running speed < 2 cm/s) in the start zone (D) and maze stem (E) across all rats, as a function of actual subtasks (red lines: median; blue boxes: first and third quartiles; bars: minimum and maximum values). The rats spent more time pausing during the DA subtask in both the start zone and the maze stem. Kruskal–Wallis test, Tukey's post hoc multiple-comparison, ***: p < 0.001.
Figure 7—figure supplement 2
Relationship between actual and predicted trial types using the simple spatial reconstruction algorithm.
The number of matches between actual and predicted trial types (for all rats but spatial alternation trials only), normalized across predicted trial types, in episodic-center (A) and episodic-junction (B) replays. Location was estimated using the simple spatial reconstruction algorithm instead of the Bayesian decoder. Blue in the schematic diagrams to the right indicates the regions in which the replays occurred. In the junction (B), the predicted trial types with the largest predicted value fit the actual trial types well for VDLR, VDRL, NARL, and DARL trials. The overall matching score across all trial types was significantly different from random matching (z test, p = 0.0078).
Figure 7—figure supplement 3
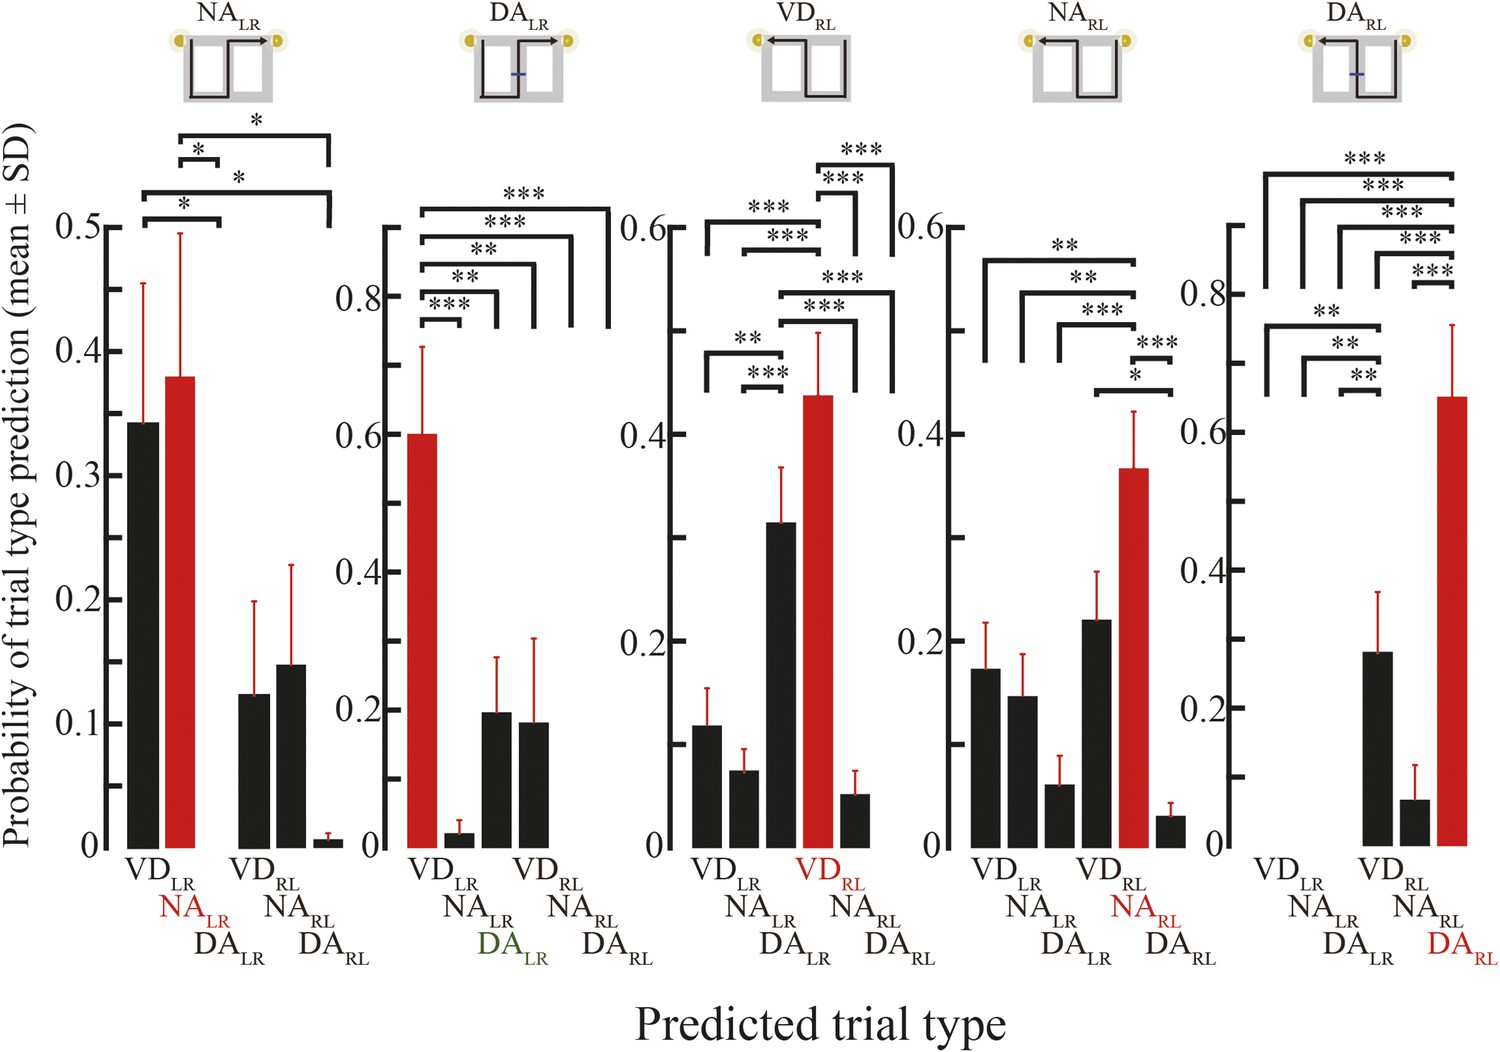
Trial-type prediction on the time-window basis.
The topmost illustration shows the actual trial type. The graphs show the average prediction probability from the episodic replays, on the time-window basis, as a function of predicted trial type. Red bars indicate the highest average probability. Red and green labels indicate whether the predicted trial type with the highest probability matched the actual trial type. Post hoc Tukey HSD test, *: p < 0.05, **: p < 0.01, ***: p < 0.001.
Figure 8

The relationship between predicted subtask and sensory cue.
(A) The number of episodic-junction replays with matches between the predicted subtask and the configuration of visual cues, across all rats. (B) The number of episodic-center replays with matches between the predicted memory-guided subtask and the presence of a barrier at the center of the maze, across all rats.
Tables
Table 1
Behavioral and electrophysiological measurements and estimation accuracy of position and trial-type during running
| RAT number | I | II | III | IV | Total |
|---|---|---|---|---|---|
| Number of erroneous laps | 0 | 9 | 1 | 4 | 15 |
| Number of correct laps | 142 | 142 | 139 | 139 | 562 |
| Task performance (%) | 100% | 94.0% | 99.3% | 97.2% | 97.4% |
| Number of principal cells | 412 | 193 | 202 | 277 | 1084 |
| Number of place cells (which meet the defined criteria) | 238 | 97 | 110 | 111 | 556 |
| Number of interneurons | 24 | 15 | 10 | 12 | 61 |
| Unit isolation quality (isolation distance, mean ± SEM) | 45.4 ± 7.9 | 23.3 ± 1.6 | 33.6 ± 2.1 | 20.6 ± 0.9 | |
| Accuracy of position estimation during running (overall median) | 6.0 cm | 6.5 cm | 13.1 cm | 13.5 cm | |
| Accuracy of trial-type prediction during running (overall mean) | 89.5% | 77.6% | 74.3% | 75.0% |
Table 2
Replay statistics
| Correct trials | |||||
|---|---|---|---|---|---|
| Candidate-start | Candidate-stem | ||||
| Number | 1893 | 810 | |||
| Replay type | Path-start | Episodic-start | Path-stem | Episodic-center | Episodic-junction |
| Number | 345 | 71 | 190 | 17 | 17 |
| Percent confirmed | 18.2% | 20.6% | 23.5% | 21.5% | 15.3% |
| Percent SWR coincident | 100% | 100% | 99.5% | 98.7% | 100% |
| Erroneous trials | |||||
|---|---|---|---|---|---|
| Candidate-start | Candidate-stem | ||||
| Number | 59 | 58 | |||
| Replay type | Path-start | Episodic-start | Path-stem | Episodic-center | Episodic-junction |
| Number | 9 | 1 | 8 | 0 | 2 |
| Percent confirmed | 15.3% | 12.5% | 13.8% | 0% | 25.0% |
| Percent SWR coincident | 100% | 100% | 100% | – | 100% |
-
SWR, sharp wave/ripple.
Download links
A two-part list of links to download the article, or parts of the article, in various formats.
Downloads (link to download the article as PDF)
Open citations (links to open the citations from this article in various online reference manager services)
Cite this article (links to download the citations from this article in formats compatible with various reference manager tools)
Episodic-like memory trace in awake replay of hippocampal place cell activity sequences
eLife 4:e08105.
https://doi.org/10.7554/eLife.08105


