TGFβ-dependent expression of PD-1 and PD-L1 controls CD8+ T cell anergy in transplant tolerance
- University Paris Descartes, Sorbonne Paris Cité, France
- Institut National de la Santé et de la Recherche Médicale Unit 1151, Institut Necker-Enfants Malades, France
- Institut Necker-Enfants Malades, France
- Juntendo University School of Medicine, Japan
- Charité University Medicine, Germany
- Pasteur Institute, France
Figures
Figure 1 with 3 supplements
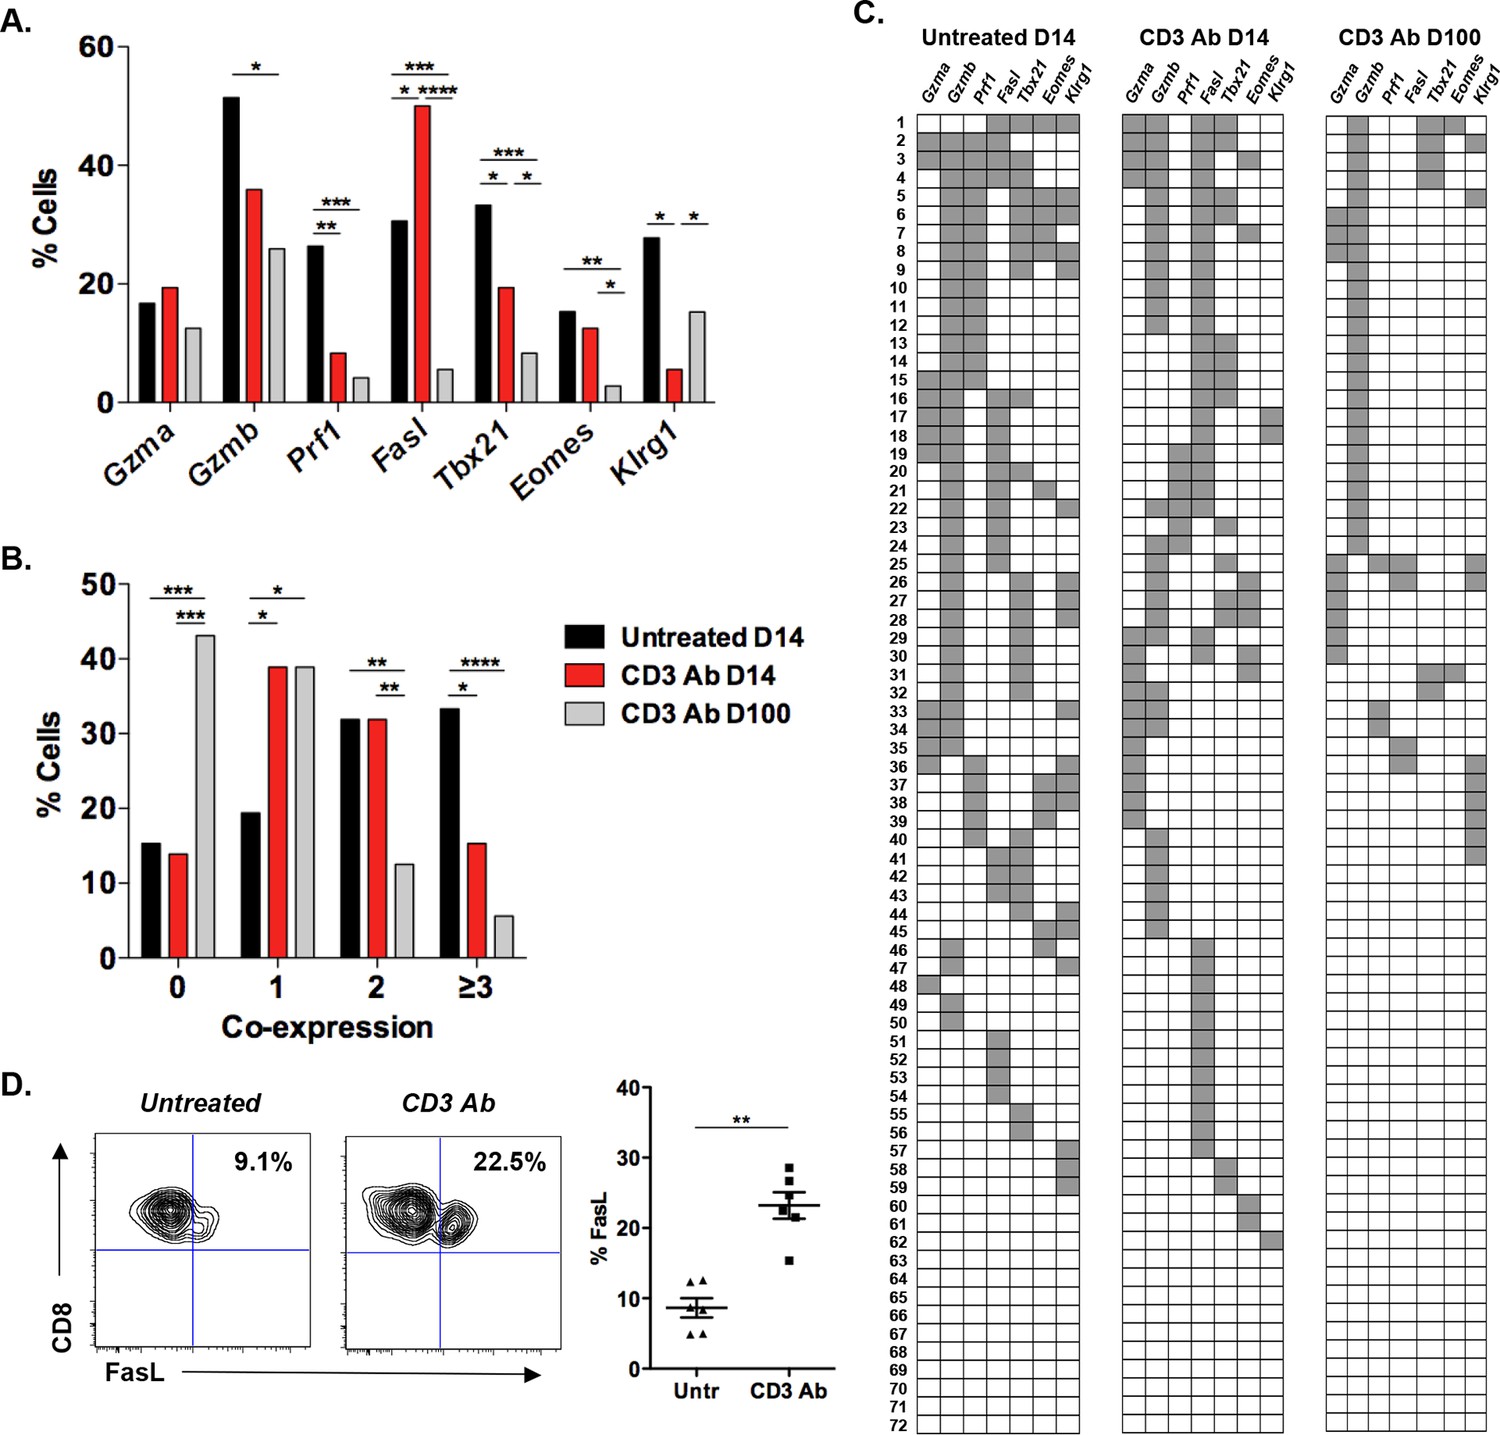
Coexpression of effector genes in graft-infiltrating CD8+ T cells after CD3 antibody therapy.
C57BL/6 mice were transplanted under the kidney capsule with BALB/c pancreatic islets and treated or not with CD3 Abs on day +7 post-transplant. Individual CD8+ T cells (n = 72) present within the graft were FACS sorted on day +14 or day +100 post-transplant and subjected to multiplex gene expression analysis. (A) Proportion of CD8+ T cells among the 72 cells tested that expressed Gzma, Gzmb, Prf1, Fasl, Tbx21, Eomes and Klrg1 mRNA in each group. (B) Polyfunctionality distribution of intragraft CD8+ T cells. (C) Coexpression of inflammatory and cytotoxic molecules by individual graft infiltrating CD8+ T cells. Each row represents one individual cell that is numbered. Each column represents a different gene. For better visualization of coexpression patterns, individual cells were ordered by the degree of gene coexpression. (D) FasL expression by intragraft CD8+ T cells 14 days after transplant and CD3 Ab therapy. (Figures 1A and 1B: χ2 test, *p<0.03, **p<0.01, ***p<0.0003, ****p<0.0001).
Figure 1—figure supplement 1
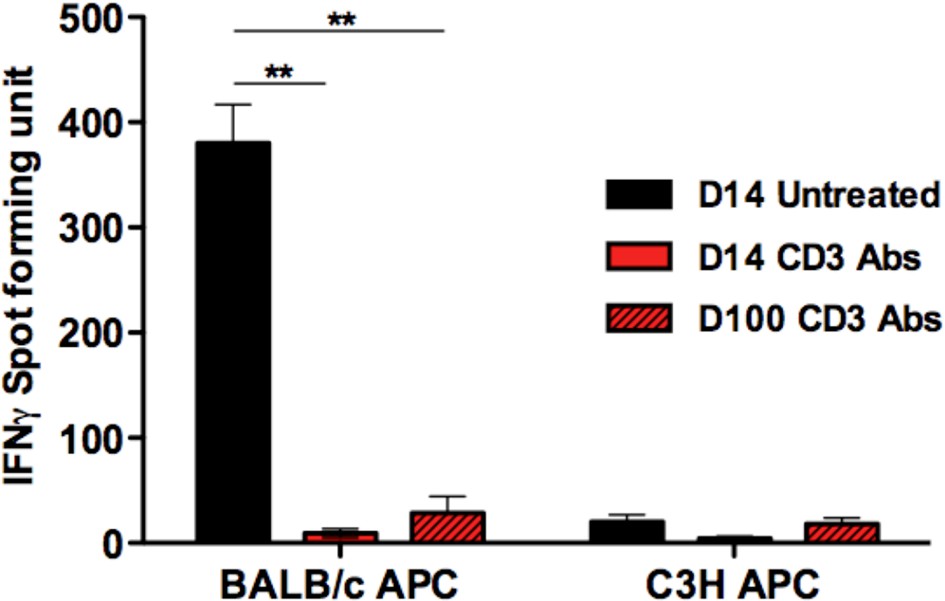
IFNγ responses by intragraft T cells after CD3 Ab therapy.
https://doi.org/10.7554/eLife.08133.004
Figure 1—figure supplement 2
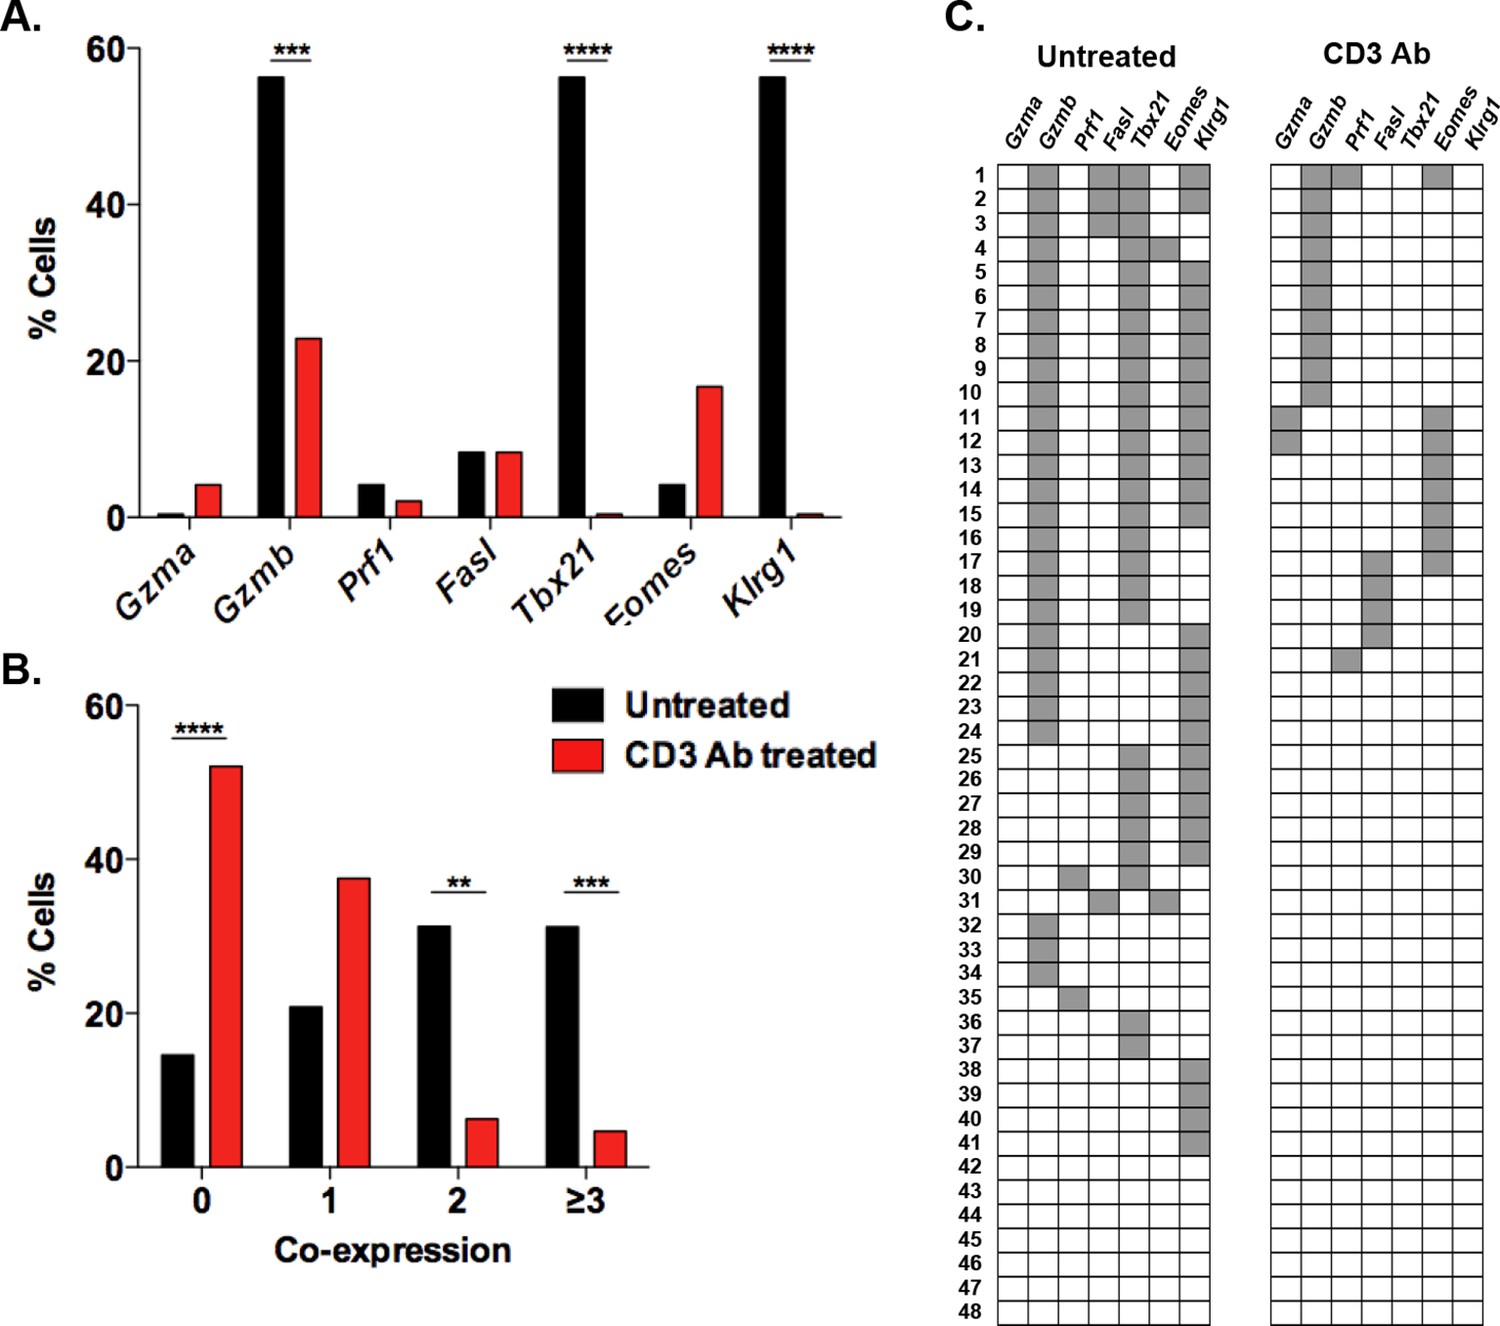
Multiplex gene expression analysis on individual splenic CD8+ T cells after CD3 Ab therapy.
https://doi.org/10.7554/eLife.08133.005
Figure 1—figure supplement 3
Expression of inflammatory, cytotoxic and apoptotic markers by CD8+ T cells.
https://doi.org/10.7554/eLife.08133.006
Figure 2

FasL blockade reversed CD3 antibody-induced transplant tolerance.
(A) Graft survival of BALB/c islets was measured in C57BL/6 mice treated at day 7 with CD3 antibodies (50 μg, 5 days) alone (n = 10) or combined with neutralizing antibodies against FasLigand injected at the dose of 500 μg i.p. on day 6, 7 and 8 post-transplant (n = 4) (*p<0.02 between anti-CD3 and anti-CD3+anti-FasL Ab-treated mice). (B) Additional untreated (n = 6), CD3 Ab (n = 6) or CD3+FasL Ab (n = 2)-treated mice were sacrificed on day +14 post-transplant and proportion of CD8+ T cells was analyzed in the spleen, renal draining lymph nodes (dLN) and the islet allografts (**p<0.003, ***p<0.0006). (C) Expression of FasL by graft infiltrating CD8+ T cells isolated on day +14 from untreated (n = 6), CD3 Abs (n = 6) or CD3+FasL Abs (n = 2)-treated recipients (**p<0.002).
Figure 3 with 2 supplements
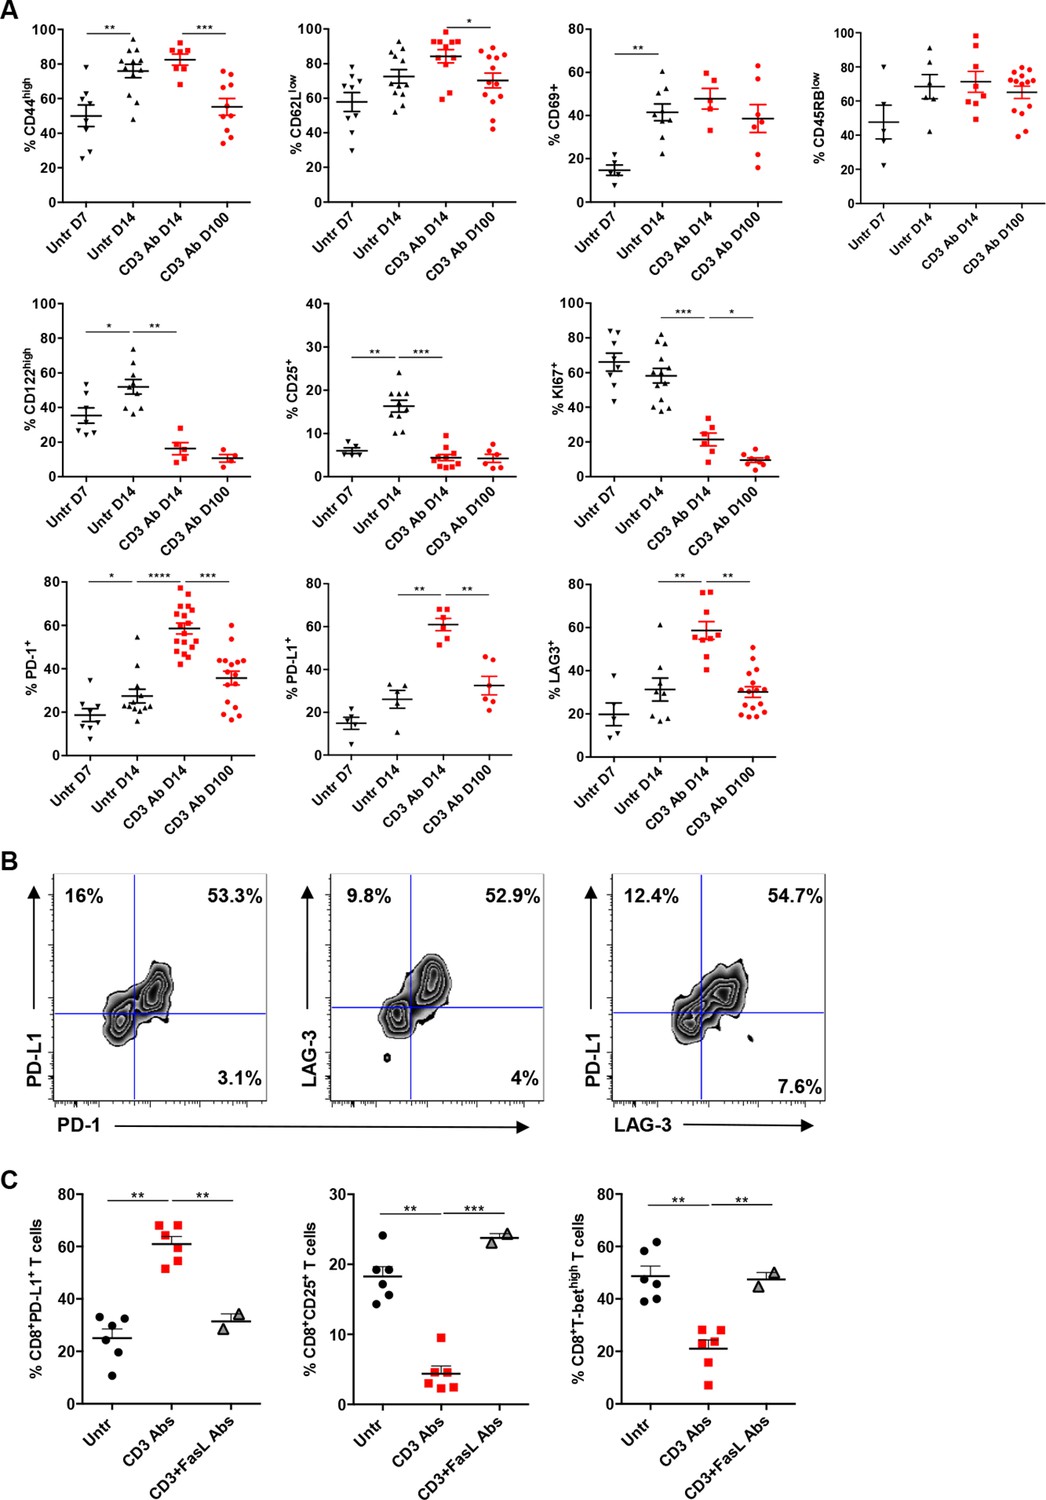
Phenotypic and functional characteristics of tolerant CD8+ T cells.
Pancreatic islet allografts were recovered from C57BL/6 mice after CD3 Ab treatment administered at day +7 post-transplant. (A) Expression of CD44, CD62, CD69, CD45RB, CD122, Ki67, CD25, PD-1, PD-L1 and LAG-3 (6–16/group) was evaluated on CD8+ T cells on day +7, day +14 and day +100 post-transplant (*p<0.05, **p<0.01, ***p<0.001). (B) Co-expression of PD-1/PDL-1, PD-1/LAG-3 and PD-L1/LAG-3 on graft-infiltrating CD8+ T cells recovered from CD3 Ab-treated mice on day +14 post-transplant. (C) Expression of PD-L1, CD25 and T-bet by graft infiltrating CD8+ T cells isolated on day14 from untreated, CD3 Abs or CD3FasL Abs-treated recipients (n = 2–6/group) (**p<0.005).
Figure 3—figure supplement 1
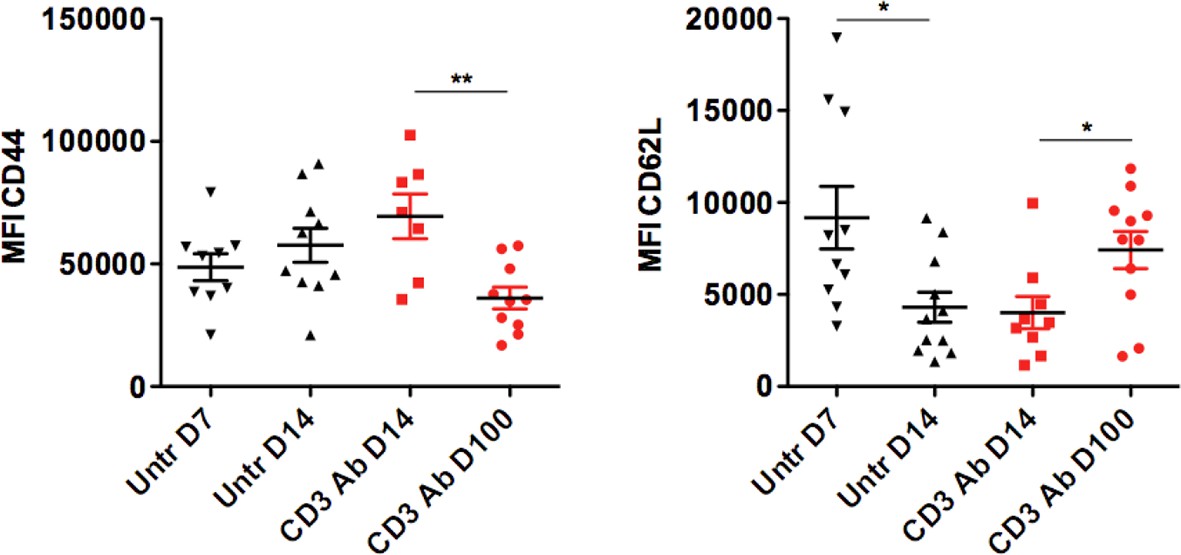
Mean fluorescence intensity of CD44 and CD62L expressed by intragraft CD8+ T cells after CD3 Ab therapy.
https://doi.org/10.7554/eLife.08133.009
Figure 3—figure supplement 2

Phenotype of peripheral CD8+ T cells after CD3 Ab therapy.
https://doi.org/10.7554/eLife.08133.010
Figure 4 with 1 supplement
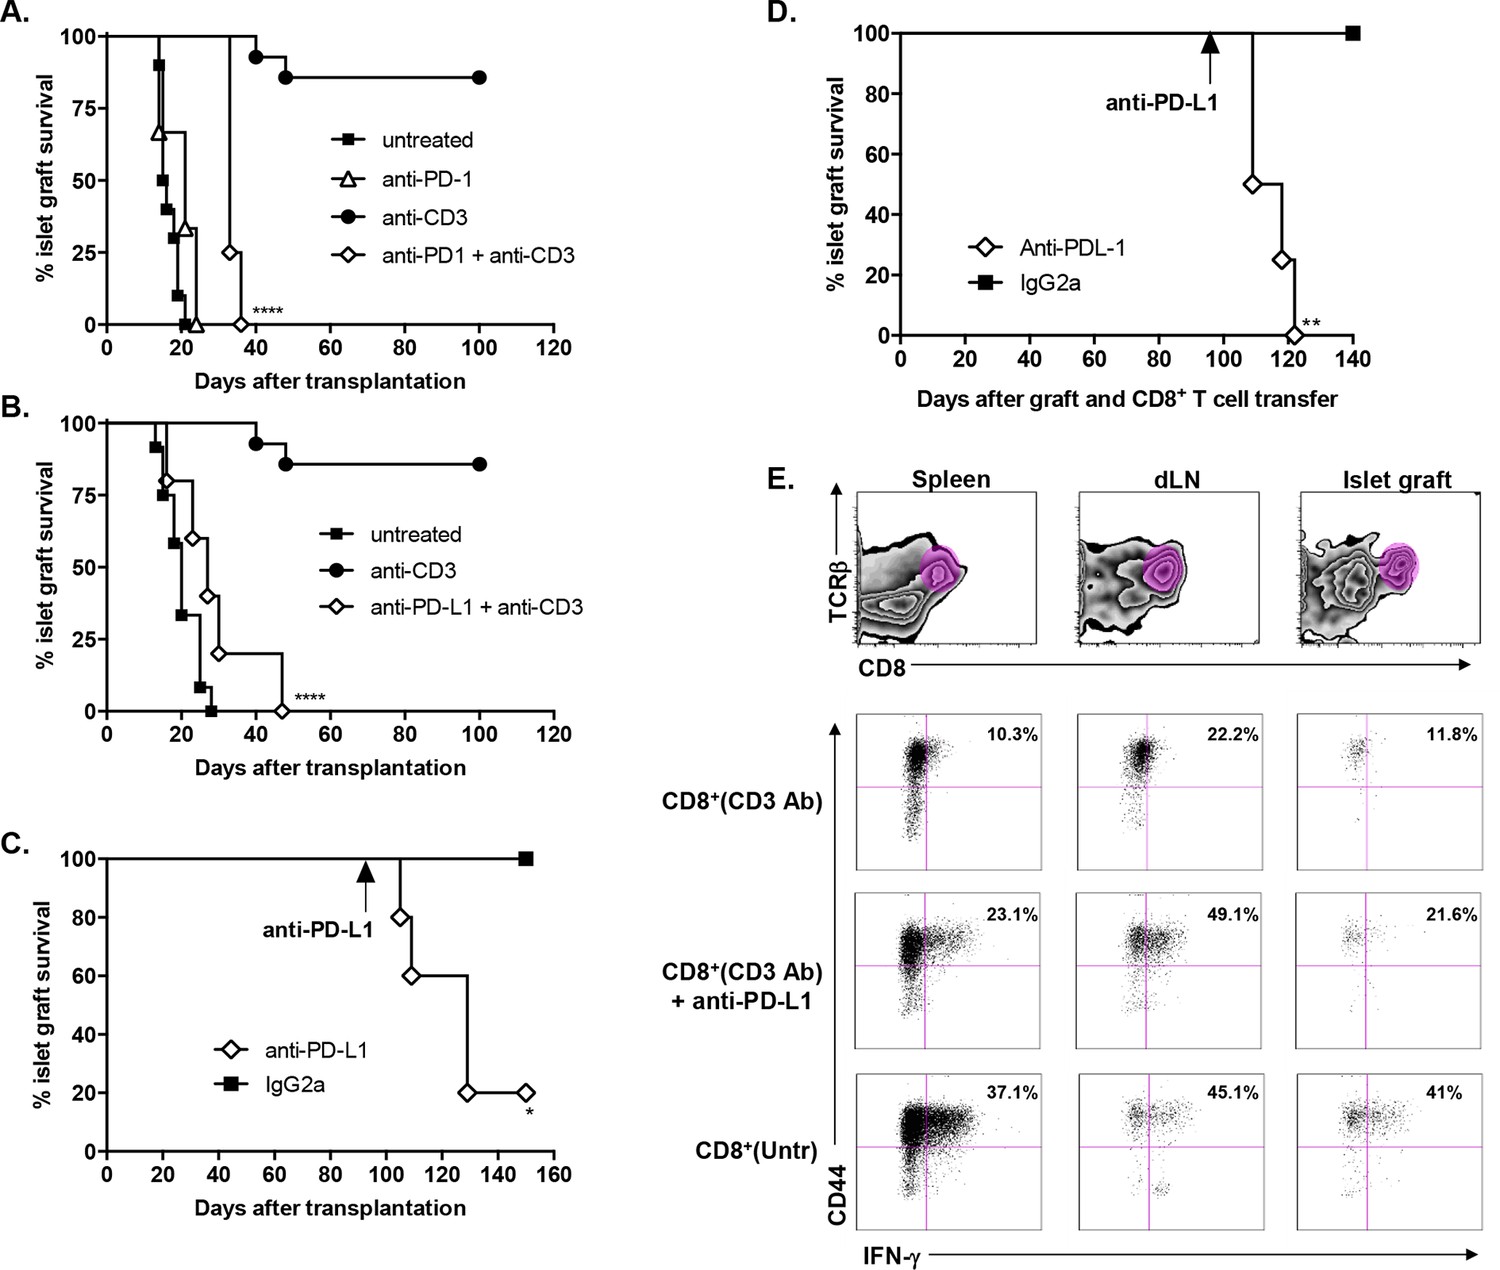
Transplant tolerance and CD8+ T cell anergy rely on the PD-1/PDL-1 pathway.
Graft survival of BALB/c islets was measured in C57BL/6 mice treated at day 7 with a combination of anti-CD3 F(ab’)2 and neutralizing antibodies against PD-1 (panel A, n = 5) or PD-L1 (panel B, n = 5) injected at the dose of 500 μg i.p. every other day for a total of 5 injections. (****p<0.0001 between anti-CD3 and anti-CD3+anti-PD-1/anti-PD-L1 Ab-treated mice). (C) C57BL/6 mice showing long-term islet graft acceptance after CD3 Ab therapy were treated on day +100 post-transplant with anti-PD-L1 antibodies or isotype control IgG2a (n = 5). Graft rejection occurred 2–3 weeks later (*p<0.03). (D) CD8+ T lymphocytes were purified from the spleen of CD3 Ab-treated tolerant C57BL/6 mice and were transferred into C57BL/6 Rag-/- mice (3x10⁶/recipient). Recipient mice were grafted with pancreatic islets from BALB/c on day 0 and graft survival was monitored. On day +100 post-transplant, anti-PD-L1 antibodies or isotype control IgG2a were injected (n = 5) (**p<0.007). (E) Tolerant CD8+ T cells were detected in the spleen, draining lymph nodes and islet allograft of C57BL/6 Rag-/- recipients. IFNγ production and CD44 expression were compared to the ones of CD8+ T cells recovered after treatment with anti-PD-L1 antibodies or of CD8+ T cells issued from untreated C57BL-6 mice and rejecting the islet graft.
Figure 4—figure supplement 1
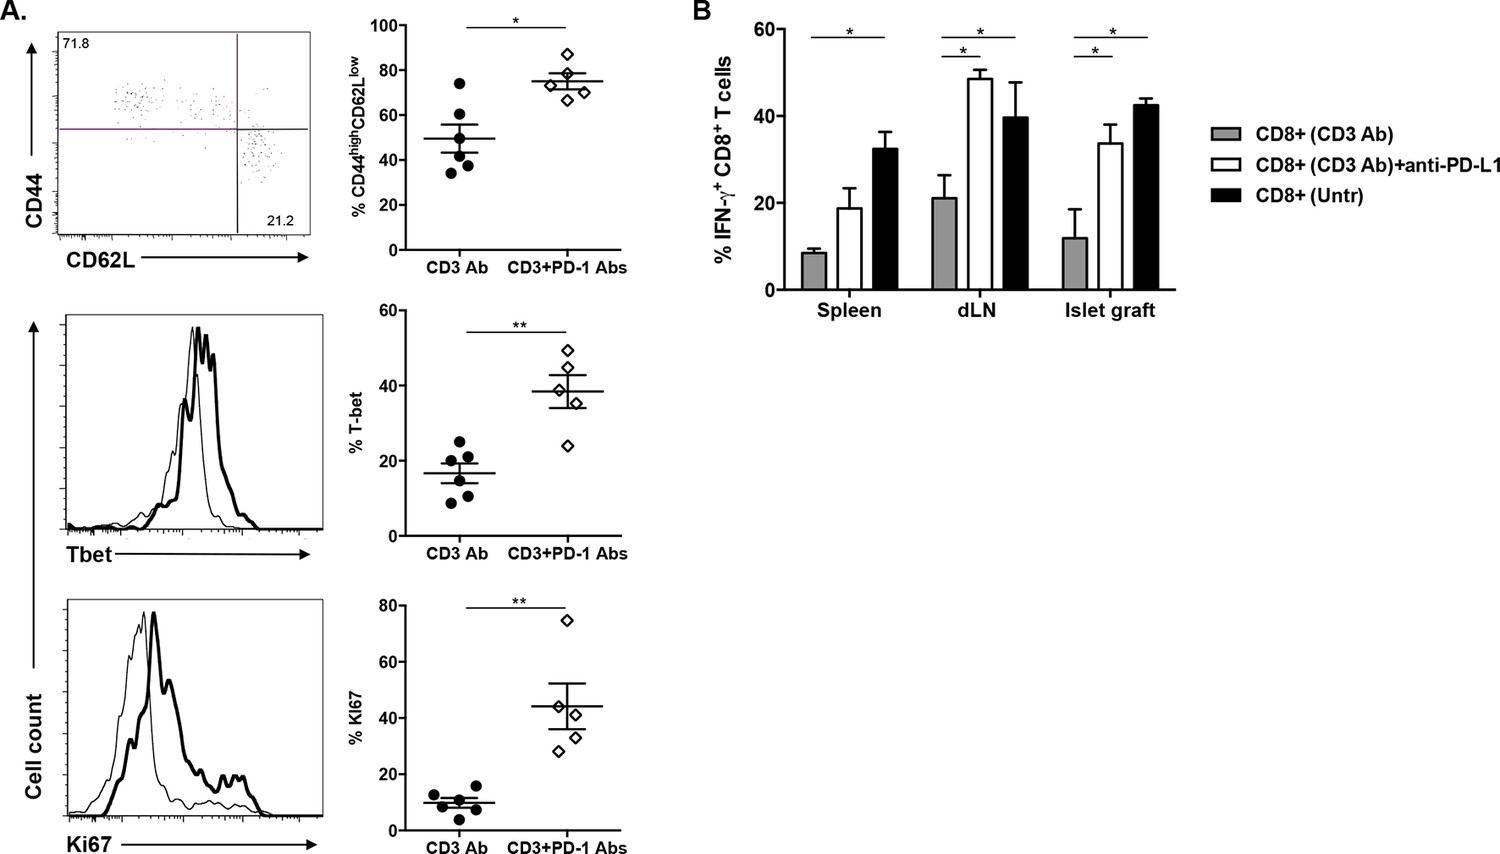
Administration of anti-PD-1 or anti-PD-L1 Abs reversed CD3 Ab-induced unresponsiveness of CD8+ T cells.
https://doi.org/10.7554/eLife.08133.012
Figure 5
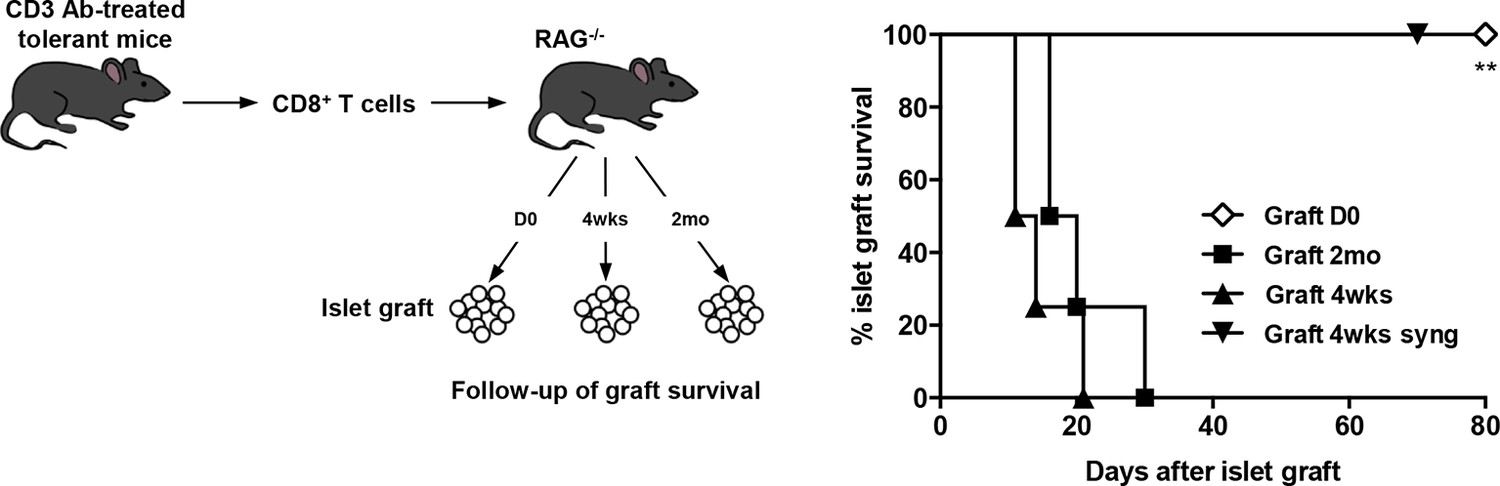
CD8+ T cell anergy depends on the presence of the antigens.
CD8+ T lymphocytes were purified from CD3 Ab-treated tolerant C57BL/6 mice on day +100 post-transplant and were adoptively transferred into C57BL/6 Rag-/- mice (3x10⁶/recipient, day 0). C57BL/6 Rag-/- recipients were transplanted with pancreatic islets from BALB/c donors either on day 0 (D0, n = 4) or 4 weeks (4wks, n = 4) or 2 months (2mo, n = 4) after cell transfer (**p<0.007). Syngeneic islets from C57BL/6 donors were grafted 4 weeks after cell transfer and were used as controls.
Figure 6
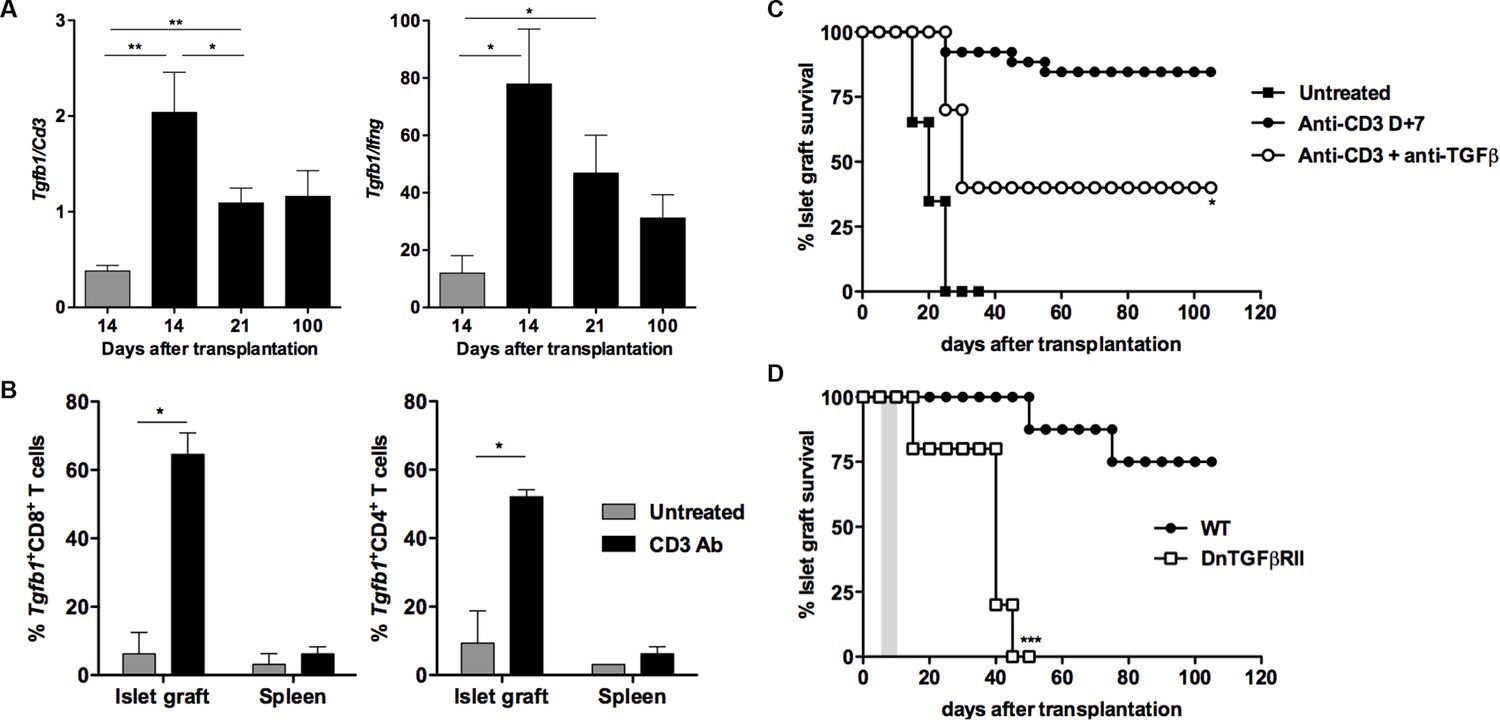
CD3 antibody-induced transplant tolerance depends on in situ TGFβ production and signaling in T cells.
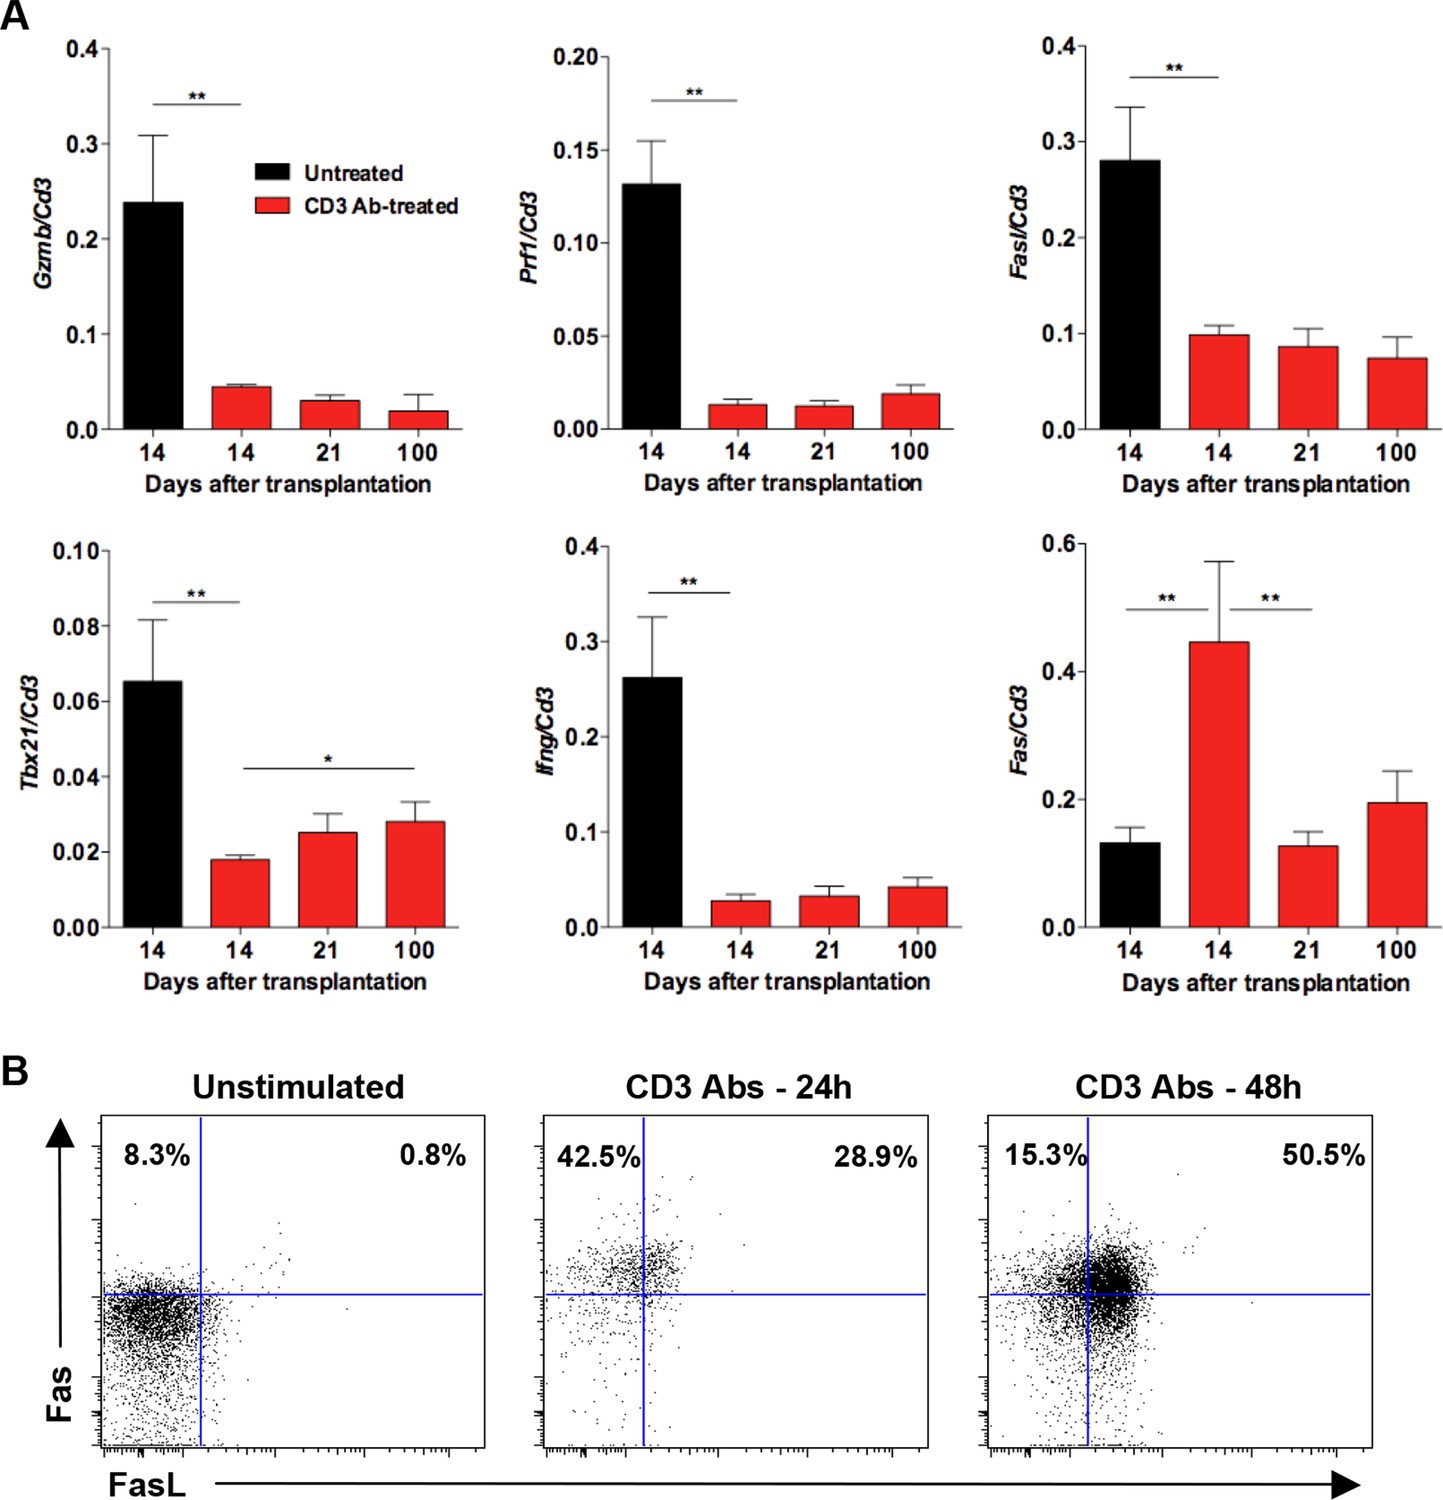
(A) Expression of Tgfb1 mRNA and evaluation of the Tgfb1/Ifng ratio in pancreatic islet allografts recovered at day 14 from untreated mice or day 14, 21 and 100 after transplantation from CD3 Ab-treated recipients. Data are shown as mean ± SEM of 5–9 individual samples (*p<0.05, **p<0.01). (B) Single cell PCR: individual CD4+ (n = 48) and CD8+ (n = 60) T cells were sorted on day +14 post-transplant from the spleen or islet allografts recovered from C57BL/6 mice treated or not with CD3 antibodies. Expression of Tgfb1 mRNA was measured in each cell. Results show the proportion of CD4+ and CD8+ T cells positive for Tgfb expression (*p<0.05). (C) Graft survival of BALB/c islets in wild-type C57BL/6 mice treated at day +7 with anti-CD3 F(ab’)2 and neutralizing TGFβ antibodies (1 mg/injection, twice a week for 3 weeks) (n = 4 to 8 per group, *p<0.05). (D) Abrogation of tolerance in DnTGFβRII C57BL/6 mice transplanted with BALB/c pancreatic islets and treated with CD3 antibodies on day7 post-transplant (n = 5 per group, ***p = 0.0002).
Figure 7 with 1 supplement
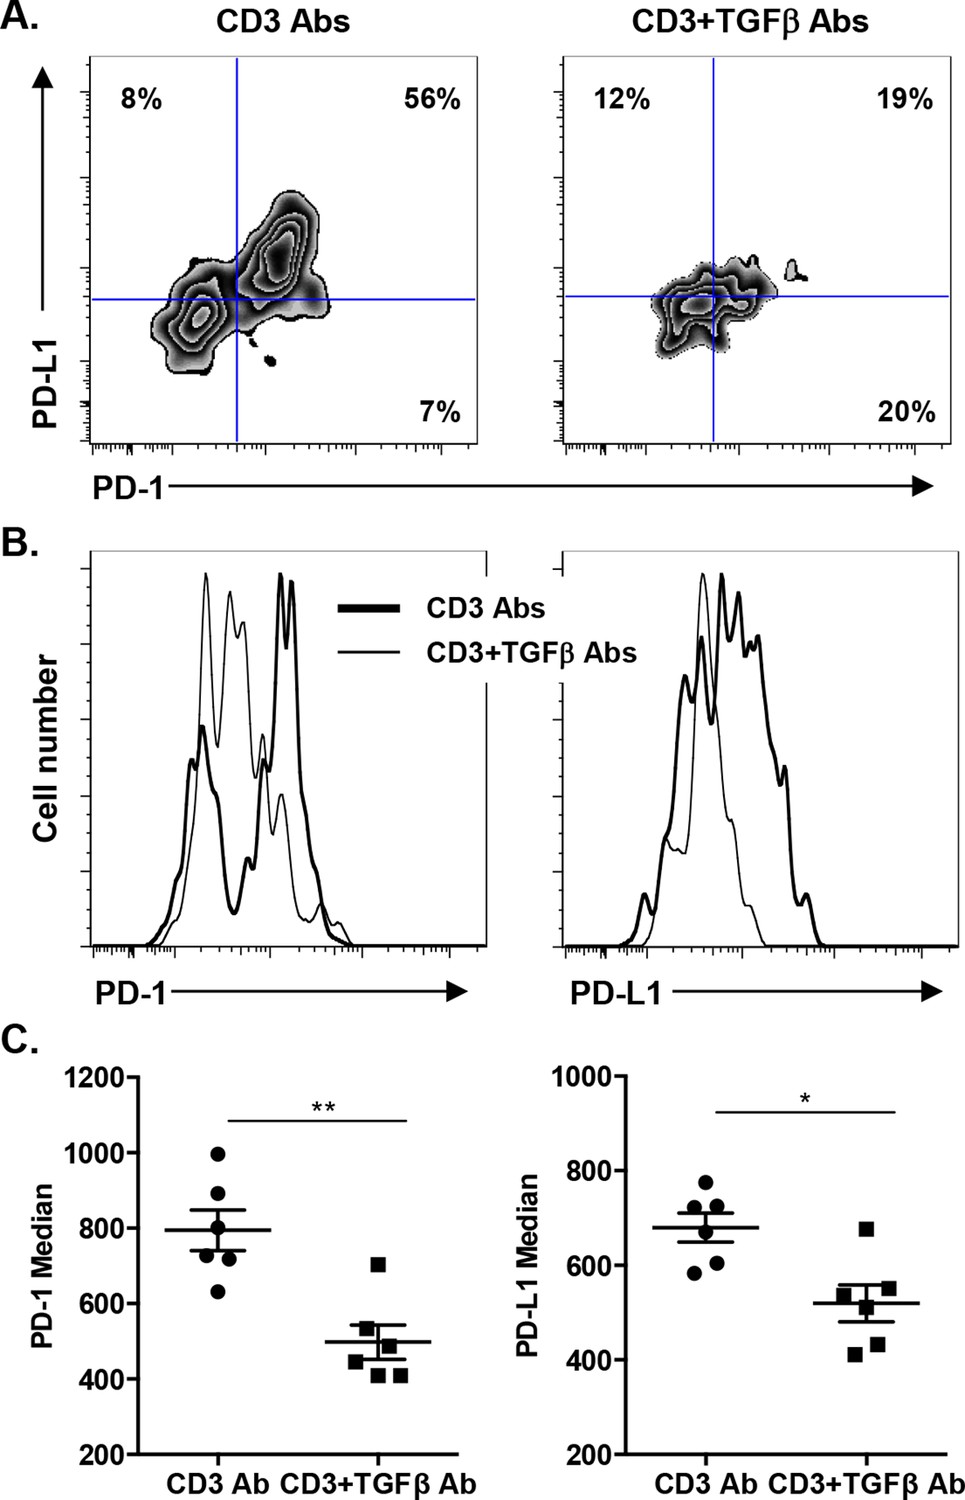
Induction of PD-1 and PD-L1 expression on intragraft CD8+ T cells is regulated by TGFβ.
C57BL/6 mice were transplanted with BALB/c pancreatic islets and treated at day 7 with anti-CD3 F(ab’)2 with or without neutralizing TGFβ antibodies. Mice were sacrificed on day 14 post-transplant and PD-1 and PD-L1 expressions were analyzed on graft-infiltrating CD8+ T cells. (A) Co-expression of PD-1 and PD-L1 on CD8+ T cells. (B) Histograms representing PD-1 and PD-L1 expression. (C) Median fluorescence intensity of PD-1 and PD-L1 (*p<0.02, **p<0.005).
Figure 7—figure supplement 1
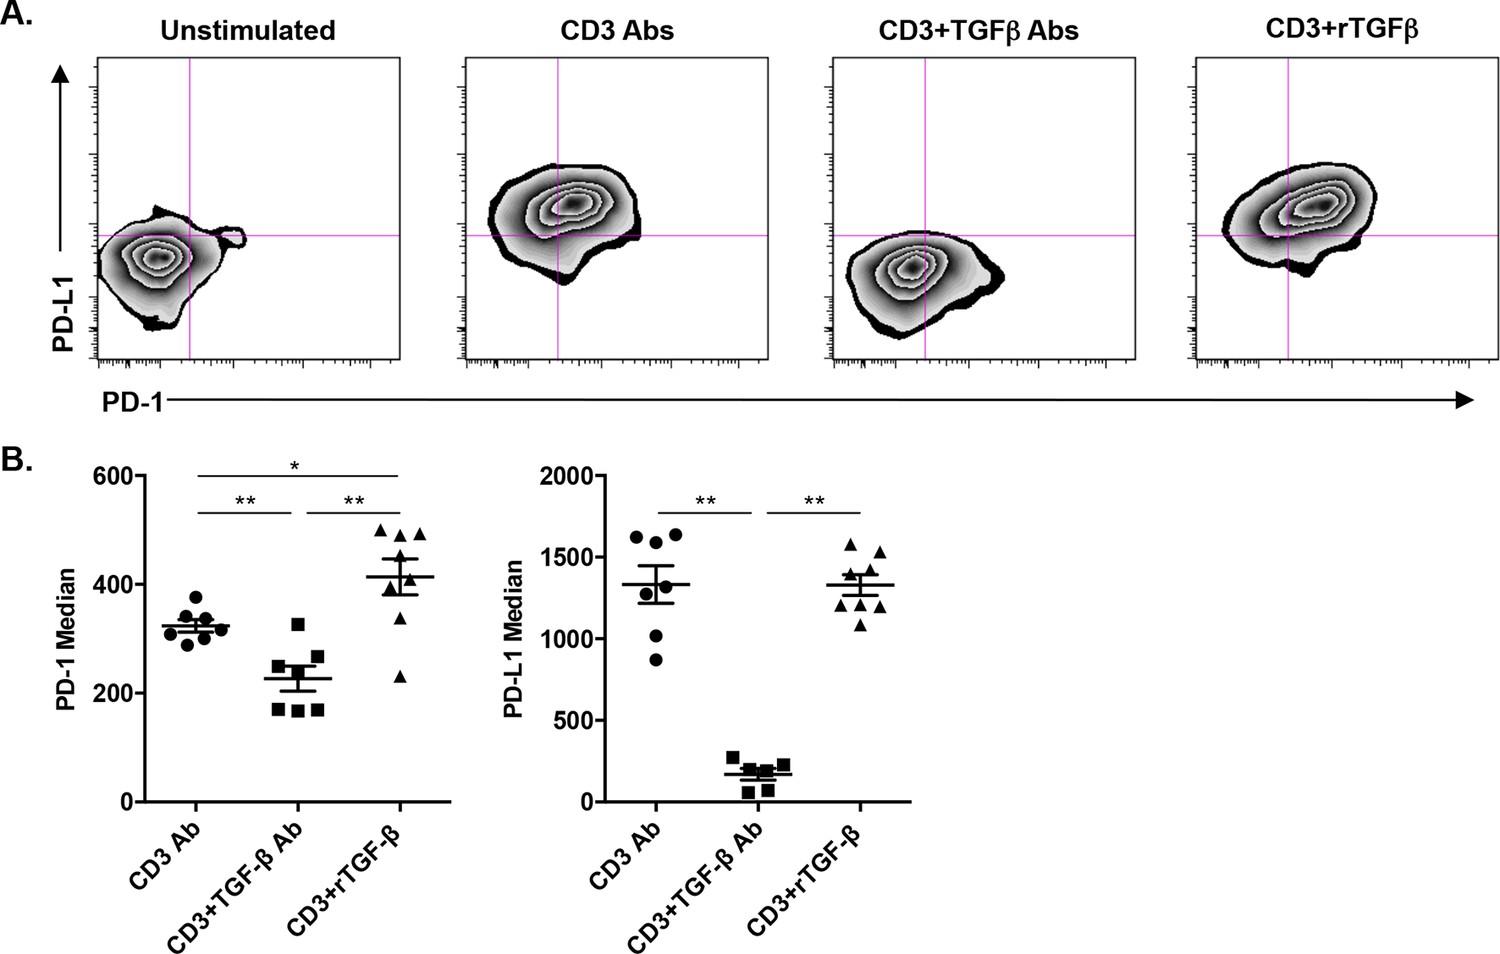
TGFβ modulates PD-1/PD-L1 expression on CD8+ T cells.
https://doi.org/10.7554/eLife.08133.016
Figure 8 with 1 supplement
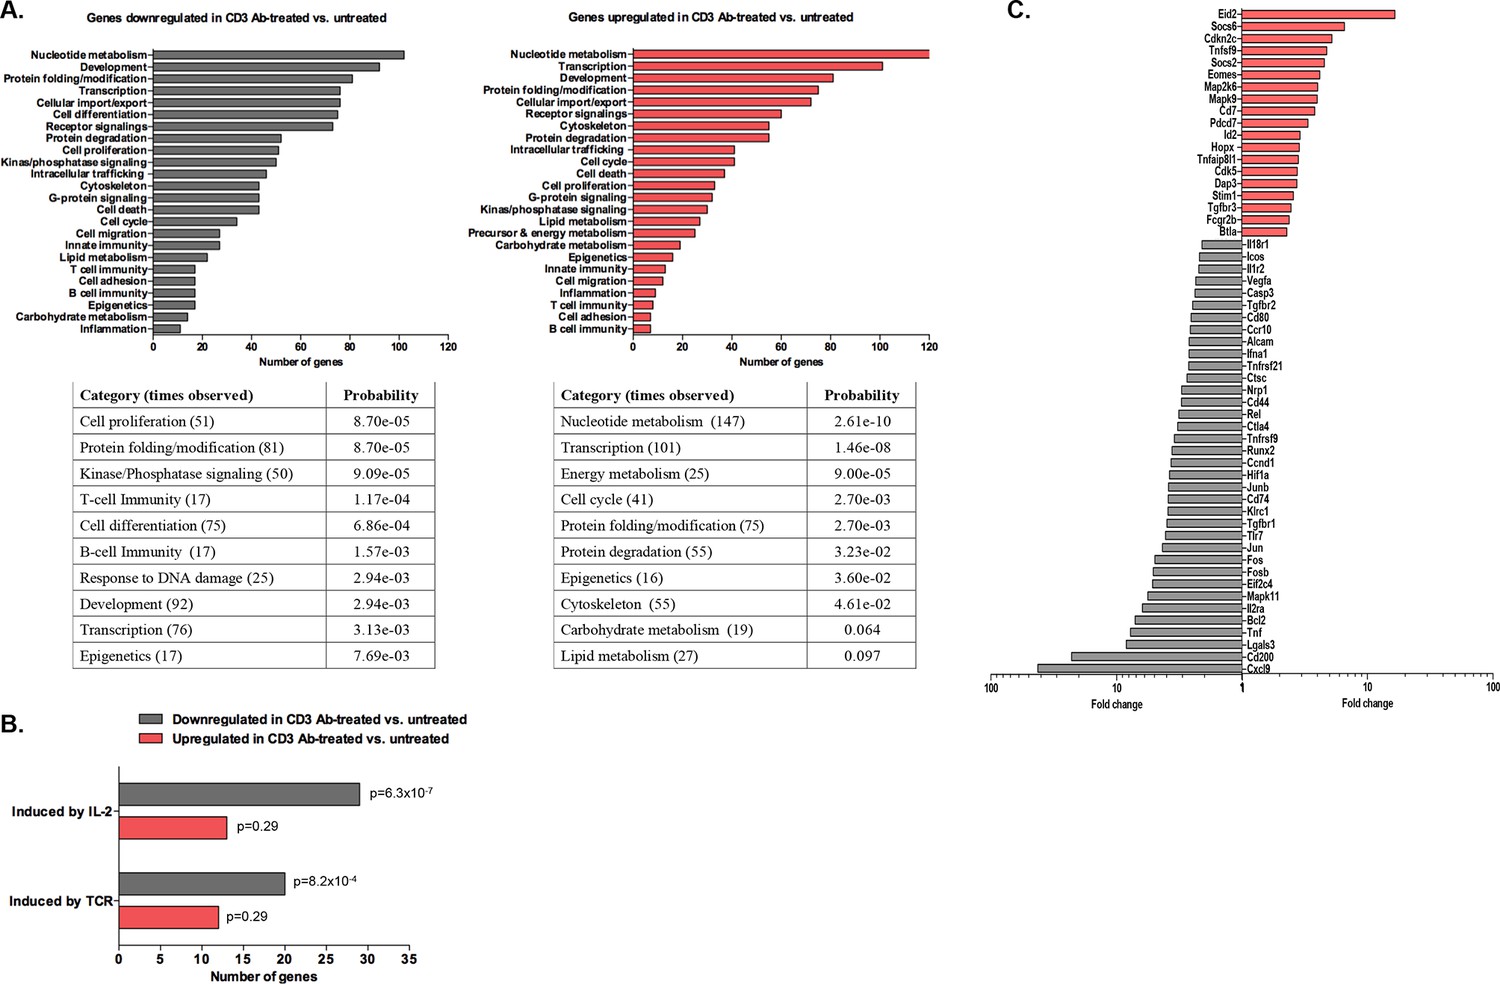
Transcriptomic analysis of tolerant intragraft CD8+ T cells after CD3 Ab therapy.
Five hundred graft-infiltrating CD8+ T lymphocytes were sorted from untreated or CD3 Ab-treated C57BL/6 mice, on day +14 and day +100, respectively (n = 8 per group). Agilent Whole Mouse Genome Microarrays were performed after amplification of RNAs. Functional grouping analysis used annotations derived from Gene Ontology (fold-change >2, p<0.05). (A) Bar chart showing the frequency of representative categories downregulated (left panel) or upregulated (right panel) in tolerant CD8+ T cells as compared to CD8+ T cells from untreated recipient mice. Below, statistically enriched categories were indicated by their adjusted p-value (only the top 10 categories, Fisher’s exact test with Benjamini-Hochberg correction for multiple testing). (B) Bar chart showing the frequency of target pathways induced by IL-2 ou TCR signaling. (C) Selection of immune genes that were downregulated (grey bars) or upregulated (red bars) in tolerant CD8+ T cells as compared to CD8+ T cells from untreated recipient mice (fold-change >2, p<0.05).
-
Figure 8—source data 1
Genes upregulated in anergic CD8+ T cells from CD3 Ab-treated recipient mice.
- https://doi.org/10.7554/eLife.08133.018
Figure 8—figure supplement 1
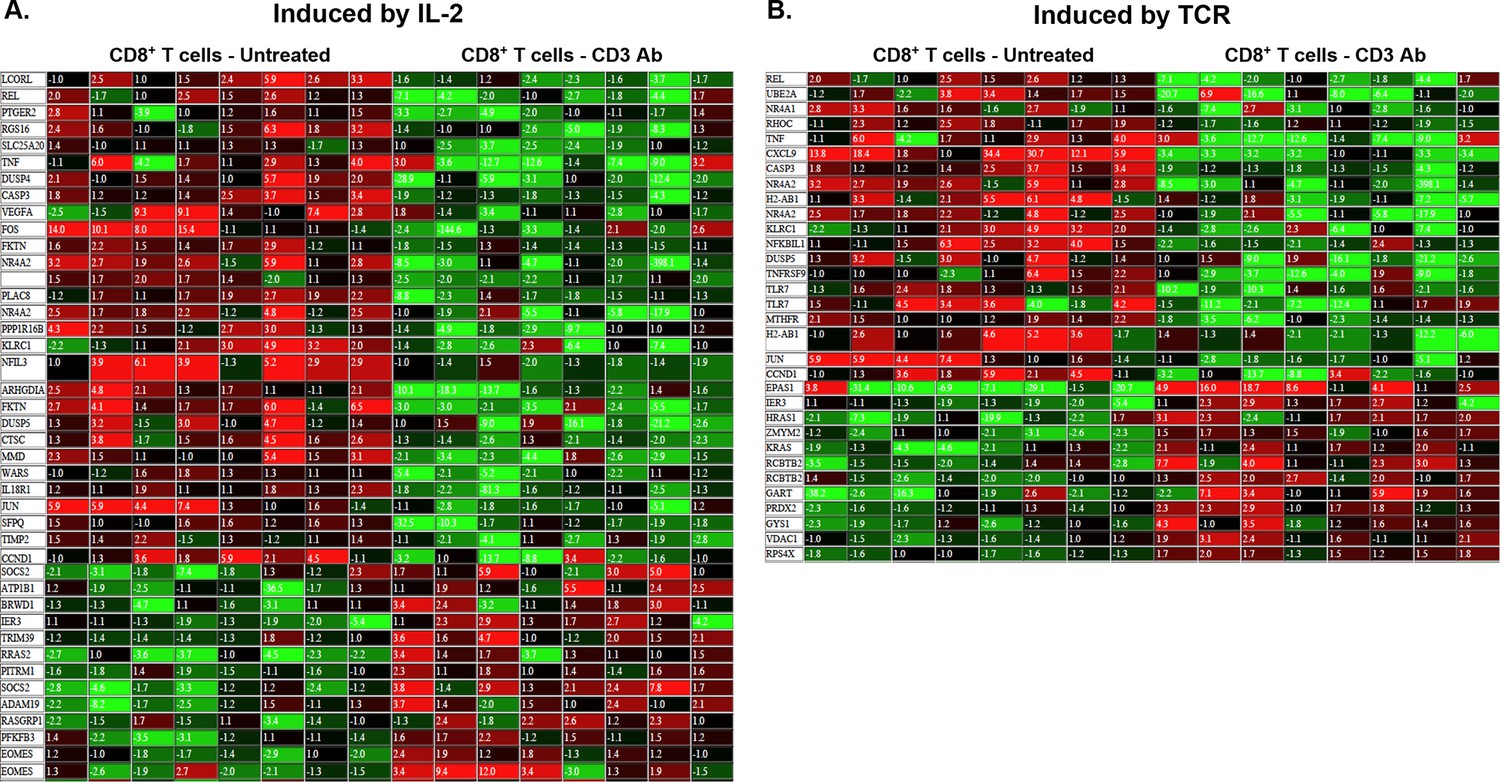
Heatmap of genes induced by IL-2 (A) or TCR (B) that are differentially expressed (>twofold, p<0.05) in CD8+ T cells recovered from pancreatic islet allografts of CD3 antibody-treated tolerant mice (day +100 post-transplant) or of untreated mice (day +14 post-transplant).
https://doi.org/10.7554/eLife.08133.019
Author response image 1
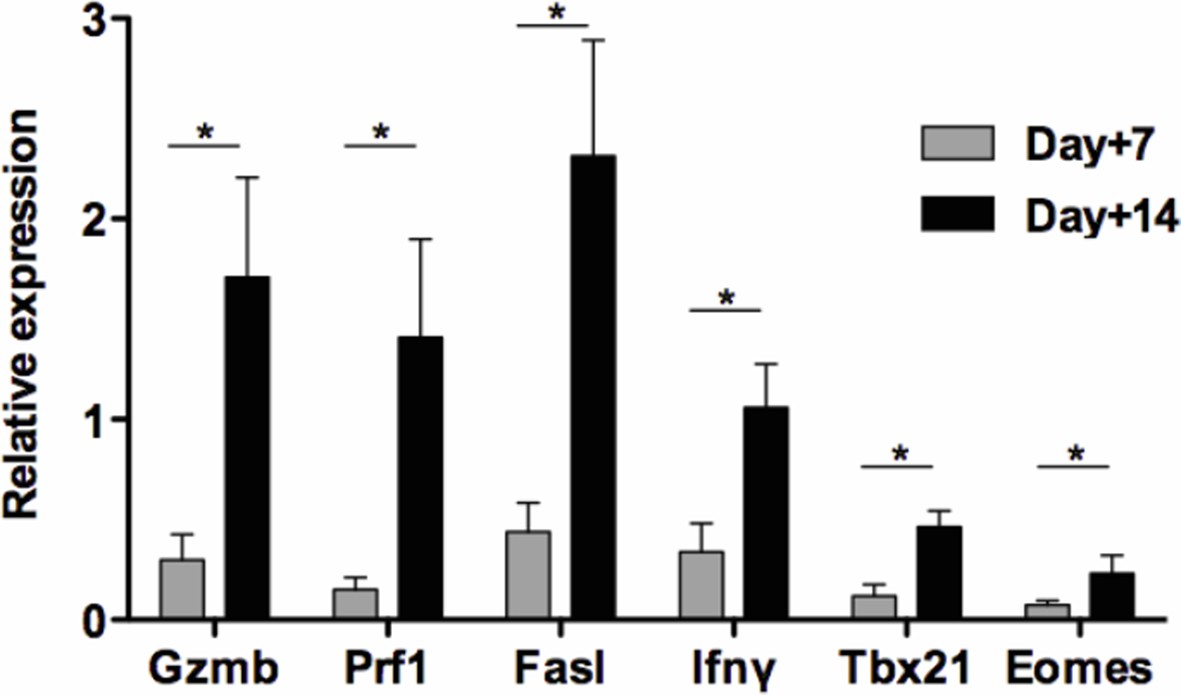
Kinetics of intragraft effector gene expression in untreated recipients.
Pancreatic islets from BALB/c mice were transplanted under the kidney capsule of C57BL/6 recipients. Allografts were recovered on day 7 and 14 post-transplant and expression Gzmb, Prf1, Fasl Ifnγ, Tbx21 and Eomes mRNA was analyzed by RT-qPCR (n = 4-5) (*p<0.05).
Author response image 2

Intragraft T cell counts.Pancreatic islet allografts were recovered from untreated (left) or CD3 antibody-treated (right) mice and CD4+ and CD8+ T cells were counted at different time-points post-transplant.
CD3 antibody treatment was applied on day +7 post-transplant for 5 days (gray area).
Download links
A two-part list of links to download the article, or parts of the article, in various formats.
Downloads (link to download the article as PDF)
Open citations (links to open the citations from this article in various online reference manager services)
Cite this article (links to download the citations from this article in formats compatible with various reference manager tools)
TGFβ-dependent expression of PD-1 and PD-L1 controls CD8+ T cell anergy in transplant tolerance
eLife 5:e08133.
https://doi.org/10.7554/eLife.08133


