Peripheral sensory coding through oscillatory synchrony in weakly electric fish
- Washington University in St. Louis, United States
Figures
Figure 1
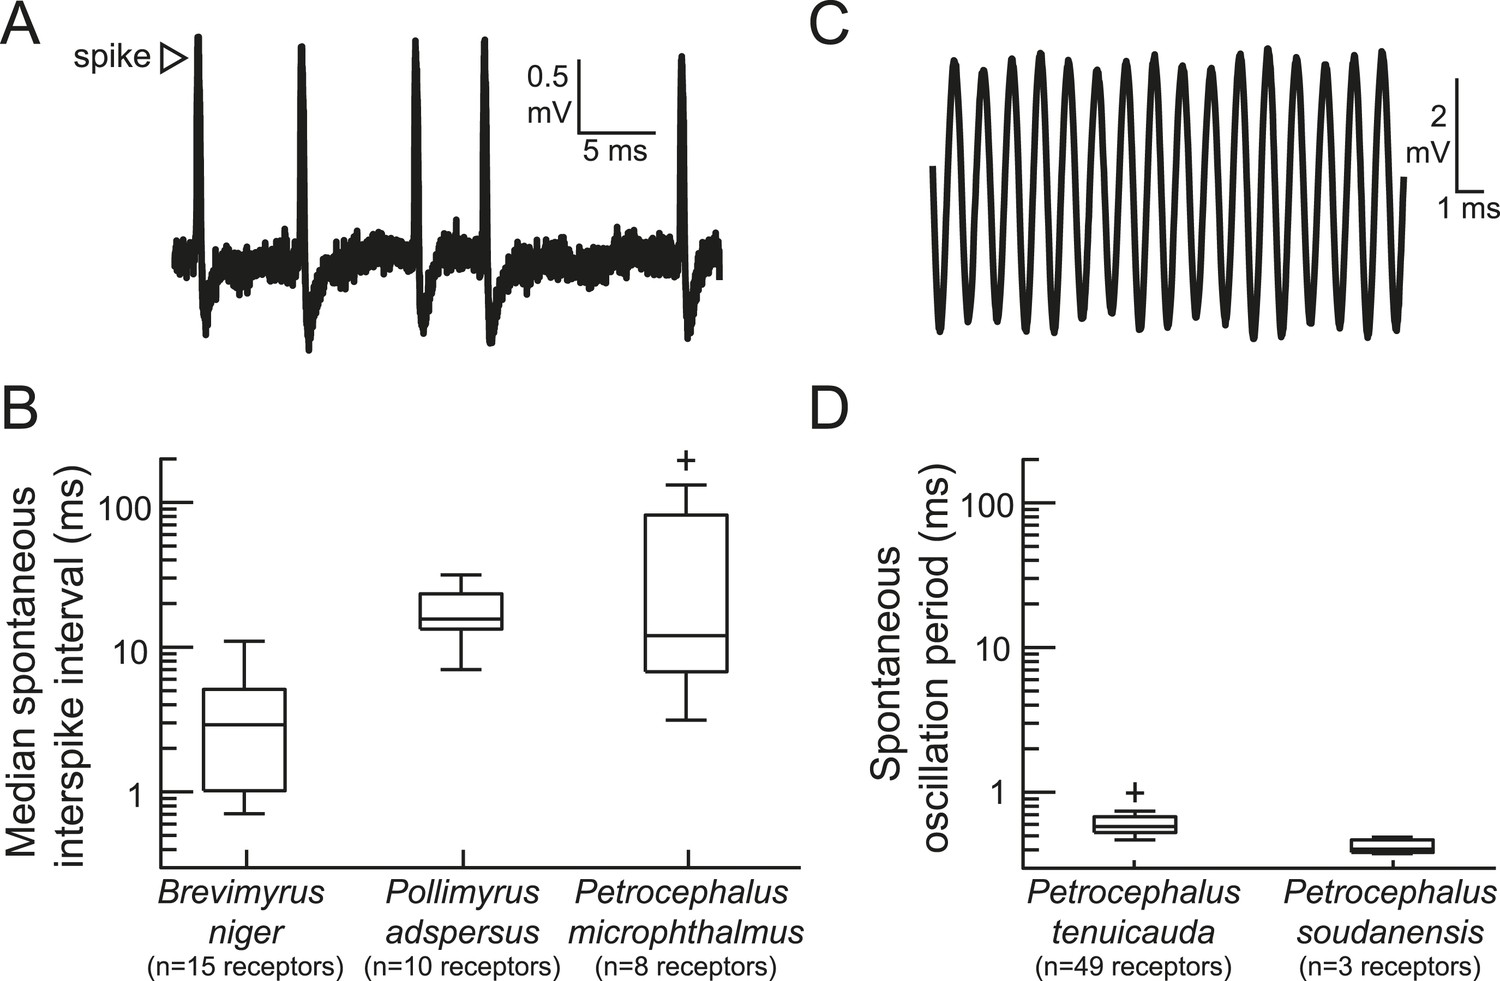
The peripheral sensory receptors of some mormyrid species fire spikes, whereas the receptors of other species produce spontaneously oscillating potentials.
(A) An extracellular recording of spontaneous spikes from a receptor of Petrocephalus microphthalmus. (B) Box plots of spontaneous interspike intervals in the receptors of three species. (C) An extracellular recording of spontaneously oscillating receptor potentials in Petrocephalus tenuicauda. (D) Box plots of spontaneous oscillation periods in the receptors of two species. In P. tenuicauda, the amplitude of oscillatory activity varied from 0.04 to 6.1 mV. We only measured the frequency of spontaneous activity if the oscillation amplitude was at least 2.5 times baseline noise (≥0.1 mV). 49 of 69 (71%) receptors met these criteria. The receptors of Petrocephalus soudanensis had spontaneous oscillation amplitudes of 0.09, 0.4, and 1.9 mV and frequencies of 2.1, 2.6, and 2.5 kHz, respectively.
Figure 2
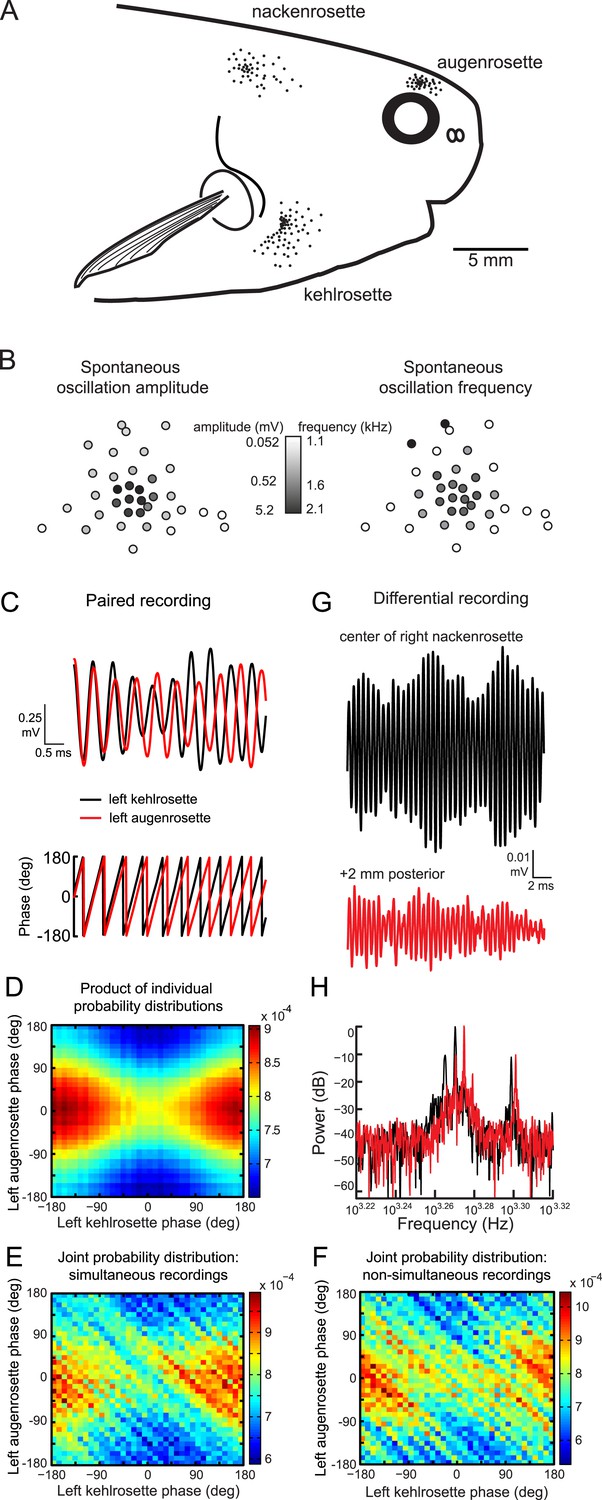
Spontaneous oscillatory activity is not synchronized across receptors.
(A) Receptor locations on the right side of one P. tenuicauda are illustrated as black dots (receptor size not to scale). (B) An approximate map of all 36 receptors in the right augenrosette of one P. tenuicauda. This map comes from a different fish than shown in A. (C) Top, simultaneous extracellular recordings from a receptor in the left kehlrosette (black) and a receptor in the left augenrosette of one P. tenuicauda. Bottom, instantaneous oscillatory phases of the simultaneous recordings obtained through Hilbert transform of the recorded potentials. (D) The product of the individual probability distributions of instantaneous phases from the same two receptors shown in C. The product of the individual probability distributions from each of five separate 1-s recordings was calculated. The average product across these five recordings is shown. (E) The joint probability distribution of instantaneous phases of the two receptors shown in C and D. The joint probability distribution was calculated over five separate 1-s recordings and then averaged. (F) The joint probability distribution of instantaneous phases of the first of five recordings from one receptor and the last of five recordings from the other receptor, and vice versa. The joint probability distributions from these two non-simultaneous recording pairs were averaged. (G) Differential extracellular recordings from a position centered over the right nackenrosette (black) and a position 2 mm posterior (red) in one P. tenuicauda. The recording and reference terminals of the electrode were separated by 5 mm. (H) Power spectra for the differential recordings shown in G. Only the frequency range where peaks occurred is shown (∼1.7–2.1 kHz).
Figure 3
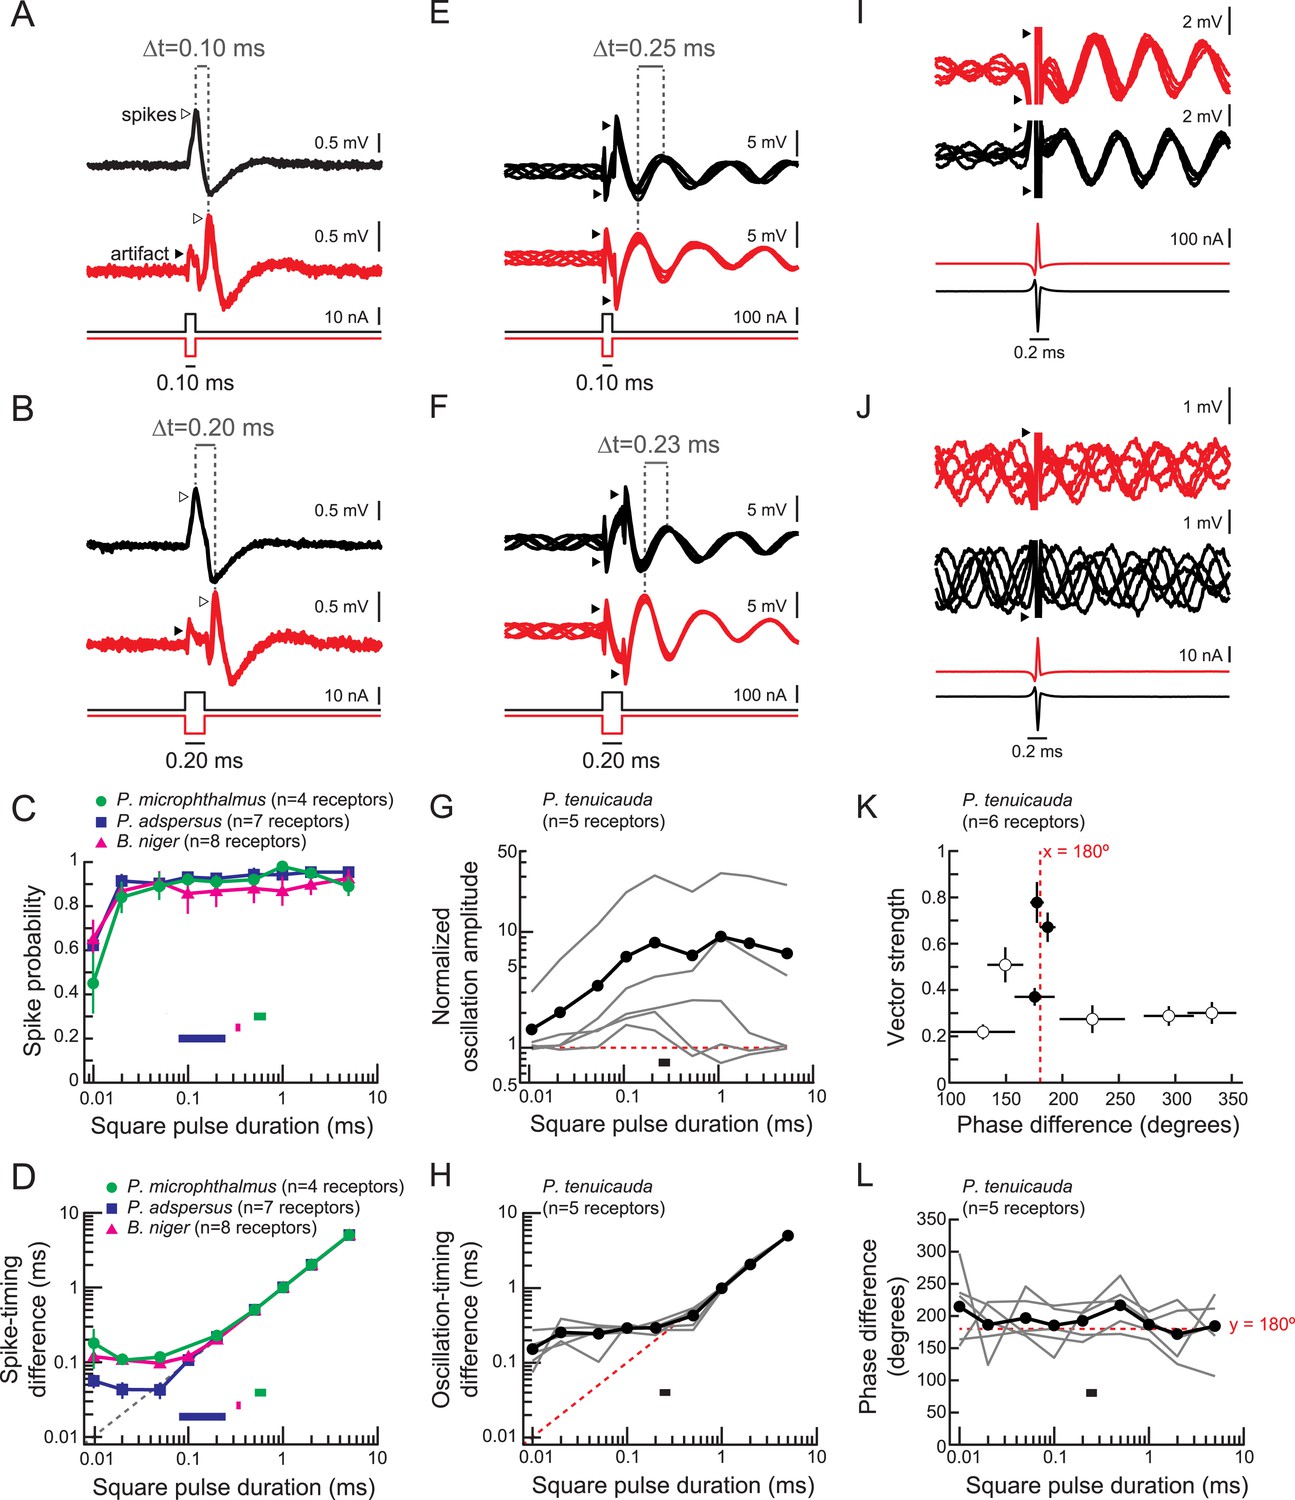
Spiking receptors encode pulse duration, whereas oscillating receptors do not.
(A, B) Extracellular recordings from a spiking receptor in B. niger during stimulation with positive-polarity (black) and negative-polarity (red) monopolar square pulses of 0.10-ms duration (A) and 0.2-ms duration (B). In both cases, the difference in spike times (Δt) matches the pulse duration. Traces from five stimulus repetitions are superimposed. (C) Spike probability vs square pulse duration for responses to positive-polarity stimuli for spiking receptors of three species. Horizontal bars indicate the behaviorally relevant ranges of total durations measured in 10 conspecific electric organ discharge (EOD) waveforms. (D) Spike-timing differences between responses to positive- and negative-polarity stimuli vs square pulse duration for the same receptors in C. (E, F) Extracellular recordings from an oscillating receptor in P. tenuicauda during stimulation with positive- (black) and negative- (red) polarity monopolar square pulses of 0.10-ms duration (E) and 0.20-ms duration (F). In both cases, the timing difference (Δt) between oscillatory peaks elicited by opposite-polarity stimuli does not match the pulse duration. Traces from five stimulus repetitions are superimposed. (G) Evoked oscillation amplitudes normalized to prestimulus oscillation amplitudes vs square pulse duration for oscillating receptors. Curves for each receptor are shown in gray, and the averages across receptors are shown in black. The horizontal bar indicates the range of total durations of 10 conspecific EODs. (H) Oscillation-timing differences between responses to positive- and negative-polarity stimuli vs square pulse duration for the same receptors shown in G. (I, J) Extracellular recordings from an oscillating receptor in P. tenuicauda in response to a head-positive (‘normal polarity’) conspecific EOD waveform (black) and the reverse-polarity waveform (red) at an intensity of 316 nA (I) and 32 nA (J). Traces from five stimulus repetitions are superimposed. (K) Vector strength vs phase difference of oscillatory responses to opposite-polarity conspecific EODs in P. tenuicauda. Each point represents the mean of responses from six receptors. Vector strength was averaged across stimulus polarity within each receptor before averaging across receptors. Error bars represent S.E.M. Closed circles indicate phase resets that were significantly different for normal- vs reversed-polarity EODs (Hotelling test for paired circular data, F > Fcrit = 6.9, p < 0.05). The stimulus intensities that evoked significantly different phase resets for opposite polarity EODs were 56, 178, and 316 nA. Intensities of 100 nA and <56 nA did not result in significantly different phase resets. (L) Phase differences between responses to positive- and negative-polarity stimuli vs square pulse duration for oscillatory responses to monopolar square electric pulses.
Figure 4
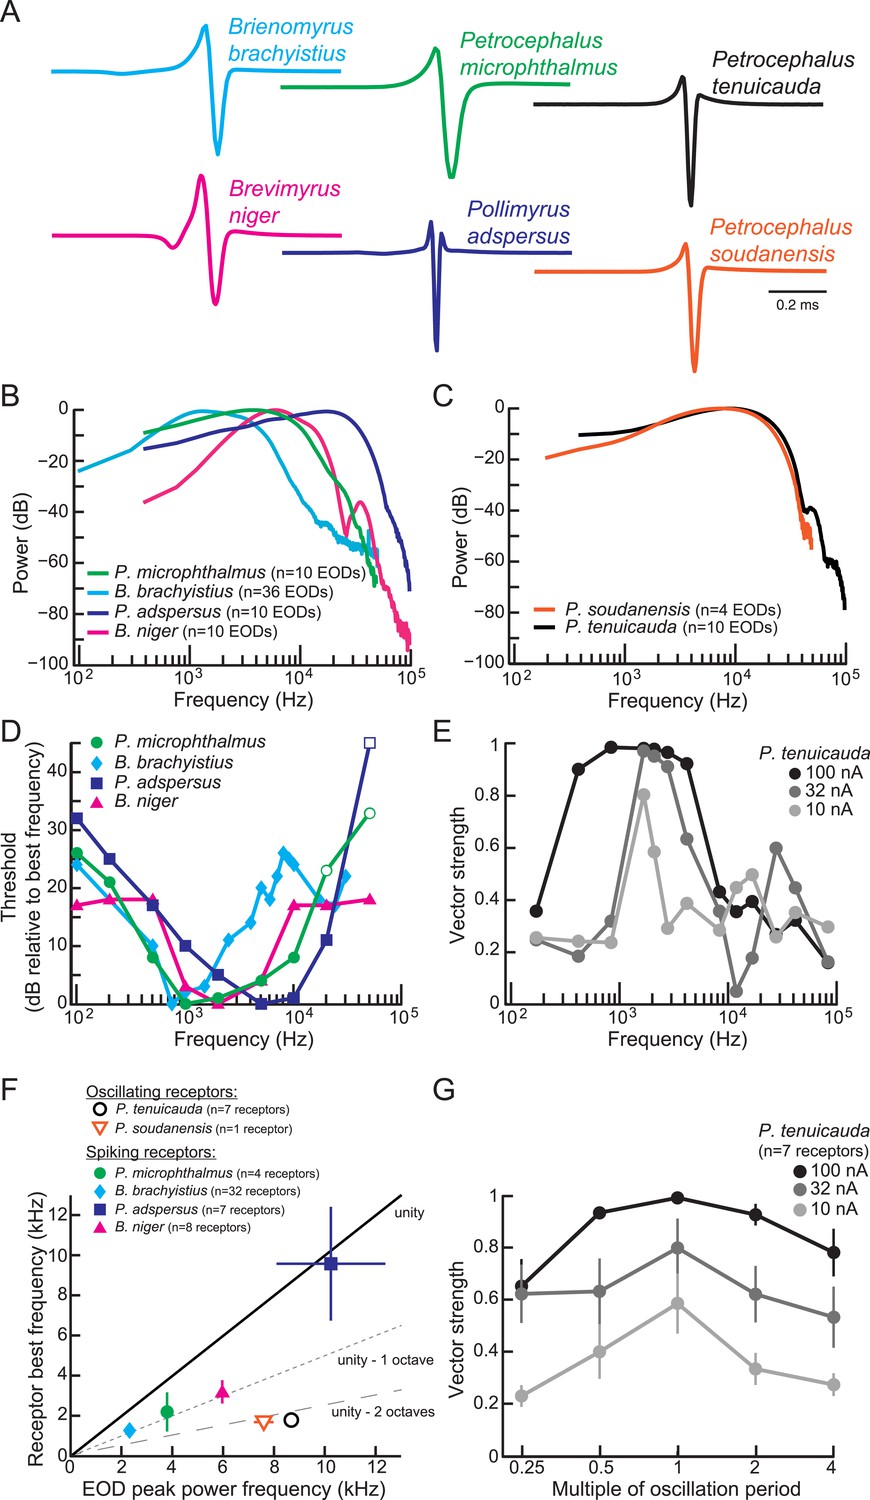
Frequency sensitivity of spiking receptors is matched to conspecific EOD power spectra, whereas frequency sensitivity of oscillating receptors is not.
(A) Representative EODs from four species with spiking receptors (Brienomyrus brachyistius, P. microphthalmus, Brevimyrus niger, and Pollimyrus adspersus), and two species with oscillating receptors (P. tenuicauda and P. soudanensis), plotted head-positive up with normalized peak-to-peak heights. (B, C) Average power spectra of EODs from species with spiking receptors (B) and from species with oscillating receptors (C). (D) Frequency tuning curves for representative spiking receptors from four species. Threshold was determined as the lowest intensity stimulus that elicited a spiking response. The frequency with the lowest threshold was taken as the receptor's best frequency. Thresholds were defined as dB relative to the threshold at each receptor's best frequency. Open symbols indicate stimuli for which there was no response from the receptor at the intensity shown, but responses to higher intensities were not recorded. (E) Frequency tuning curves for a representative oscillating receptor from P. tenuicauda at three intensities. Stimuli were single-cycle bipolar sine waves with positive polarity (peak preceding trough). Vector strength was used as a measure of phase-locking across responses. Vector strength equals 1 when the phase of the oscillatory reset is the same for each stimulus presentation and 0 when the phase of oscillatory reset is completely random for each stimulus presentation. The frequency that elicited the highest vector strength was taken as each receptor's best frequency. (F) Average receptor best frequency vs average conspecific EOD peak power frequency for all species studied. Best frequencies were averaged across responses to positive- and negative- (trough preceding peak) polarity stimuli in oscillating receptors. We used the best frequencies at 10 nA in P. tenuicauda. Closed symbols denote species with spiking receptors and open symbols denote species with oscillating receptors. (G) Vector strength of oscillating responses to positive-polarity single-cycle bipolar sine stimuli at multiples of receptors' spontaneous oscillation periods at three intensities in P. tenuicauda. Each point in F and G represents the average across receptors where appropriate, and error bars represent S.E.M.
Figure 5
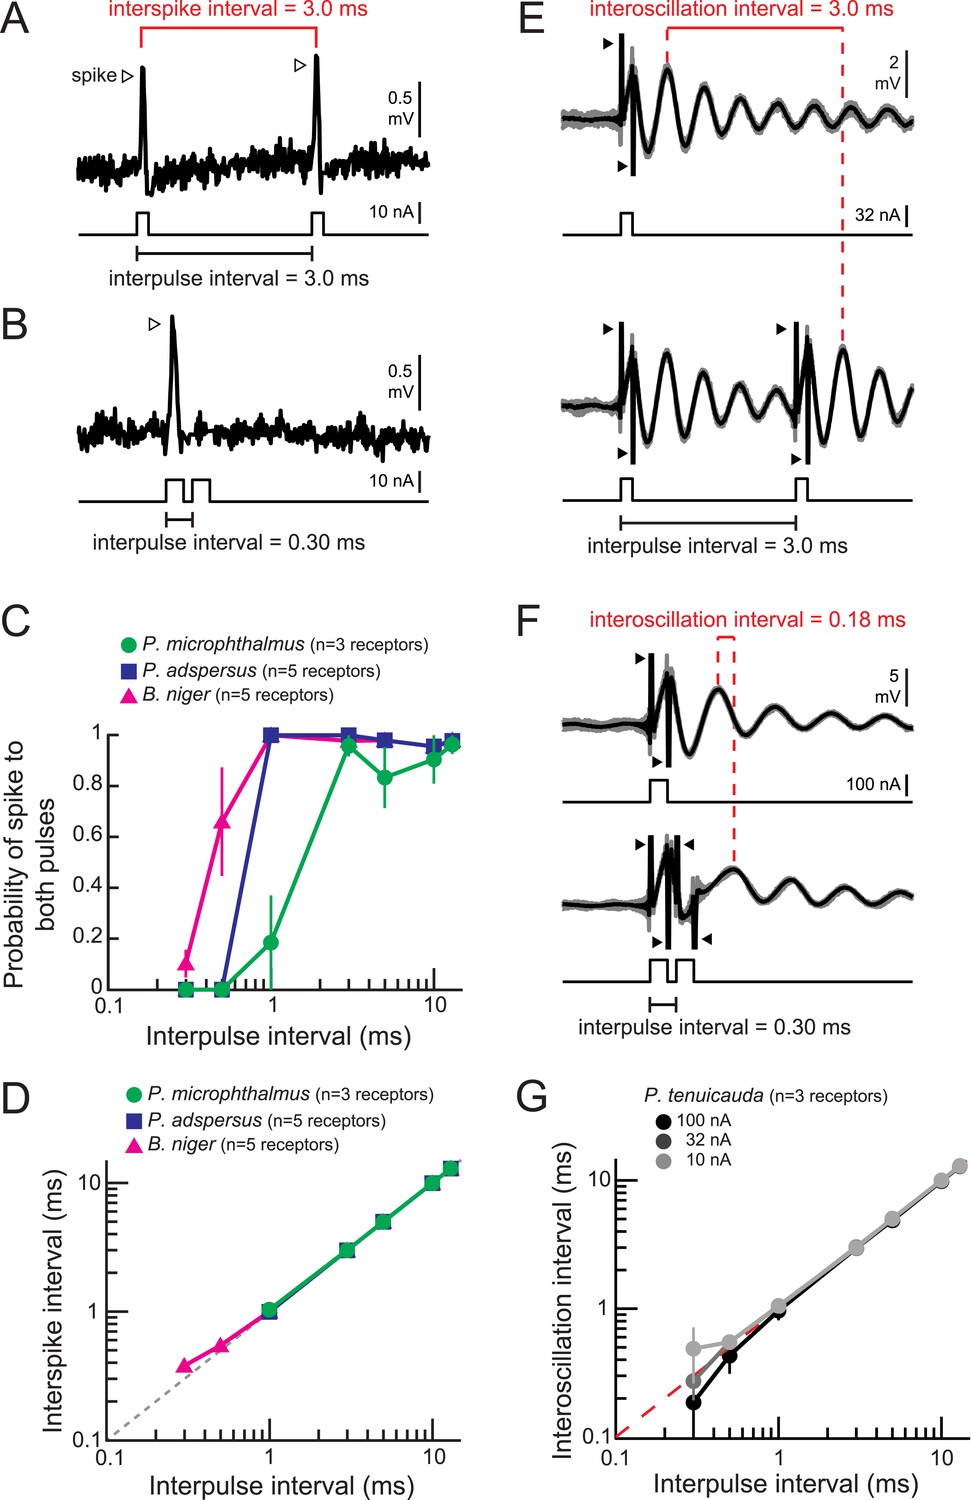
Spiking and oscillating receptors encode interpulse intervals into interspike and interoscillation intervals, respectively.
(A, B) Extracellular recording from a spiking receptor in B. niger in response to a pair of positive-polarity monopolar square pulses of 0.2-ms duration and 3.0-ms interpulse interval (IPI) (A) and 0.30-ms IPI (B). A spike occurred in response to the first pulse only for the 0.30-ms IPI. Stimulus artifacts were removed from recordings for clarity. (C) The probability that a receptor fired spikes to both positive-polarity pulses in a pair vs IPI for spiking receptors from three species. (D) Interspike interval vs positive-polarity IPIs for the same spiking receptors shown in C. The receptors of P. adspersus and P. microphthalmus did not fire spikes in response to both pulses when IPIs were shorter than 1 ms, so there are no data points at these intervals. (E) Extracellular recordings from an oscillating receptor in P. tenuicauda in response to a single pulse (top) and to a pair of pulses with 3.0-ms IPI (bottom). Responses to each stimulus presentation are shown in gray and the average across stimulus presentations is shown in black. The interoscillation interval was defined as the time interval between the first poststimulus oscillatory peak evoked by the single pulse and that evoked by the second pulse in the pair and was measured from the averaged traces. (F) Same as E for 0.30-ms IPI. (G) Interoscillation interval vs IPI for the responses of P. tenuicauda receptors to positive-polarity stimuli. Each point in C, D, and G represents the mean across receptors and error bars represent S.E.M.
Figure 6

Synchrony across receptors is greatest for the first poststimulus oscillation and then rapidly declines.
(A) Responses of three oscillating receptors in P. tenuicauda to a single square pulse delivered in sequential recordings. Responses to each of 10 stimulus presentations are shown in gray and averages are shown in black, red, or blue. Dotted vertical lines in the corresponding color denote the times of the first four poststimulus oscillatory peaks. Yellow bars group the first, second, third, and fourth peaks from each receptor. Note how the peaks are transiently synchronized just after the stimulus, but become increasingly asynchronous with each subsequent cycle. (B) Same as A for responses of the same three receptors to a 3-ms IPI stimulus. Note the transient increase in synchrony across receptors just after both stimulus pulses. (C) A single recording trace from four receptors in the right augenrosette of one P. tenuicauda in response to a normal- (black) and reversed- (red) polarity conspecific EOD. Recording traces were normalized to the amplitude of the first poststimulus oscillation. (D) The sum of the normalized responses of all 36 receptors in the right augenrosette of one P. tenuicauda (illustrated in Figure 2B) to a normal- and reversed-polarity conspecific EOD (this includes the four traces shown in C as well as responses from the 32 additional receptors). The enhanced synchrony across receptors for the first poststimulus oscillatory peak results in the largest peak in the summed response just after the stimulus.
Figure 7
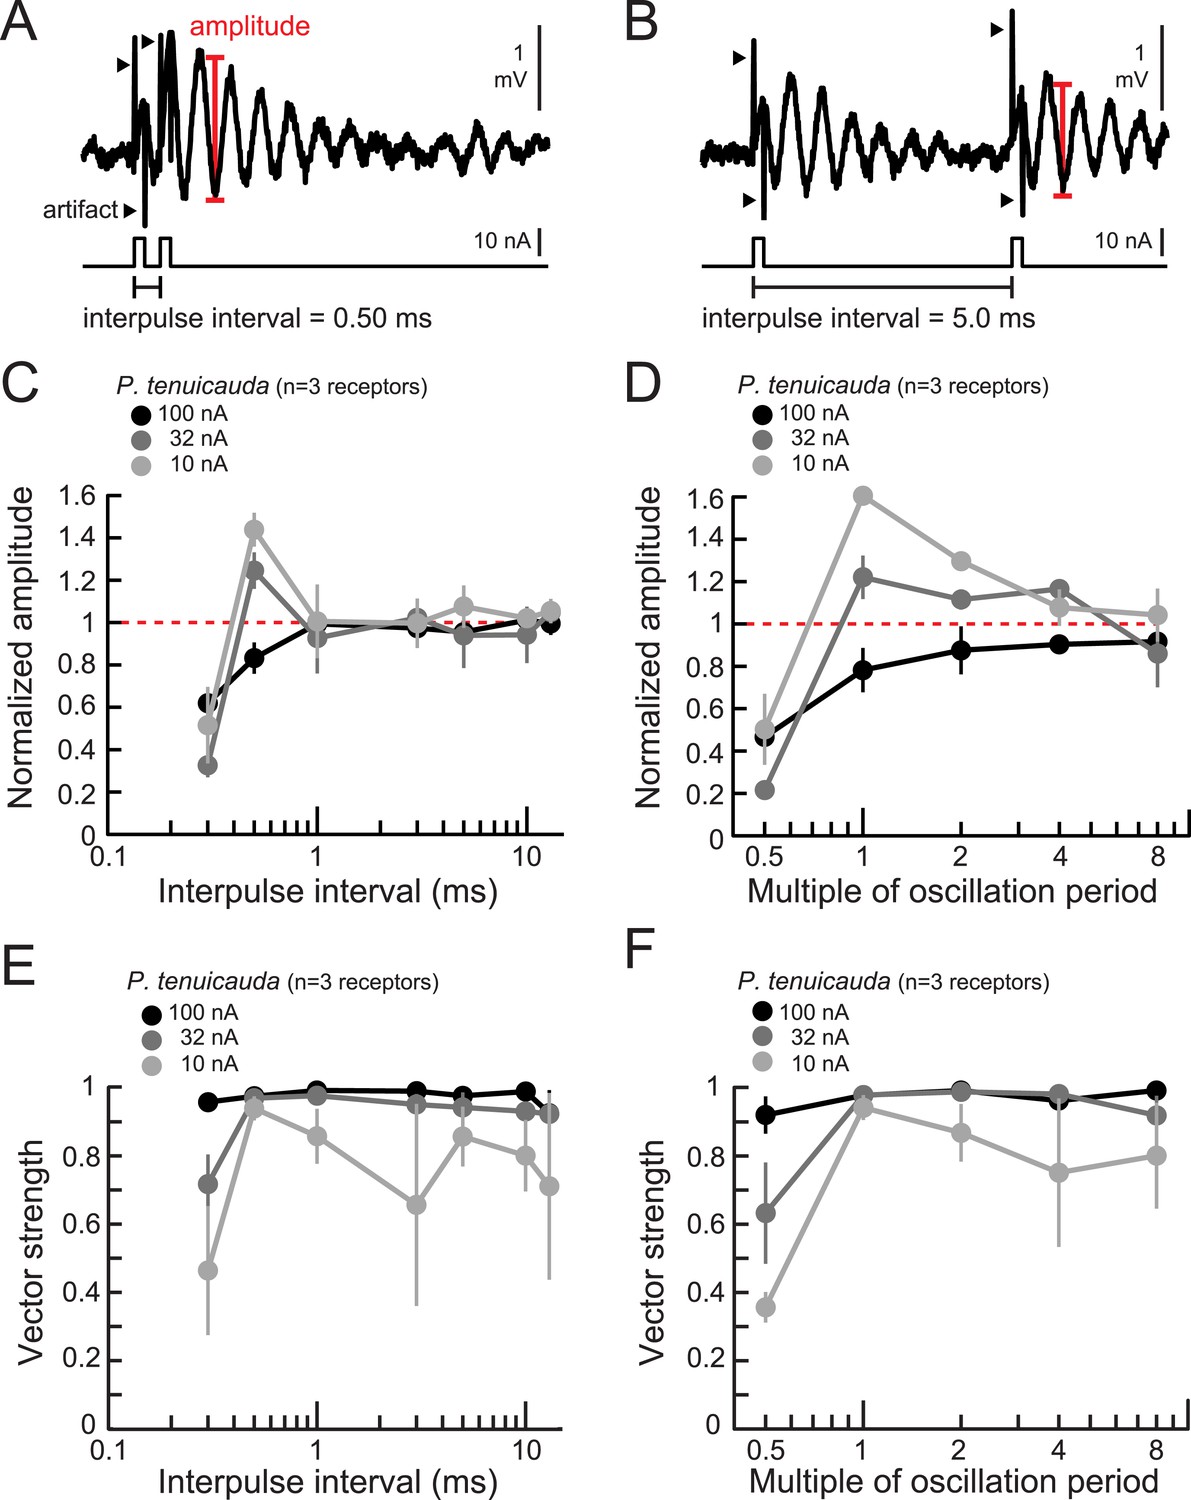
Oscillating receptors produce enhanced oscillation amplitudes at submillisecond IPIs matching their intrinsic oscillation periods.
(A, B) Extracellular recording from an oscillating receptor in P. tenuicauda in response to a pair of monopolar square pulses of 0.2-ms duration and 0.50-ms IPI (A) and 5.0-ms IPI (B). We measured the oscillation amplitude on each stimulus presentation as the mean voltage of the first two poststimulus oscillatory peaks minus the voltage at the intervening trough. We then averaged amplitudes across all presentations of the same stimulus. (C) Oscillation amplitude evoked by the second pulse in the pair normalized to the amplitude evoked by a single pulse vs IPI for the responses of P. tenuicauda receptors at three stimulus intensities. Data shown are for positive-polarity pulses. (D) Same as C for IPIs corresponding to multiples of oscillating receptors' intrinsic oscillation periods. (E) Vector strength vs IPI for oscillating responses to positive-polarity stimuli at three intensities in the same receptors shown in C and D. (F) Same as E for IPIs corresponding to multiples of oscillating receptors' intrinsic oscillation periods for the same receptors shown in C–E. Each point in C–F represents the mean across receptors and error bars represent S.E.M.
Figure 8
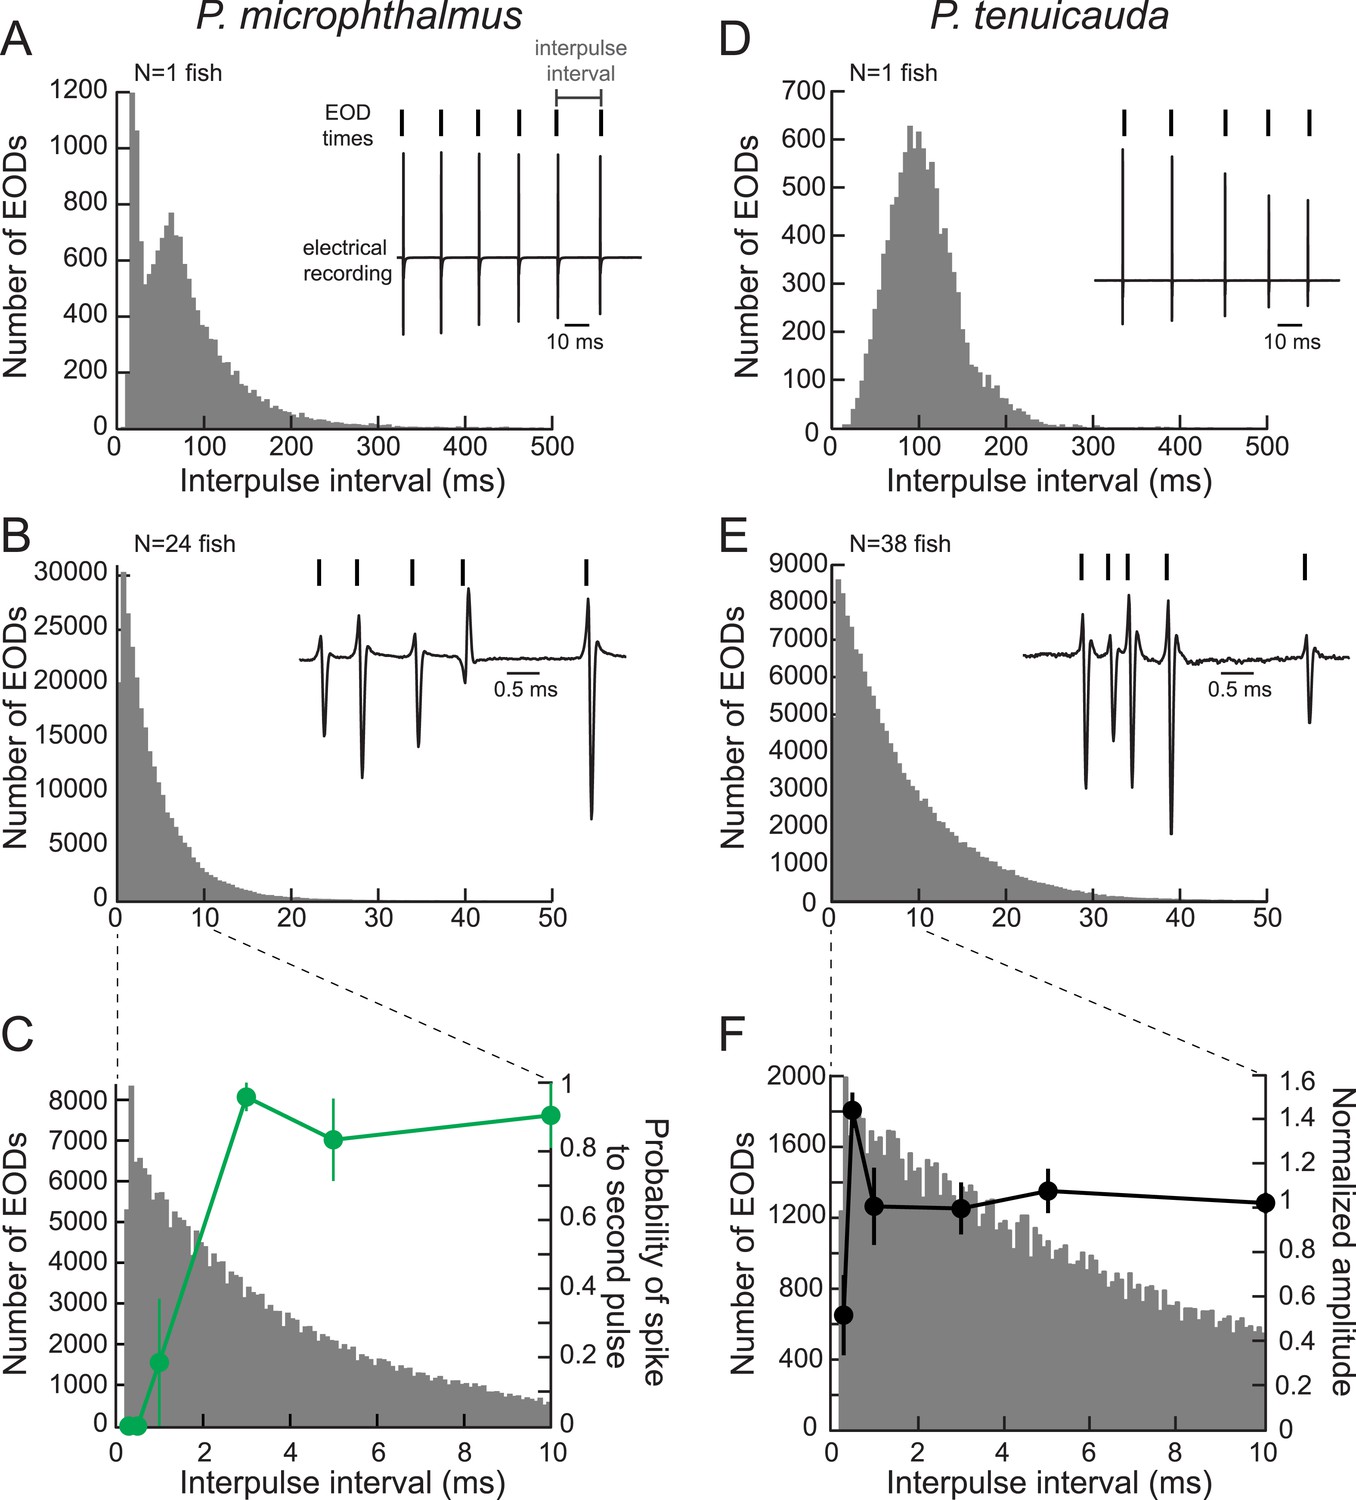
Oscillating receptors are most sensitive to submillisecond IPIs occurring in group communication signals.
(A) A histogram of the IPIs recorded over 20 min from a single fish with spiking receptors (P. microphthalmus). Inset, illustration of IPI calculation. We recorded the electric signaling activity from a single fish and recorded the time of each EOD as the time at which the rectified potential crossed a predefined threshold (tick marks above electrical recording trace). We then calculated IPIs as the time between successive EODs. (B) Same as A for a recording from a group tank of 24 P. microphthalmus. Inset, electrical recording from the same group of fish illustrating submillisecond IPIs. EOD polarity and amplitude depend on fish's orientation and location relative to the recording electrode. (C) Spike probability of three P. microphthalmus receptors (green; y-axis on right; same data as in Figure 5C) vs IPI superimposed on the IPI histogram from B. Note the expanded data range in the x-axis. Each point represents the mean across three receptors and error bars represent S.E.M. (D, E) Same as in A and B for a congeneric species with oscillating receptors (P. tenuicauda). (F) Normalized oscillation amplitudes of three P. tenuicauda receptors (black; y-axis on right; same data as in Figure 6C at 10 nA) vs IPI superimposed on the IPI histogram from E. Note the expanded data range in the x-axis. Each point represents the mean across three receptors and error bars represent S.E.M.
Figure 9
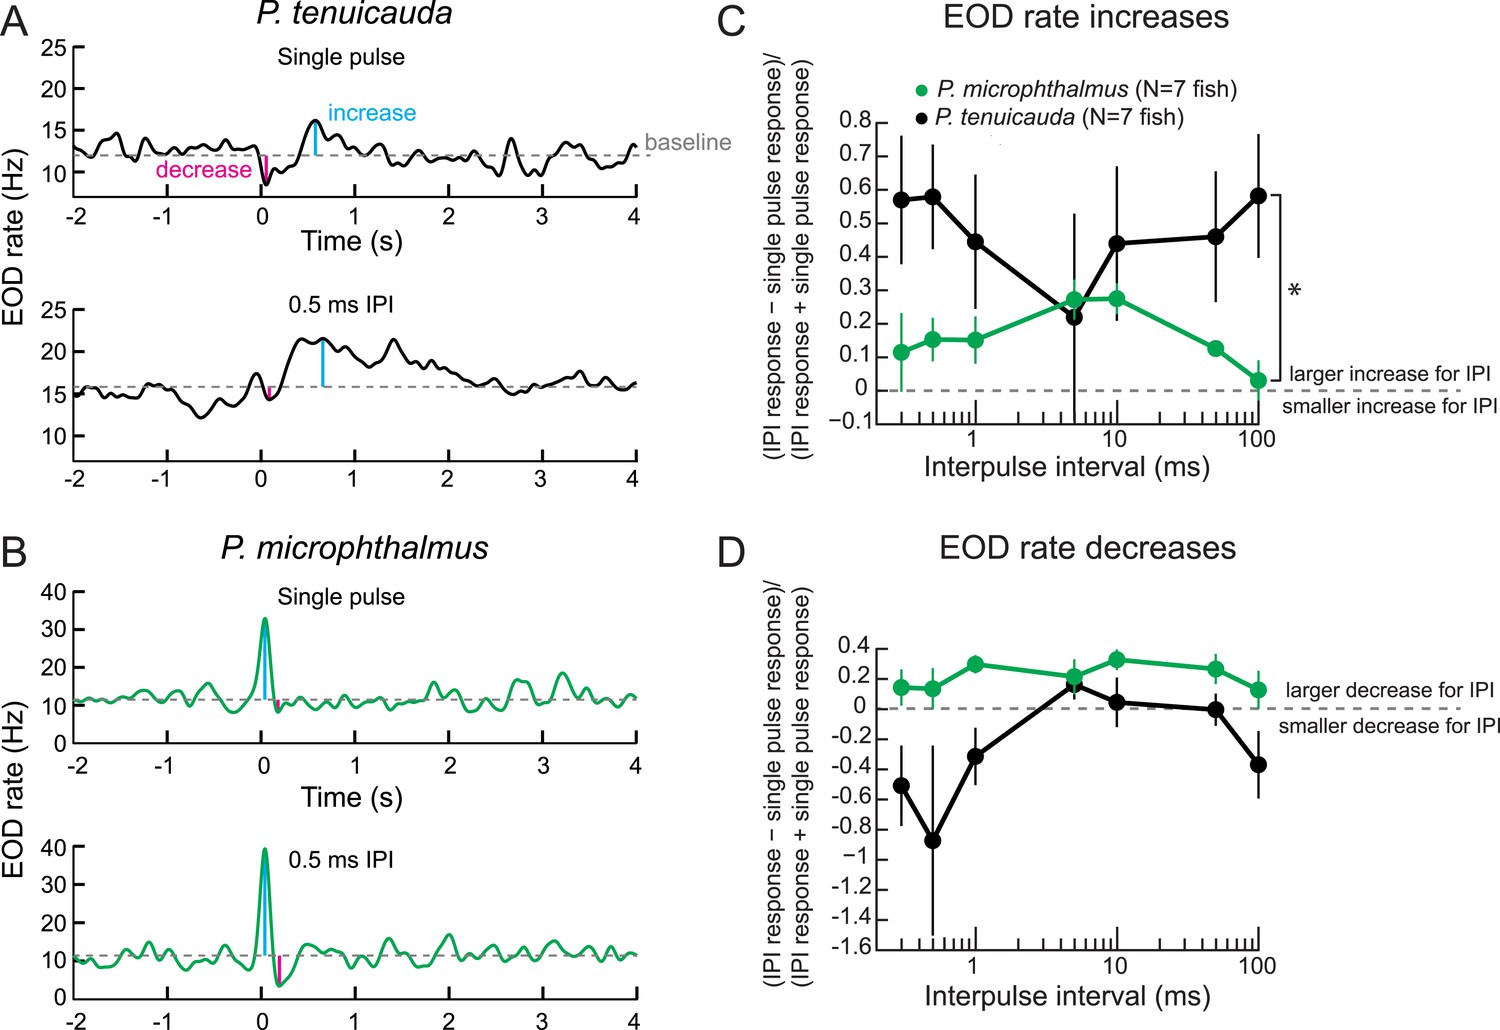
Behavioral responses reveal tuning to submillisecond IPIs in a species with oscillating receptors.
(A) The EOD rate over time in response to a single conspecific EOD (top) and a train of 10 conspecific EODs at constant 0.5-ms IPI in one P. tenuicauda. Stimuli were delivered at time = 0 s. We defined the baseline response as the average EOD rate between 4.8 s and 0.2 s before stimulus onset. We measured the maximum increase and decrease in EOD rate relative to baseline that occurred in a window starting 0.2 s before stimulus onset and ending 1.2 s after stimulus offset. (B) Same as A for one P. microphthalmus. (C) A normalized measure of EOD rate increases to constant IPI trains of conspecific EODs vs IPI during behavioral playback experiments for a species with oscillating receptors (P. tenuicauda) and a congeneric species with spiking receptors (P. microphthalmus). *, repeated-measures ANOVA, interaction between species and IPI, p < 0.01. (D) Same as C for EOD rate decreases. Each point represents the mean across fish and error bars represent S.E.M.
Download links
A two-part list of links to download the article, or parts of the article, in various formats.
Downloads (link to download the article as PDF)
Open citations (links to open the citations from this article in various online reference manager services)
Cite this article (links to download the citations from this article in formats compatible with various reference manager tools)
Peripheral sensory coding through oscillatory synchrony in weakly electric fish
eLife 4:e08163.
https://doi.org/10.7554/eLife.08163


