Calibration and analysis of genome-based models for microbial ecology
- University of British Columbia, Canada
Figures
Figure 1
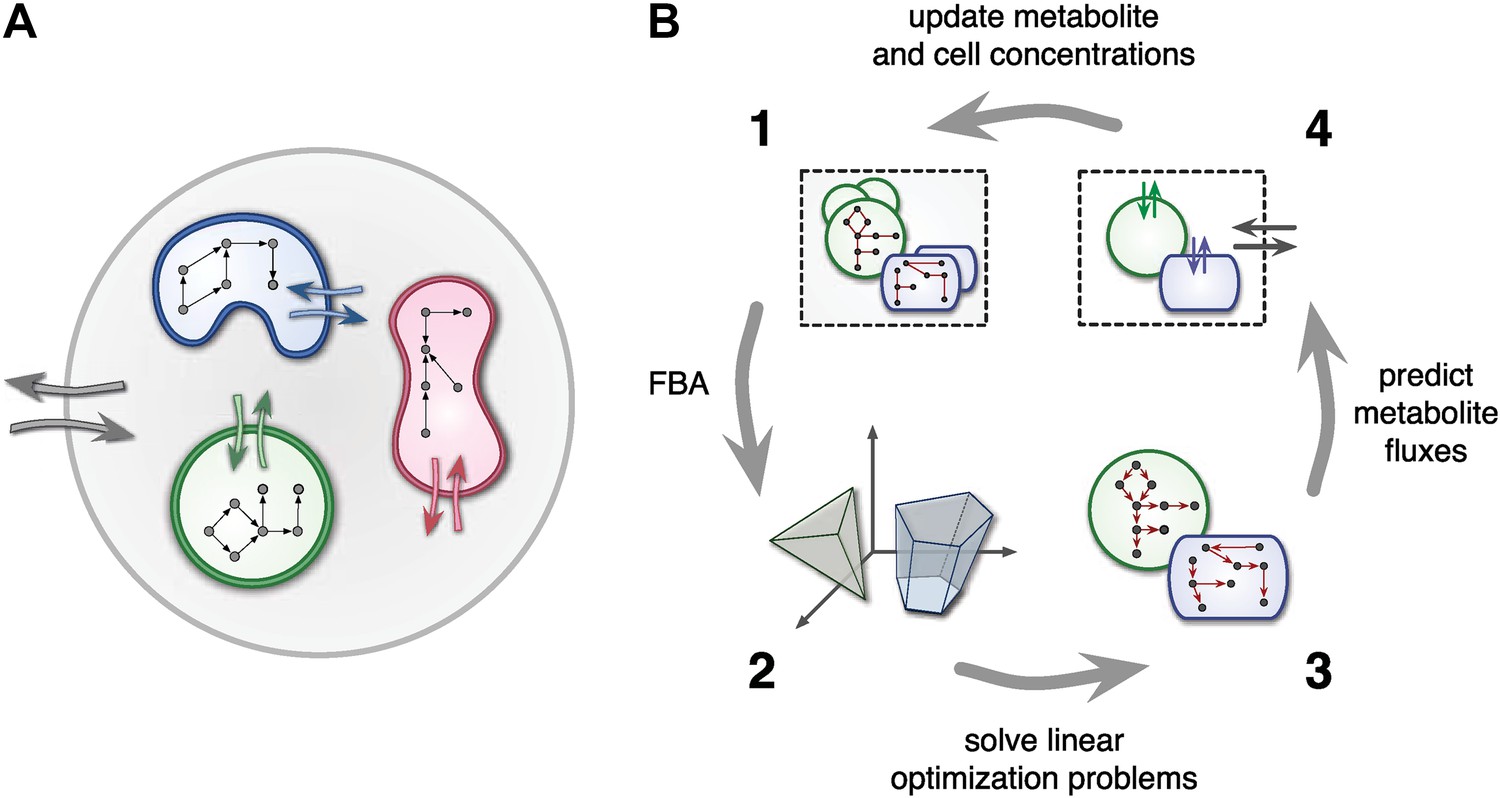
Framework used by MCM.
(A) Conceptual framework used by MCM. Cells (colored shapes) optimize their metabolism for maximal growth and influence their environment via metabolite exchange (small colored arrows). Additional external fluxes can also affect the environment (large grey arrows). The environment, in turn, influences each cell's metabolism. (B) Computational framework used by MCM. Each iteration consists of four steps: flux balance analysis (FBA) is used to translate cell-metabolic potentials and environmental conditions (1) into a linear optimization problem for the growth rate of each cell species (2). The set of possible reaction rates corresponds to a polytope in high-dimensional space. Solving the optimization problems (3) yields predictions on microbial metabolite exchange rates (4). Metabolic fluxes and cell growth rates are used to predict metabolite and cell concentrations in the next iteration (1).
Figure 2
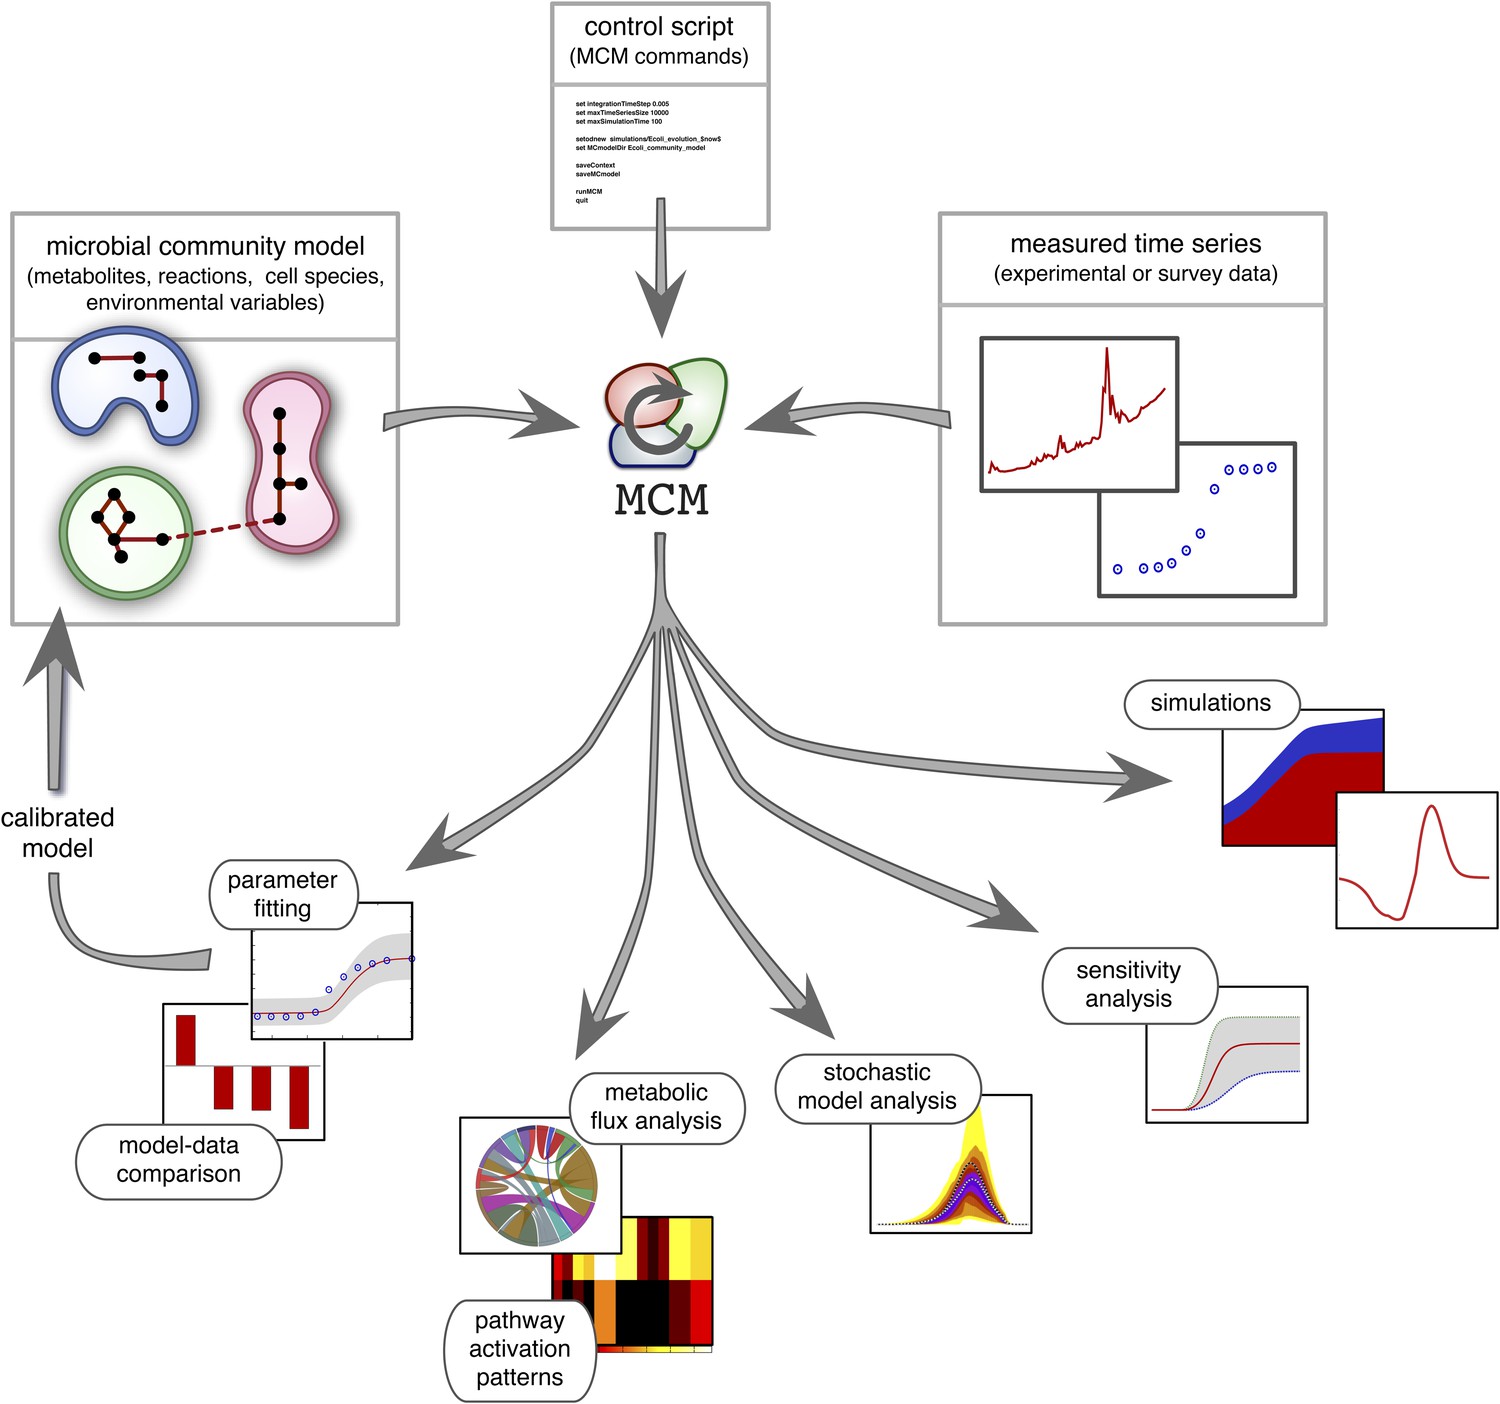
Overview of MCM's working principle and functionalities: A microbial community model is specified using human-readable configuration files in terms of metabolites, reactions, the metabolic potential of cell species and any additional environmental variables.
Models with multiple ecosystem compartments are also possible. A script with MCM commands controls the analysis of the model and, if needed, its calibration using experimental data. The calibrated model can also be used to create new, more complex models (as exemplified in this article).
Figure 3
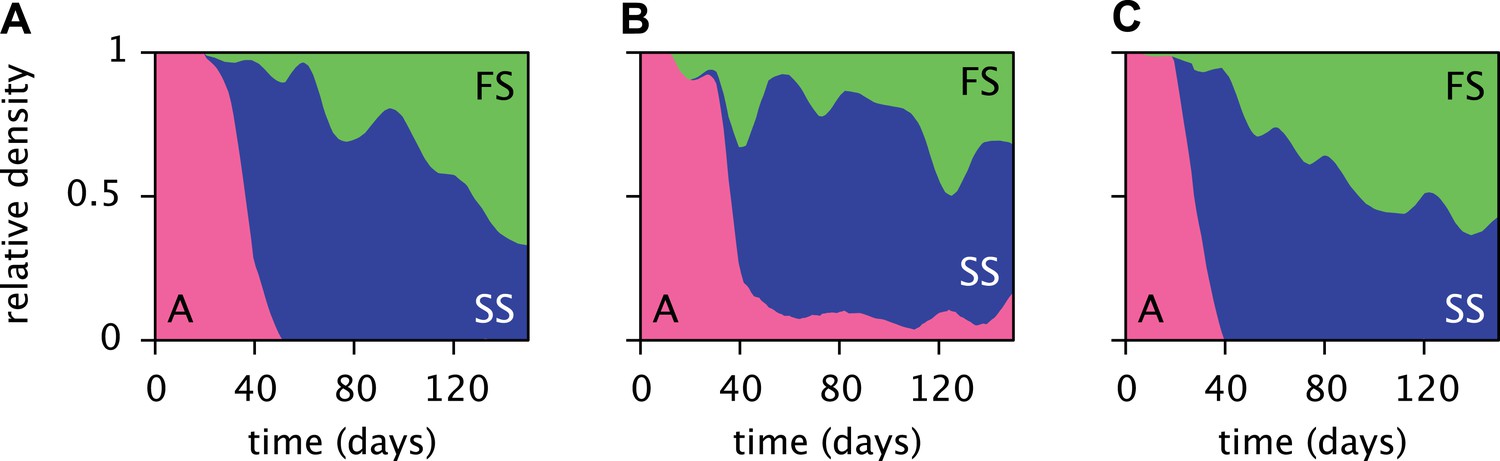
Estimated relative cell densities of the A, SS and FS types during three replicated evolution experiments by Herron and Doebeli (2013, Figure 2), starting with the same ancestral E. coli strain.
Within each of the three experiments (A–C), the illustrated SS or FS lineage comprises several strains with varyingly pronounced SS or FS phenotypes, respectively. Cell generations were translated to days by assuming an average of 6.7 generations per day (Herron and Doebeli, 2013).
Figure 4
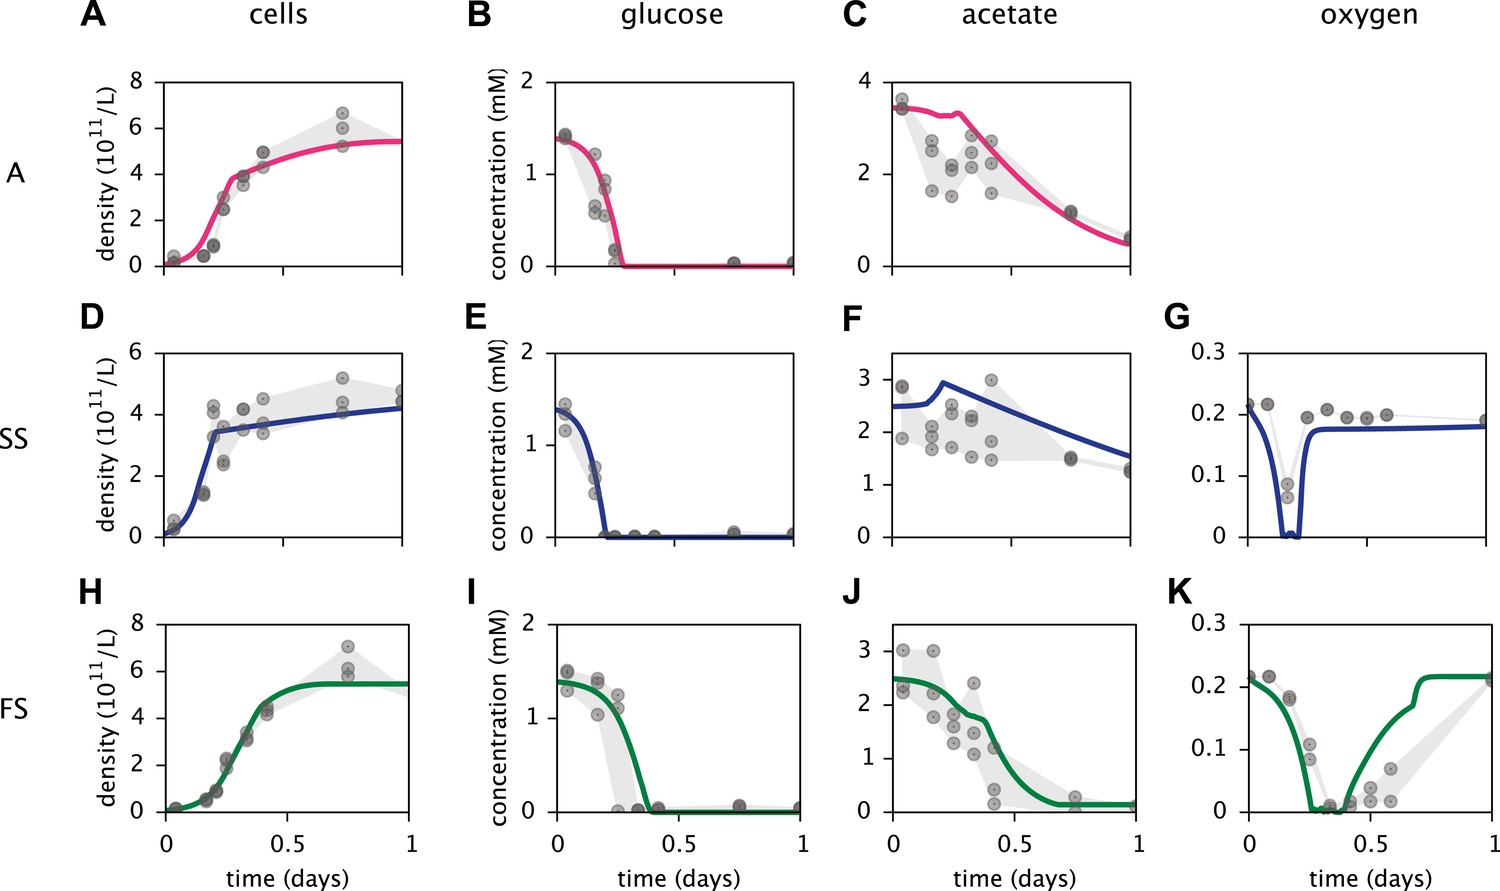
Calibration of E. coli cell models.
Continuous curves: Time course of cell densities, glucose concentration, acetate concentration and oxygen concentration (columns 1–4, respectively) predicted by MCM for monocultures of strain A, SS and FS (rows 1–3, respectively) grown on glucose-acetate medium. Points are data used for model calibration, and were obtained from analogous monoculture growth experiments (Le Gac et al., 2008). Oxygen data were not available for strain A.
Figure 5 with 2 supplements
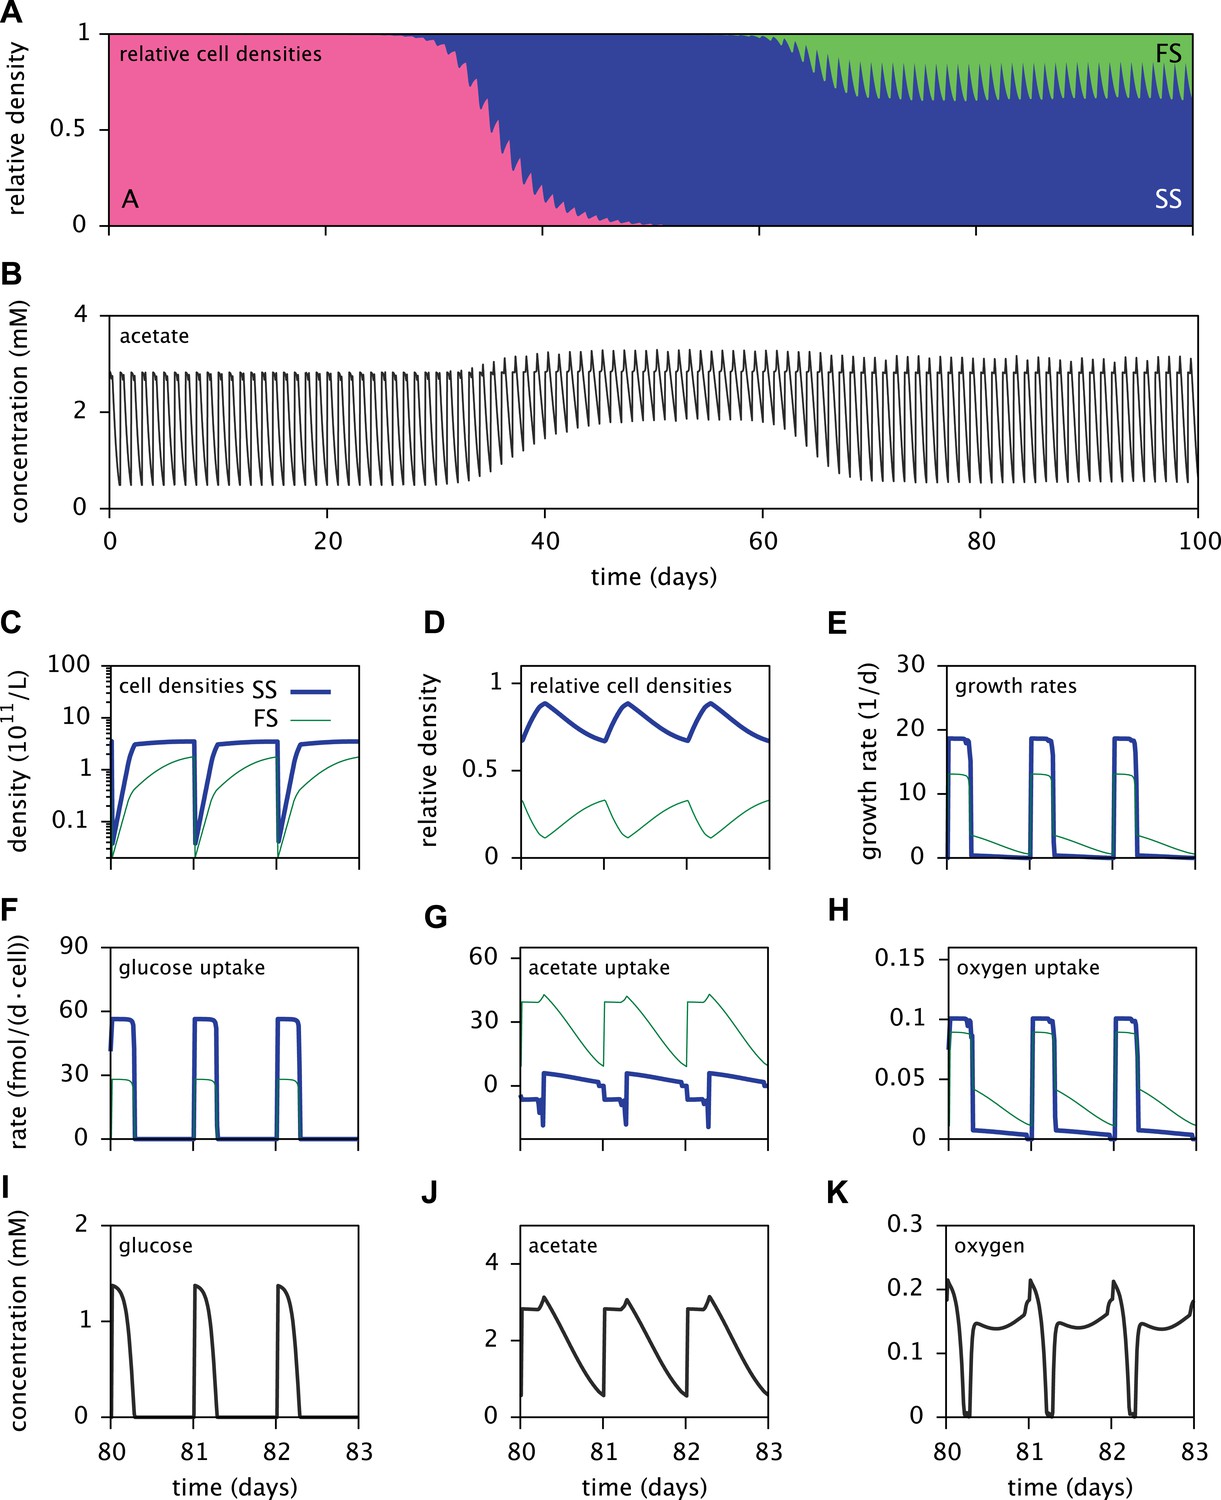
Dynamics of the E. coli microbial community model.
(A) Relative cell densities of the A, SS and FS types over time. (B) Acetate concentration over time. (C), (D) and (E): SS and FS cell densities, relative cell densities and growth rates over time, respectively, during stable coexistence. (F), (G) and (H): Cell-specific glucose, acetate and oxygen uptake rates over time, respectively. Negative values correspond to export. (I), (J) and (K): Glucose, acetate and oxygen concentrations over time, respectively. Diurnal fluctuations in all figures are due to daily dilutions into fresh medium. Tics on the time axes in (C–K) mark points of dilution.
Figure 5—figure supplement 1

Predicted relative cell densities of the A and FS types in coculture, in the absence of SS.
Initial cell densities were 1010 cells/L for type A and 1 cell/L for type FS. All other model parameters are identical to the microbial community model (comprising the A, SS and FS types) described in the main article.
Figure 5—figure supplement 2
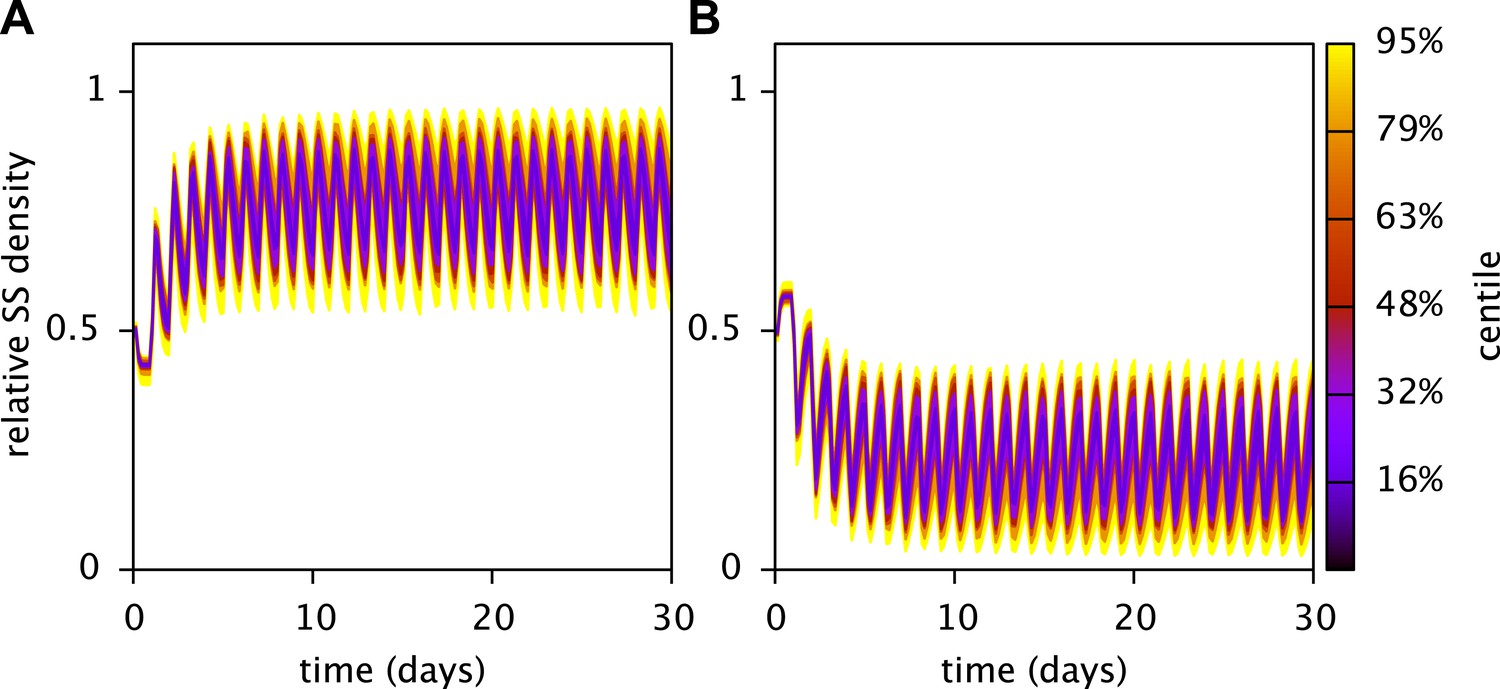
Robustness of the predicted stable coexistence of the SS and FS types in coculture.
Shown are the probability distributions of the relative SS (A) and FS (B) cell densities over time, when calibrated model parameters (Table 3) are randomly chosen within an interval spanning 10% above and 10% below their fitted values. Initial cell densities were 1010 cells/L for both types, all other parameters were as described in the main article. Probability distributions were estimated using 50 Monte Carlo simulations. In all cases both the SS and FS type persisted. The analysis was performed using the MCM command UAMCM.
Figure 6
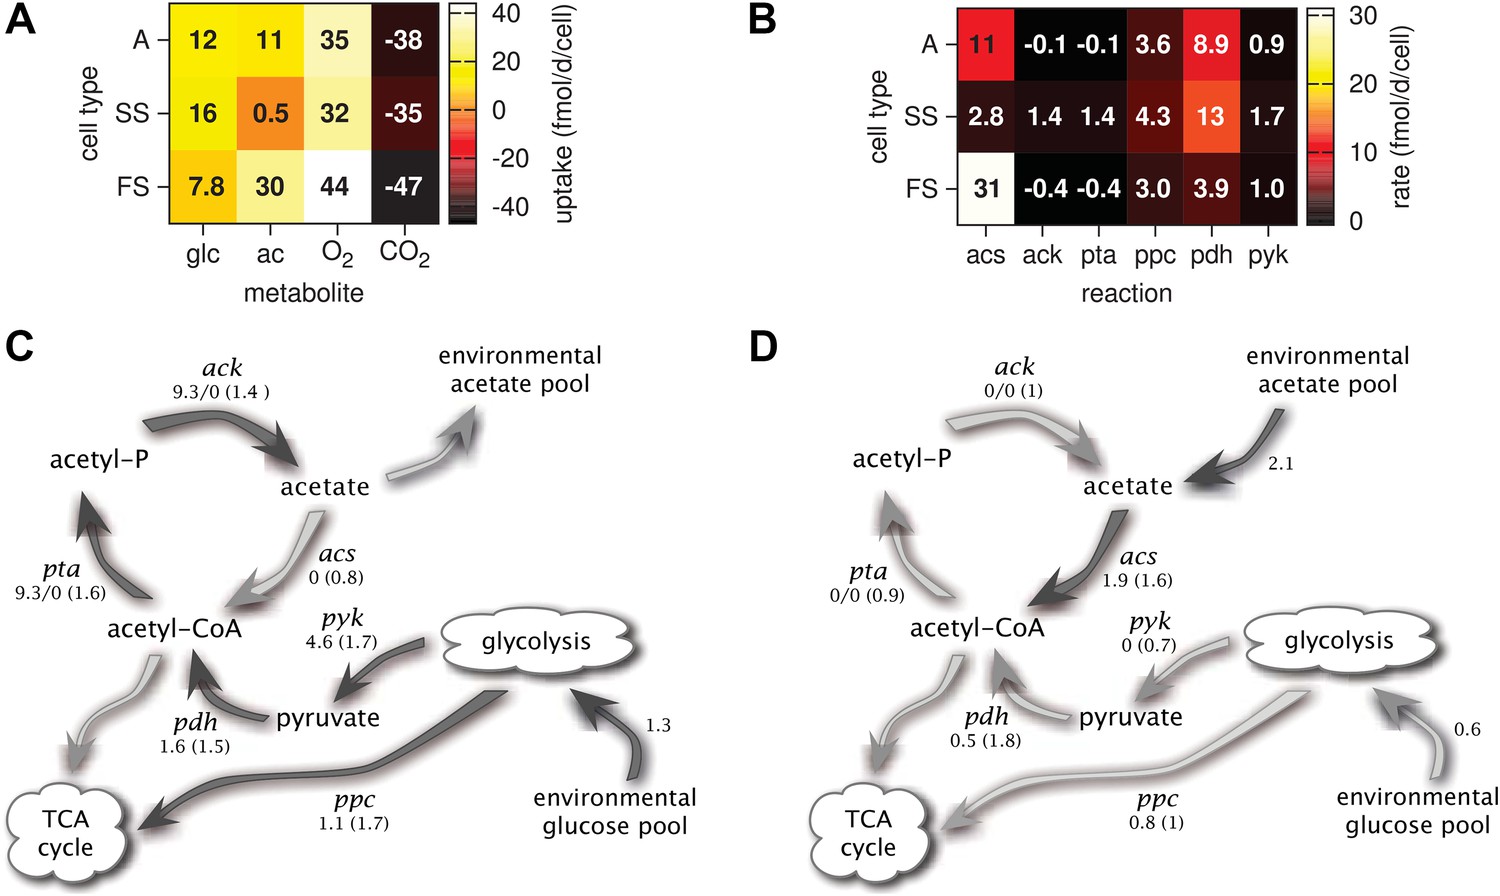
Metabolic differentiation of the A, SS and FS types.
(A) Predicted cell-specific net metabolite uptake rates in coculture. (B) Predicted cell-specific reaction rates in coculture, for acs (acetyl-CoA synthesis), ack (acetate synthesis), pta (acetyl phosphate synthesis), ppc (oxaloacetate synthesis from phosphoenolpyruvate), pdh (decarboxylation of pyruvate to acetyl-CoA) and pyk (pyruvate synthesis from phosphoenolpyruvate). Rates in (A) and (B) are averaged over all time points within the first 100 days of evolution, with reversed reactions or net metabolite export represented by negative rates. (C) and (D): Simplified model subset of E. coli acetate and glucose metabolism, showing pathway activations in type SS (C) and FS (D) relative to type A during exponential growth in monoculture. Non-bracketed numeric values are ratios of predicted fluxes in the evolved types over fluxes in type A. Bracketed values are ratios of mRNA harvested from monoculture experiments by Le Gac et al. (2008), for comparison. A ratio of 0/0 indicates zero flux in both the evolved and ancestral type, a ratio of 1 corresponds to an unchanged flux or mRNA, a ratio of 0 corresponds to complete deactivation in the evolved type. Darker arrows indicate increased predicted fluxes in the evolved type. Flux predictions correspond to the time points of mRNA measurements, that is, 3.5 hr after dilution for SS and 4 hr after dilution for A and SS (Le Gac et al., 2008).
Figure 7 with 1 supplement
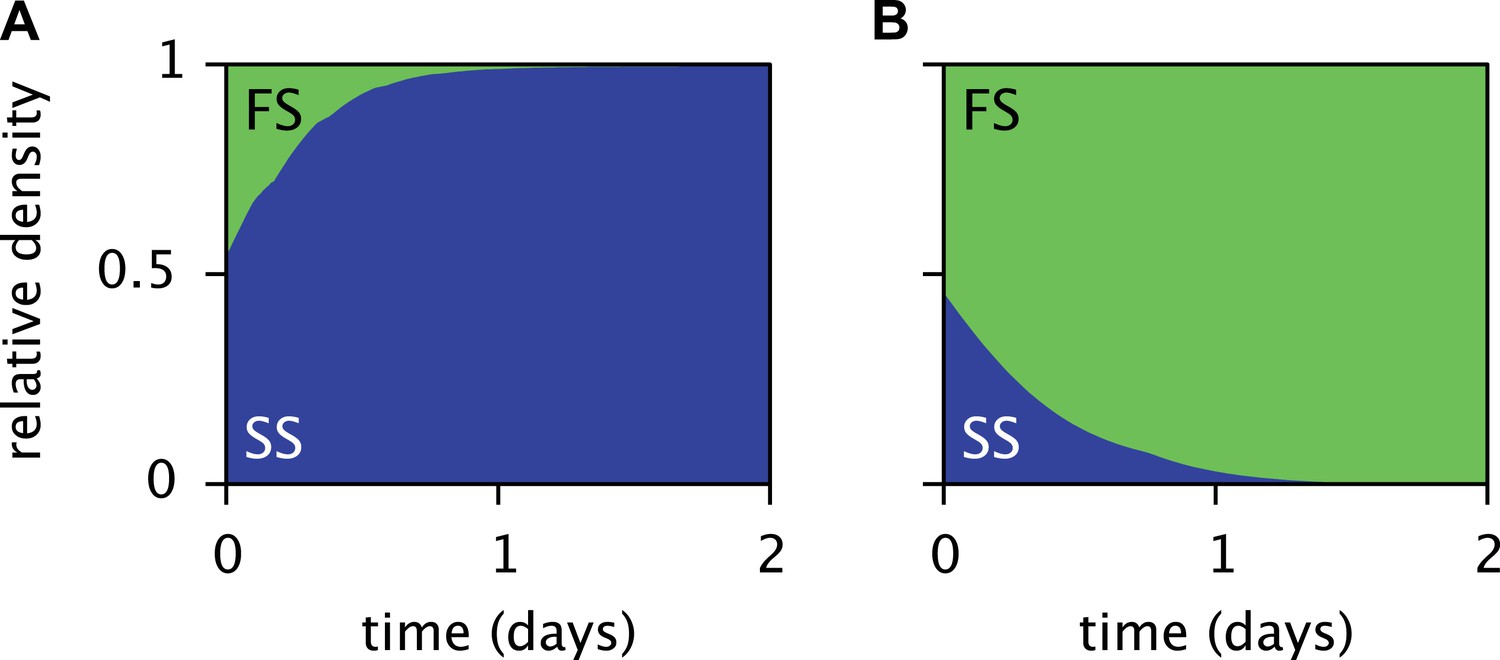
Predicted relative cell densities of the SS and FS types in batch coculture when restricted to either the first glucose-rich (A) or second glucose-depleted (B) season.
In (A), restriction to the first season was achieved by shorter dilution periods which prevented the complete depletion of glucose. In (B), restriction to the second season was achieved by using the glucose-depleted acetate-rich solution, produced by the full-batch coculture, as growth medium (see the Methods for details). See Figure 7—figure supplement 1 for results from analogous experiments by Spencer et al. (2007).
Figure 7—figure supplement 1
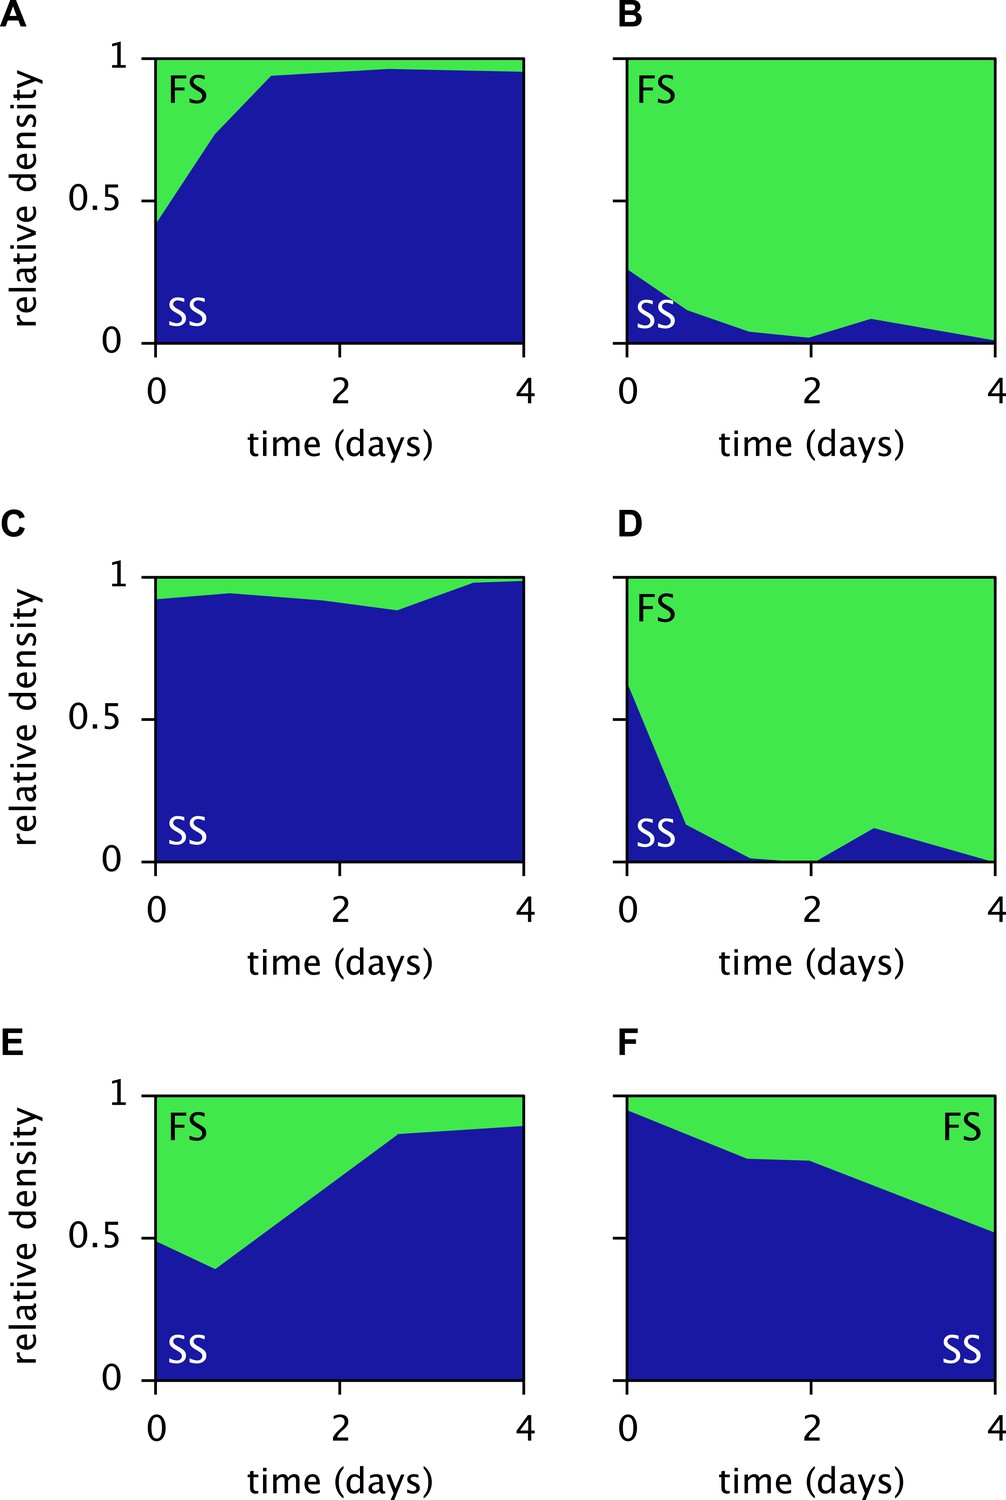
Measured relative cell densities of the SS and FS types in batch coculture, when restricted to either the first glucose-rich (left column) or second glucose-depleted (right column) season for three independently evolved communities (rows 1–3), as reported by Spencer et al. (2007, Figures 2A,B therein).
Restriction to the first season was achieved by shorter dilution periods which prevented the complete depletion of glucose. Restriction to the second season was achieved by using the glucose-depleted acetate-rich solution, produced by the full-batch coculture, as growth medium. Initial population sizes differed between experiments. Strains used by Spencer et al. (2007) evolved in slightly different growth medium than in this article. Cell generations were translated to days by assuming an average of 6.7 generations per day (Herron and Doebeli, 2013).
Additional files
-
Supplementary file 1
A thorough user manual for MCM, including an in-depth description of MCM's mathematical framework and step-by-step examples. The latest version can also be retrieved at http://www.zoology.ubc.ca/MCM.
- https://doi.org/10.7554/eLife.08208.013
-
Supplementary file 2
An overview of the fitted parameter values for the E. coli models.
- https://doi.org/10.7554/eLife.08208.014
-
Source code 1
Includes the full calibrated MC model of the E. coli microbial community, together with all MCM scripts required for its simulation.
- https://doi.org/10.7554/eLife.08208.015
Download links
A two-part list of links to download the article, or parts of the article, in various formats.
Downloads (link to download the article as PDF)
Open citations (links to open the citations from this article in various online reference manager services)
Cite this article (links to download the citations from this article in formats compatible with various reference manager tools)
Calibration and analysis of genome-based models for microbial ecology
eLife 4:e08208.
https://doi.org/10.7554/eLife.08208


