Starvation promotes concerted modulation of appetitive olfactory behavior via parallel neuromodulatory circuits
- University of California, San Diego, United States
Figures
Figure 1 with 1 supplement
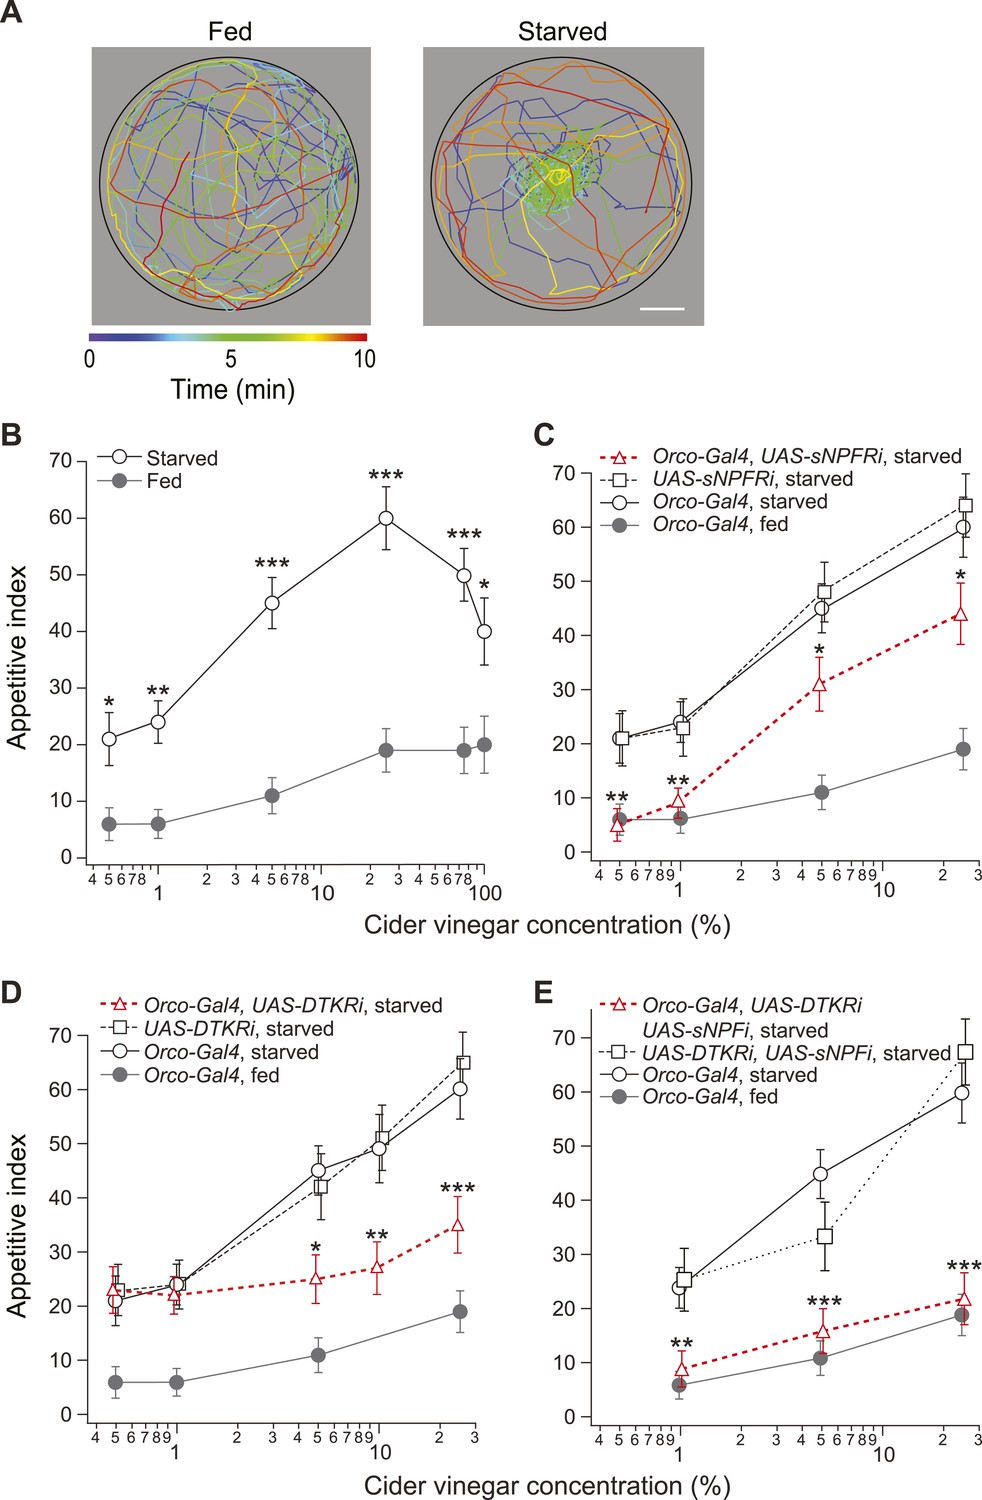
Starvation state fine-tunes appetitive behavior.
(A) A single fly assay was used to measure food search behavior. The coordinates of representative fed (left) and starved (right) flies show their positions during a 10-min period in response to 5% cider vinegar. Scale bar: 10 mm. (B) The appetitive index of fed and starved Orco-Gal4 control flies at varying concentrations. (C–E) The appetitive index of receptor knockdown flies, in which the receptor RNAi is expressed in the Orco odorant receptor neurons (ORNs). (C) Short neuropeptide F receptor (sNPFR) knockdown flies. (D) Drosophila tachykinin receptor (DTKR) knockdown flies. (E) sNPF and DTKR dual knockdown flies. (B–E) n = 63–129 for each condition. Error bars show s.e.m. *p < 0.05, **p < 0.01, ***p < 0.001; z-test for proportions comparing between starved and fed (B), and comparing knockdown flies to the Orco-Gal4 and UAS- control group in the starvation state (C, D, E).
Figure 1—figure supplement 1
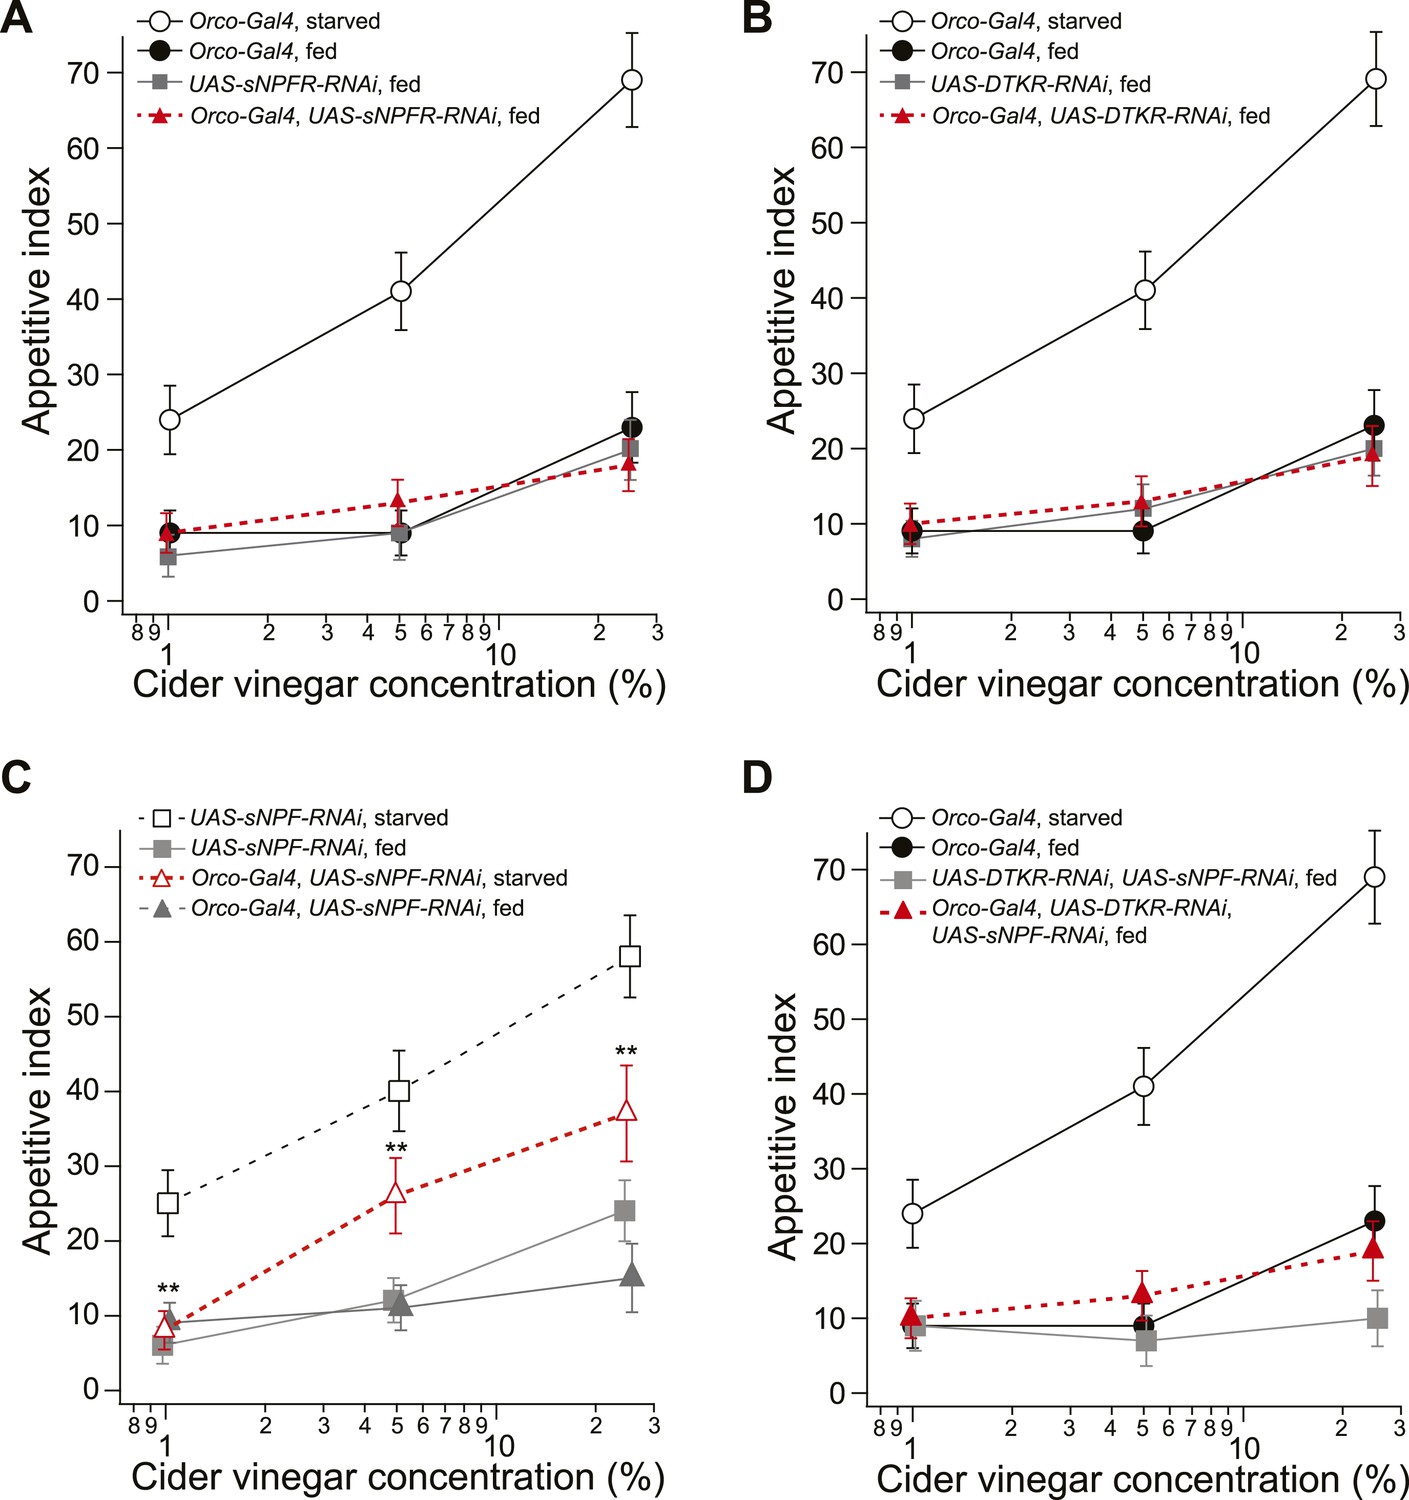
Food search behavior in control and knockdown flies.
(A) The appetitive index of fed control and sNPFR knockdown flies compared to a starved Orco-Gal4 control. n = 60–124 for each condition. (B) The appetitive index of the fed control and DTKR knockdown flies compared to a starved Orco-Gal4 control. n = 55–122 for each condition. (C) The appetitive index of control and sNPF knockdown flies in the fed and starved state. n = 76–118 for each condition. (D) The appetitive index of the fed control and sNPF-DTKR double knockdown flies compared to a starved Orco-Gal4 control. n = 56–127 for each condition. Error bars show s.e.m. **p < 0.01; z-test for proportions comparing knockdown flies to the fed control groups (A, B, D), and comparing knockdown flies to the starved control group (C).
Figure 2 with 1 supplement
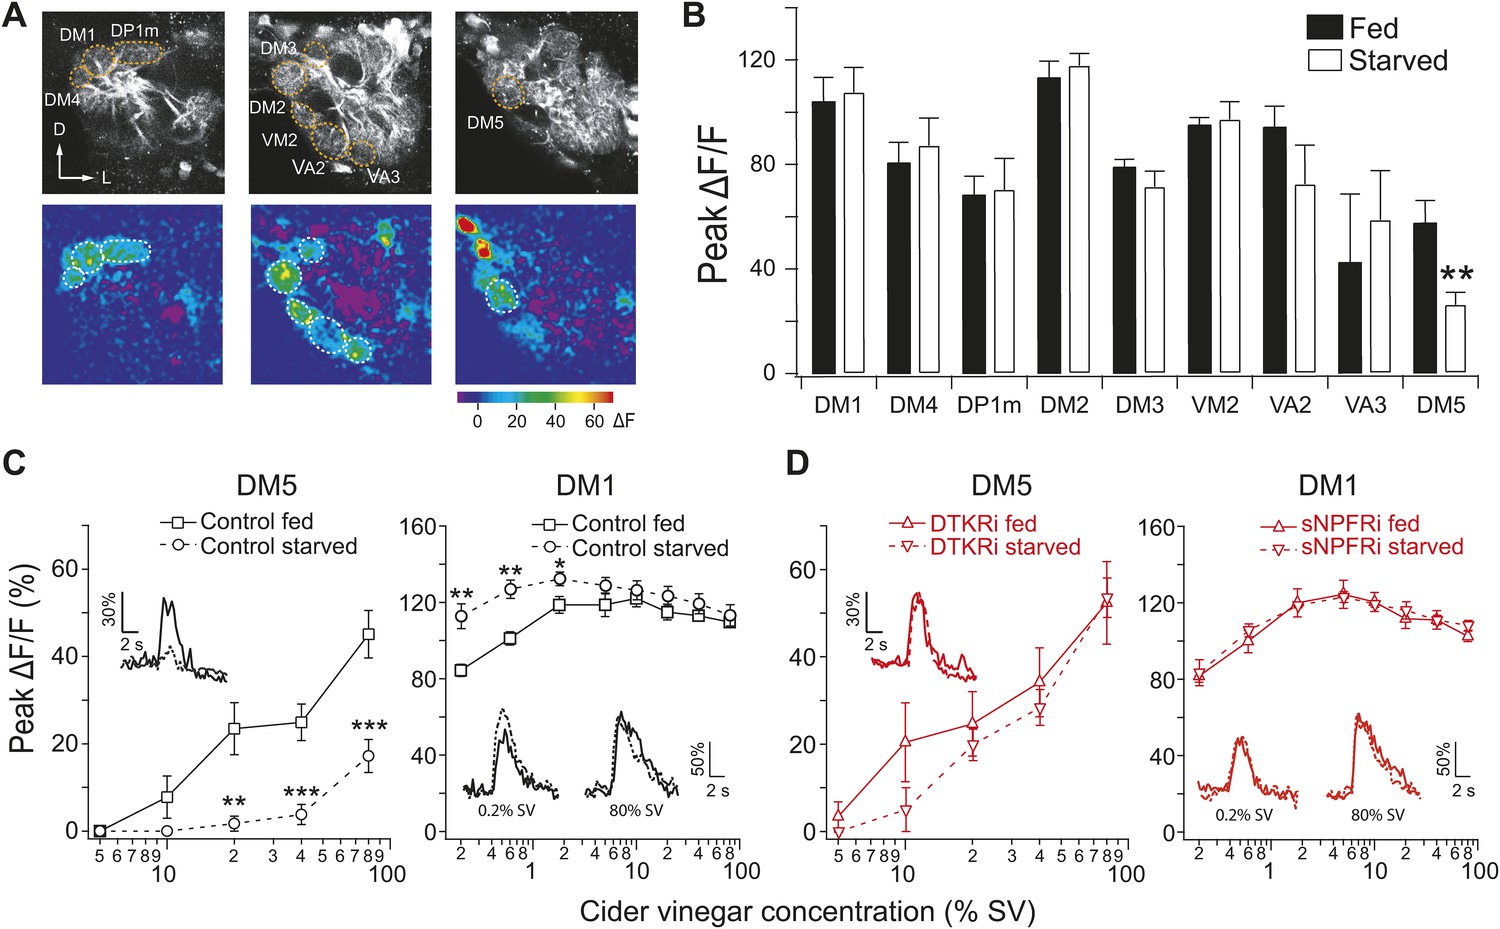
Starvation-dependent neuropeptide signaling modulates sensitivity of the DM1 and DM5 glomeruli.
(A) Representative two photon images of projection neuron (PN) dendritic calcium responses to 80% saturated vapor (SV) of apple cider vinegar in starved DTKR knockdown flies. Grey-scale images show the glomerular map on three optical planes whereas the pseudocolored images show the change of fluorescence. (B) Peak ΔF/F in glomeruli that are activated by 80% SV cider vinegar in fed and starved flies. (C, D) Responses in the DM1 and DM5 glomeruli at varying concentrations in fed and starved control flies (C) and in flies that express DTKR-RNAi or sNPFR-RNAi in ORNs labeled by Orco-Gal4 (D). Calcium signals for PN responses were imaged using GH146-LexA, LexAop-GCaMP flies in addition to the indicated transgenes. n = 5–7 for each. Error bars show s.e.m. *p < 0.05, **p < 0.01, ***p < 0.001; Student's t-test comparing between starved and fed responses.
-
Figure 2—source data 1
Glomerular responses to vinegar in fed and starved flies.
- https://doi.org/10.7554/eLife.08298.007
Figure 2—figure supplement 1
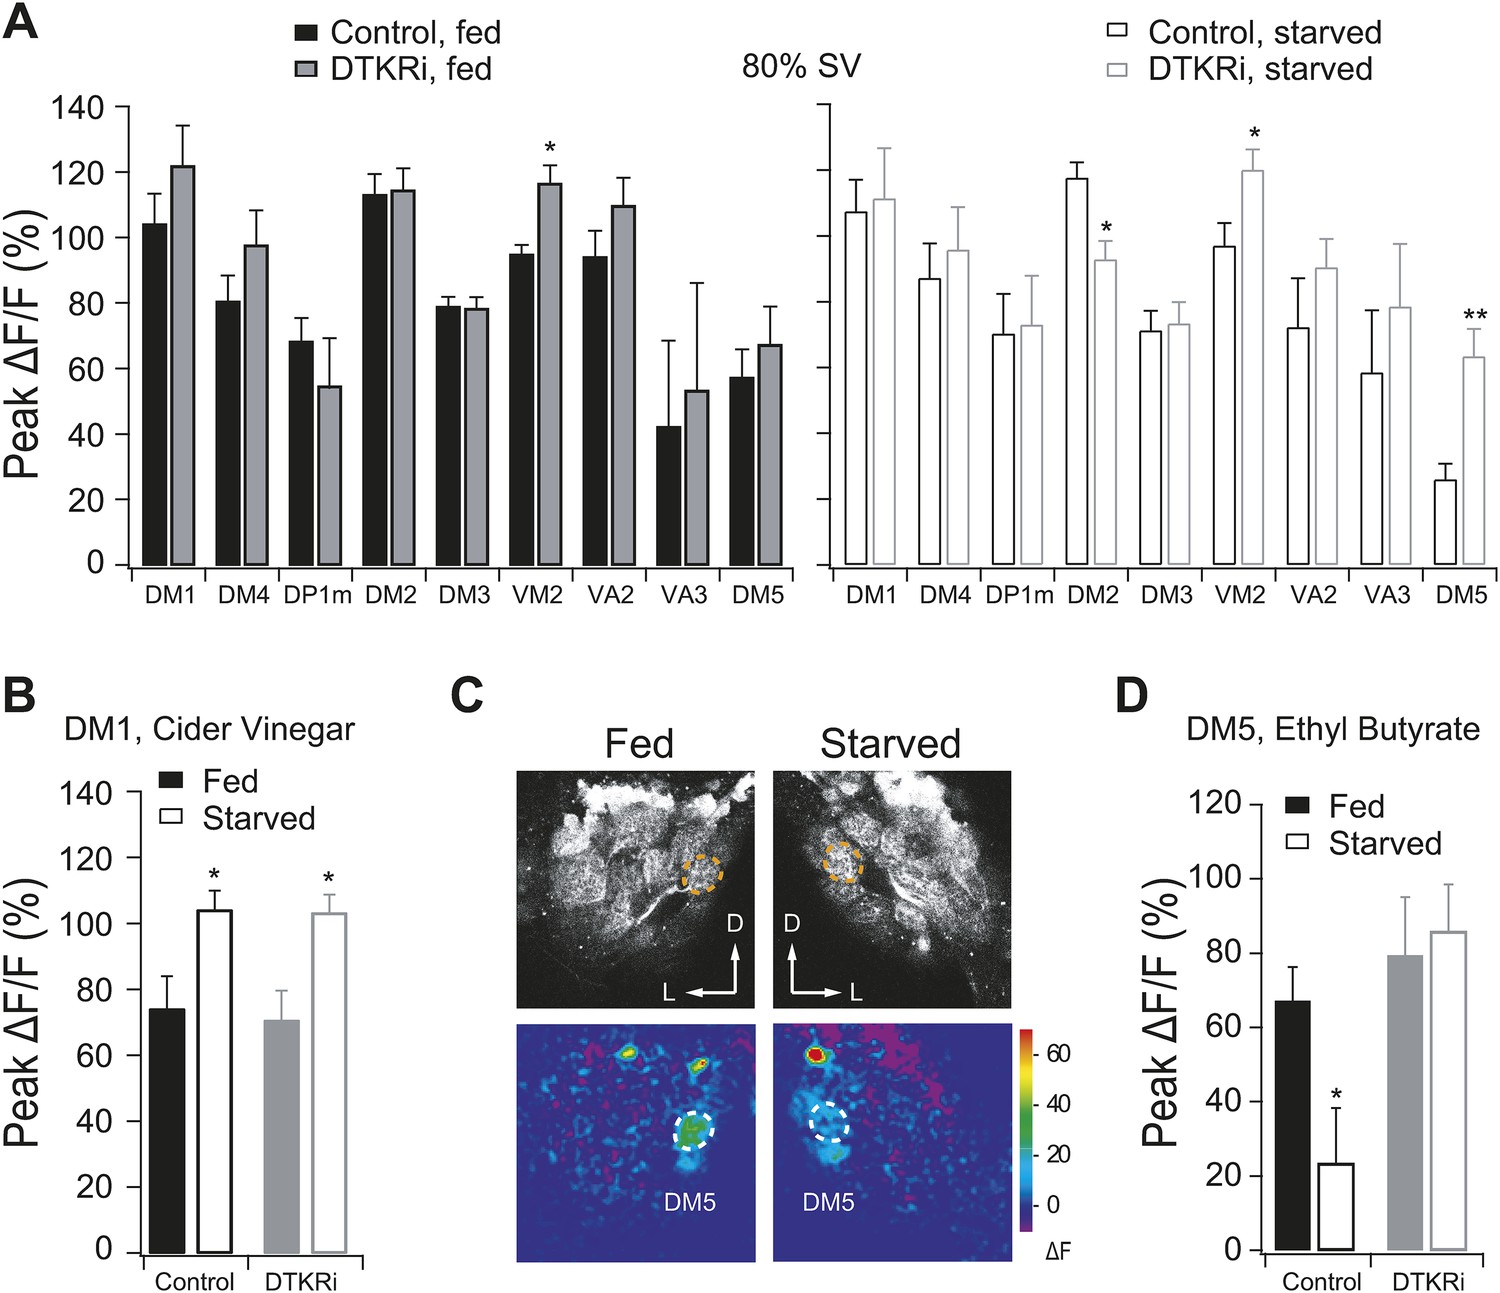
PN responses to vinegar in flies with DTKR knockdown.
Two-photon imaging of PN dendritic calcium responses. (A) Peak ΔF/F in glomeruli that are activated by 80% SV cider vinegar in control and DTKR knockdown flies. (B) Peak ΔF/F in the DM1 glomerulus in response to 0.2% SV cider vinegar in control and DTKR knockdown flies. (C) Representative images of calcium responses to 0.4% SV of ethyl butyrate (1:100 dilution in mineral oil). Grey-scale images show the glomerular map on the DM5 plane whereas the pseudocolored images show the change of GCaMP fluorescence. (D) Peak ΔF/F in the DM5 glomerulus in response to ethyl butyrate in control and DTKR knockdown flies. All flies have GH146-LexA, LexAop-GCaMP, Orco-Gal4, and DTKRi flies have UAS-DTKR-RNAi in addition. For each condition, n = 4–9. Error bars show s.e.m. *p < 0.05, **p < 0.01; Student's t-test comparing the response between knockdown and control groups (A) and comparing between starved and fed responses (B, D).
Figure 3
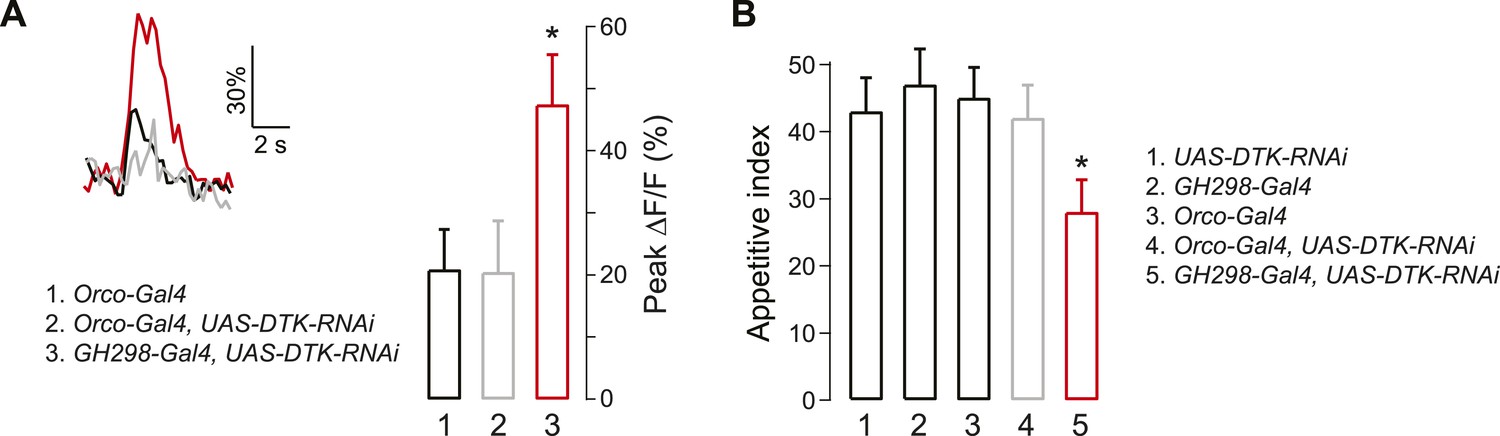
Tachykinin released by antennal lobe local interneurons (LNs) is necessary for starvation-dependent suppression of DM5 glomerular activity.
(A) Representative traces showing ΔF/F in the DM5 glomerulus in flies that have UAS-DTK-RNAi in ORNs (Orco-Gal4) or in LNs (GH298-Gal4). Bar graph depicts peak ΔF/F for each indicated genotype. Calcium signals for PN responses were imaged using GH146-LexA, LexAop-GCaMP flies in addition to the indicated transgenes. n = 5 for each condition. (B) The appetitive index of DTK knockdown flies in response to 5% cider vinegar. n = 87–101 for each condition. For imaging experiments, Error bars show s.e.m. *p < 0.05, Student's t-test (A) and z-test for proportions (B) comparing GH298-Gal4, UAS-DTK-RNAi group to control groups or Orco-Gal4, UAS-DTK-RNAi group.
Figure 4
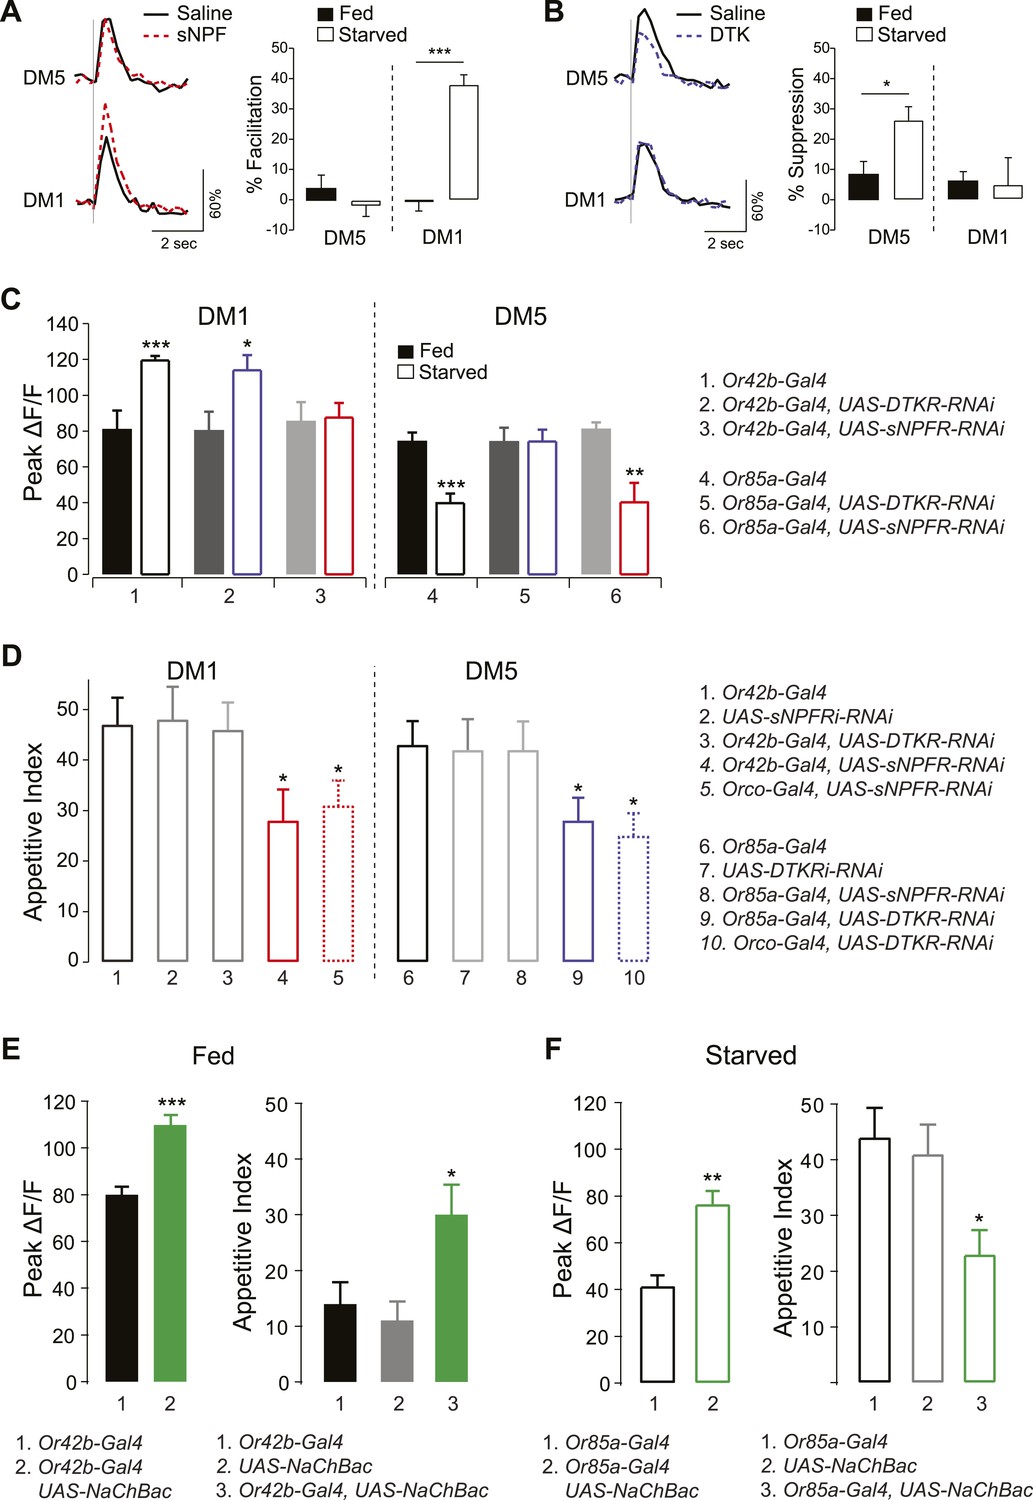
sNPF and DTK modulatory mechanisms target different sensory neurons.
(A, B) Representative traces of calcium activity (left) in the DM1 and DM5 PNs in response to olfactory nerve stimulation before and after bath application of sNPF (A) or DTK (B) synthetic peptides. The percent facilitation and suppression (right) are measured as the percent change in peak ΔF/F after peptide addition. (C) Peak ΔF/F responses in the DM1 PNs (left) and the DM5 PNs (right) to cider vinegar with glomerulus specific neuropeptide receptor knockdown. (D) The appetitive index of starved flies with glomerulus specific neuropeptide receptor knockdown. (E, F) Expression of NaChBac sensitizes DM1 and DM5 (left), which alters appetitive behavior in opposite directions (right). For imaging experiments (n = 5–6), 0.2% and 80% SV cider vinegar was used to stimulate the DM1 and DM5 PNs, respectively. For the behavioral experiments (n = 53–111), 5% cider vinegar was used. Error bars show s.e.m. *p < 0.05, **p < 0.01, ***p < 0.001; t-test for the imaging results, comparing between starved and fed responses; z-test for the behavioral results comparing knockdown groups to Gal4 or UAS control groups.
Figure 5

Insulin controls DTKR signaling.
(A) Peak ΔF/F responses of the DM5 glomerulus to cider vinegar (left) and the appetitive index of flies (right) that were fed overnight with 4% sucrose alone or sucrose with the PI3K blocker, wortmannin. DTKRi flies contained the DTKR-RNAi in Orco-Gal4. (B) Peak ΔF/F responses of the DM5 glomerulus to cider vinegar (left) and the appetitive index of starved flies (right) that expressed constitutively active insulin receptor (InR-CA) in the Orco ORNs or selectively in Or85a neurons. For imaging experiments, PN responses to 80% SV cider vinegar were measured using GH146-LexA, LexAop-GCaMP flies. n = 5–13 for each condition. For behavior experiments, fly responses to 5% apple cider vinegar were measured. n = 67–91 for each condition. Error bars show s.e.m. *p < 0.05, **p < 0.01, ***p < 0.001; Student's t-test (imaging results) and z-test for proportions (behavioral results) comparing wortmannin-fed group to sugar-fed group (A), and comparing the InR-CA groups to the control counterpart (B).
Figure 6
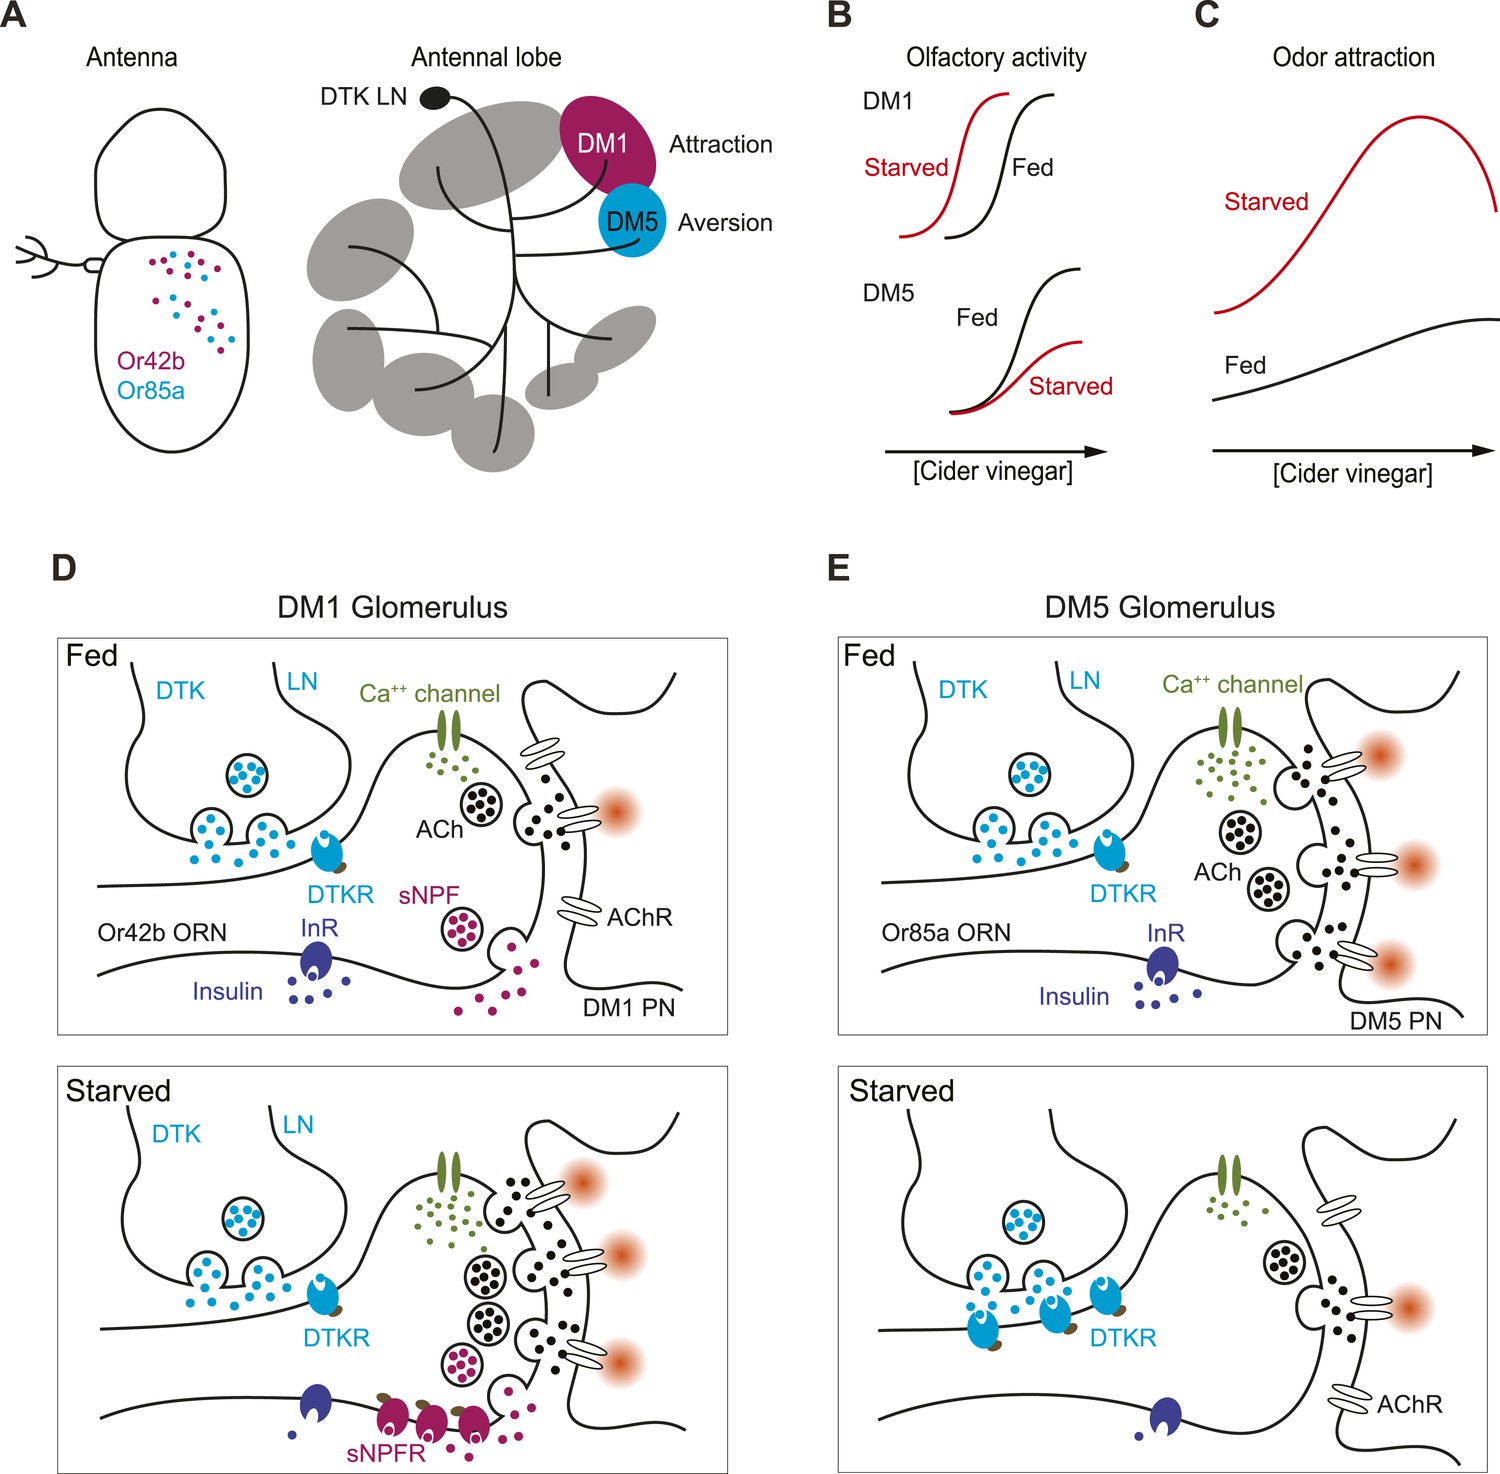
How starvation changes early olfactory processing.
(A) A schematic diagram depicting anatomical locations for Or42b and Or85a ORNs in the fly antenna as well as their corresponding glomeruli, DM1 and DM5, respectively, in the antennal lobe. LNs release DTK peptide broadly throughout the antennal lobe. (B) A model for how starvation state fine-tunes ORN sensitivity via the actions of neuromodulation of Or42b/DM1 and Or85a/DM5. In the starvation state, sNPF sensitizes the DM1 glomerular responses through additive gain modulation. Tachykinin suppresses DM5 glomerular responses through a divisive gain modulation. (C) The concerted effect of these two neuromodulatory systems increases behavioral attraction and expands the concentration range over which attraction to vinegar manifests. (D) In the DM1 glomerulus, both DTK and sNPF are available and released from the LNs and ORNs, respectively, in both the fed and starved states. DTKR is also present in these terminals in the fed state. Upon starvation, loss of insulin signaling leads to selective upregulation of sNPFR expression in the Or42b ORNs, which leads to their presynaptic facilitation. (E) In the DM5 glomerulus, both DTK and sNPF are available and released from the LNs and ORNs, respectively, in both the fed and starved states. Upon starvation, loss of insulin signaling leads to upregulation of DTKR expression in the Or85a ORNs, leading to their presynaptic inhibition.
Tables
Table 1
Differentially expressed GPCRs in the antennae of fed and starved flies
| FlyBase ID | Gene | Gene name | Count ratio | p-value | FPKM starved |
|---|---|---|---|---|---|
| A. Receptors for biogenic amines and related compounds | |||||
| FBgn0011582 | DopR | Dopamine receptor | 1.52 | 0.000 | 2.59 |
| FBgn0053517 | D2R | Dopamine 2-like receptor | 1.32 | 0.001 | 1.63 |
| FBgn0038980 | oa2 | Octopamine receptor 2 | 1.29 | 0.000 | 19.64 |
| FBgn0038542 | TyrR | Tyramine receptor | 1.23 | 0.020 | 0.85 |
| FBgn0004168 | 5-HT1A | Serotonin receptor 1A | 1.21 | 0.000 | 8.27 |
| FBgn0250910 | Octbeta3R | Octbeta3R | 1.20 | 0.000 | 17.00 |
| FBgn0037546 | mAChR-B | muscarinic Acetylcholine Receptor, B-type | 1.18 | 0.000 | 10.28 |
| FBgn0004514 | Oct-TyrR | Octopamine-Tyramine receptor | 1.16 | 0.021 | 2.09 |
| FBgn0087012 | 5-HT2 | Serotonin receptor 2 | 1.15 | 0.000 | 10.50 |
| FBgn0024944 | Oamb | Octopamine receptor in mushroom bodies | 1.15 | 0.000 | 37.92 |
| FBgn0000037 | mAcR-60C | muscarinic Acetylcholine receptor 60C | 1.14 | 0.000 | 6.74 |
| FBgn0035538 | DopEcR | Dopamine/Ecdysteroid receptor | 1.08 | 0.000 | 133.42 |
| FBgn0015129 | DopR2 | Dopamine receptor 2 | 1.07 | 0.044 | 4.67 |
| FBgn0038063 | Octbeta2R | Octbeta2R | 0.79 | 0.003 | 1.30 |
| B. Peptide receptors | |||||
| FBgn0039396 | CcapR | Cardioacceleratory peptide receptor | 2.42 | 0.017 | 0.13 |
| FBgn0004622 | Takr99D | Tachykinin-like receptor at 99D | 1.67 | 0.029 | 0.28 |
| FBgn0003255 | rk | rickets | 1.50 | 0.000 | 0.98 |
| FBgn0033579 | CG13229 | – | 1.45 | 0.002 | 1.78 |
| FBgn0053696 | CNMaR | CNMamide Receptor | 1.44 | 0.019 | 0.51 |
| FBgn0036934 | sNPF-R | short neuropeptide F receptor | 1.41 | 0.000 | 7.26 |
| FBgn0028961 | AlstR | Allatostatin receptor | 1.30 | 0.011 | 0.85 |
| FBgn0035331 | DmsR-1 | Dromyosuppressin receptor 1 | 1.26 | 0.003 | 1.59 |
| FBgn0038880 | SIFR | SIFamide receptor | 1.20 | 0.000 | 2.78 |
| FBgn0259231 | CCKLR-17D1 | CCK-like receptor at 17D1 | 1.13 | 0.000 | 68.50 |
| FBgn0025631 | moody | moody | 1.09 | 0.000 | 50.86 |
| FBgn0016650 | Fsh | Fsh-Tsh-like receptor | 1.08 | 0.021 | 7.74 |
| FBgn0085410 | TrissinR | Trissin receptor | 1.06 | 0.025 | 15.30 |
| FBgn0038874 | ETHR | ETHR | 0.94 | 0.003 | 21.31 |
| FBgn0031770 | CG13995 | – | 0.91 | 0.000 | 15.93 |
| FBgn0004841 | Takr86C | Tachykinin-like receptor at 86C | 0.91 | 0.016 | 6.86 |
| FBgn0029723 | Proc-R | Proctolin receptor | 0.89 | 0.005 | 6.22 |
| FBgn0030954 | CCKLR-17D3 | CCK-like receptor at 17D3 | 0.79 | 0.000 | 8.62 |
| FBgn0025595 | AkhR | Adipokinetic hormone receptor | 0.74 | 0.000 | 11.06 |
| FBgn0038201 | Pk1r | Pyrokinin 1 receptor | 0.67 | 0.000 | 11.58 |
| FBgn0039354 | Lgr3 | Lgr3 | 0.51 | 0.000 | 0.24 |
| FBgn0039595 | AR-2 | Allatostatin receptor 2 | 0.39 | 0.002 | 0.11 |
| C. Metabotropic glutamate receptor family | |||||
| FBgn0050361 | mtt | mangetout | 3.27 | 0.000 | 0.54 |
| FBgn0019985 | mGluRA | metabotropic glutamate receptor | 1.94 | 0.000 | 1.14 |
| FBgn0052447 | CG32447 | – | 1.89 | 0.000 | 4.27 |
| FBgn0031275 | GABA-B-R3 | GABA-B receptor subtype 3 | 1.27 | 0.000 | 2.44 |
| FBgn0051760 | CG31760 | – | 1.17 | 0.000 | 6.36 |
| FBgn0051660 | pog | poor gastrulation | 1.16 | 0.000 | 34.68 |
| FBgn0260446 | GABA-B-R1 | GABA-B receptor subtype 1 | 1.16 | 0.000 | 33.18 |
| FBgn0085401 | CG34372 | – | 1.10 | 0.033 | 3.96 |
| FBgn0027575 | GABA-B-R2 | GABA-B receptor subtype 2 | 0.94 | 0.000 | 27.45 |
-
Each RNA sample was from the antennae of 200 female flies (w1118;+;Orco-Gal4/+). Count ratio is the number of reads aligned to each gene between starved and satiated flies. FPKM, fragment per kilobase of exon per million mapped fragments. p-values were calculated on raw counts using the Fisher's exact test in edgeR package.
Download links
A two-part list of links to download the article, or parts of the article, in various formats.
Downloads (link to download the article as PDF)
Open citations (links to open the citations from this article in various online reference manager services)
Cite this article (links to download the citations from this article in formats compatible with various reference manager tools)
Starvation promotes concerted modulation of appetitive olfactory behavior via parallel neuromodulatory circuits
eLife 4:e08298.
https://doi.org/10.7554/eLife.08298


