Generation of an expandable intermediate mesoderm restricted progenitor cell line from human pluripotent stem cells
- University of California, San Diego, United States
- Arizona State University, United States
Figures
Figure 1 with 1 supplement

Arrayed cellular microenvironment (ACME) screen identified conditions that maintain expression of the mesodermal reporter T-GFP.
(A) Schematic of the ACME experimental design. Human ES cells carrying a green fluorescent protein (GFP) reporter under control of the BRY/T promoter were treated with CHIR98014 (CHR). GFP positive (T-GFP) cells were seeded onto ACME slides printed with combinations of extracellular matrix proteins (ECMPs), growth factors (GF) and small molecules (SMs). A primary screen contained all possible combinations of ECMP Collagen I (C1), Collagen III (C3), Collagen IV (C4), Collagen V (C5), Fibronectin (FN), Laminin (LN), and Vitronectin (VN). A second GF and SM screen contained all possible single, pairwise, and three-way combinations of Wnt3a (WNT), CHIR98014 (CHR), Rspondin (RSP), Dkk-1 (DKK), IWP-2 (IWP), FGF-2 (FGF), FGF-7 (KGF), VEGF (VGF), EGF (EGF), SHH (SHH), Activin (ACT), Cyclopamine (CYC), Dorsomorphin (DSM), BMP4 (BMP), SB4-31542 (SB4), and Noggin (NOG). The second screen was performed on the optimal ECMP combination identified in the primary screen. 72 hr after seeding, GFP expression and DAPI staining were captured and analyzed using a high content imaging microscope. (B) Results of the primary ECMP screen. A heat map of average T-GFP intensity was generated showing the distribution across the data set. Representative clusters are magnified. The position of the Matrigel condition in the cluster is also indicated for reference. Rows represent different ECMP combinations. Columns 1–3 represent biological replicates for cell number (Cell #) or T-GFP (GFP). Columns marked represent the average of the three biological replicates. (C) Representative images of ECMP conditions in the array format. Matrigel is shown in comparison to the hit condition C1 C3 C4 FN VN. Scalebar = 50 µm. (D) Results of the second GF and SM screen. A heat map of average T-GFP intensity was generated showing the distribution across the data set. Representative clusters are magnified. The position of the condition lacking GFs and SMs (No Factor) is also indicated for reference. Rows represent different GF and SM combinations. Columns 1–3 represent biological replicates for cell number (Cell #) or T-GFP (GFP). Columns marked represent the average of the three biological replicates. (E) Representative images of GF and SM conditions in the array format. No GF or SM is shown in comparison to the hit condition CHR + FGF. Scalebar = 50 µm. Figure 1—figure supplement 1 provides a global main effects principal component analysis for all GF and SM used in this second screen.
Figure 1—figure supplement 1
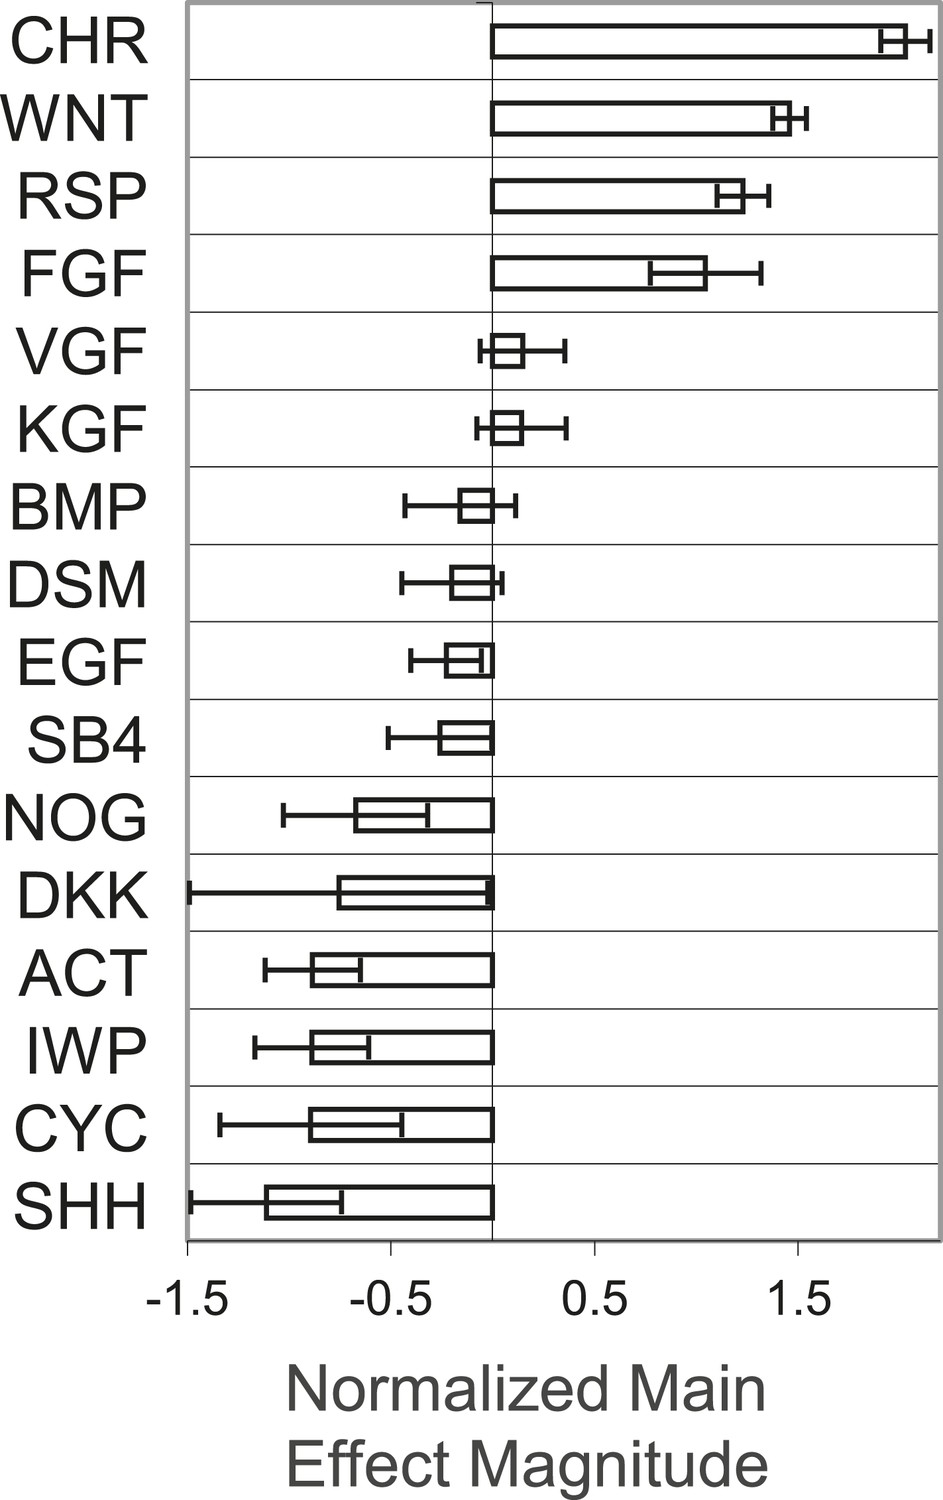
Global main effects principal component analysis of GF and SM ACME screen demonstrates that WNT and FGF agonists exert positive effects on T-GFP expression.
https://doi.org/10.7554/eLife.08413.004
Figure 2
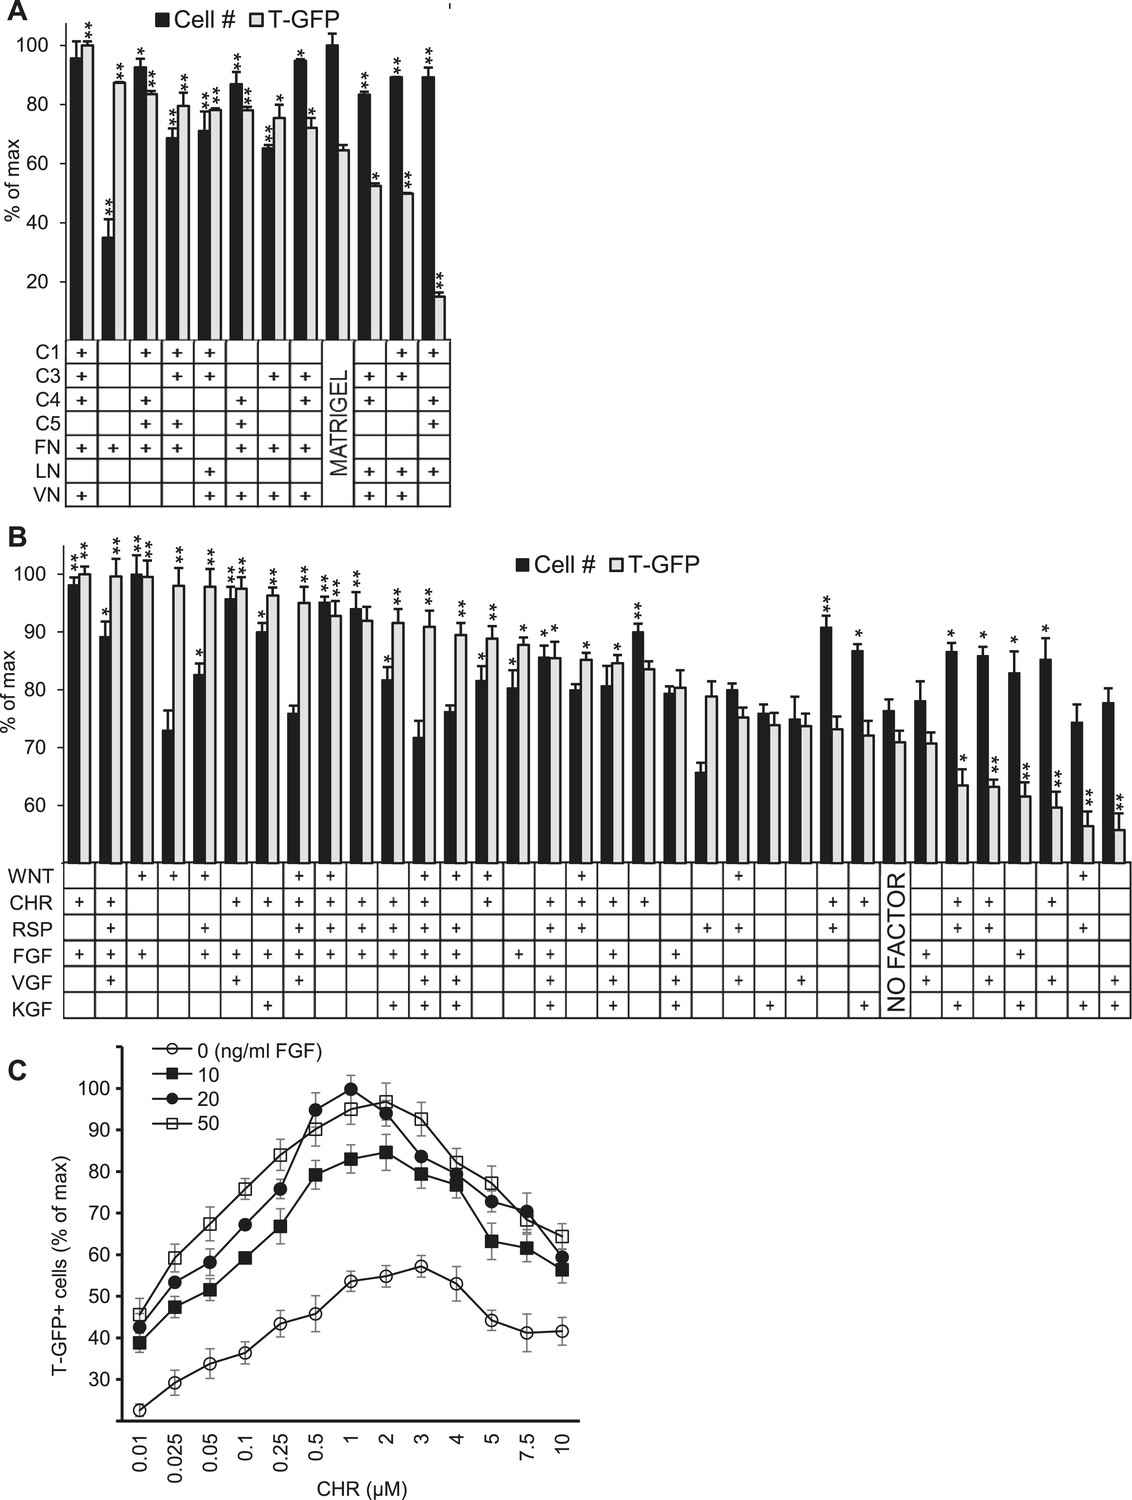
Validation of high-throughput ACME screens.
Scale up analysis of hits from the ACME screens. Human ES cells carrying a GFP reporter under control of the BRY/T promoter were treated with CHIR98014 (CHR) for 24 hr. After 48 hr, GFP positive (T-GFP) cells were cultured in multi-well plates for 72 hr to validate conditions from the ACME screens. (A) GFP+ cells were cultured in multi-well plates coated with 10 hit matrices from the primary ECMP screen as well as Matrigel and a sub-optimal matrix (C1 C4 C5 LN). The optimal matrix (C1 C3 C4 FN VN) was defined as the condition that maintained the highest T-GFP expression and fostered the highest cell number. Statistical comparisons are made to the Matrigel condition. *p < 0.05, **p < 0.005. When p-values are not indicated with * or **, the statistical difference is not significant from the control. (B) GFP+ cells were cultured in multi-well plates coated with the optimal matrix (C1 C3 C4 FN VN) and various GF/SM combinations. Statistical comparisons are made to the conditions containing no GF/SM (No Factor). *p < 0.05, **p < 0.005. When p-values are not indicated with * or **, the statistical difference is not significant from the control. (C) GFP+ cells were cultured in multi-well plates coated with the optimal matrix (C1 C3 C4 FN VN) and various concentrations of CHR and FGF2 (FGF).
Figure 3 with 10 supplements
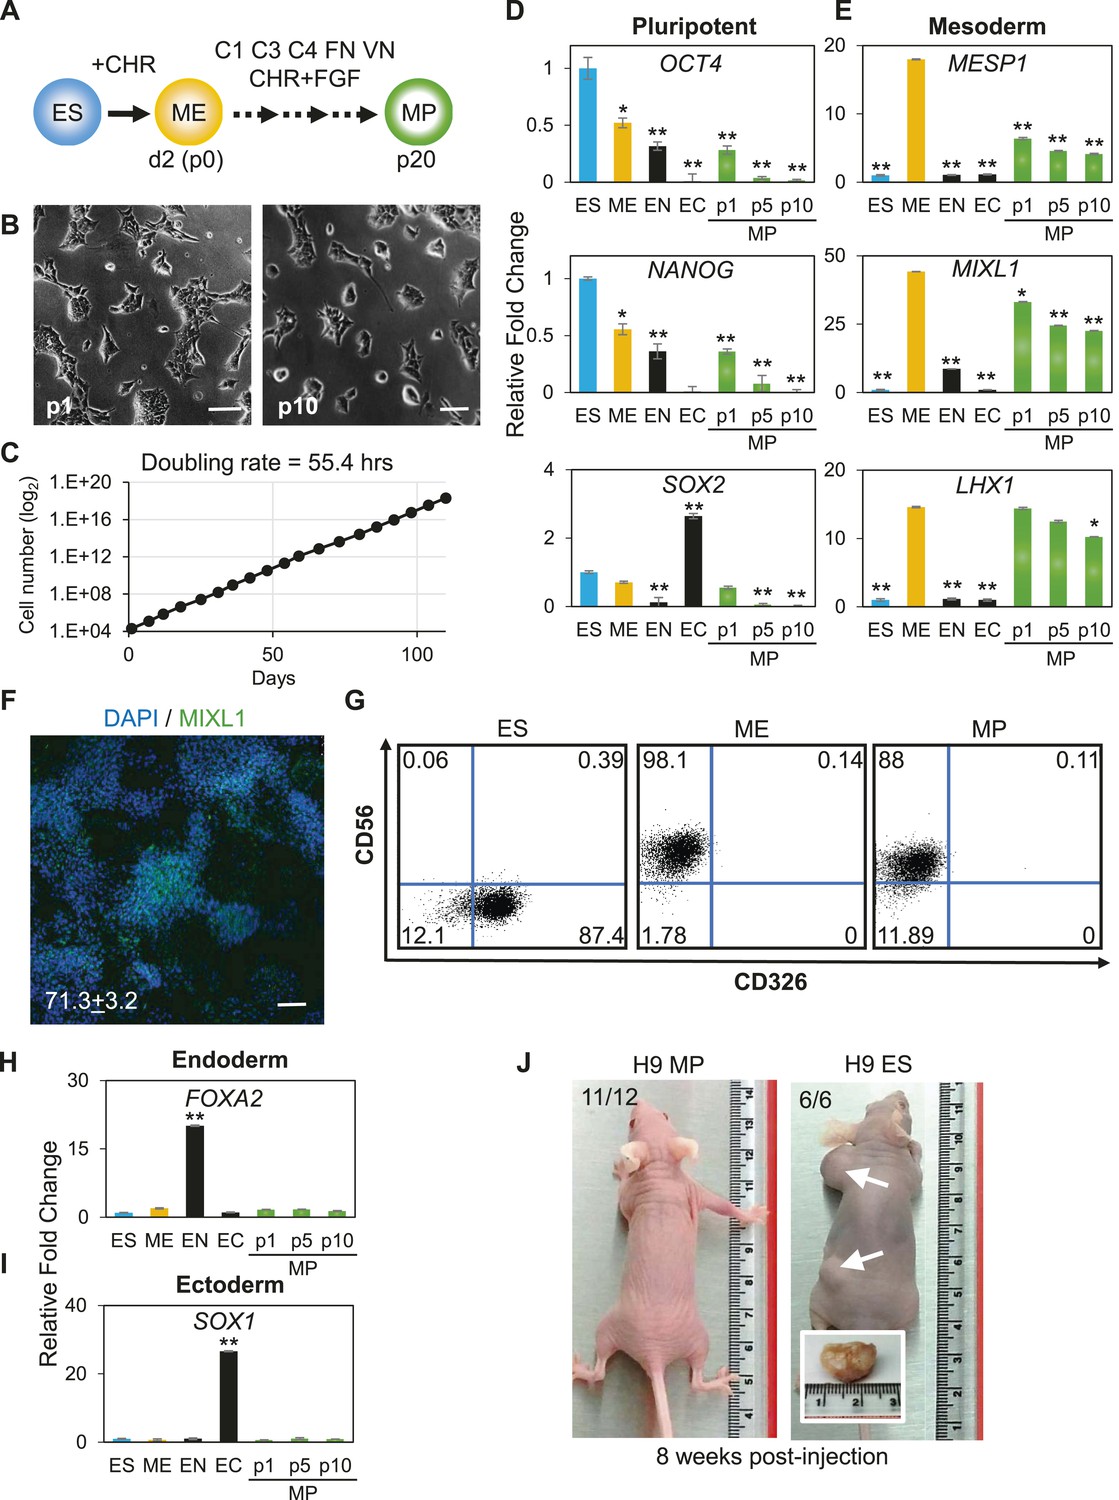
Characterization of mesodermal progenitor population.
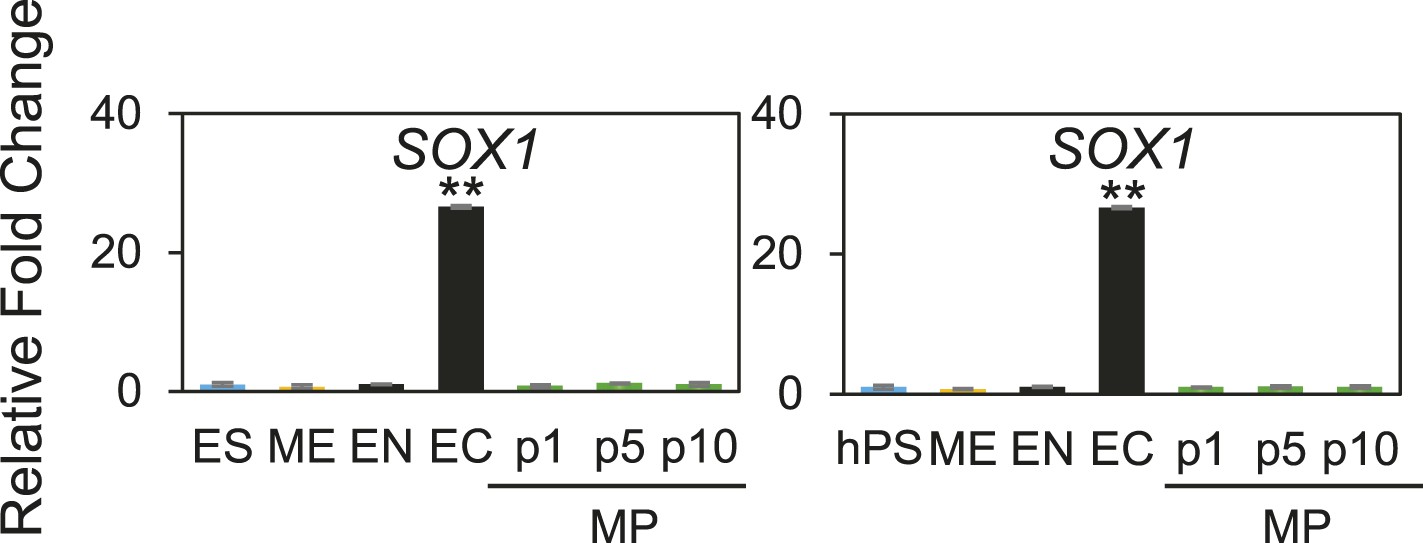
(A) Schematic showing derivation of mesoderm progenitor (MP) cells. Human ES cells were differentiated into mesoderm (ME) with CHIR98014 (CHR) and then replated onto the defined substrate C1 C3 C4 FN VN and cultured with CHR and FGF2 (FGF) for up to 20 passages (p0 to p20). (B) Representative images of MP cells derived from the hES cell line H9/WA09 at passage 1 and 10 in C1 C3 C4 FN VN with CHR and FGF. Scale bar = 50 µm. (C) Growth rate of MP cells derived from H9 T-GFP. Cell counts were taken at each passage. (D) Quantitative PCR (qPCR) analysis for expression of pluripotency markers OCT4, NANOG, and SOX2. Expression of these markers in MP cells at passages 1, 5 and 10 is lower than in undifferentiated cells (ES). Cells differentiated into ME, endoderm (EN) and ectoderm (EC) served as controls. All statistical comparisons are made to the ES sample. *p < 0.05, **p < 0.005. (E) qPCR analysis for expression of mesodermal markers MESP1, MIXL1, and LHX1. Expression of these markers in MP cells at passages 1, 5 and 10 is comparable to that observed in ME and higher than in ES, EN and EC. All statistical comparisons are made to the ME sample. *p < 0.05, **p < 0.005. (F) MIXL1 immunofluorescence (IF) in MP cells. MP cells at passage 15 were fixed and stained with MIXL1-specific antibody. Number indicates percentage of MIXL1 expressing cells in the MP cell population. Standard deviation represents the variation between the fields of view used for counting (n = 20). Scale bar = 50 µm. (G) Flow cytometry analysis for CD56 (NCAM) and CD326 (ECAM). Pluripotent cells (ES, CD326+ CD56−) are differentiated to ME cells (CD326− CD56+). MP cells at p10 exhibit a similar cell surface expression of these two markers as ME. (H) qPCR analysis for expression of the EN marker FOXA2. Expression of FOXA2 is only detected in cells differentiated towards EN. All statistical comparisons are made to the ES sample. (I) qPCR analysis for expression of the EC marker SOX1. Expression of SOX1 is only detected in cells differentiated towards EC. All statistical comparisons are made to the ES sample. (J) MP cells are non-tumorogenic. Nude mice were injected with H9-derived MP cells or H9 ES cells. Injected ES cells generated tumors while injected MP cells did not form any growth in 11/12 injections. Figure 3—figure supplement 1 through 10 provide additional analysis, including for two other hPSC lines (BJ RiPS and HUES9).
Figure 3—figure supplement 1
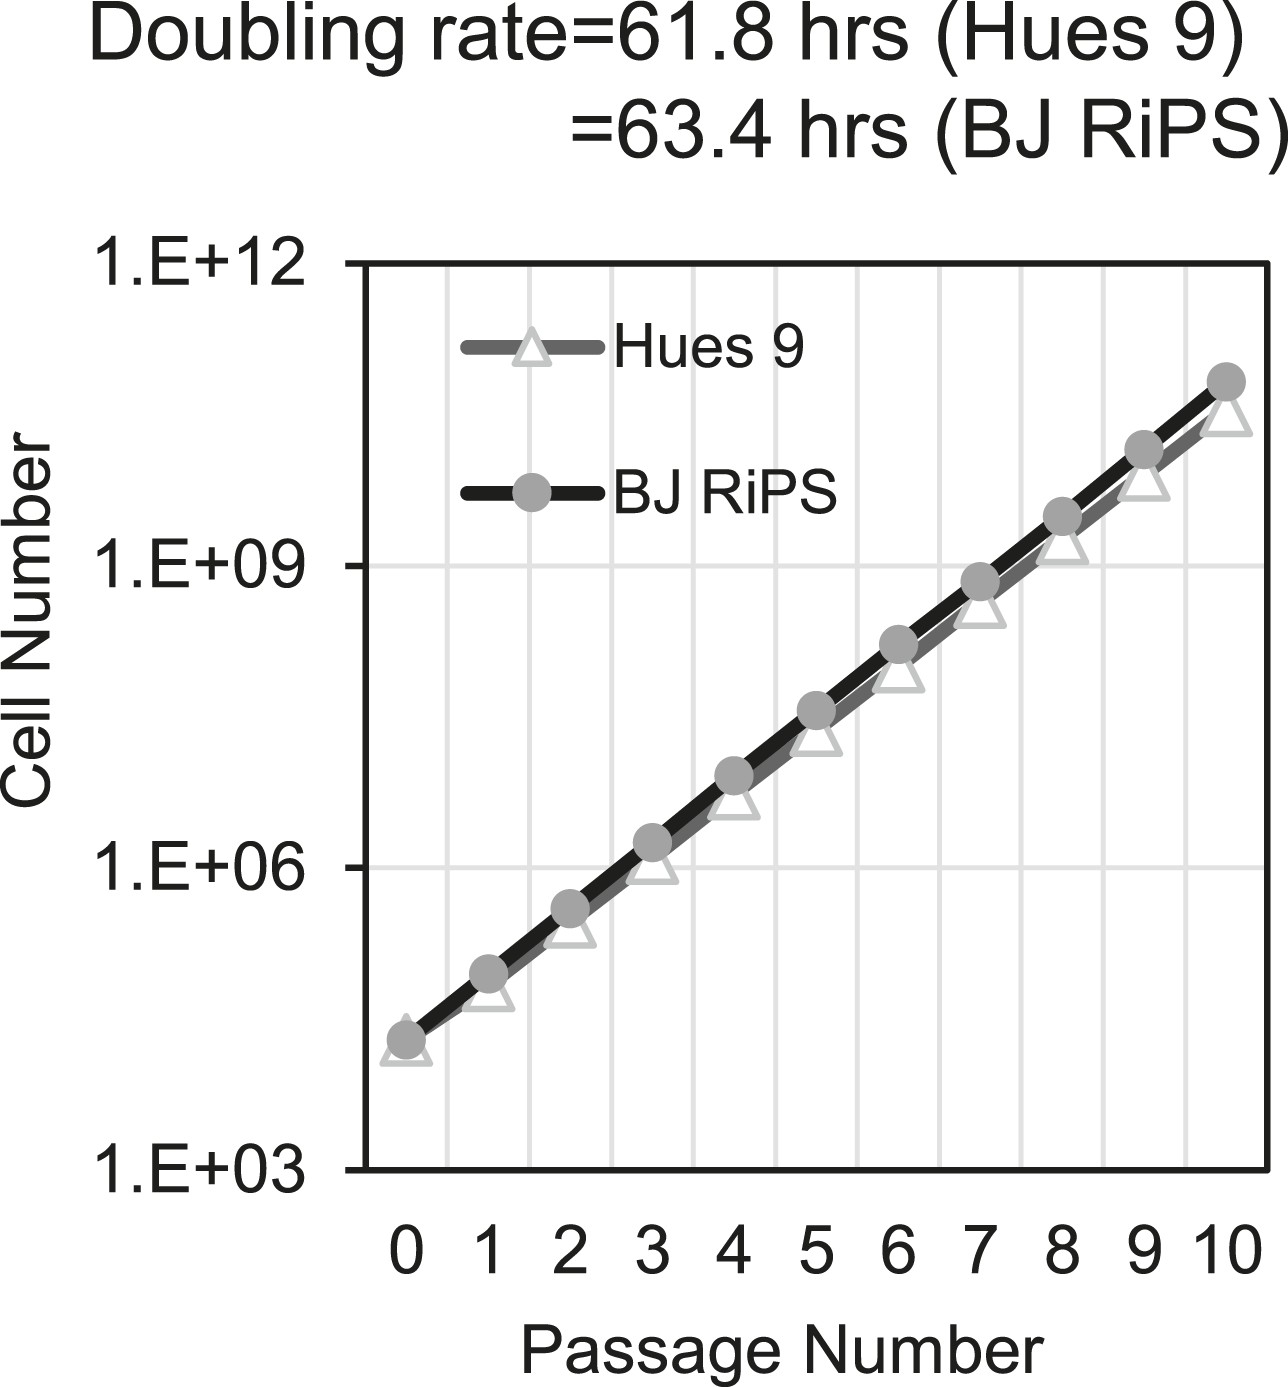
Growth rate of MP cells derived from Hues 9 or BJ RiPS.
Cell counts were taken at each passage.
Figure 3—figure supplement 2
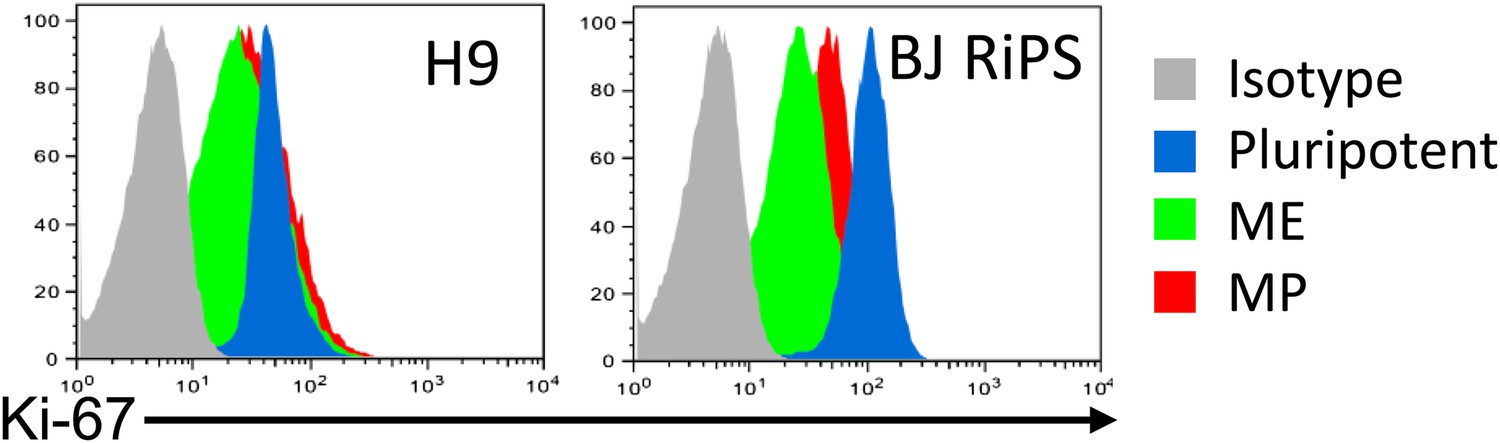
Flow cytometry analysis of Ki-67 in human ES, ME, and MP.
MP cells were analyzed at passage 10.
Figure 3—figure supplement 3
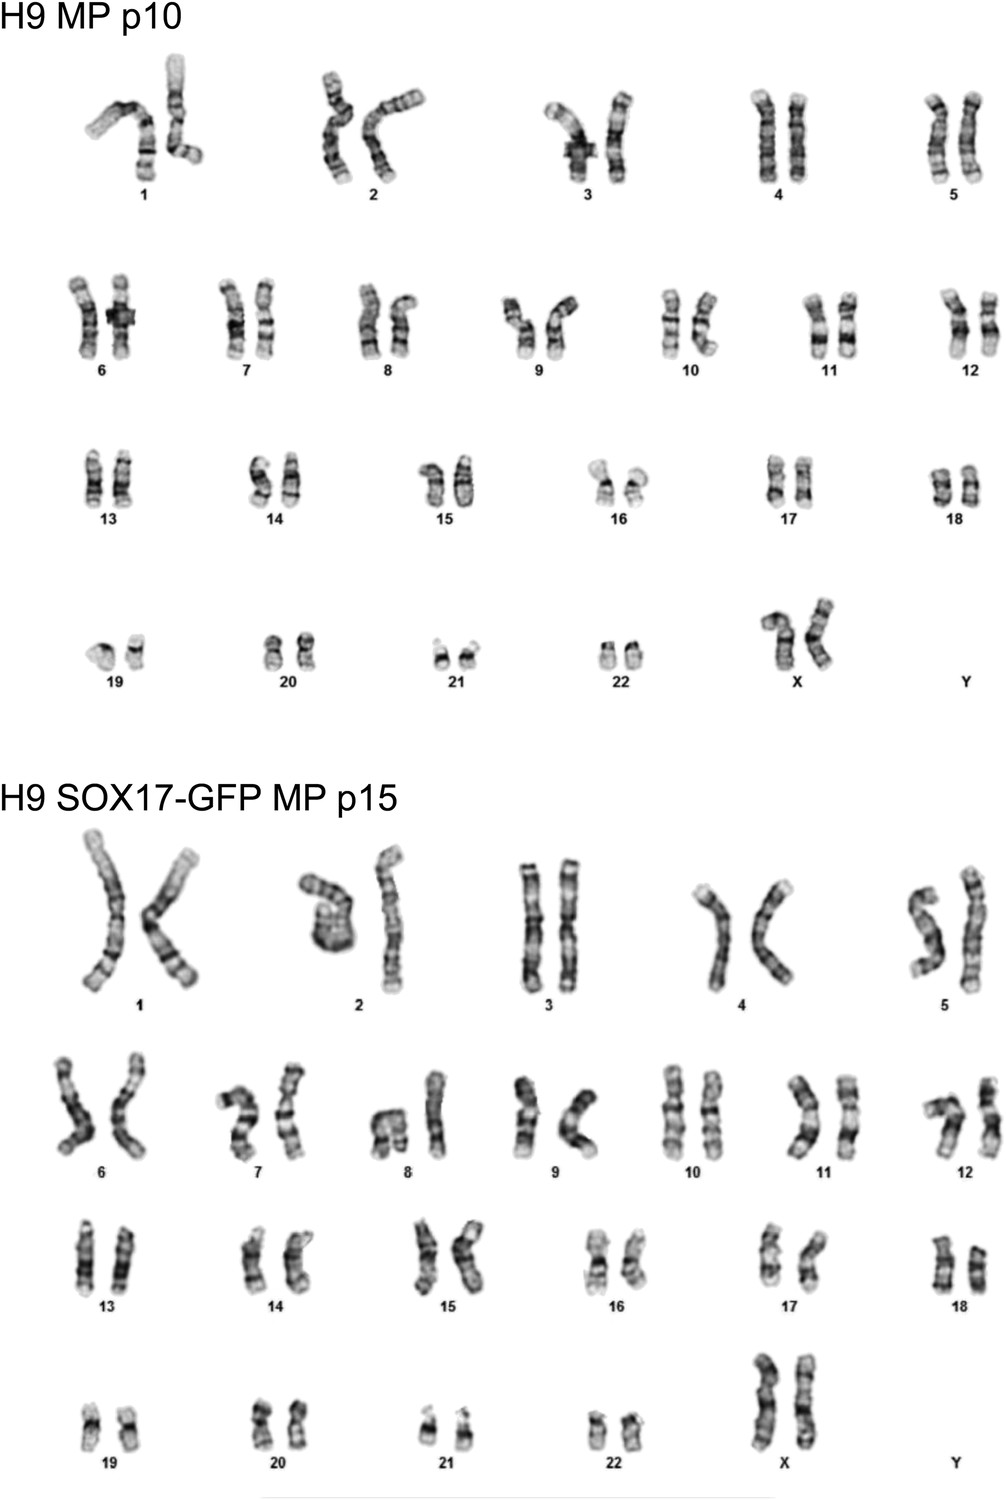
Karyotype of MP cells derived from the hES cell line H9/WA09.
Cytogenetic analysis was performed on two independent MP cell lines, one derived from H9 cells and grown to passage 10 (p10, top) and one derived from H9 SOX17-GFP and grown to passage 15 (p15, bottom). For each line, twenty G-banded metaphase cells were analyzed. 19 cells of H9 MP cells demonstrated an apparently normal female karyotype while one cell demonstrated a non-clonal chromosome aberration (45, XX, −20), which is most likely an artifact of culture. None of the 20 cells of H9 SOX17-GFP MP cells exhibited chromosome aberrations. No abnormal cells with trisomy 12 and/or 17 were detected.
Figure 3—figure supplement 4
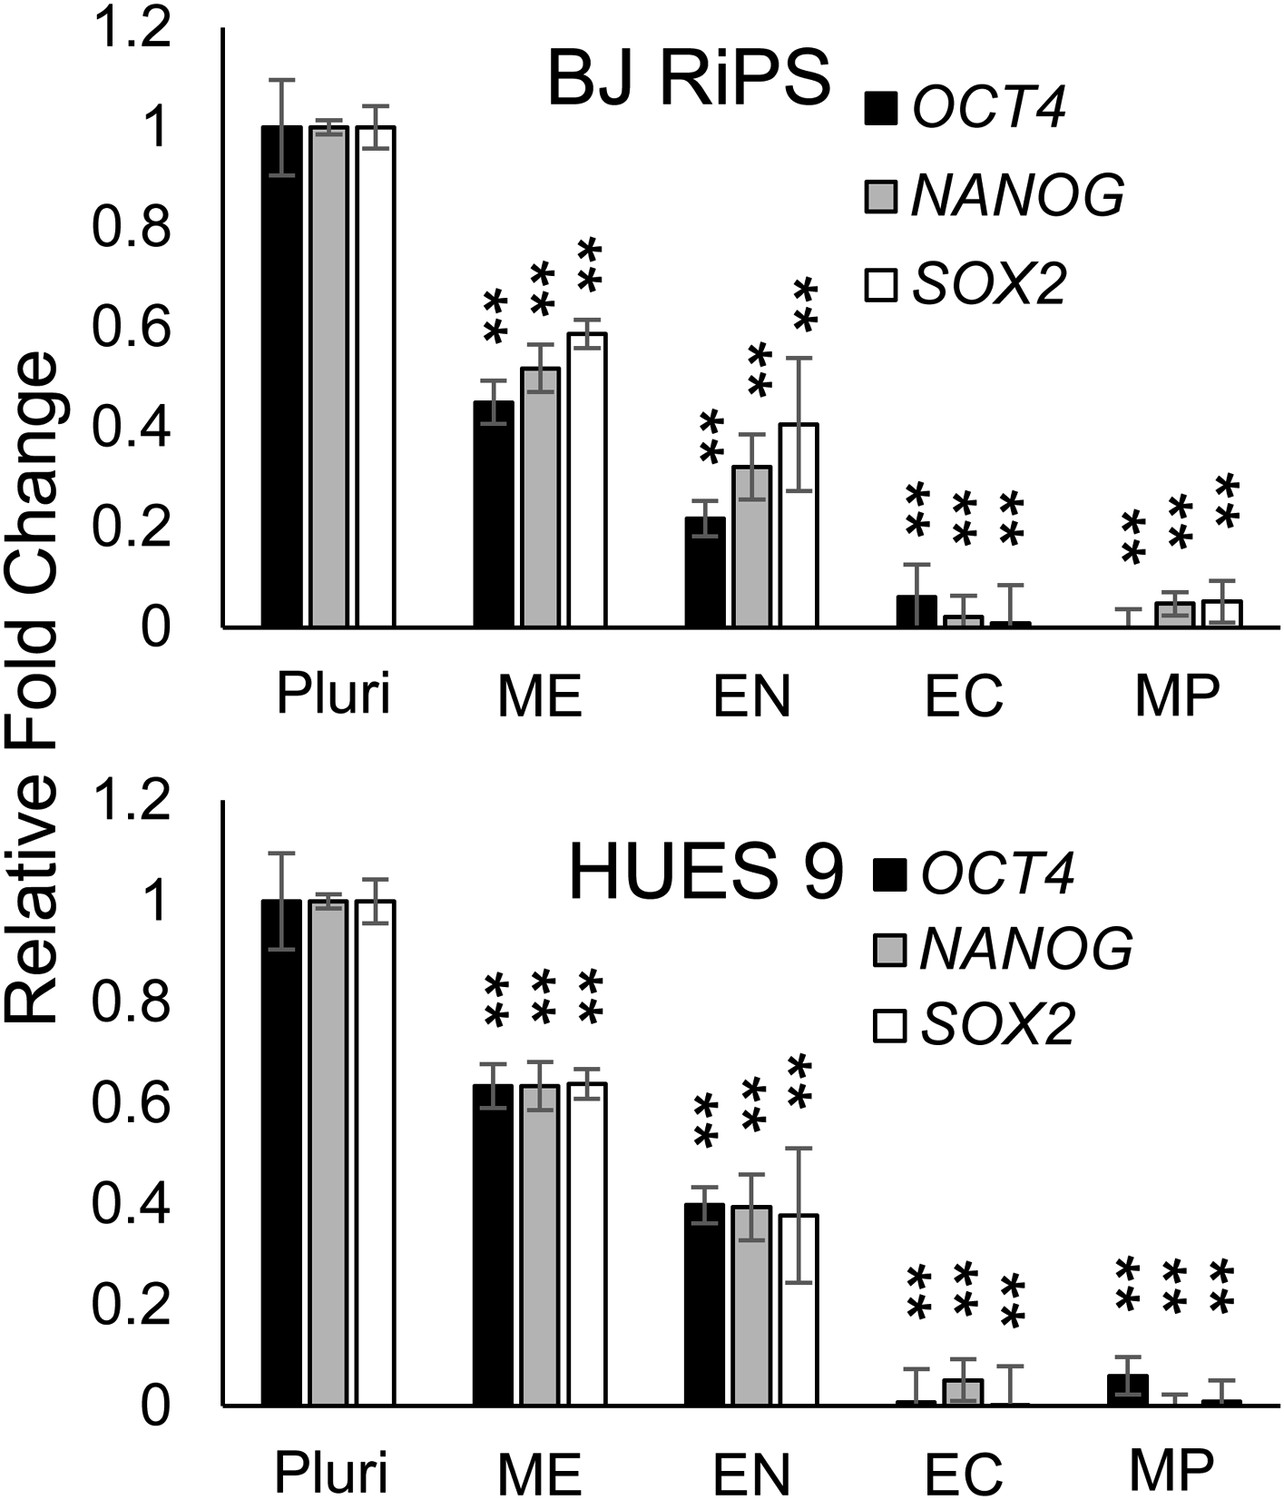
QPCR analysis for expression of pluripotency markers OCT4, NANOG, and SOX2.
Expression of these markers in MP cells at passage 10 is lower than in undifferentiated cells (Pluri). Cells differentiated into ME, EN and EC served as controls. All statistical comparisons are made to the ES sample. *p < 0.05, **p < 0.005.
Figure 3—figure supplement 5
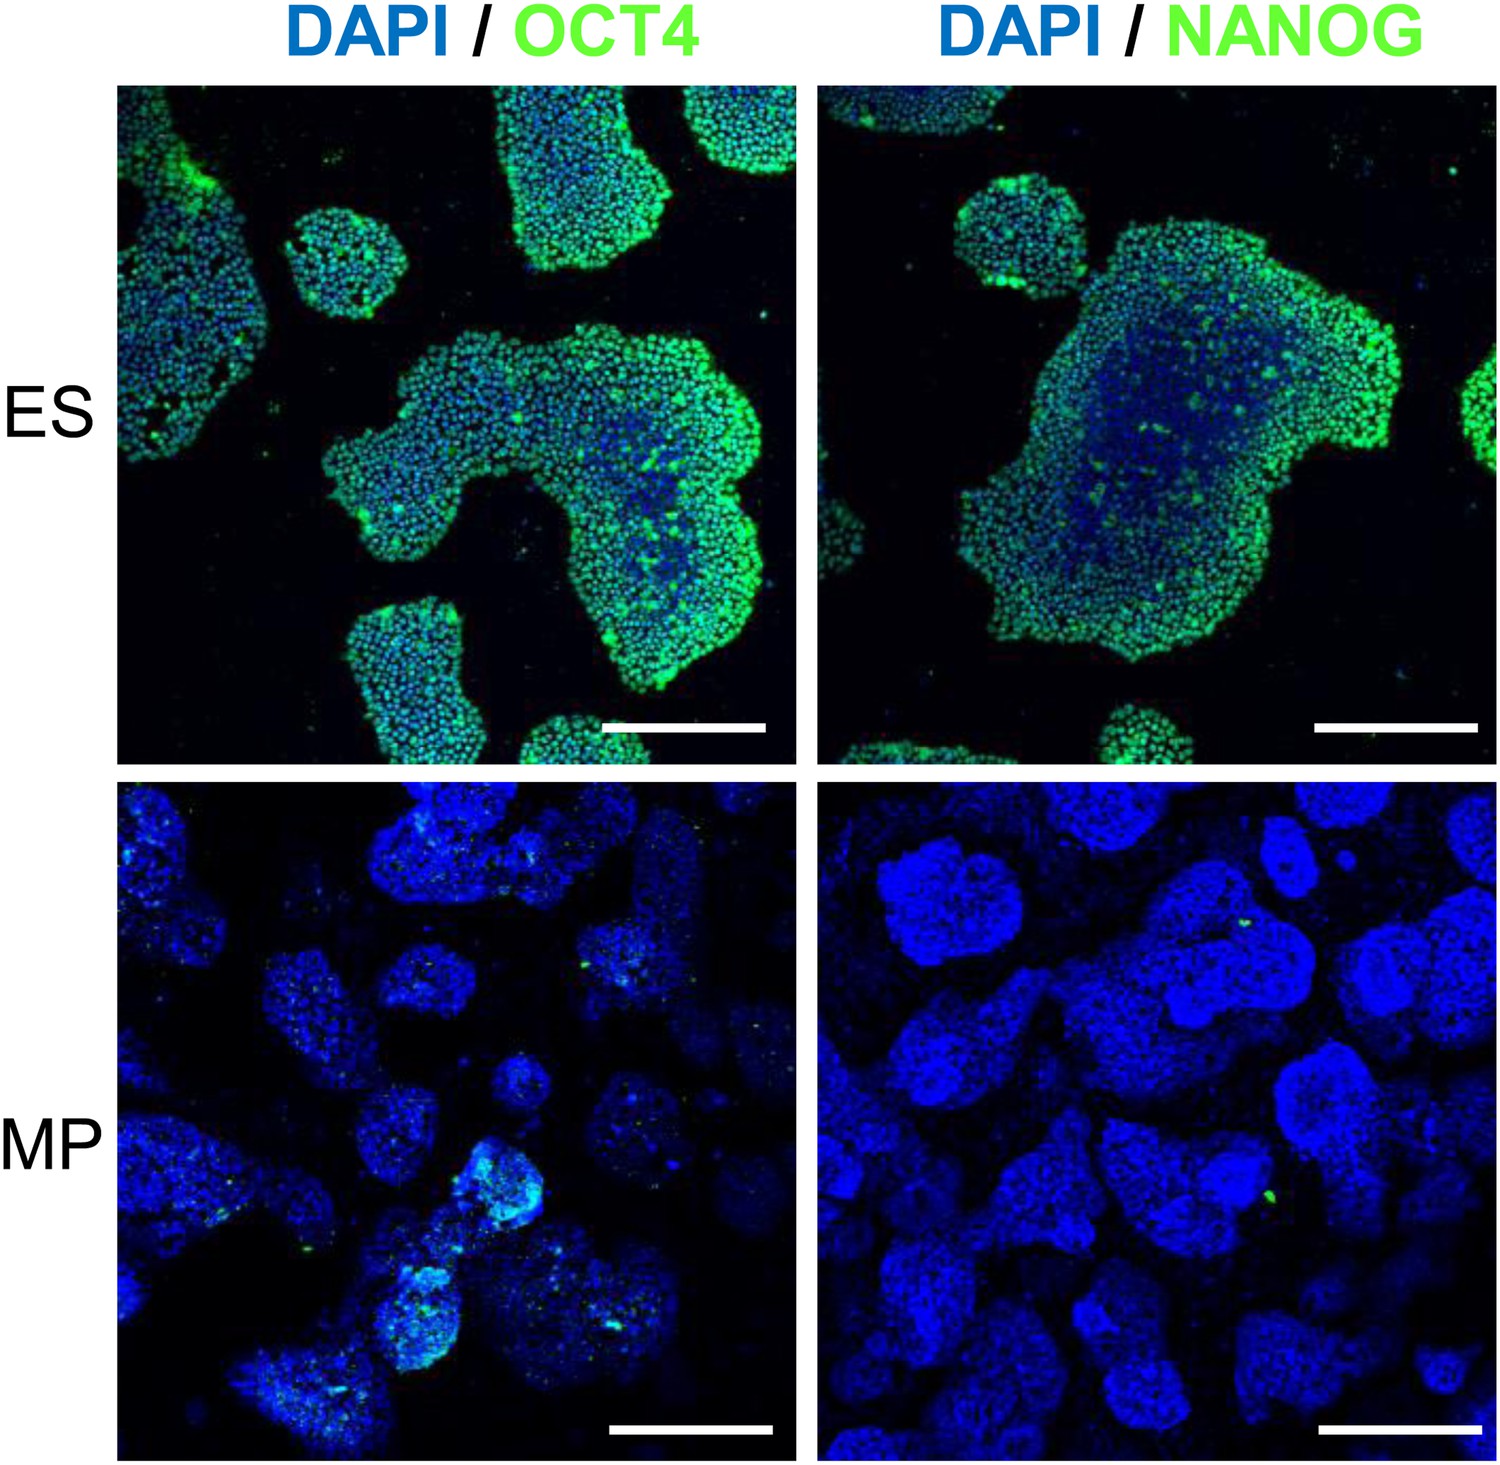
IF of Hues 9 ES and MP cells demonstrate that MP cells do not express OCT4 and NANOG proteins.
Scale bar = 100 μm.
Figure 3—figure supplement 6
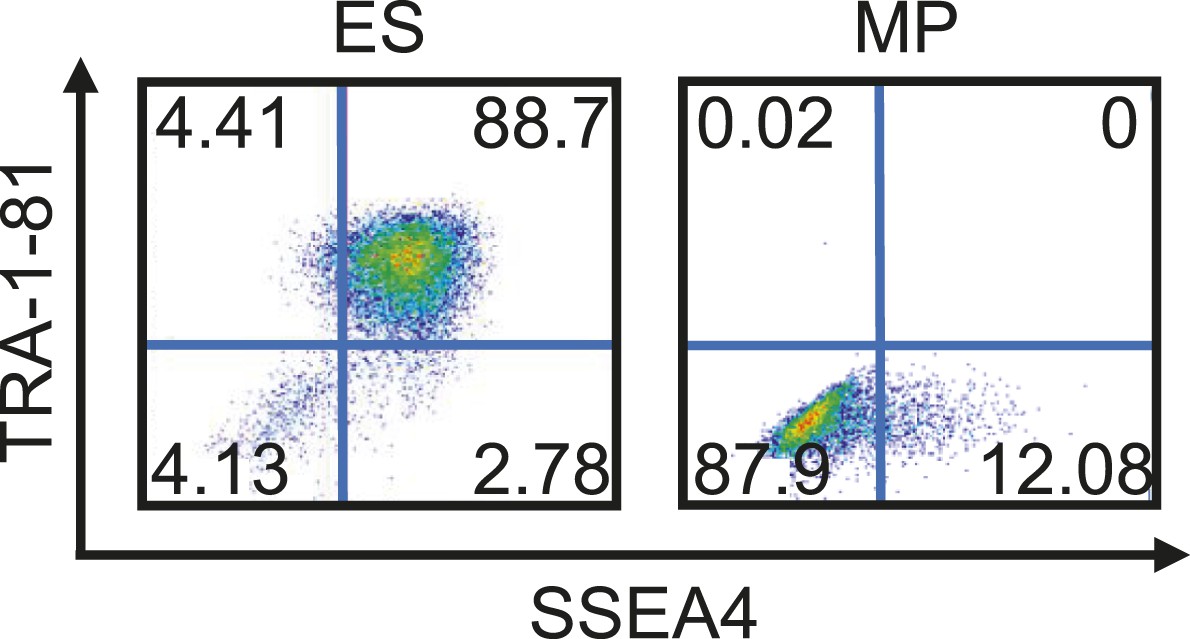
Flow cytometry analysis of Hues 9 ES and MP (p10) cells for Tra-1-81 and SSEA4.
MP cells do not express pluripotent cell surface markers.
Figure 3—figure supplement 7
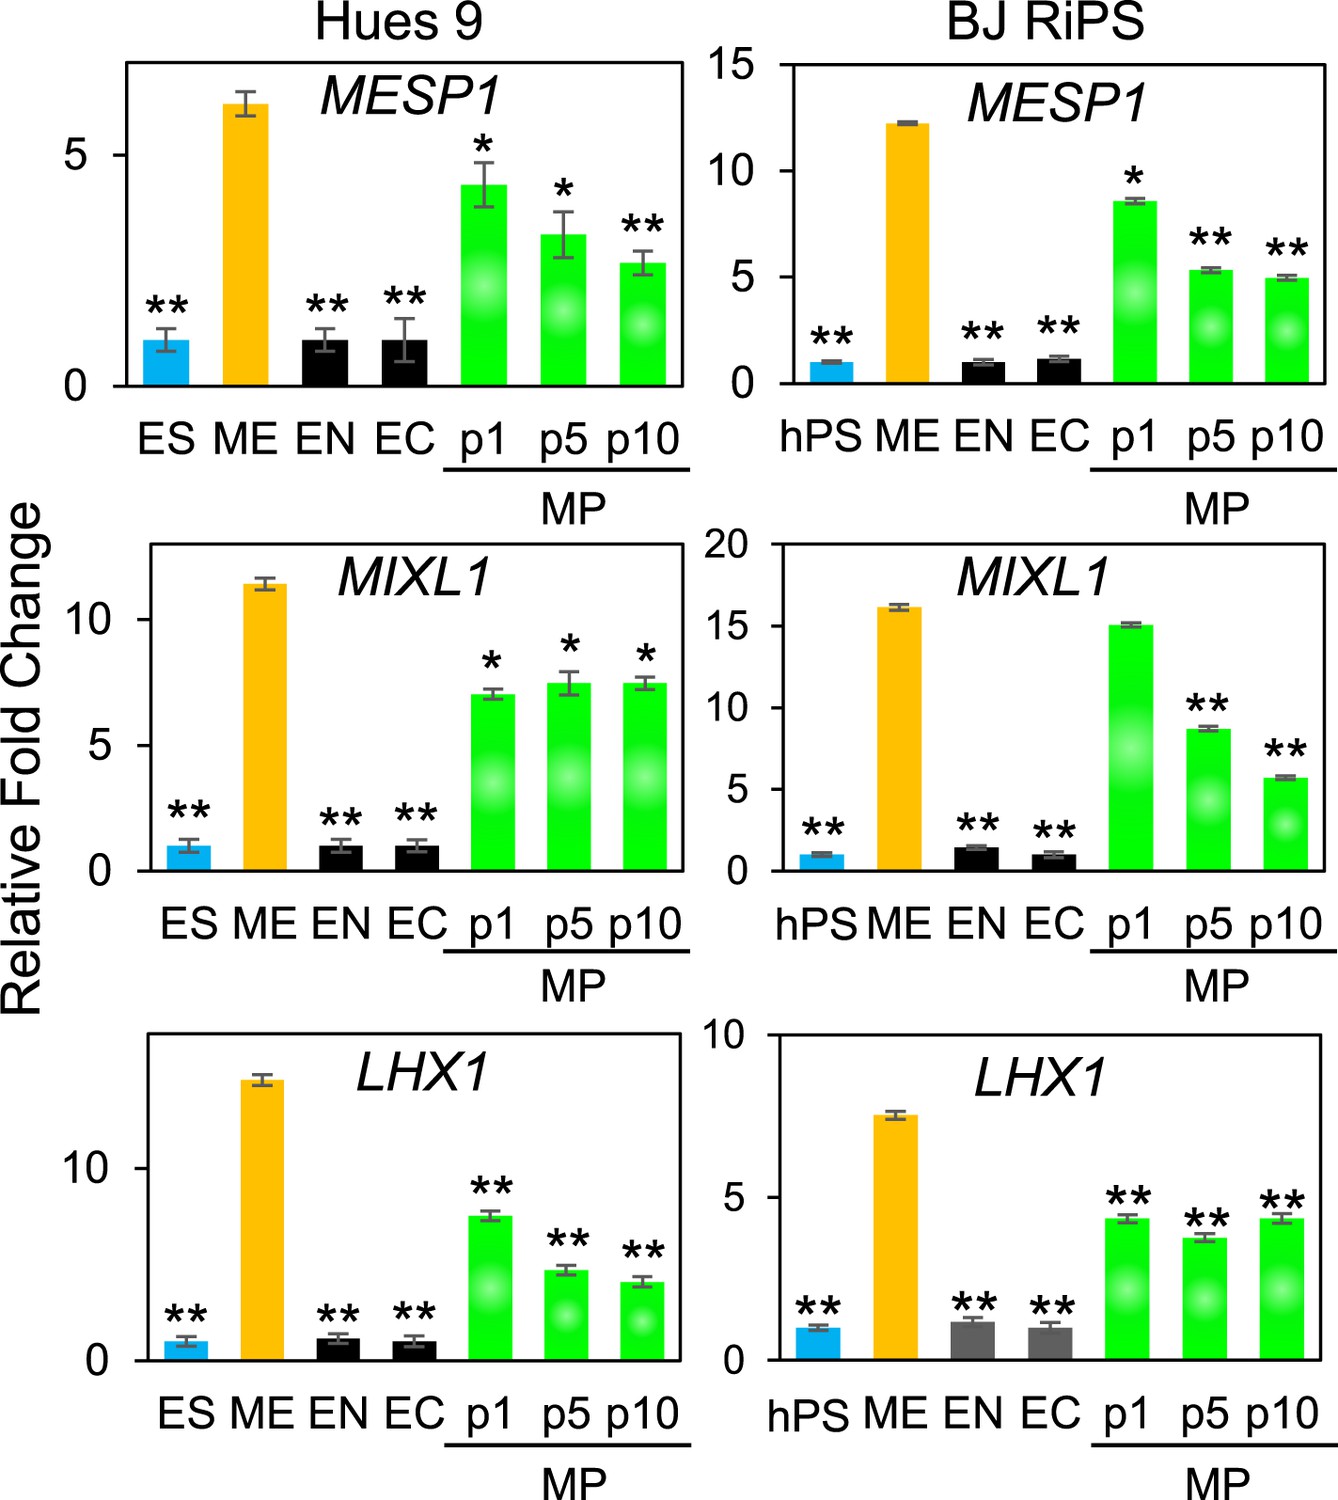
QPCR analysis of MP cells derived from Hues 9 and BJ RiPS for expression of mesodermal markers MESP1, MIXL1, and LHX1.
Expression of these markers in MP cells at passages 1, 5 and 10 is comparable to that observed in ME and higher than in ES, EN and EC. All statistical comparisons are made to the ME sample. *p < 0.05, **p < 0.005.
Figure 3—figure supplement 8
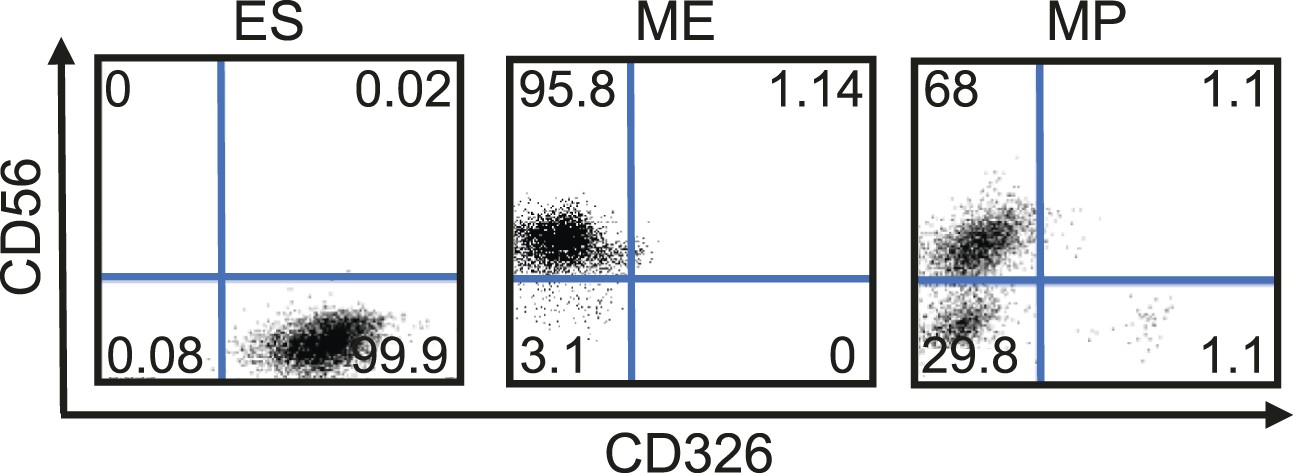
Flow cytometry analysis for CD56 (NCAM1) and CD326 (EPCAM) in undifferentiated RiPS cells as well as ME and MP (p10) cells derived from RiPS cells.
MP cells exhibit a similar cell surface expression of these two markers as ME.
Figure 3—figure supplement 9
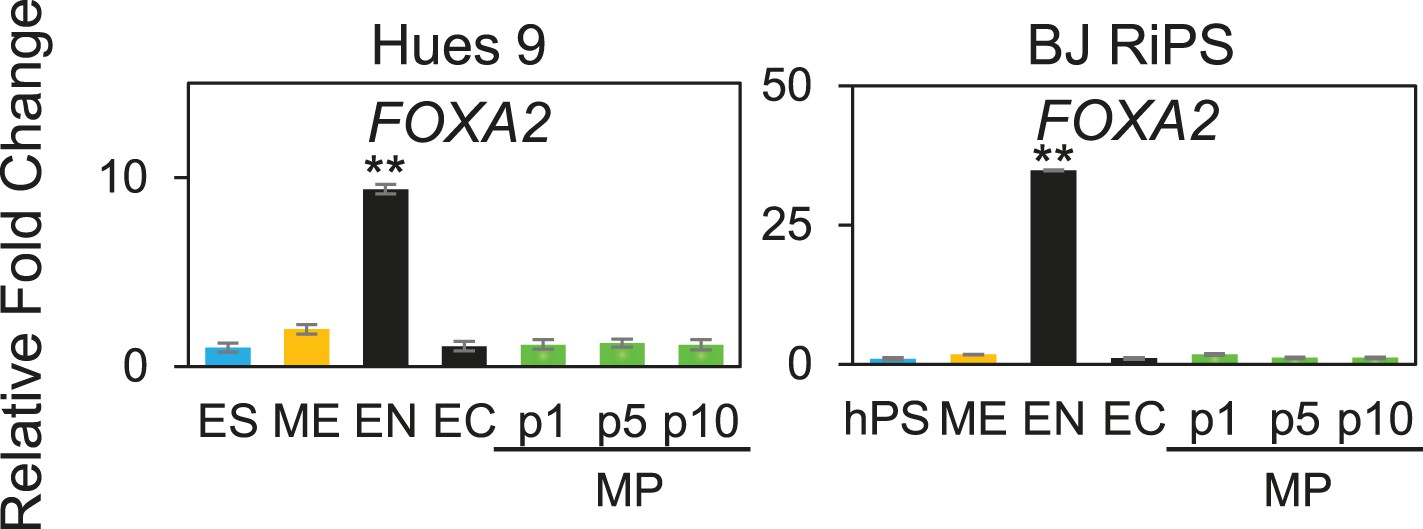
QPCR analysis of MP cells derived from Hues 9 and BJ RiPS.
Low expression of FOXA2 demonstrates that MP cells are not committed to the EN lineages. All statistical comparisons are made to the pluripotent (ES or hPS) sample. *p < 0.05, **p < 0.005.
Figure 3—figure supplement 10
QPCR analysis of MP cells derived from Hues 9 and BJ RiPS.
Low expression of SOX1 demonstrates that MP cells are not committed to the EC lineages. All statistical comparisons are made to the pluripotent (ES or hPS) sample. *p < 0.05, **p < 0.005.
Figure 4
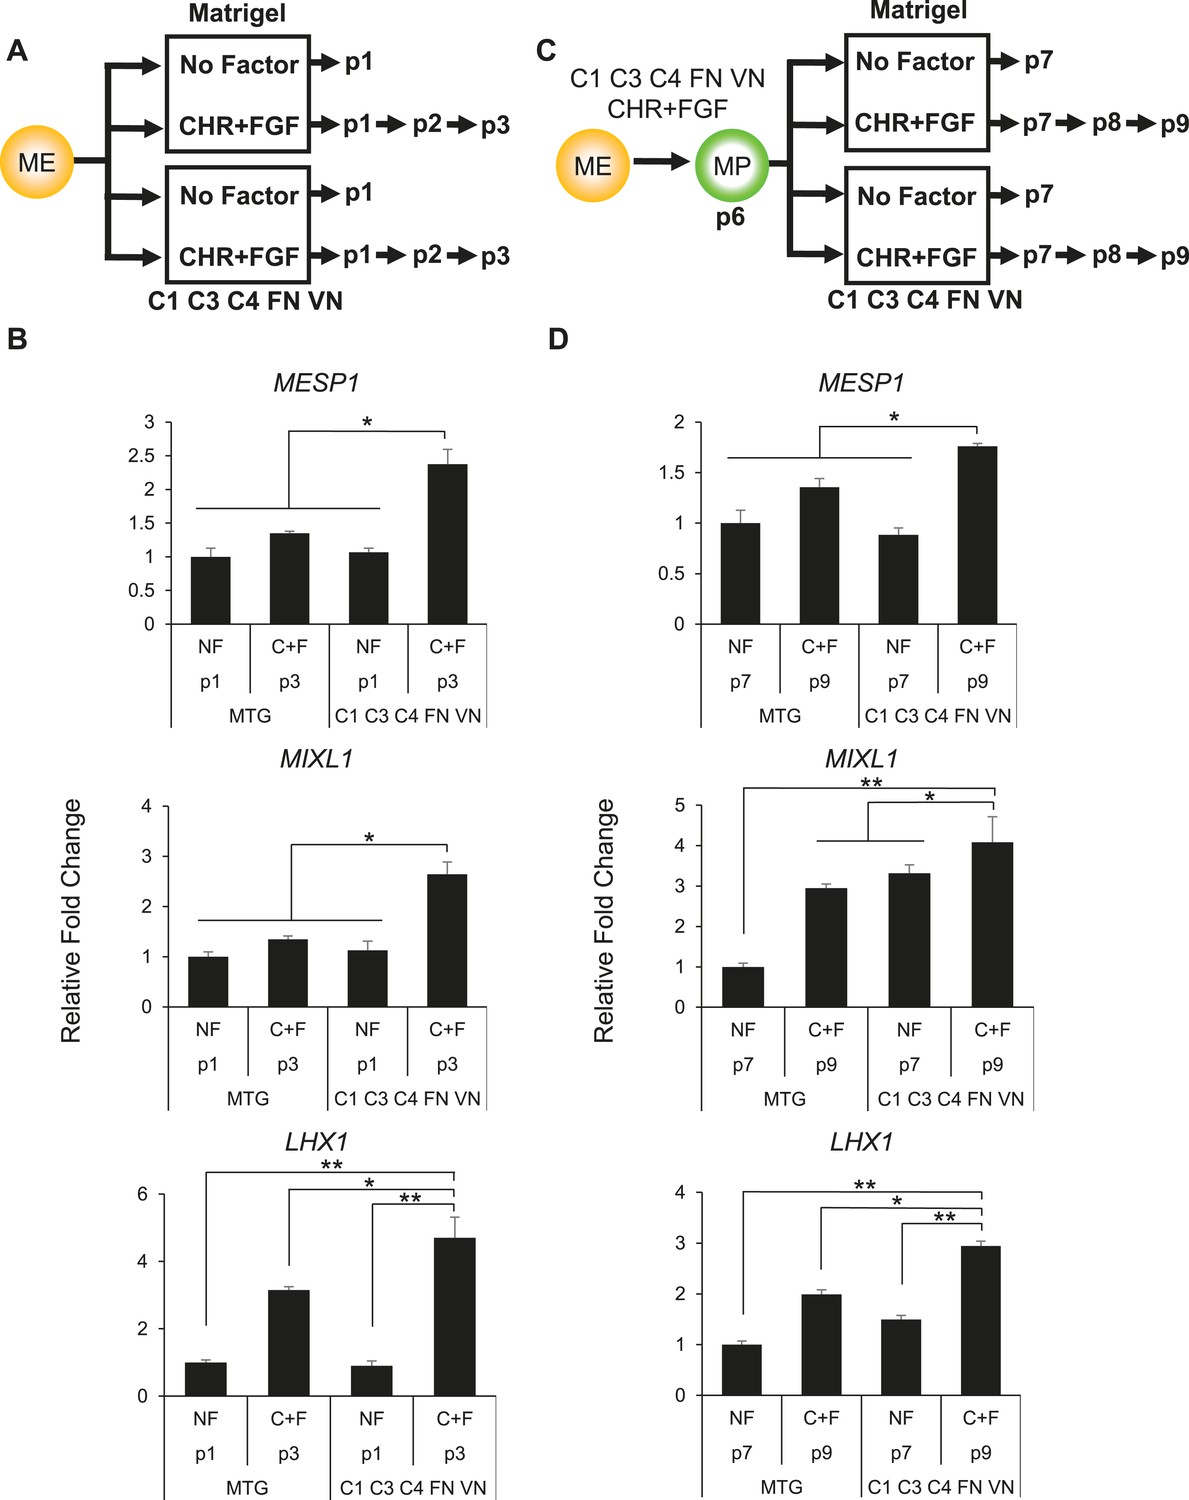
Optimized culture conditions are required to generate and maintain MP cells.
(A) Human ES cells were treated with CHIR98014 (CHR) for 24 hr. After 48 hr, cells were cultured on either Matrigel or the optimal matrix (C1 C3 C4 FN VN) in the absence (no factor) or in the presence of the optimal GF/SM combination (CHR + FGF). Only cells cultured with CHR + FGF could be serially passaged. (B) QPCR analysis for mesodermal markers MESP1, MIXL1, and LHX1. Conditions containing no factor did not grow beyond passage 1, while the CHIR + FGF samples represent expression at passage 3. NF = no factor; C + F = CHR + FGF. Statistical comparisons are made to C1 C3 C4 FN VN with CHR + FGF condition. *p < 0.05, **p < 0.005. (C) MP cells were expanded to p6 on the optimal ECMP (C1 C3 C4 FN VN) and GF/SM combination (CHR + FGF). MP cells were then either transitioned to Matrigel or maintained on C1 C3 C4 FN VN in the absence or presence of CHR + FGF. (D) QPCR analysis for mesodermal markers MESP1, MIXL1, and LHX1. Conditions containing no factor did not grow past p7, while the CHR + FGF sample represents expression at p9. All statistical comparisons are made to the C1 C3 C4 FN VN with CHR + FGF condition. *p < 0.05, **p < 0.005.
Figure 5
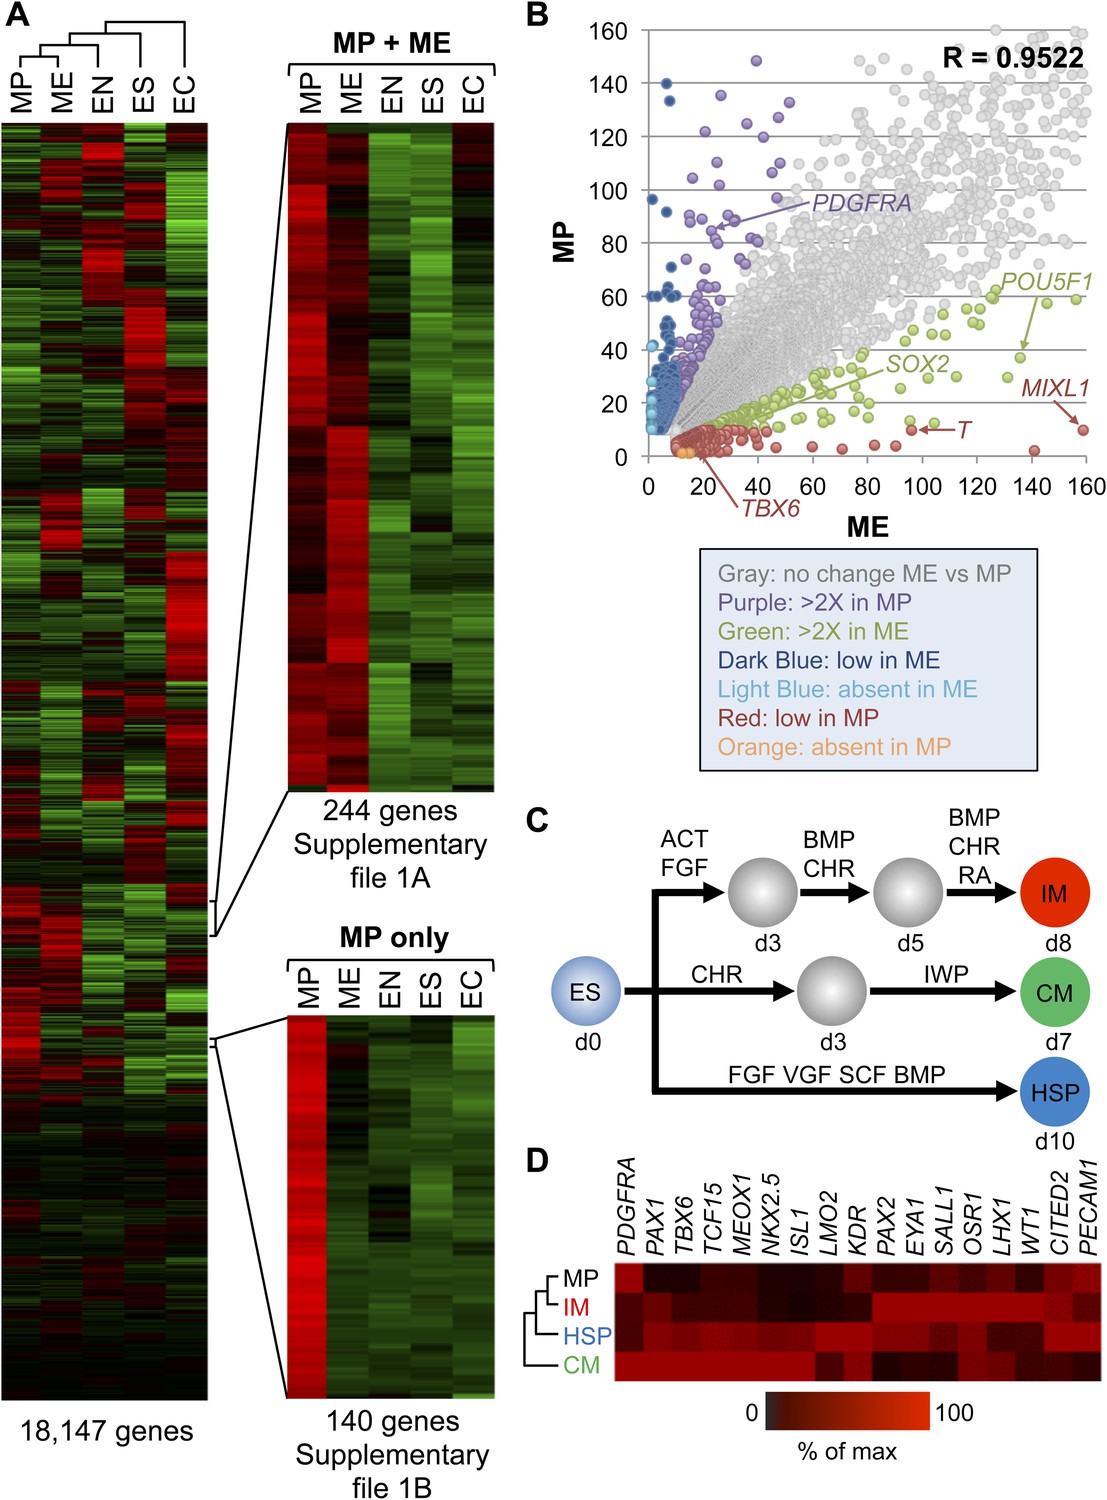
Gene expression analysis reveals that MP cells have an intermediate mesodermal (IM) identity.
RNA sequencing (RNA-seq) was used to analyze gene expression of MP cells. As a comparison, gene expression profiles were analyzed for hES (ES) cells and their differentiated progeny, ME, EN and EC. (A) MP cells resemble mesodermally differentiated cells. Hierarchical clustering analysis was performed for all genes with detectable expression (reads per kilobase per million mapped reads [RPKM] values greater than 10) in one of the five cell populations. Supplementary file 1 provides the complete list of genes shared between MP and ME (A) and genes unique to MP (B). The complete RNA-seq data set for MP cells is provided in Supplementary file 2. (B) Correlation of gene expression profiles. Genes with expression values (RPKM) expression between 10 and 1500 were plotted for MP cells and ME. The correlation coefficient (R) for all expressed genes is 0.9522. (C) Schematic depicting differentiation protocols from hES cells to IM and lateral plate mesoderm (LM) derivatives cardiomyocytes (CMs) and hematopoietic stem and progenitor (HSP) cells. (D) QPCR analysis of IM, CM, HSP, and MP cells revealed that MP cells have a similar expression profile as IM cells. ACT = Activin A, BMP = BMP4, CHR = CHIR98014, d = day, FGF = FGF2, IWP = IWP-2, RA = retinoic acid, VGF = VEGF.
Figure 6

IMP cells are unable to differentiate to cell types derived from lateral plate mesoderm (LM).
(A) Schematic of the hematopoietic differentiation protocol. Cells were differentiated in a step-wise manner using the indicated GFs and SMs from undifferentiated ES cells or from IMP cells to ME, endothelial cell (ENC) and subsequently to hematopoietic precursors (HPs). Stage-specific marker genes and cell surface markers expressed during this differentiation process are indicated at the top. FGF = FGF2, VGF = VEGF, SCF = Stem Cell Factor, BMP = BMP4. (B) QPCR analysis of hES and MP cells differentiated towards HPs. Compared to hES cells, IMP cells do not differentiate towards HPs, as indicated by the absence of SOX17 expression. (C) Flow cytometry analysis of hES and IMP cells differentiated towards HPs for CD34 and CD45. While hESC cells can differentiate into CD34+ CD35+ HPs, IMP cells fail to differentiate generate cells positive for CD34 and CD45. (D) Schematic of the CM differentiation protocol. Cells were differentiated in a step-wise manner using the indicated GFs and SMs from undifferentiated ES cells or from IMP cells to ME, cardiac progenitor (CP) and subsequently to CM. Stage-specific marker genes expressed during this differentiation process are indicated at the top. CHR = CHIR98014, IWP = IWP-2. (E) QPCR analysis of MP cells differentiated towards CMs. Compared to hES cells, IMP cells do not differentiate towards CMs, as indicated by the absence of ISL1 and NKX2.5 expression.
Figure 7
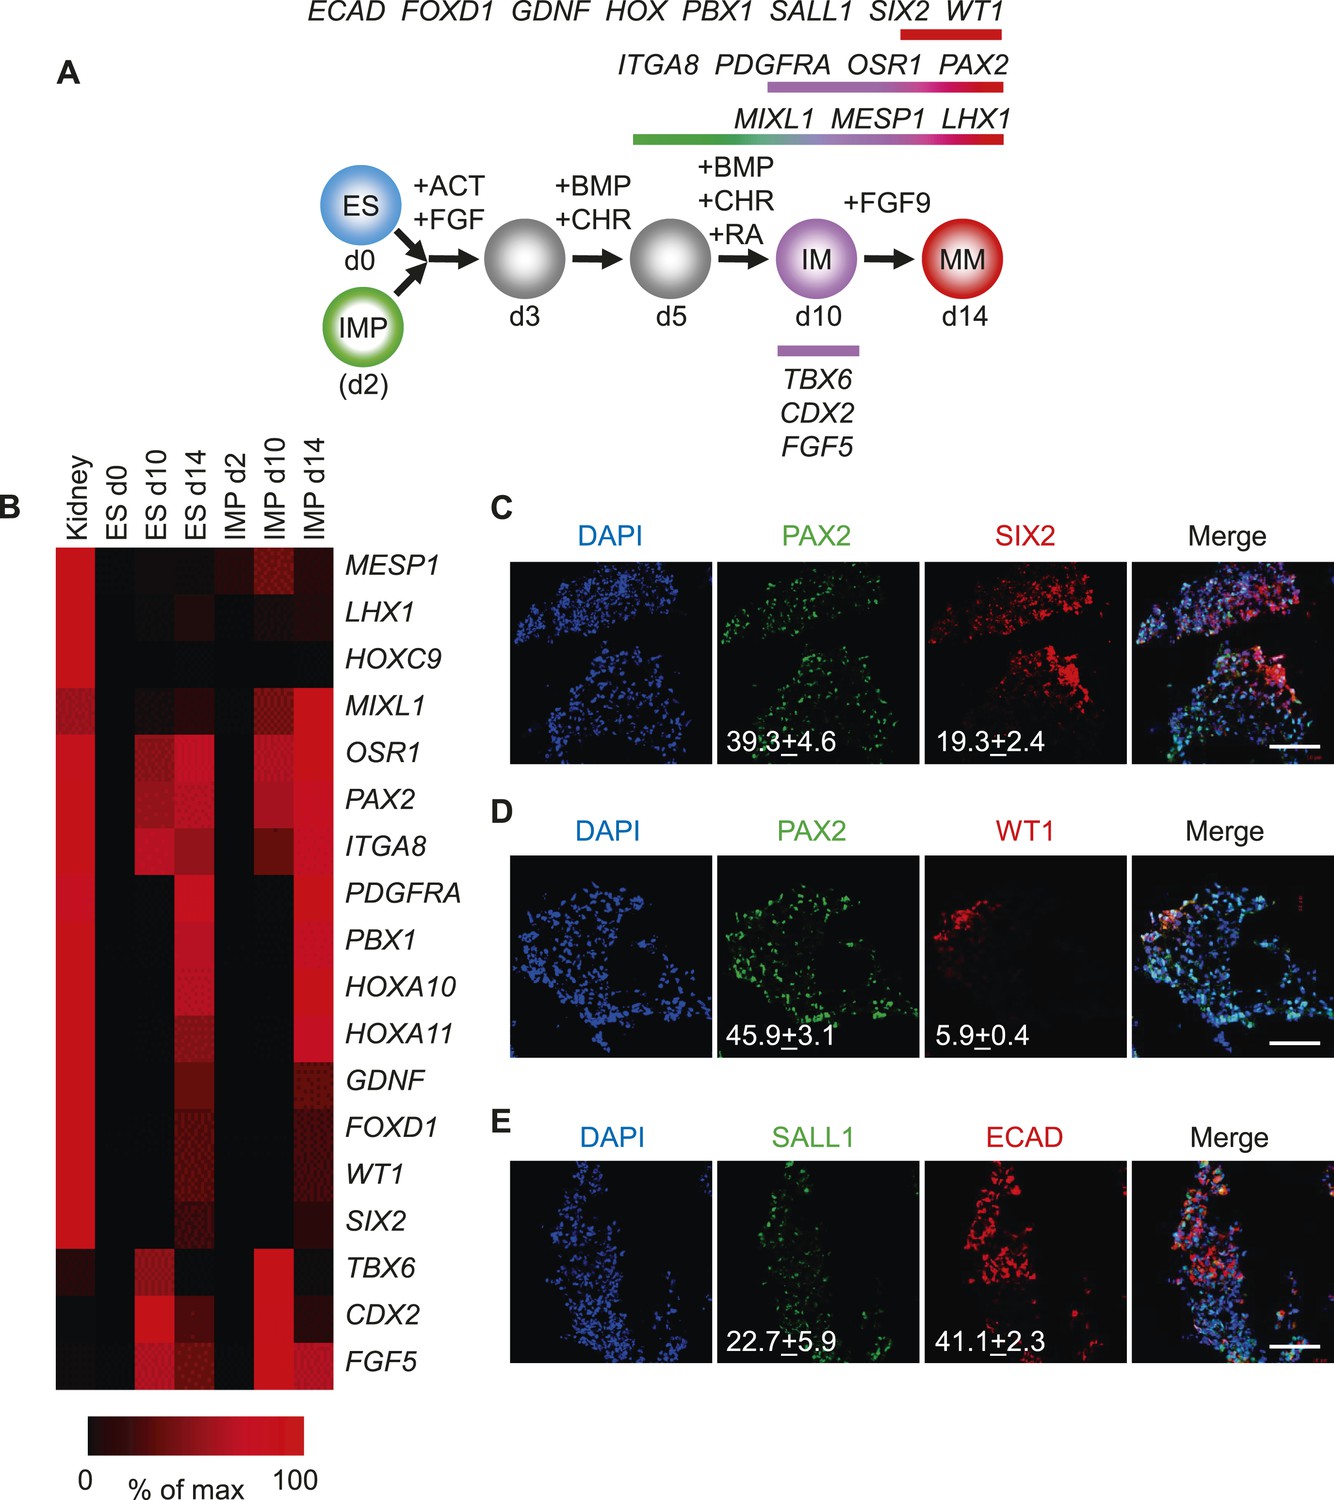
Differentiation of IMP cells into metanephric mesenchyme (MM).
(A) Schematic of the differentiation protocol. Cells were differentiated in a step-wise manner using the indicated GFs and SMs from undifferentiated ES cells or from IMP cells to IM and subsequently to MM. Stage-specific marker genes expressed during this differentiation process are indicated at the top. ACT = ActivinA, BMP = BMP4, CHR = CHIR98014, d = day, FGF = FGF2, RA = retinoic acid. (B) Upon differentiation towards MM, cells expressed genes associated with kidney lineage. QPCR was performed on ES and IMP cells for the indicated genes at various time points. Fetal kidney RNA (11 gestation weeks) was used as a control. The data is displayed as a heat map with black corresponding to minimal expression and red corresponding to maximal levels. (C–E) IF analysis of MP cell-derived MM. IMP cells were differentiated as depicted in panel A, fixed and stained for the indicated proteins and DNA (DAPI). Numbers refer to percentages of cells expressing the protein of interest. Standard deviation represents the variation between the fields of view used for counting (n = 20). Scale bar = 100 µm.
Figure 8
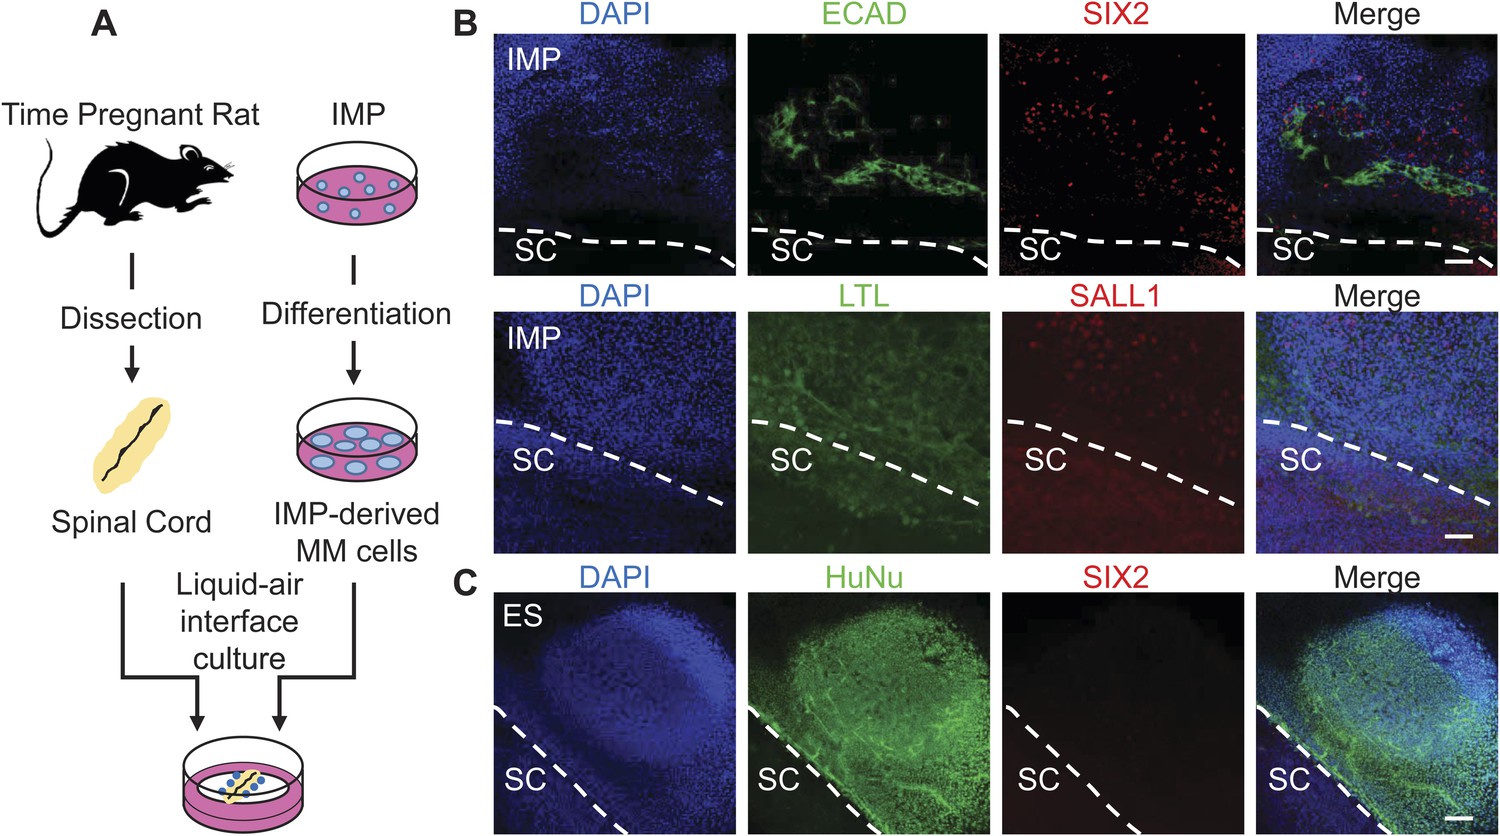
Assessment of renal potential of IMP cells.
(A) Schematic of spinal cord (SC) co-culture assay to assess renal differentiation potential of IMP cells. IMP cells were differentiated as depicted in Figure 7A and incubated in liquid–air interface cultures with rat embryonic SC explants. (B) Immuno-fluorescence analysis of markers expressed in renal progenitors. 4 days after co-cultures were established, cells were fixed and stained for the indicated proteins (ECAD, SIX2 and SALL1) and for Lotus-tetragonolobus lectin (LTL). The dashed line indicates the boundary between human cells and the SC explant. Scale bar = 100 µm. (C) Undifferentiated hES cells failed to express SIX2 when co-cultured with embryonic rat SCs. Scale bar = 100 µm.
Figure 9 with 3 supplements
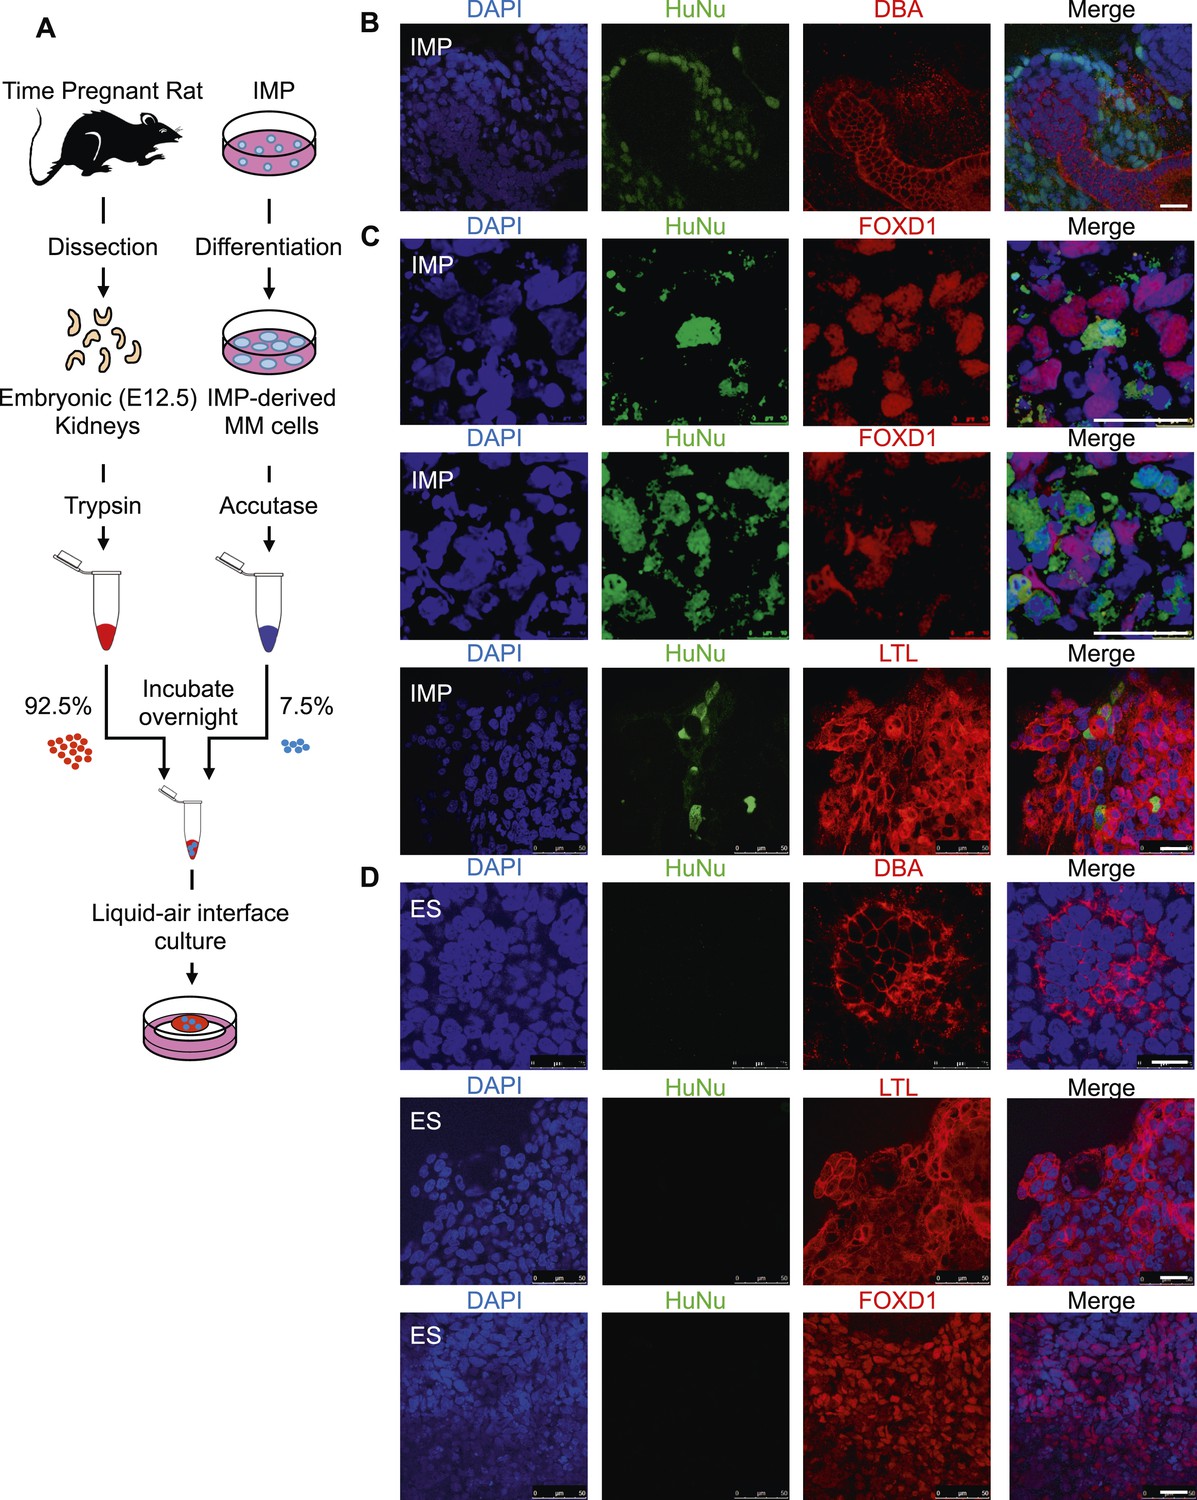
Incorporation of IMP cells into kidney mesenchyme.
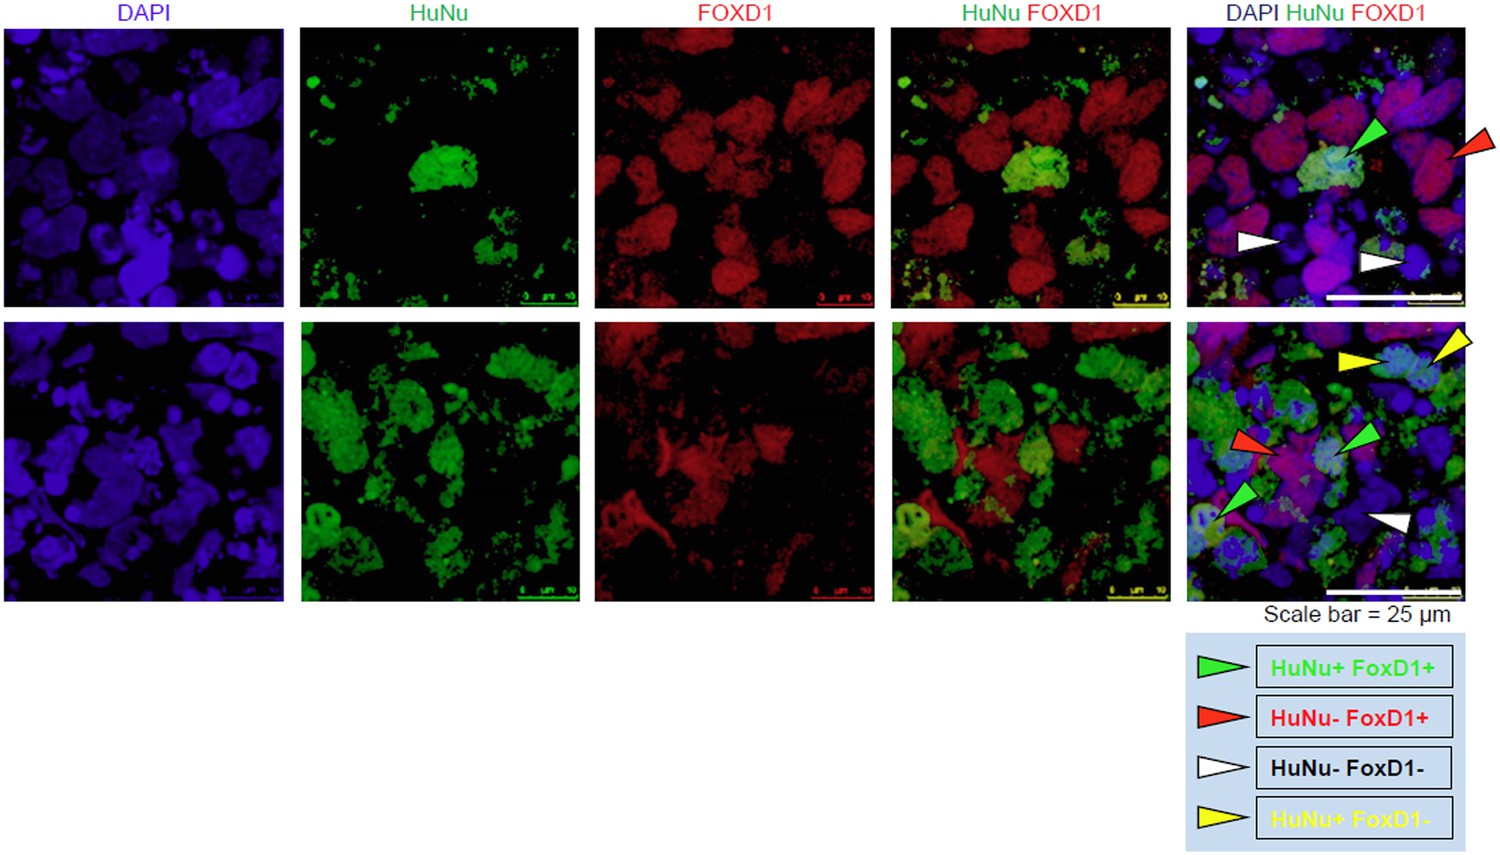
(A) Schematic of a re-aggregation assay to test renal potential. IMP cells were differentiated as depicted in Figure 7A and mixed with dissociated embryonic rat kidneys at a ratio of 7.5:92.5 and co-incubated for 4 days to form organoids in media-air interface co-culture. (B) Representative images of re-aggregated kidney organoids. IMP cells differentiated to MM are detected with the human specific nuclear antigen HuNu (green). Human cells are clearly integrated into renal organoids and surround epithelial structures labeled with the lectin Dolichos biflorus agglutinin (DBA) (red). Figure 9—figure supplement 1 provides additional images of MP cells incorporating into renal structures. Scale bar = 25 µm. (C) Representative images of re-aggregated kidney organoids. Renal organoids were labeled with DAPI (blue) to identify nuclei, HuNu (green) to identify human cells and with either FOXD1 antibody or LTL (red). Two representative sets of images are shown to indicate co-localization of FOXD1 in HuNu positive cells. Scale bar = 25 µm. (D) Undifferentiated hES cells failed to integrate into renal organoids. Instead of MP cells, undifferentiated ES cells were mixed with dissociated embryonic rat kidneys. These cells failed to integrate into the renal organoid structures as indicated by the lack of HuNu staining. Figure 9—figure supplement 2 demonstrates that undifferentiated ES cells fail to incorporate into these structures. Scale bar = 25 µm.
Figure 9—figure supplement 1

Additional assessment of renal potential of MP cells.
Representative images of re-aggregated kidney organoids. MP cells differentiated to MM are detected with the human specific nuclear antigen HuNu (green). Human cells are clearly integrated into renal organoids and surround epithelial structures labeled with the lectin DBA (red). Scale bar = 25 µm.
Figure 9—figure supplement 2
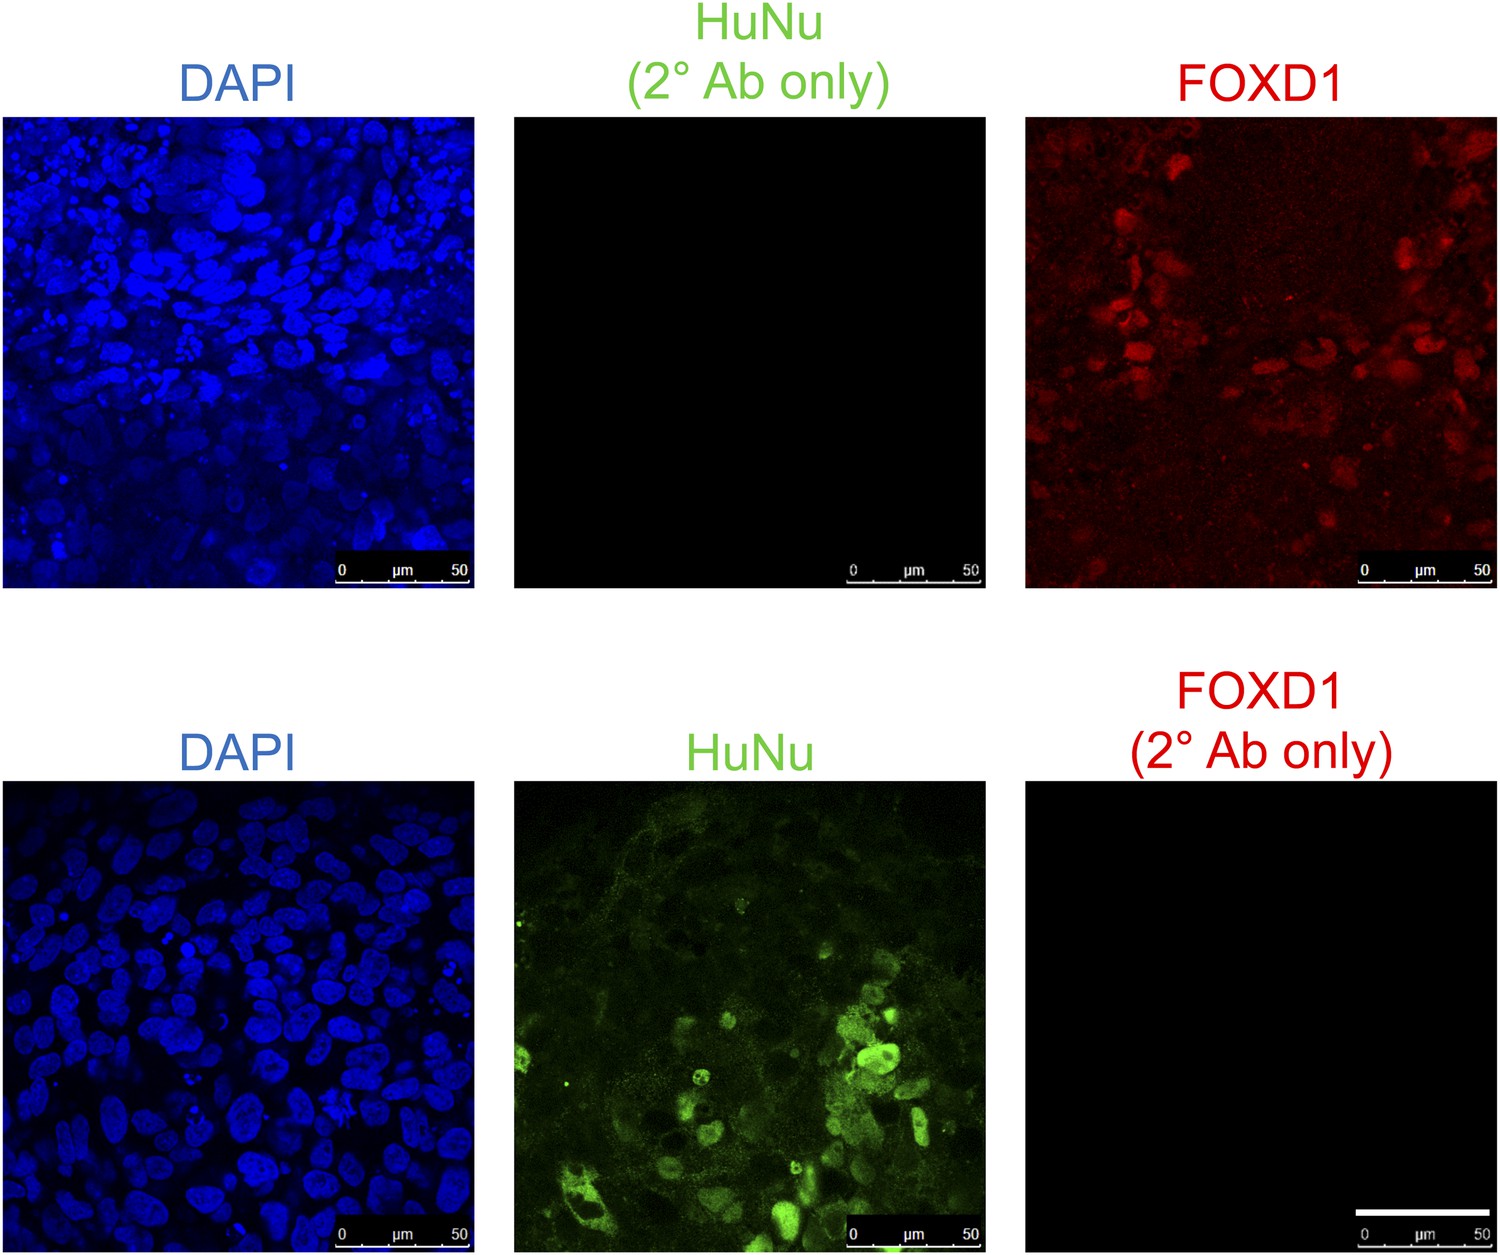
Staining controls relevant to Figure 9C.
Samples were fixed and stained as in Figure 9C, except anti-HuNu antibody was excluded (top row) or anti-FOXD1 antibody was excluded (bottom row). The same secondary antibodies were used to demonstrate that the HuNu and FOXD1 stains are dependent on primary antibodies and are not due to non-specific binding of secondary antibodies.
Figure 9—figure supplement 3

Additional assessment of renal potential of MP cells.
Undifferentiated hES cells failed to integrate into renal organoids. Unlike MP cells, undifferentiated ES cells failed to integrate into the renal orgaoind structures as indicated by the lack of HuNu staining. The last row of images demonstrates ES cells are present in the culture but are not incorporated into the renal aggregates. Scale bar = 25 µm.
Author response image 1
Additional files
-
Supplementary file 1
This table provides the complete list of genes with similar expression levels in MP cells and mesoderm (MP + ME, panel A), and of genes expressed only in MP cells (MP only, panel B).
- https://doi.org/10.7554/eLife.08413.026
-
Supplementary file 2
This file provides the complete RNA-seq data set of MP cells at passage 10. Column A provides gene names. Values in column B are RPKM.
- https://doi.org/10.7554/eLife.08413.027
Download links
A two-part list of links to download the article, or parts of the article, in various formats.
Downloads (link to download the article as PDF)
Open citations (links to open the citations from this article in various online reference manager services)
Cite this article (links to download the citations from this article in formats compatible with various reference manager tools)
Generation of an expandable intermediate mesoderm restricted progenitor cell line from human pluripotent stem cells
eLife 4:e08413.
https://doi.org/10.7554/eLife.08413


