Re-examining the role of Drosophila Sas-4 in centrosome assembly using two-colour-3D-SIM FRAP
- University of Cambridge, United Kingdom
- University of Oxford, United Kingdom
Figures
Figure 1
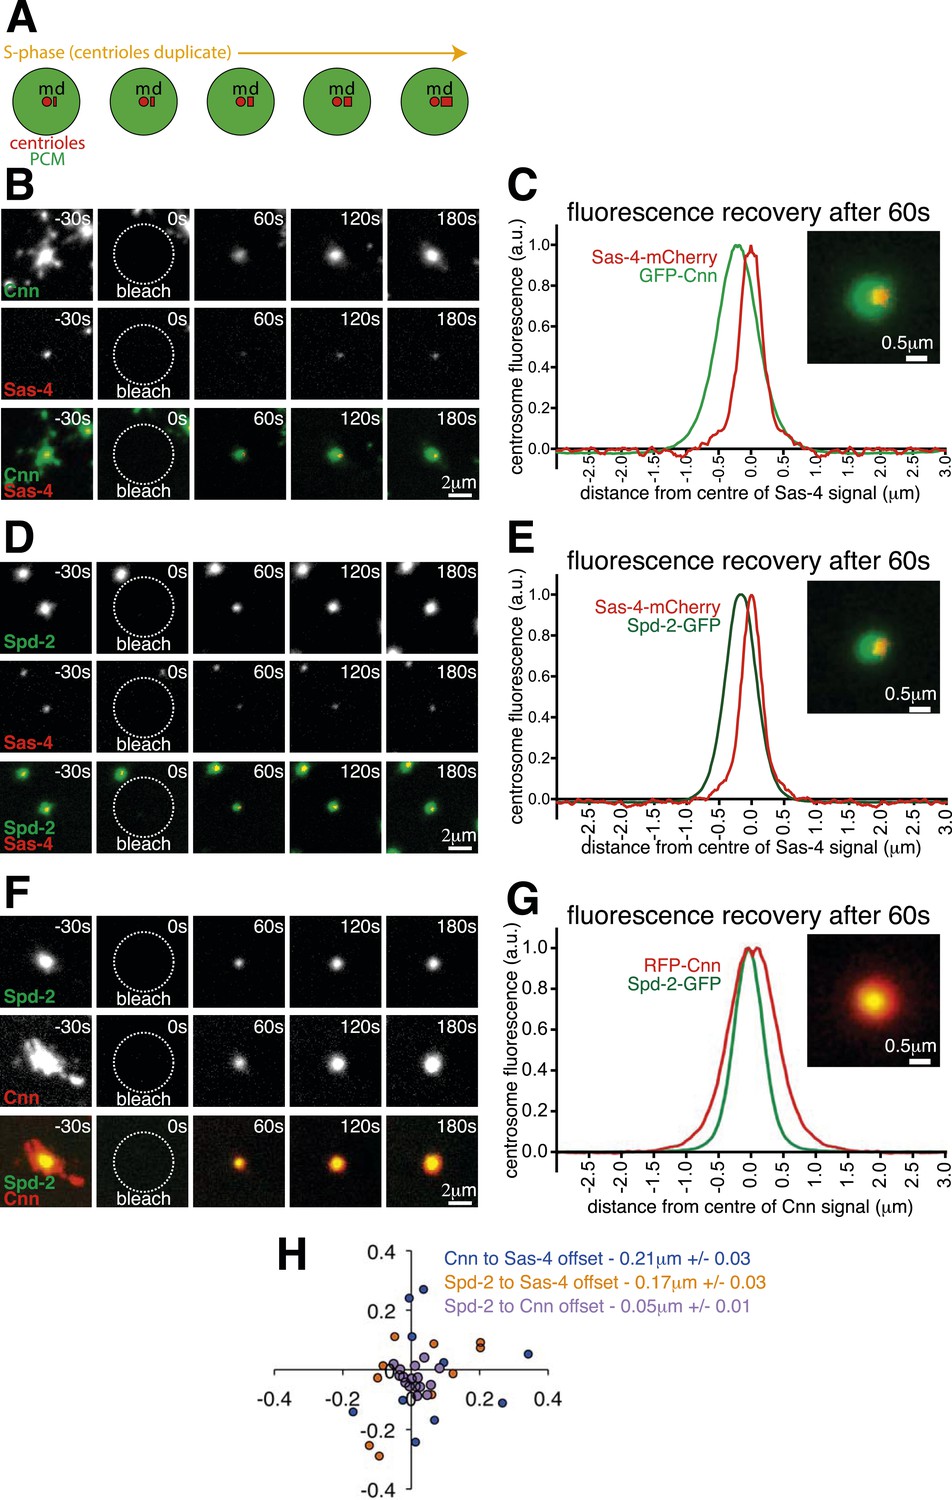
The centrosomal recruitment of Sas-4, Cnn and Spd-2 differ in space and time.
(A) A schematic illustration of the centrosomal events that occur during S-phase in Drosophila syncytial embryos. The mother centriole (‘m’) constantly organises pericentriolar material (PCM, green) and also templates the formation of a new daughter centriole (‘d’) that grows throughout S-phase. (B) Images show how GFP-Cnn (top row, green in bottom row) and Sas-4-mCherry (middle row, red in bottom row) fluorescence signals recover after photobleaching. Time in seconds before and after photobleaching (t = 0 s) is shown in the top right of each panel. (C) The graph shows the normalised average recovery profiles of GFP-Cnn (green) and Sas-4-mCherry (red) 60 s after bleaching (n = 10 centrosomes from 10 embryos). Each profile is normalised so its maximum signal equals one and plotted taking into account the average spatial offset between the two signals—∼0.21 μm—see (H). The inset image shows the average fluorescent signals of GFP-Cnn (green) and Sas-4-mCherry (red) overlaid taking into account their average spatial offset. (D–G) Images (D, F) and graphs (E, G) depict the same data as in (B) and (C) but for either Spd-2-GFP (green) and Sas-4-mCherry (red) (D, E) or for Spd-2-GFP (green) and RFP-Cnn (red) (F, G). (H) The graph shows the position of each GFP signal at 60 s post bleaching relative to the position of the mCherry/RFP signal (always positioned at 0; 0) for each combination of proteins, as indicated. Each dot represents a single centrosome.
-
Figure 1—source data 1
Measuring the spatial offset between recovering GFP-Cnn and Sas-4-mCherry, Spd-2-GFP and Sas-4-mCherry, and Spd-2-GFP and RFP-Cnn during S-phase.
(S1) This sheet includes the raw data used to calculate the offset between the centroids of the green and red fluorescent signals of sub-resolution beads. (S2) This sheet includes the raw data used to calculate the offset between the centroids of the GFP-Cnn and Sas-4-mCherry fluorescent signals shown in Figure 1H, and the raw data used to plot and offset the centrosomal profiles of GFP-Cnn and Sas-4-mCherry shown in Figure 1C. (S3) This sheet includes the raw data used to calculate the offset between the centroids of the Spd-2-GFP and Sas-4-mCherry fluorescent signals shown in Figure 1H, and the raw data used to plot and offset the centrosomal profiles of Spd-2-GFP and Sas-4-mCherry shown in Figure 1E. (S4) This sheet includes the raw data used to calculate the offset between the centroids of the Spd-2-GFP and RFP-Cnn fluorescent signals shown in Figure 1H, and the raw data used to plot and offset the centrosomal profiles of Spd-2-GFP and RFP-Cnn shown in Figure 1G. (S5) This sheet collates the offset data calculated in S2, S3 and S4 in order to plot the graph seen in Figure 1H.
- https://doi.org/10.7554/eLife.08483.003
Figure 2

Cnn and Spd-2, but not Sas-4, are recruited to centrosomes during M-phase.
(A) A schematic illustration of the centrosomal events that occur during M-phase (purple arrow) and the following S-phase (orange arrow) in Drosophila syncytial embryos. The mother centriole (‘m’) organises the PCM (green) and remains ‘engaged’ to its fully formed daughter centriole (‘d’) until late M-phase. During late M-phase the centrioles disengage and the daughter centriole matures into a mother and starts to organise its own domain of PCM. At the start of the following S-phase, both the old and new mother centrioles template the formation of a new daughter centriole. (B, C) Images show how GFP-Cnn (top row in B, green in bottom row), Spd-2-GFP (top row in C, green in bottom row) and Sas-4-mCherry (middle rows in B and C, red in bottom rows) fluorescence signals recover after photobleaching during M-phase and the following S-phase. Time in seconds before and after photobleaching (t = 0 s) is shown in the top right of each panel. Note how the GFP-Cnn (B) and Spd-2-GFP (C) signals recover immediately after photobleaching, but that a recovering Sas-4-mCherry signal can only be detected once the embryos enter the following S-phase (and initiate a new round of centriole duplication). (D) A graph showing the fluorescence recovery over time of Sas-4-mCherry (red), GFP-Cnn (light green) and Spd-2-GFP (dark green) relative to their initial fluorescence values. Measurements were taken in the region of the centrosome where the fluorescent signals overlapped. The arrow indicates the sudden change in the recovery dynamics of the Sas-4-mCherry signal.
-
Figure 2—source data 1
A comparison of the centrosomal fluorescence recovery after photobleaching of GFP-Cnn, Spd-2-GFP and Sas-4-mCherry during M-phase and the following S-phase.
(S1) This sheet includes the raw data used to calculate the fluorescence recovery of GFP-Cnn and Sas-4-mCherry during M-phase and the following S-phase. (S2) This sheet includes the raw data used to calculate the fluorescence recovery of Spd-2-GFP and Sas-4-mCherry during M-phase and the following S-phase. (S3) This sheet combines the Sas-4-mCherry recovery data from S1 and S2. (S4) This sheet collates the data from S1, S2 and S3 in order to plot the final recovery graph seen in Figure 2D.
- https://doi.org/10.7554/eLife.08483.007
Figure 3
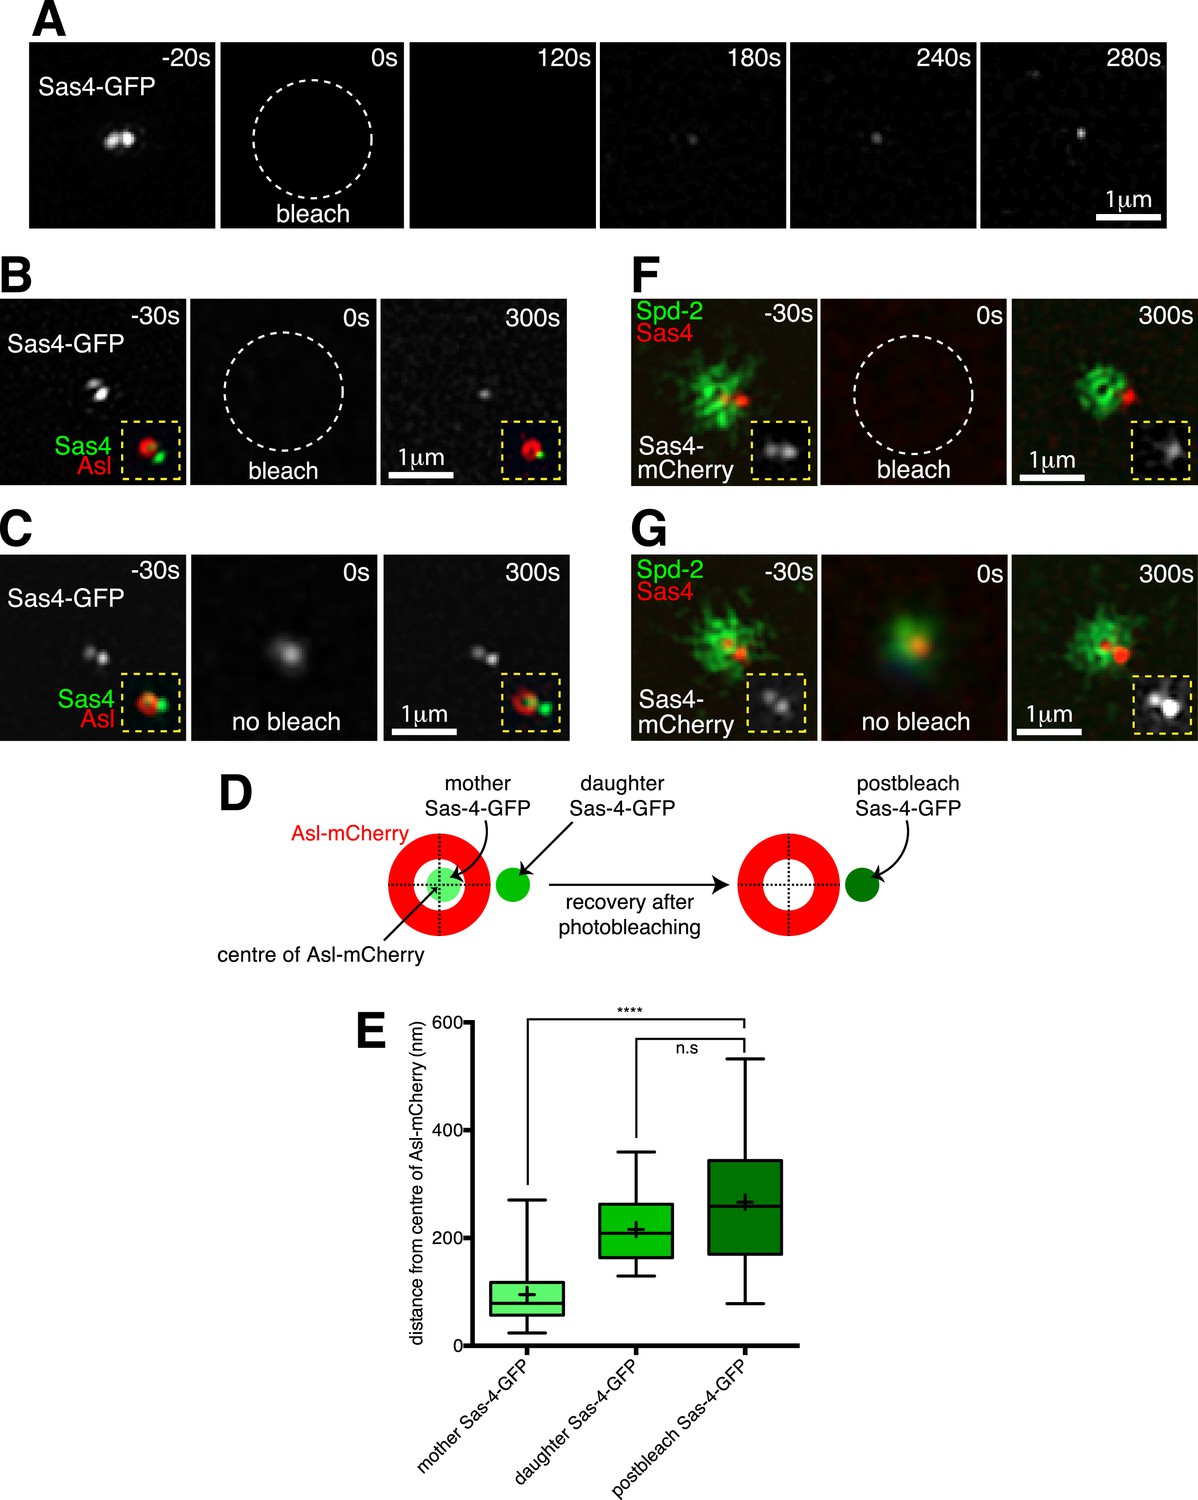
Two-colour-3D-SIM FRAP reveals that Sas-4-mCherry is recruited only to growing daughter centrioles, while PCM proteins are recruited only around mother centrioles.
(A) 3D-SIM images show how during S-phase two adjacent Sas-4-GFP foci can be resolved at an individual centrosome (t = −20 s), and how the Sas-4-GFP fluorescence signal recovers only as a single foci after photobleaching (t = 120 s to t = 280 s). Time in seconds before and after photobleaching (t = 0 s) is shown in the top right of each panel. (B) Two-colour 3D-SIM images show how Sas-4-GFP fluorescence recovers relative to Asl-mCherry fluorescence (which surrounds the mother centriole). The Sas-4-GFP is shown in greyscale; insets (yellow dashed lines) display the overlay of Sas-4-GFP (green) and Asl-mCherry (red). Note how after photobleaching the Sas-4-GFP fluorescence recovers outside of the Asl-mCherry toroid. (C) Complementary images of a control centrosome adjacent to the one shown in (B) where the Sas-4-GFP signal was not photobleached. The t = 0 s panel is a widefield image (see ‘Materials and methods’). (D, E) Schematic (D) and box-plot (E) show how the average position of the post-bleached Sas-4-GFP signal is similar to the position of the daughter, but not the mother, centriole's prebleached Sas-4-GFP signal, relative to the Asl-mCherry signal. Boxes in E extend from the 25th-75th percentiles, whiskers extend from min to max values, lines in boxes are the median values, ‘+’ in boxes are the mean values; n = 25 centrosomes from 4 embryos. **** indicates where p < 0.0001; n.s. indicates where p = 0.09, and is therefore not significant. (F) 3D-SIM images show how Sas-4-mCherry (red) recovers relative to recovering Spd-2-GFP (green). An overlay of Sas-4-mCherry and Spd-2-GFP fluorescence is shown in the main panels; insets (yellow dashed lines) display the Sas-4-mCherry signal (greyscale). Note how after photobleaching the Sas-4-mCherry recovers outside of the hollow created by the recovering Spd-2-GFP (t = 300 s). (G) Complementary images of a control centrosome adjacent to the one in (F) where the Sas-4-mCherry and Spd-2-GFP signals were not photobleached. The t = 0 s image is a widefield image, as in (C).
-
Figure 3—source data 1
Measuring the spatial offset between recovering Sas-4-GFP and Asl-mCherry at super resolution.
This flie includes the raw data used to calculate the offset between the centroids of the two Sas-4-GFP foci and the single Asl-mCherry foci prior to photobleaching and the offset between the centroids of the single Sas-4-GFP foci and the single Asl-mCherry foci 5 min post-photobleaching. The data is used to plot the graph shown in Figure 3E.
- https://doi.org/10.7554/eLife.08483.011
Figure 4
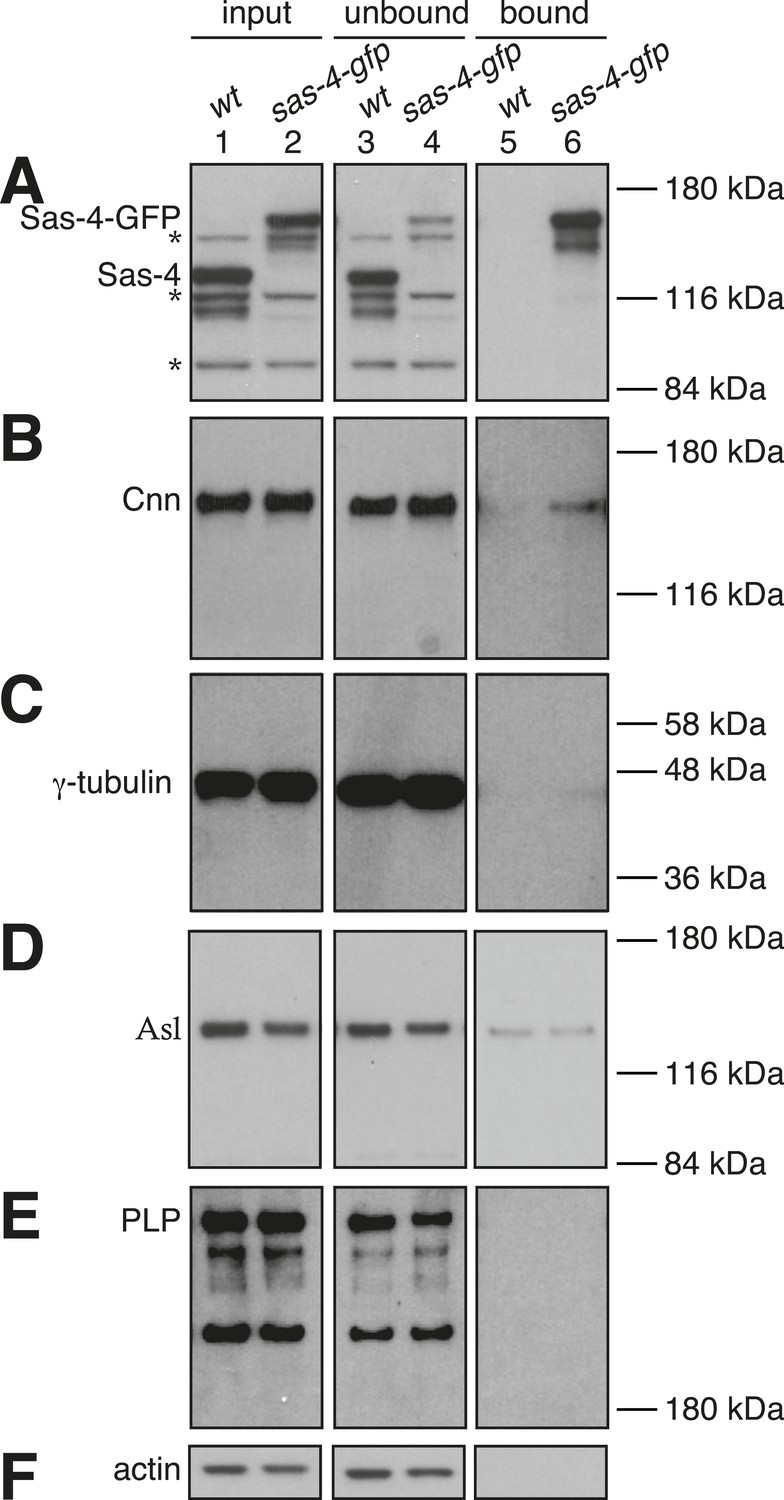
Potential S-CAP complexes are of low abundance in Drosophila syncytial embryo extracts.
Panels show western blots of anti-GFP immunoprecipitation experiments from WT embryos (lanes 1, 3, 5) or embryos expressing Sas-4-GFP in the absence of endogenous Sas-4 (lanes 2, 3, 6). The membranes were probed for Sas-4 (A), Cnn (B), γ-tubulin (C), Asl (D), pericentrin-like-protein (PLP) (E) or Actin (as a loading control) (F). Lanes 1 and 2 are taken from the initial embryo extracts (‘input’); lanes 3 and 4 are ‘unbound’ samples taken from the extracts after the beads had been removed; lanes 5 and 6 are ‘bound’ samples taken from the beads after incubation with extract. The * symbols in (A) highlight non-specific bands. Note that the signal intensities can only be directly compared between the ‘input’ and ‘unbound’ lanes (see ‘Materials and methods’).
Author response image 1
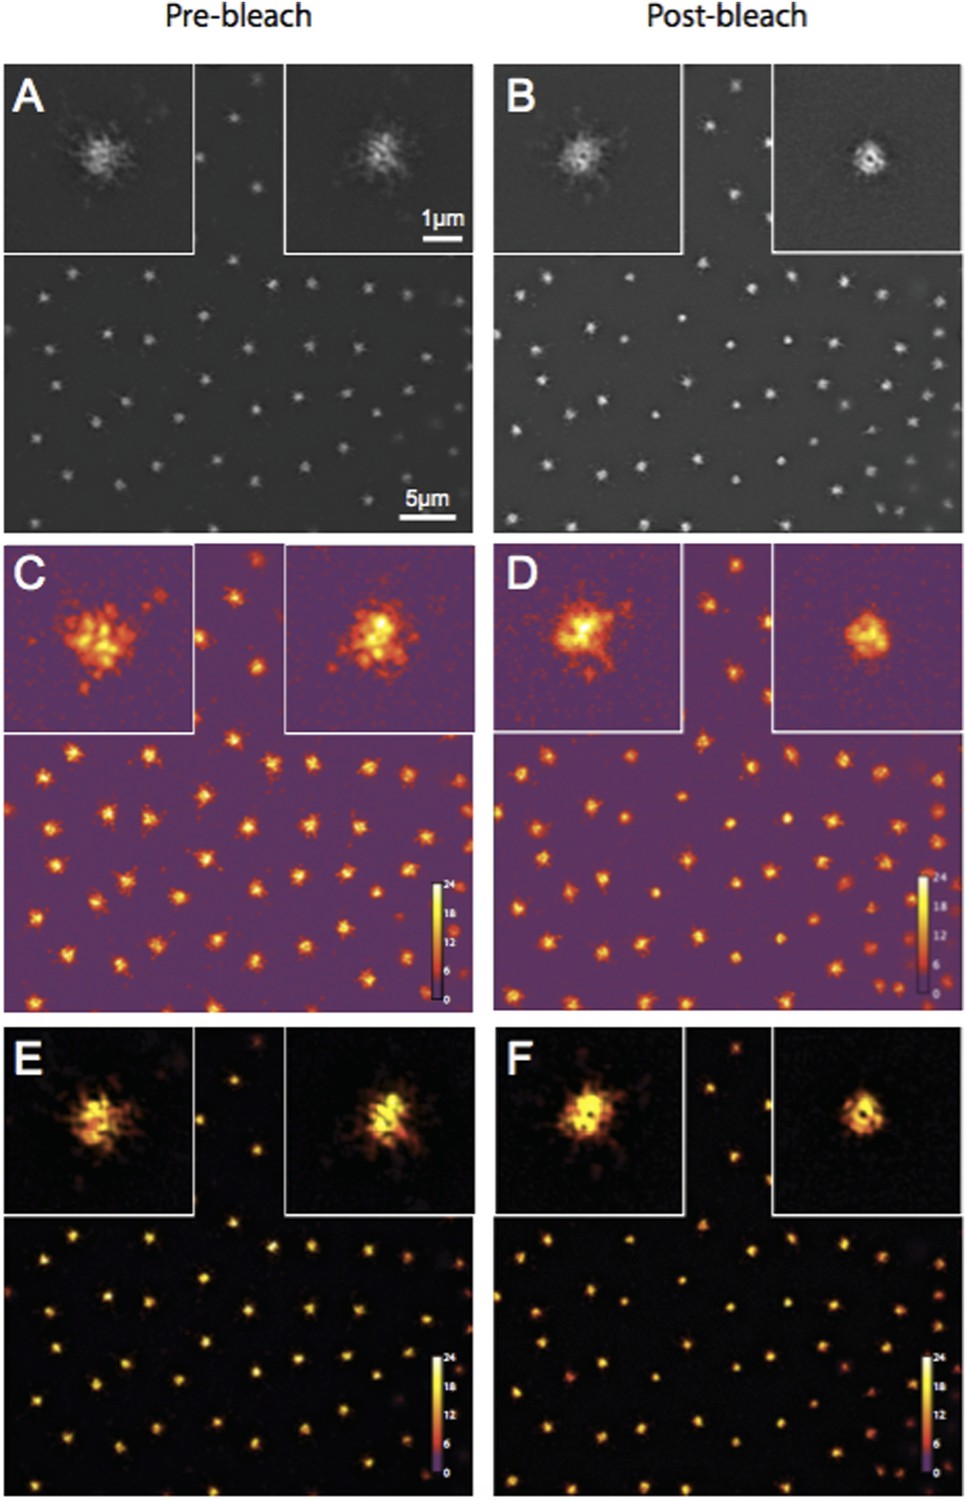
Quality control of Spd-2-GFP 3D-SIM images using SIM-Check.
(A, B) Reconstructed images of centrosomes prior to photobleaching (A) and 5 min post photobleaching (B) in an embryo expressing Spd-2-GFP. Left and right insets in each image show a control (unbleached) and the experimental (photobleached) centrosome, respectively. (C, D) Modulation contrast-to-noise ratio (MCNR) images of the raw data used to produce the images and insets in (A) and (B). The Color LUT indicates varying MCNR values, with anything above 3 (purple) being acceptable. The Average feature (centrosomal) MCNR in the prebleached (C) and postbleached (D) images is ∼12 and ∼11, respectively. (E, F) Images of the reconstructed data shown in (A) and (B) colour coded according to the underlying MCNR of the raw data shown in (C) and (D).
Videos
Video 1
Recovery dynamics of GFP-Cnn and Sas-4-mCherry during S-phase.
This video shows the fluorescent signals of GFP-Cnn (left panel) and Sas-4-mCherry (right panel) recovering during S-phase after photobleaching at t = 0 s. Both signals are detectable 30 s after photobleaching and continue to increase in intensity thereafter. The GFP-Cnn signal initially recovers centrally and then spreads outwards, as described previously (Conduit et al., 2010, 2014a, 2014b), whereas the Sas-4-mCherry signal recovers as a single tight focus and does not spread outwards.
Video 2
Recovery dynamics of Spd-2GFP and Sas-4-mCherry during S-phase.
This video shows the fluorescent signals of Spd-2-GFP (left panel) and Sas-4-mCherry (right panel) recovering during S-phase after photobleaching at t = 0 s. Both signals are detectable 30 s after photobleaching and continue to increase in intensity thereafter. The Spd-2-GFP signal initially recovers centrally and then spreads outwards, as described previously (Conduit et al., 2014b), whereas the Sas-4-mCherry signal recovers as a single tight focus and does not spread outwards.
Video 3
Recovery dynamics of GFP-Cnn and Sas-4-mCherry during M-phase/S-phase.
This video shows the fluorescent signals of GFP-Cnn (left panel) and Sas-4-mCherry (right panel) recovering during M-phase and then during the following S-phase; the centrosome was bleached at t = 0 s in M-phase. The GFP-Cnn signal is detectable 30 s after photobleaching and continues to increase during M-phase and the following S-phase, when the centrosome divides into two. The Sas-4-mCherry signal, however, only becomes detectable 270 s after photobleaching, once the embryo has transitioned from M-phase into the following S-phase.
Video 4
Recovery dynamics of Spd-2-GFP and Sas-4-mCherry during M-phase/S-phase.
This video shows the fluorescent signals of Spd-2-GFP (left panel) and Sas-4-mCherry (right panel) recovering during M-phase and then during the following S-phase; the centrosome was bleached at t = 0 s in M-phase. The Spd-2-GFP signal is detectable 30 s after photobleaching and continues to increase during M-phase and the following S-phase, when the centrosome divides into two. The Sas-4-mCherry signal, however, only becomes detectable 330 s after photobleaching, once the embryo has transitioned from M-phase into the following S-phase.
Download links
A two-part list of links to download the article, or parts of the article, in various formats.
Downloads (link to download the article as PDF)
Open citations (links to open the citations from this article in various online reference manager services)
Cite this article (links to download the citations from this article in formats compatible with various reference manager tools)
Re-examining the role of Drosophila Sas-4 in centrosome assembly using two-colour-3D-SIM FRAP
eLife 4:e08483.
https://doi.org/10.7554/eLife.08483


