Salt-inducible kinases mediate nutrient-sensing to link dietary sugar and tumorigenesis in Drosophila
- Imperial College London, United Kingdom
- Japan Science and Technology Agency, Japan
- Icahn School of Medicine at Mount Sinai, United States
Figures
Figure 1 with 2 supplements

Yorkie Activity is Required for Increased Wg Expression in Diet-enhanced Ras/Src-tumors.
(A–G) Developmental stage matched third instar larvae with the genotype, (A, B) ras1G12V;csk−/−, (C) ras1G12V;csk−/−,wgRNAi, (D) ras1G12V;csk−/−,wts, (E) inrCA,ras1G12V;csk−/−, (F) inrCA,ras1G12V;csk−/−,wgRNAi, and (G) inrCA,ras1G12V;csk−/−,wts, raised on indicated diets. Images were taken at the same magnification. Scale bar, 500 μm. (A′–G′) Matching dissected eye epithelial tissue stained with DAPI (red). Images were taken at the same magnification. Scale bar, 500 μm. (H) Percent pupariation of animals from indicated genotypes and diets. Column bars represent the mean of three independent experiments. Error bars denote s.e.m. Total n was 166, 431, 309, 291, 204, 200, and 251 from left to right. Asterisks indicate statistically significant difference (*p < 0.01 t-test). Numerical data are available in Figure 1—source data 1. (I–L) Wg staining (red) of eye tissue from (I) ras1G12V;csk−/−, (J) ras1G12V;csk−/−,wts, (K) inrCA,ras1G12V;csk−/−, and (L) inrCA,ras1G12V;csk−/−,wts animals raised on indicated diets. Scale bars, 50 μm.
-
Figure 1—source data 1
Percent pupariation of animals from indicated genotypes and diets.
- https://doi.org/10.7554/eLife.08501.004
Figure 1—figure supplement 1
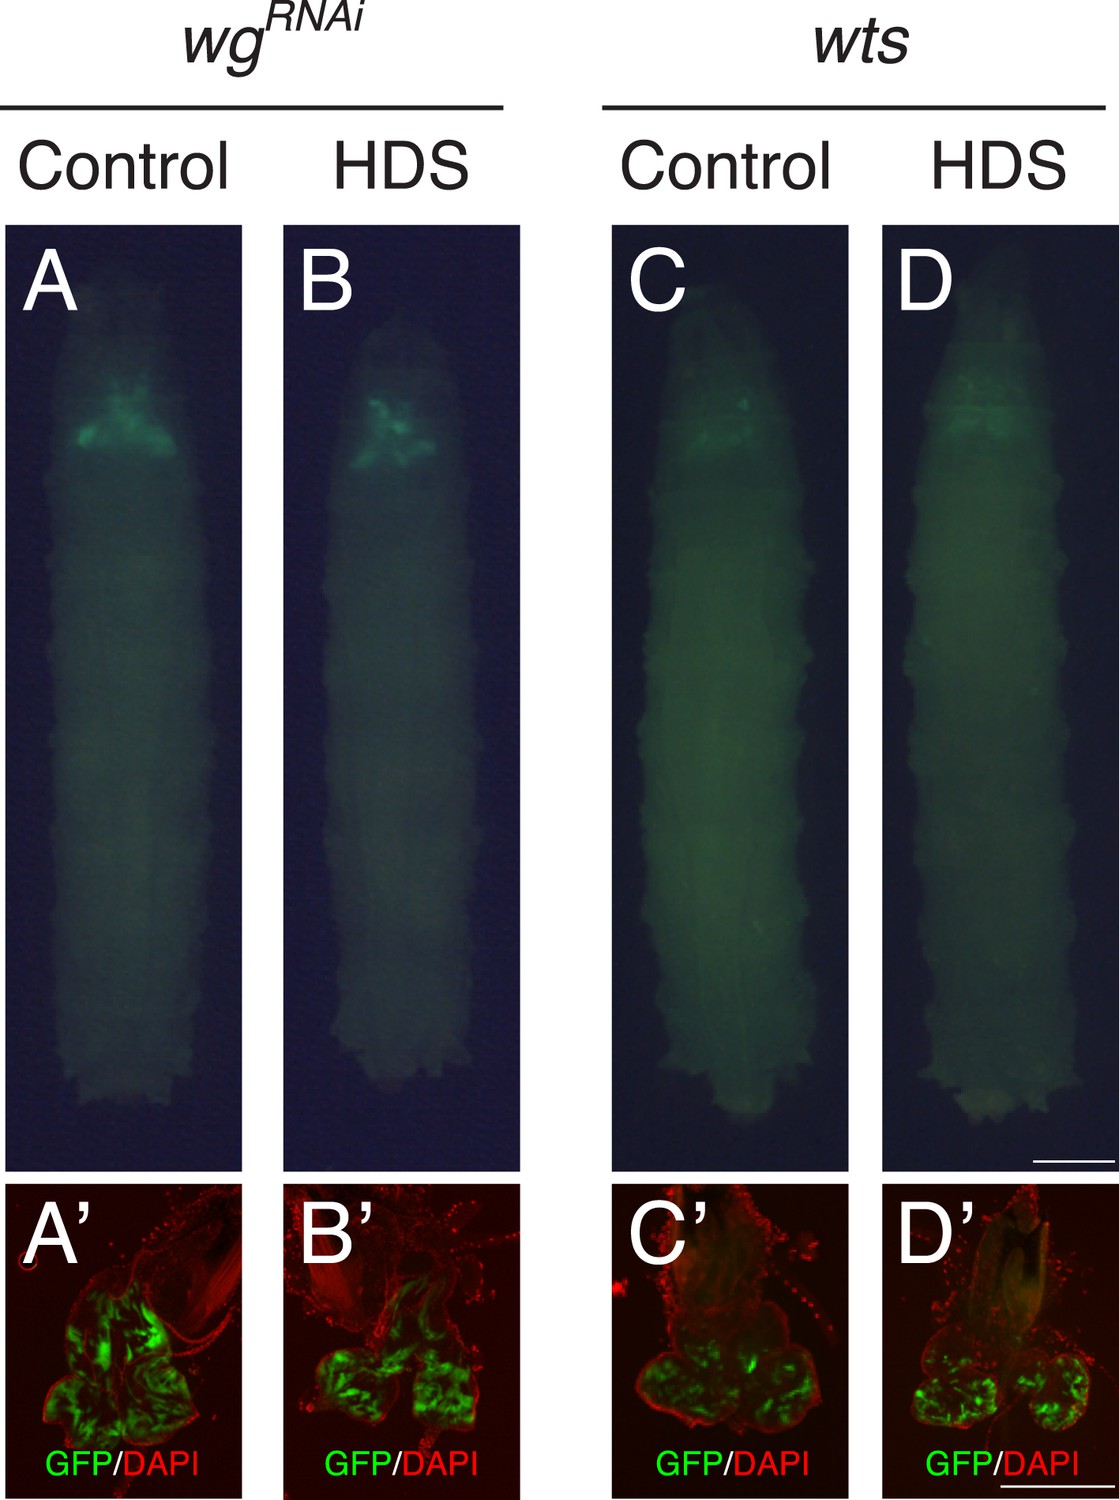
Effect of reducing Wg or over-expressing Wts in the eye tissue.
(A, B) Reducing Wg by RNAi (wgRNAi) did not affect normal eye tissue growth of the late third instar larvae. Developmental stage matched wgRNAi third instar larvae raised on (A) control diet, and (B) HDS. (C, D) Over-expression of Warts kinase led to small clones. Developmental stage matched wts third instar larvae raised on (C) control diet, and (D) HDS. Images were taken at the same magnification. Scale bar, 500 μm. (A′–D′) Matching dissected eye epithelial tissue stained with DAPI (red). Images were taken at the same magnification. Scale bar, 500 μm.
Figure 1—figure supplement 2
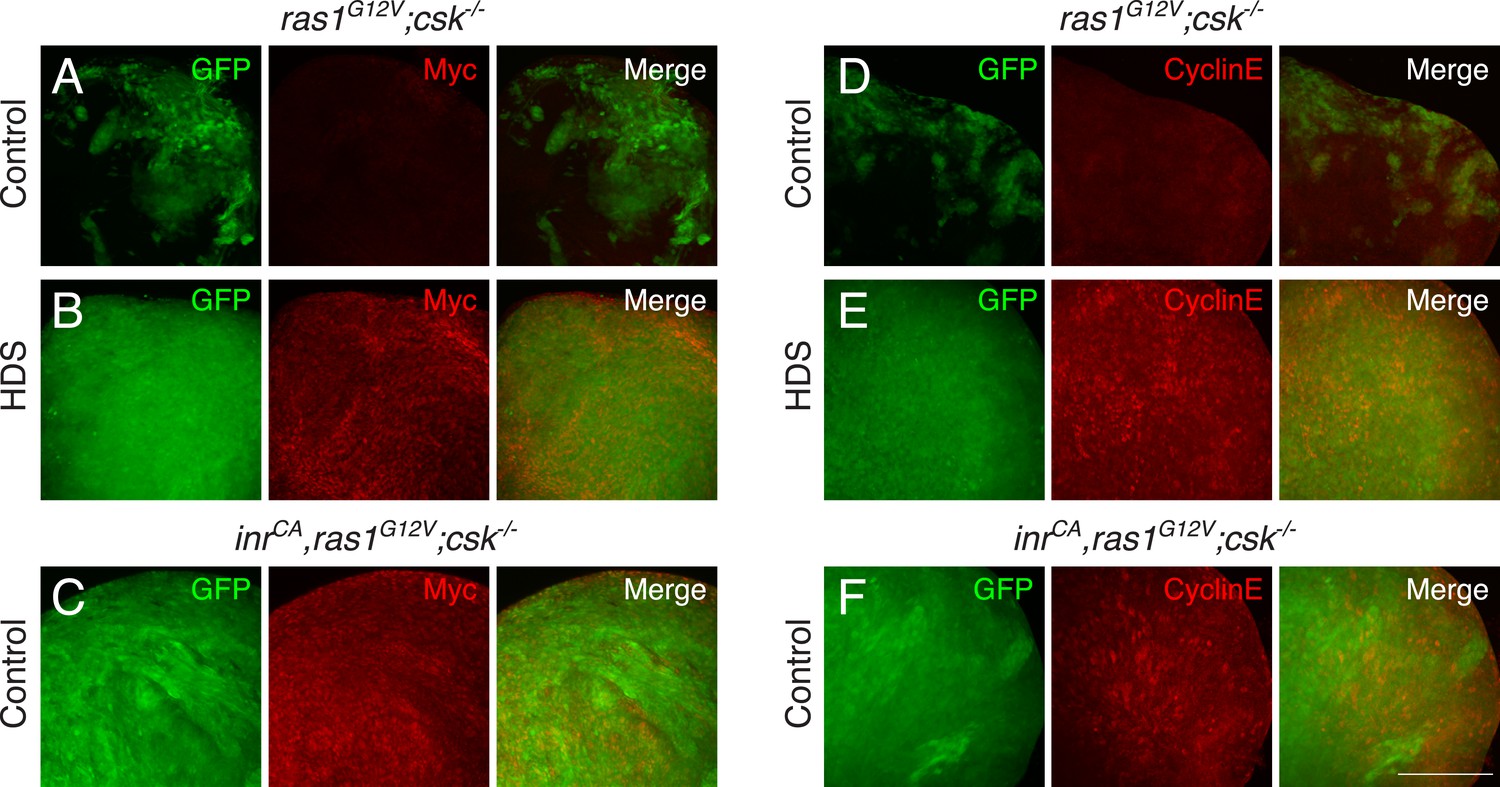
Yorkie target genes are upregulated in diet-enhanced Ras/Src-tumors.
(A–C) Myc staining (red) of (A) ras1G12V;csk−/− in control diet, (B) ras1G12V;csk−/− in HDS, and (C) inrCA,ras1G12V;csk−/− in control diet. (D–F) Cyclin E staining (red) of (D) ras1G12V;csk−/− in control diet, (E) ras1G12V;csk−/− in HDS, and (F) inrCA,ras1G12V;csk−/− in control diet. Images were taken at the same magnification. Scale bar, 50 μm.
Figure 2
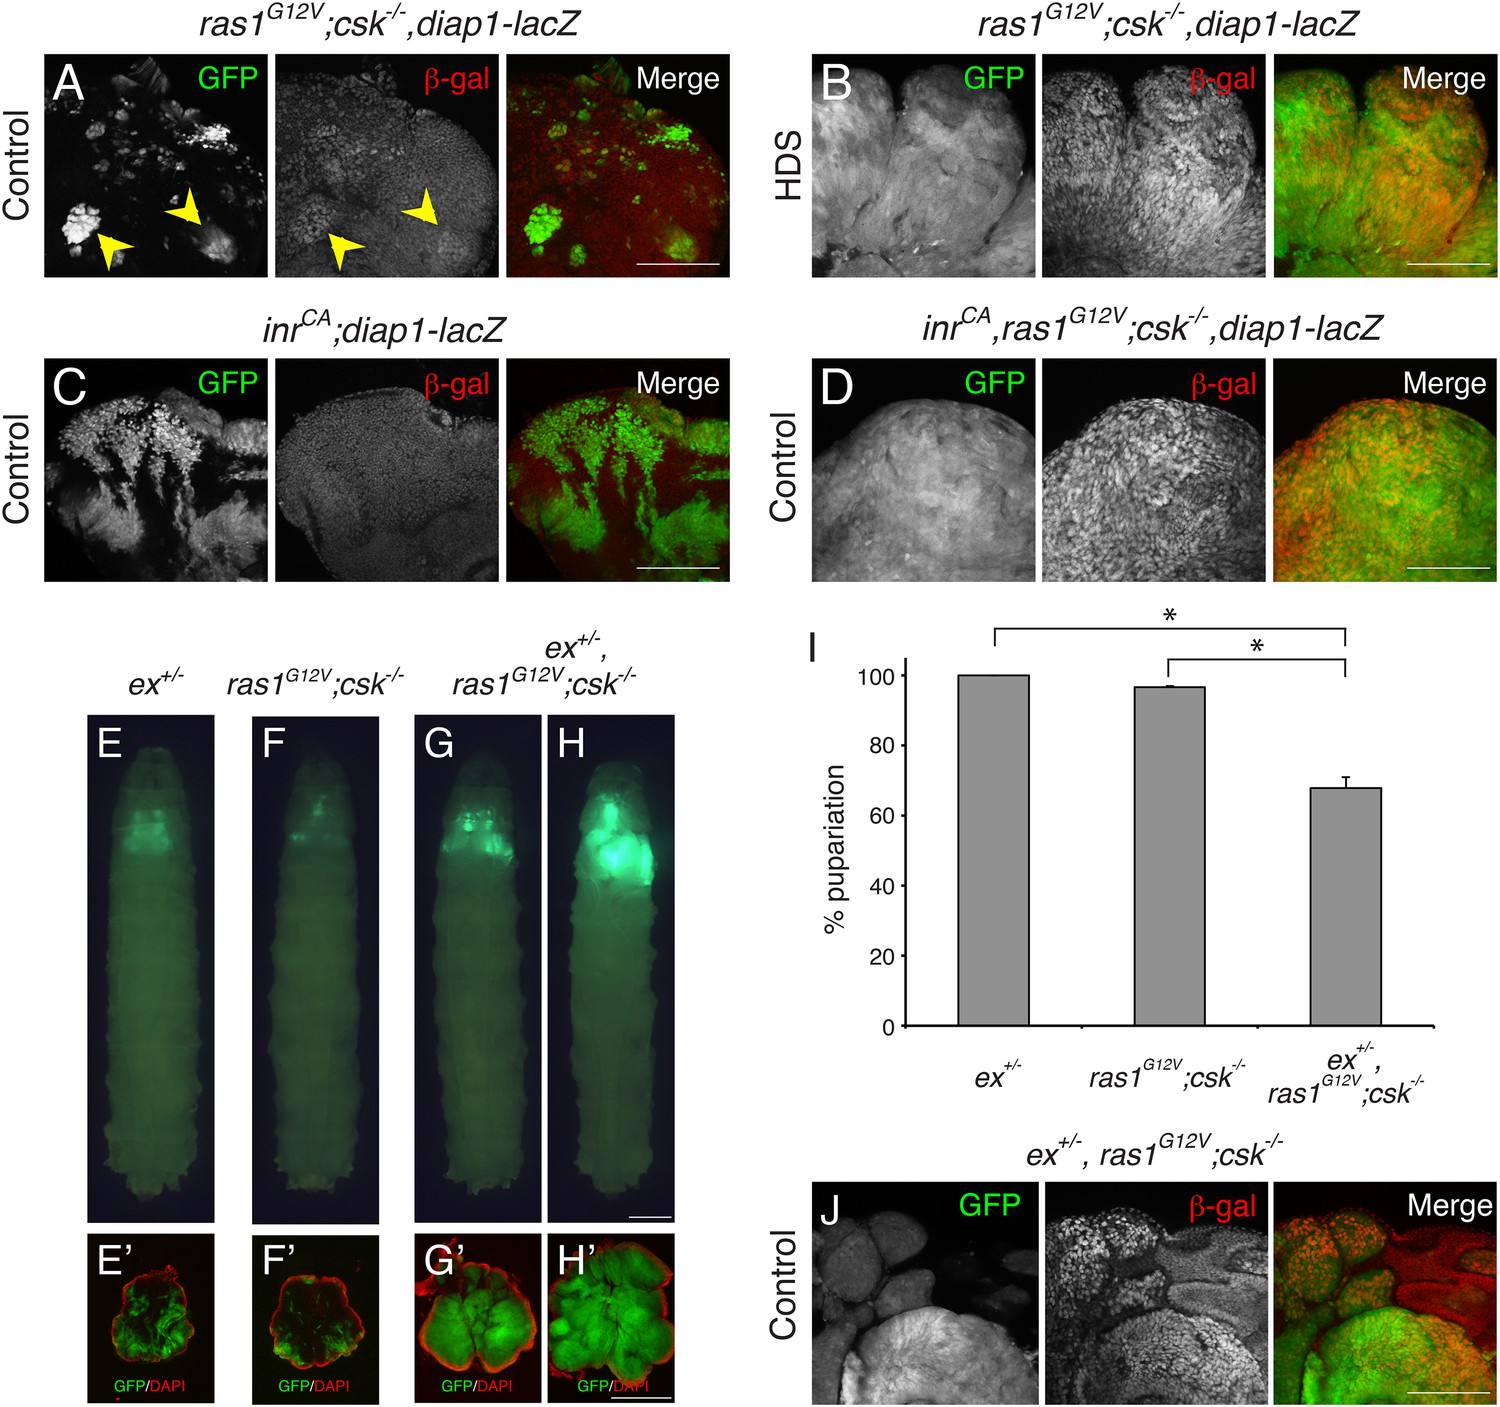
Ras/Src-activated Cells are Sensitive to Perturbations in the Hippo Signaling.
(A–D) β-galactosidase (β-gal) staining (red) of eye tissue from (A, B) ras1G12V;csk−/−,diap1-lacZ, (C) inrCA;diap1-lacZ, (D) inrCA,ras1G12V;csk−/−,diap1-lacZ animals raised on indicated diets. Scale bars, 50 μm. (E–H) Developmental stage matched third instar larvae raised on control diet with the genotype, (E) ex+/−, (F) ras1G12V;csk−/−, (G, H) ex+/−,ras1G12V;csk−/−. Images were taken at the same magnification. Scale bar, 500 μm. (E′–H′) Matching dissected eye epithelial tissue stained with DAPI (red). Images were taken at the same magnification. Scale bar, 500 μm. (I) Percent pupariation of animals from indicated genotypes. Column bars represent the mean of three independent experiments. Error bars denote s.e.m. Total n of 389, 238, and 206 from left to right. Asterisks indicate statistically significant difference (*p < 0.01 t-test). Numerical data are available in Figure 2—source data 1 (J) β-galactosidase (β-gal) staining (red) of ex+/−, ras1G12V;csk−/− animals raised on control diet. Scale bar, 50 μm.
-
Figure 2—source data 1
Percent pupariation of animals from indicated genotypes.
- https://doi.org/10.7554/eLife.08501.008
Figure 3 with 2 supplements

Salt-inducible Kinases are Required for Diet-enhanced Ras/Src-tumorigenesis.
(A) Extracts from dissected eye tissues of third instar larvae were examined by immunoblotting using antibodies against phospho-Sav (p-Sav; * indicates p-Sav specific band; the upper band is a non-specific band showed as an internal loading control), phospho-Yki (p-Yki), total Yki (Yki), and Syntaxin (Syt). (B, C) Developmental stage matched third instar larvae raised on HDS with the genotype, (B) ras1G12V;csk−/−, and (C) sik2/3RNAi,ras1G12V;csk−/−. (D, E) Developmental stage matched third instar larvae raised on control diet with the genotype, (D) ras1G12V;csk−/−, and (E) sik2/3RNAi,ras1G12V;csk−/−. Images were taken at the same magnification. Scale bar, 500 μm. (F, G) ras1G12V;csk−/− animals raised on HDS containing (F) 0.05% DMSO, or (G) 25 μΜ HG-9-91-01. (H, I) inrCA,ras1G12V;csk−/− animals raised on control diet containing (H) 0.05% DMSO, or (I) 25 μΜ HG-9-91-01. Images were taken at the same magnification. Scale bar, 500 μm. (B′–I′) Matching dissected eye epithelial tissue stained with DAPI (red). Images were taken at the same magnification. Scale bar, 500 μm. (J) Percent pupariation of DMSO or HG-9-91-01 treated animals from indicated genotypes and diets. Column bars represent the mean of three independent experiments. Error bars denote s.e.m. Total n of 139, 76, 123, and 72 from left to right. Asterisks indicate statistically significant difference (*p < 0.01 t-test). Numerical data are available in Figure 3—source data 1.
-
Figure 3—source data 1
Percent pupariation of animals from indicated genotypes and diets.
- https://doi.org/10.7554/eLife.08501.010
Figure 3—figure supplement 1
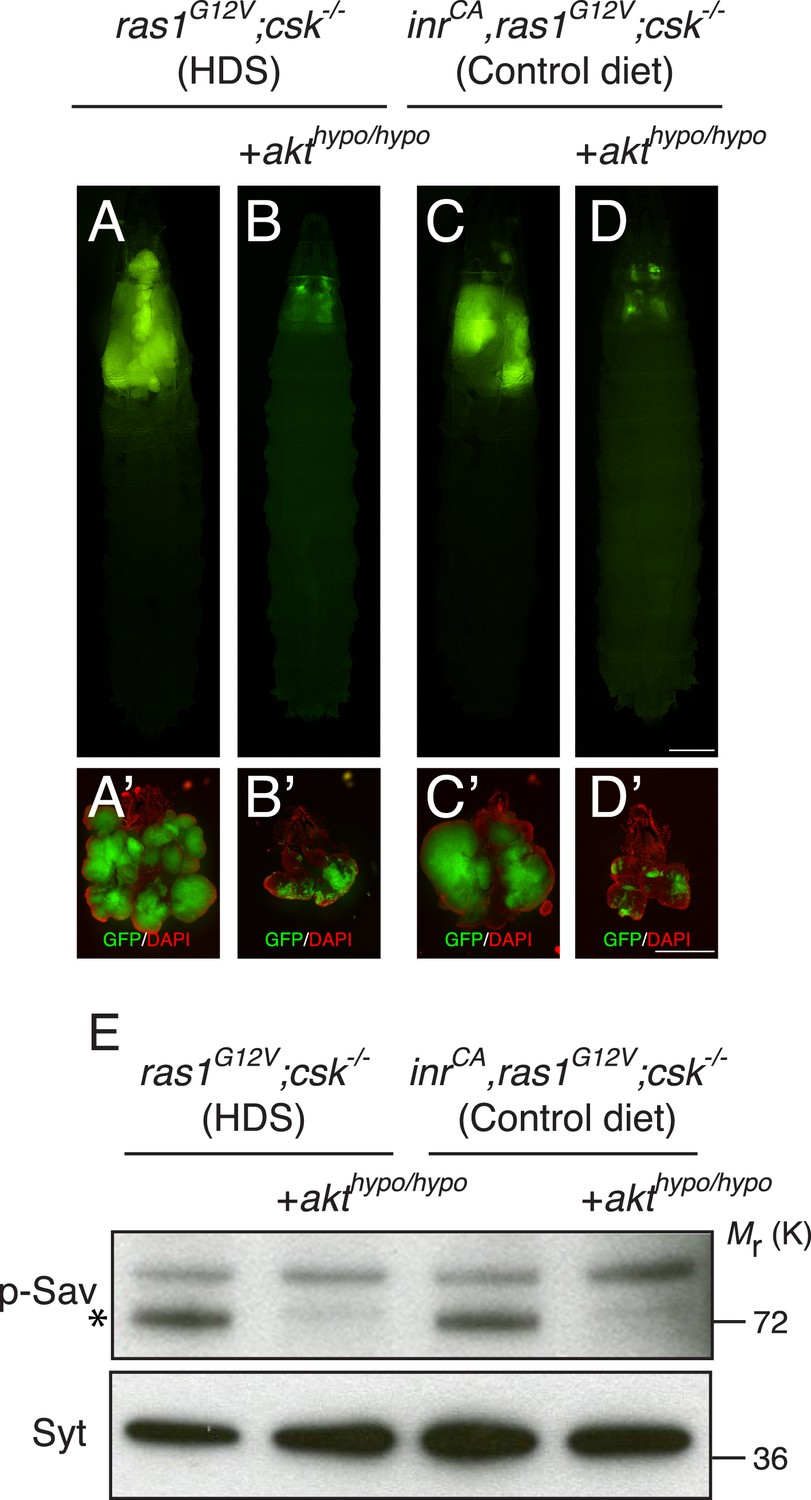
Akt mediates activation of SIKs in Ras/Src-tumors.
(A, B) Developmental stage matched third instar larvae raised on HDS with the genotype, (A) ras1G12V;csk−/−, and (B) ras1G12V;csk−/−,akthypo/hypo. (C, D) Developmental stage matched third instar larvae raised on control diet with the genotype, (C) inrCA,ras1G12V;csk−/−, and (D) inrCA,ras1G12V;csk−/−,akthypo/hypo. Images were taken at the same magnification. Scale bar, 500 μm. (A′–D′) Matching dissected eye epithelial tissue stained with DAPI (red). Images were taken at the same magnification. Scale bar, 500 μm. (E) Extracts from dissected eye tissues of third instar larvae were examined by immunoblotting using antibodies against phospho-Sav (p-Sav; * indicates p-Sav specific band; the upper band is a non-specific band showed as an internal loading control) and Syntaxin (Syt).
Figure 3—figure supplement 2
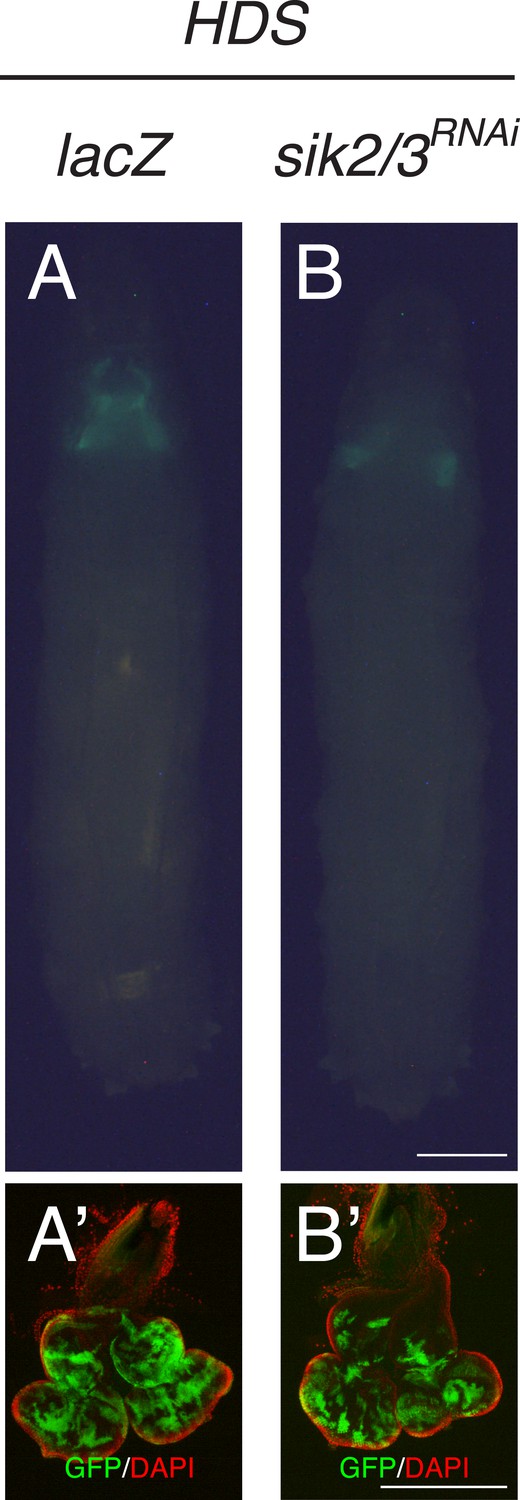
Reducing SIK2/3 by RNAi did not affect normal eye tissue growth.
(A, B) Developmental stage matched third instar larvae raised on HDS with genotypes, (A) lacZ, and (B) sik2/3RNAi. Images were taken at the same magnification. Scale bar, 500 μm. (A′, B′) Matching dissected eye epithelial tissue stained with DAPI (red). Images were taken at the same magnification. Scale bar, 500 μm.
Figure 4

Activation of Salt-inducible Kinase Promotes Ras/Src-tumor Growth.
(A, B) Developmental stage matched third instar larvae raised on control diet with the genotype, (A) ras1G12V;csk−/−, and (B) ras1G12V;csk−/−,sik2CA. Images were taken at the same magnification. Scale bar, 500 μm. (A′, B′) Matching dissected eye epithelial tissue stained with DAPI (red). Images were taken at the same magnification. Scale bar, 500 μm. (C) Extracts from dissected eye tissues of ras1G12V;csk−/− and ras1G12V;csk−/−,sik2CA animals fed a control diet were examined by immunoblotting using antibodies against phospho-Sav (p-Sav; * indicates p-Sav specific band; the upper band is a non-specific band showed as an internal loading control), phospho-Yki (p-Yki), total Yki (Yki), and Syntaxin (Syt). (D, E) Wg staining (red) of eye tissue from (D) ras1G12V;csk−/−, and (E) ras1G12V;csk−/−,sik2CA animals raised on control diet. Scale bars, 50 μm. (F) Model of diet-enhanced tumorigenesis of Ras/Src-activated cells.
Download links
A two-part list of links to download the article, or parts of the article, in various formats.
Downloads (link to download the article as PDF)
Open citations (links to open the citations from this article in various online reference manager services)
Cite this article (links to download the citations from this article in formats compatible with various reference manager tools)
Salt-inducible kinases mediate nutrient-sensing to link dietary sugar and tumorigenesis in Drosophila
eLife 4:e08501.
https://doi.org/10.7554/eLife.08501


