Mycolic acid-specific T cells protect against Mycobacterium tuberculosis infection in a humanized transgenic mouse model
- Northwestern University, United States
Figures
Figure 1

Development of DN1 T cells is dependent on the presence of group 1 CD1 molecules.
(A) Schematic diagram of DN1 TCR construct used to generate DN1Tg mice. (B) The presence of DN1 TCR in the genomic DNA of transgenic mice was examined by PCR using primers specific for TRAV13-2 and TRAJ57. DN1 plasmid was used as a positive control (Ctrl). (C) DN1 T cells in the spleen of DN1Tg+ and DN1Tg- mice (in a B6 background) were detected by FACS using anti-mouse TCRβ and anti-human Vβ5.1 mAbs. (D) Lymphocytes from the thymus, spleen and liver of DN1Tg/hCD1Tg and DN1Tg mice (in the Rag-deficient background) were analyzed for the presence of DN1 T cells (TCRβ+hVβ5.1+). (E, F) Bar graphs depict the mean and SEM of the percentages (in the lymphocyte gate) and absolute numbers of DN1 T cells from DN1Tg/hCD1Tg and DN1Tg mice (n=3–8 per group). ***p<0.001; **p<0.01; *p<0.05. (G) Expression of indicated markers (black line) on DN1 T cells (TCRβ+hVβ5.1+) from DN1Tg/hCD1Tg/Rag-/- mice, type I NKT cells (CD1d/αGalCer tetramer+TCRβ+) from WT mice, and conventional CD8+ T cells (TCRβ+CD8+) from WT mice, compared with isotype control (gray filled). The expression of CD4 and CD8 on DN1 T cells and type I NKT cells were shown in the dot plots. Cells isolated from the thymus were used for PLZF staining. Results are representative of 3 experiments.
Figure 2 with 1 supplement

CD1b-expressing hematopoietic cells are the major cell type that medicates the positive selection of DN1 T cells.
Bone marrow from DN1Tg and DN1Tg/hCD1Tg mice (in the Rag-deficient background) were adoptively transferred into irradiated CD45.1 congenic WT and hCD1Tg recipients and the development of DN1 T cells were examined 5 weeks later. (A) Dot plots depict the proportion of CD45.2+ hVβ5.1+ cells in the lymphocyte gate. Data are representative of 2 experiments with 4–6 mice in each group. (B, C) Bar graphs depict the mean ± SEM of the percentage and absolute number of CD45.2+ hVβ5.1+ cells in each group. Statistical significance was evaluated by comparing HC, TEC and None group with HC+TEC group. ***p<0.001; **p<0.01; *p<0.05. (D) CD1b expression on TEC (CD45-MHCII+) and DP thymocytes from WT and hCD1Tg mice were shown as MFI values (n=3 per group). (E) Percentage of CD8+ DN1 T cells in the spleen of HC+TEC, HC or TEC groups of mice. (F) Expression of indicated markers on DN1 thymocytes that developed in HC+TEC, HC or TEC groups. ***p<0.001; **p<0.01; *p<0.05. Results are representative of 2 experiments with 3 mice per group.
Figure 2—figure supplement 1
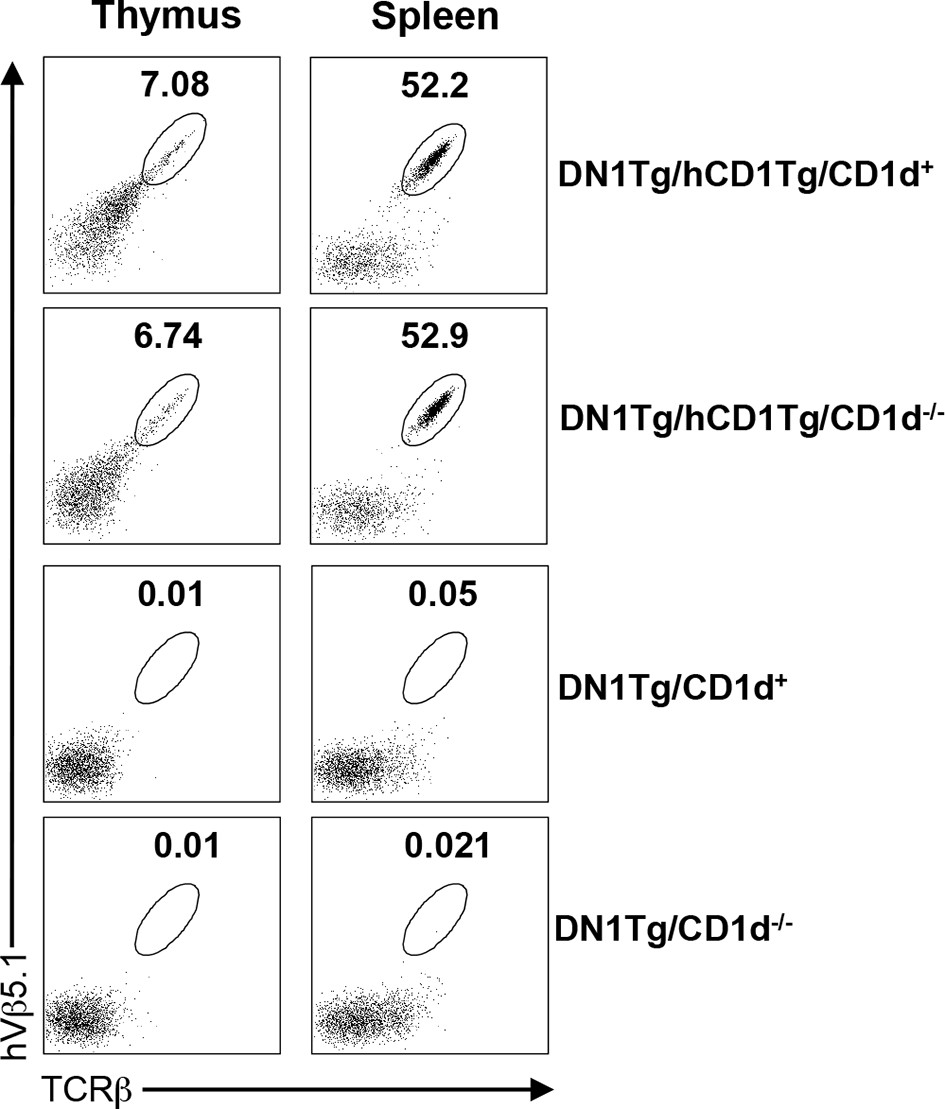
CD1 expression does not significantly affect the development of DN1 T cells.
Lymphocytes from the thymus and spleen of DN1Tg/hCD1Tg, DN1Tg/hCD1Tg/CD1d-/-, DN1Tg and DN1Tg/CD1d-/- mice (all in the Rag-deficient background) were analyzed for the presence of DN1 T cells (TCRβ+hVβ5.1+). Results are representative of 2 experiments with 3 mice per group.
Figure 3
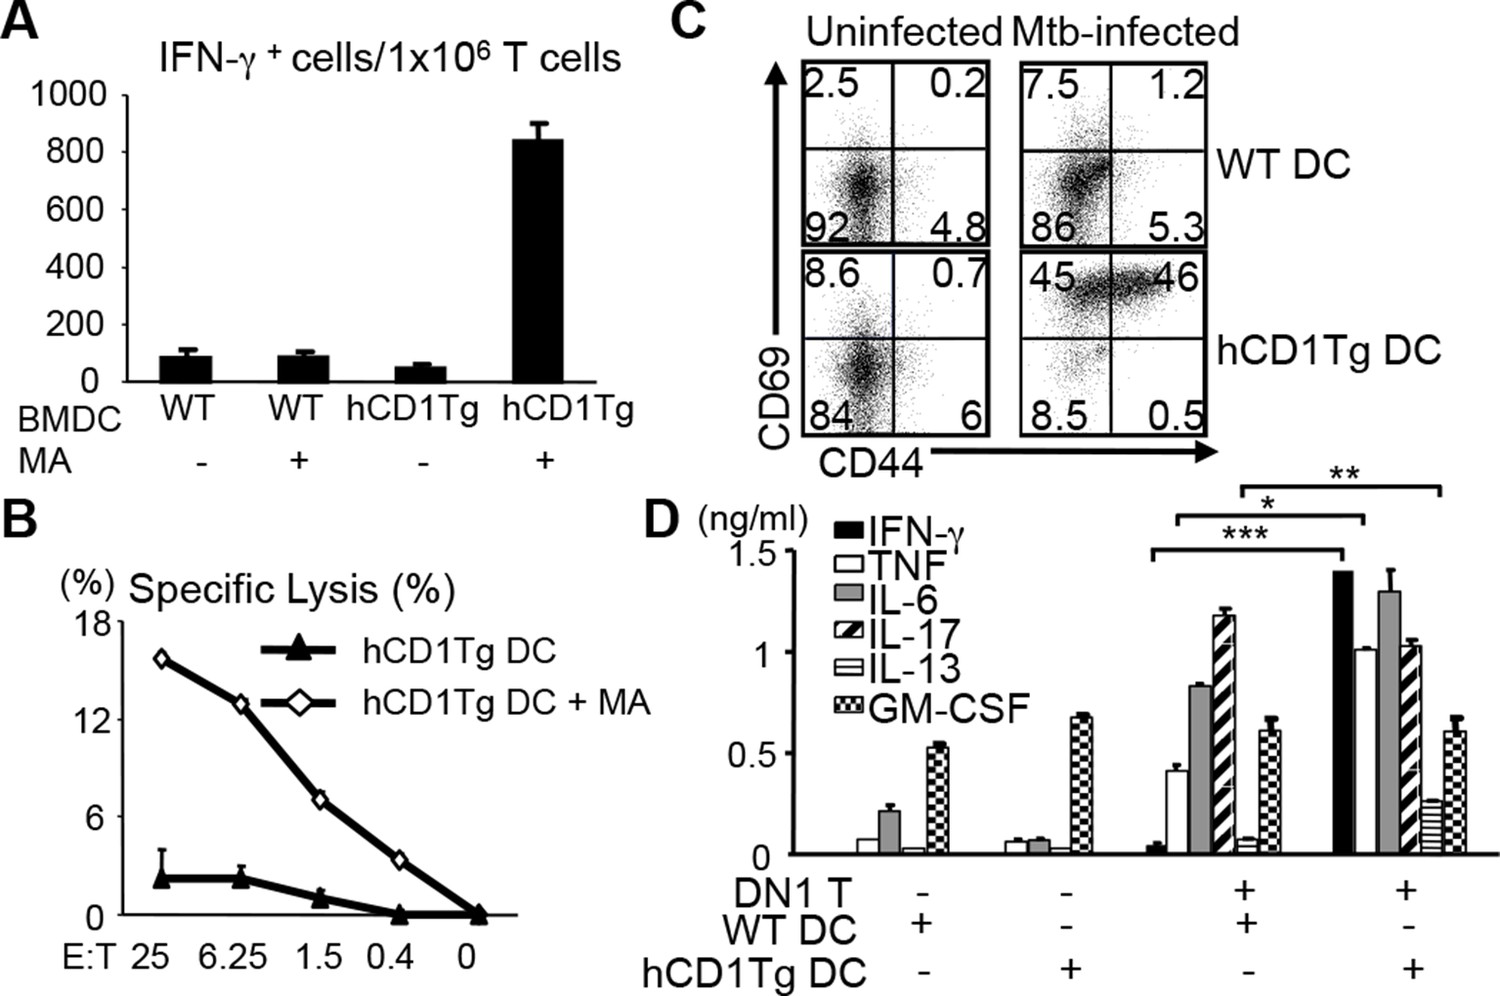
DN1 T cells acquire effector functions in response to MA-pulsed DC and Mtb-infected DC.
(A) DN1 T cells isolated from lymph nodes of DN1Tg/hCD1Tg/Rag-/- mice were co-cultured with un-pulsed or MA-pulsed WT or hCD1Tg DC and IFN-γ producing cells were determined by ELISPOT assays. (B) DN1 T cells were stimulated by hCD1Tg BMDCs pulsed with MA for 7 days and then tested for cytotoxic activity against hCD1Tg BMDCs with or without MA. Data are representative of 3 experiments (mean ± SEM of triplicate cultures). (C, D) DN1 T cells isolated from lymph nodes of DN1Tg/hCD1Tg/Rag-/- mice were co-cultured with Mtb-infected BMDC for 48 hr. Activation markers on DN1 T cells were detected by flow cytometry and cytokines in the supernatant were detected by CBA flex set. ***p<0.001; **p<0.01; *p<0.05. Results are representative of 2 experiments with 3 mice per experiment.
Figure 4
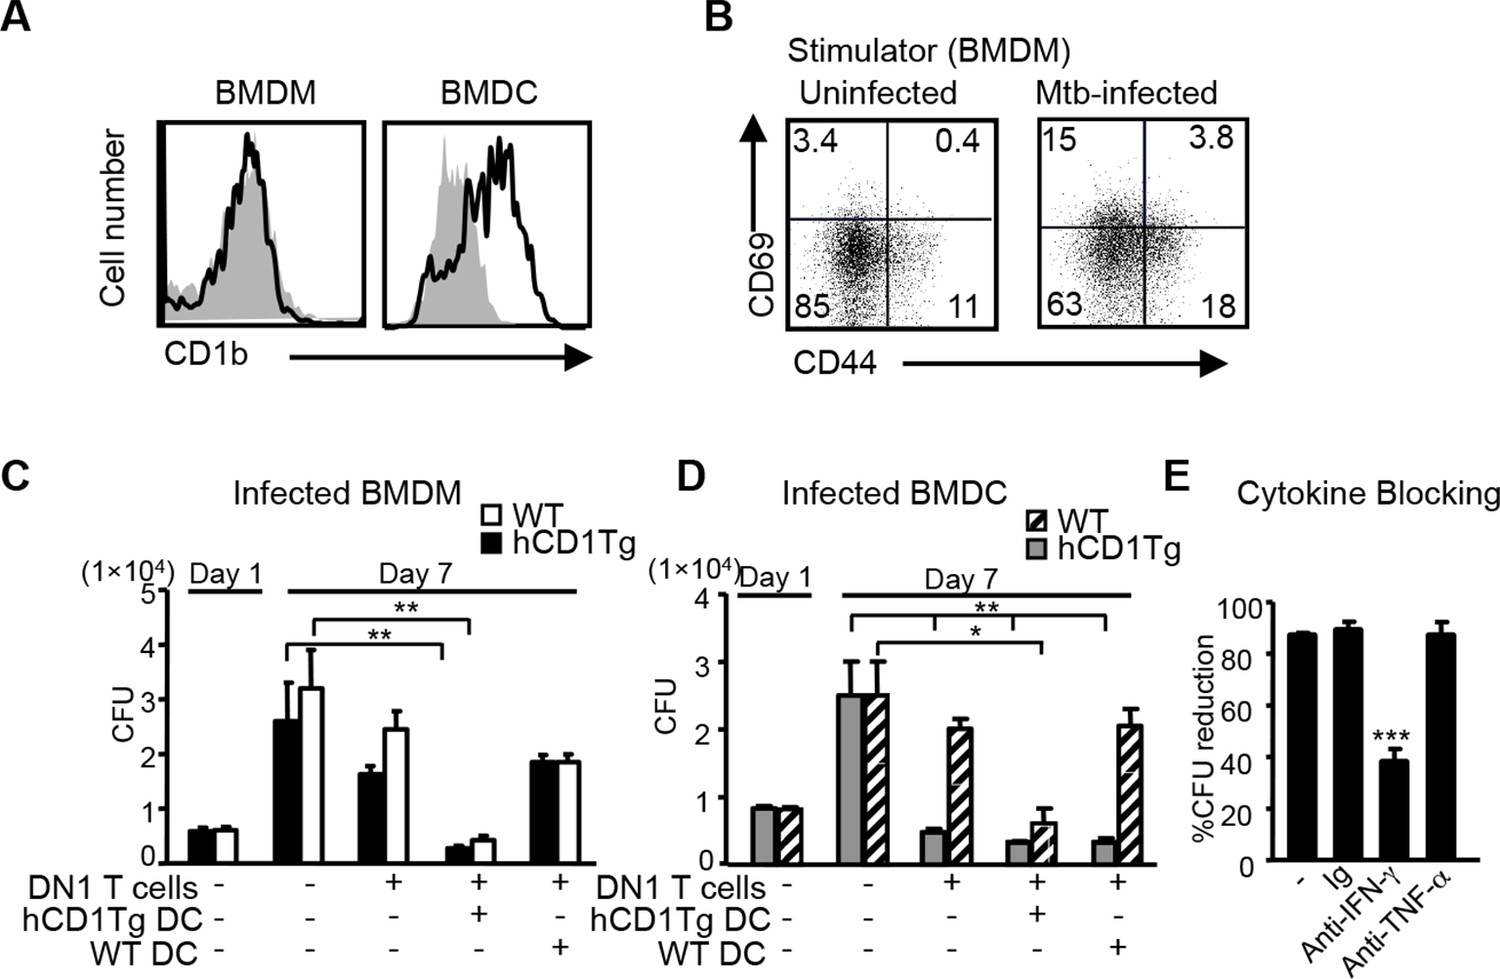
DN1 T cell-mediated control of Mtb is dependent on the antigen presentation by group 1 CD1-expressing DCs and IFN-γ production.
(A) CD1b expression on BMDM and BMDC was detected using flow cytometry. (B) BMDMs were in vitro infected with Mtb (MOI=5) and DN1 T cells were added 1 day after infection. After 48 hr co-culture, activation markers on DN1 T cells were detected by flow cytometry. (C, D) WT and hCD1Tg BMDMs and BMDCs were infected with Mtb. 1 day later, DN1 T cells with or without uninfected WT or hCD1Tg DCs were added into the culture for another 6 days. At day 7 post-infection, cells were lysed for CFU assay. Bar represents mean and SEM from replicate cultures (n = 6). (E) DN1 T cells were added into Mtb-infected BMDCs in the presence of control Ig (Ig), anti-IFN-γ or anti-TNFα. At day 7 post-infection, cells were lysed for CFU assay. % reduction was calculated as 100x[(BMDCalone- BMDCwith DN1)/ BMDCalone]. Results are representative of 2–3 experiments. ***p<0.001; **p<0.01; *p<0.05.
Figure 5
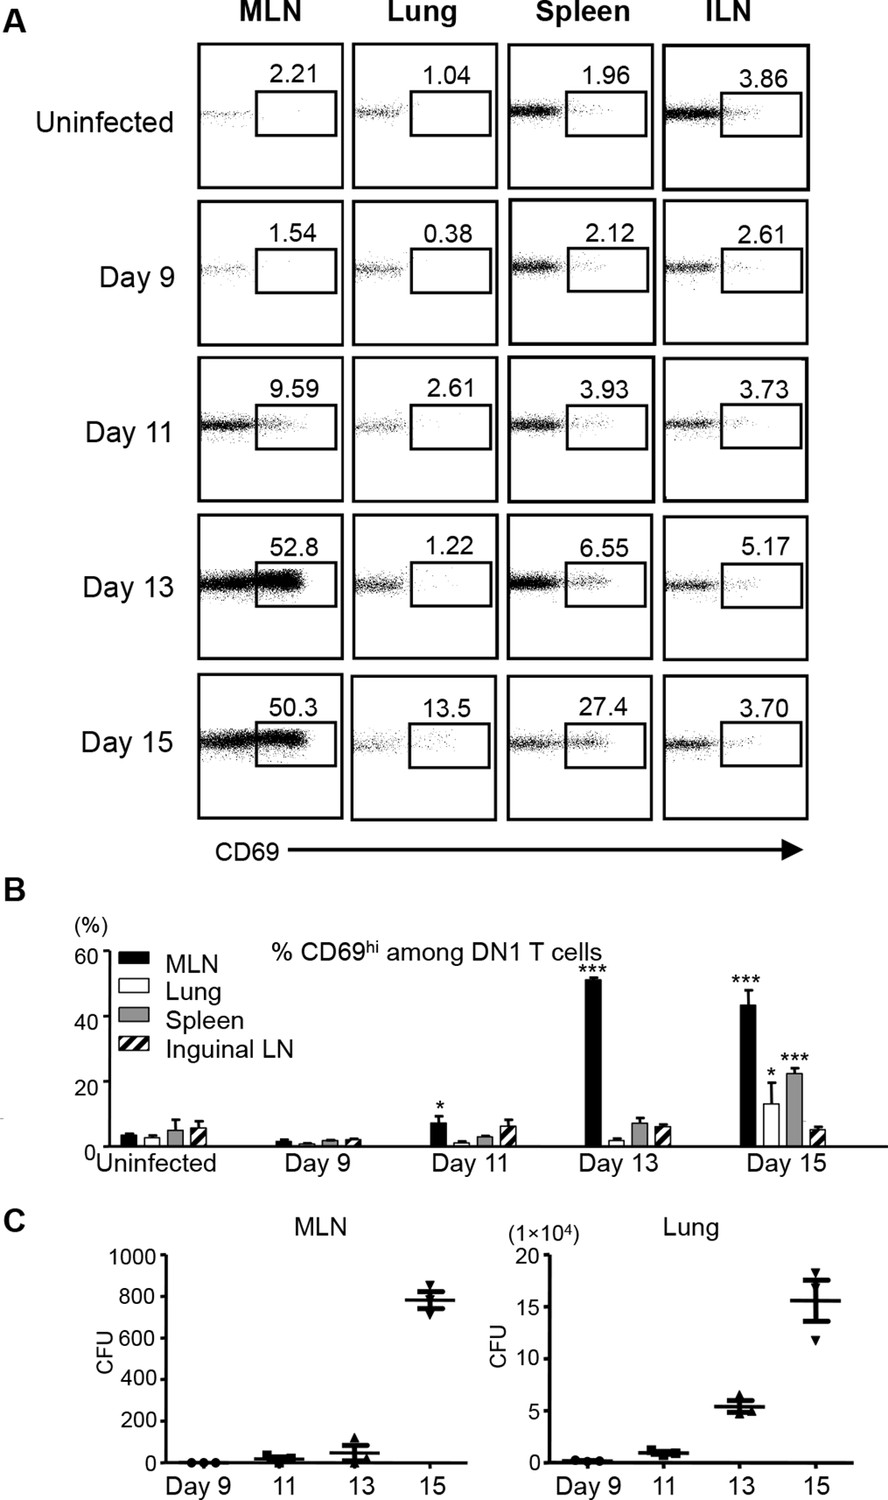
Activation of DN1 T cells is initiated in mediastinal lymph nodes after aerosol Mtb infection.
(A) 3x10⁶ naïve DN1 T cells were adoptively transferred into Mtb infected CD45.1 congenic hCD1Tg mice at day 7 post-infection. CD69 expression was detected on DN1 T cells (hVβ5+TCRβ+) from the MLN, lung, spleen, and inguinal lymph nodes (ILN) of recipient mice at indicated time points. (B) Bar graphs depict the mean and SEM of the percentages of CD69hi population among DN1 T cells (n=3 each time point). (C) Bacterial CFU in MLN and lung at indicated time points. Each symbol represents the bacteria burden in the MLN or lung of an individual mouse at the indicated time point. Horizontal bars represent the mean CFU counts ± SEM for each group. Results are representative of 2 experiments with 3 mice per time point. ***p<0.001; **p<0.01; *p<0.05.
Figure 6
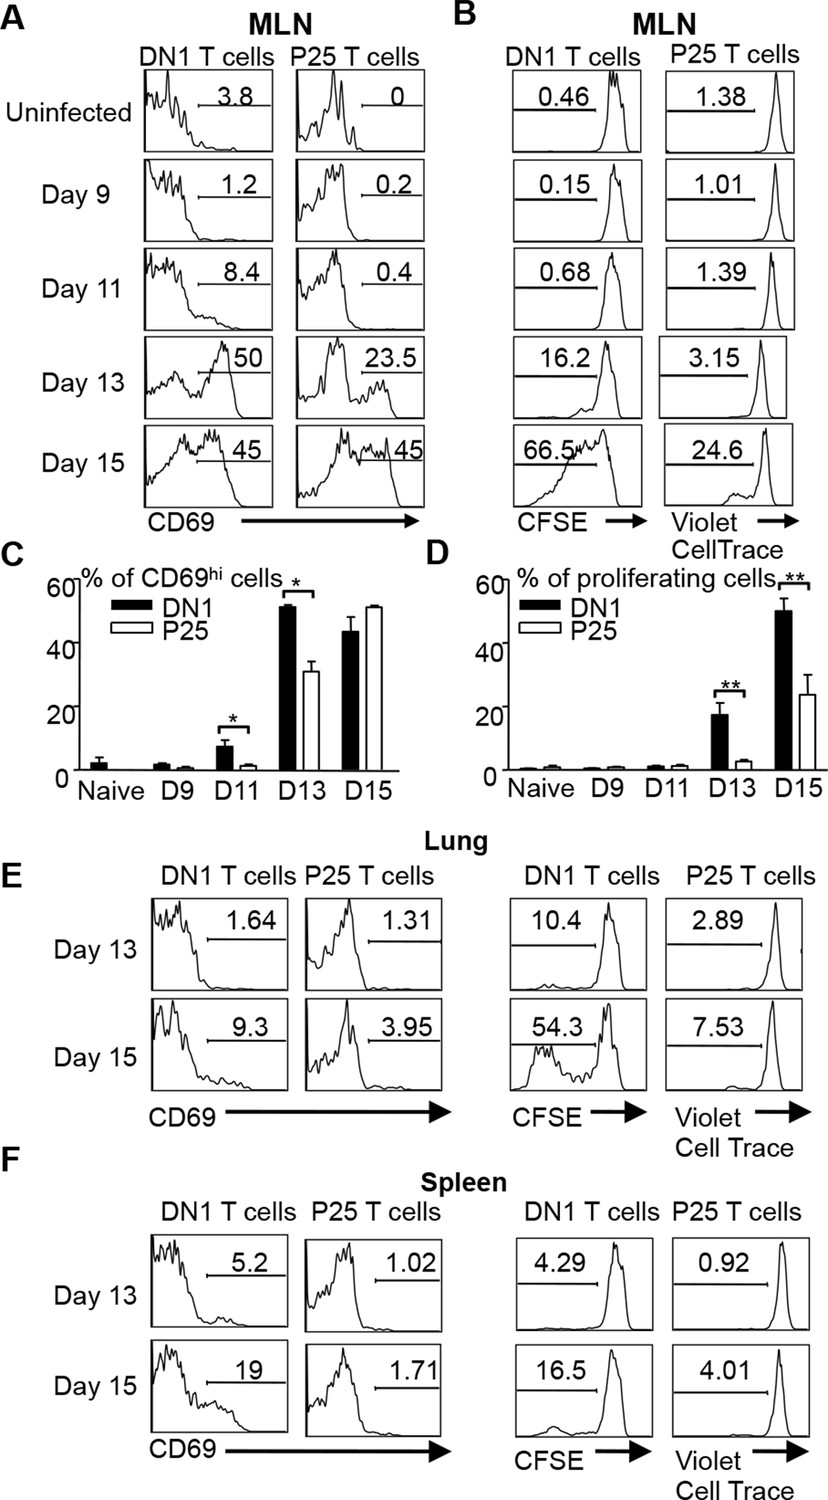
DN1 T cells are activated earlier than Ag85 specific CD4+ T cells after Mtb infection.
(A, B) 3x10⁶ CFSE-labeled DN1 T cells and 3x10⁶ CellTrace Violet-labeled P25 T cells were co-transferred into Mtb infected CD45.1 congenic hCD1Tg mice. CD69 expression, CFSE and CellTrace Violet were detected on DN1 T cells and P25 T cells from MLN at indicated time points. (C, D) Bar graphs depict the mean and SEM of the percentages of CD69hi and CFSE/Violetlow populations among DN1 and P25 T cells. (E, F) CD69 expression, CFSE and CellTrace Violet were detected on DN1 and P25 T cells from lungs (E) and spleens (F) at day 13 and day 15 post-infection. Results are representative of 2 experiments with 3–4 mice per experiments. ***p<0.001; **p<0.01; *p<0.05.
Figure 7 with 1 supplement
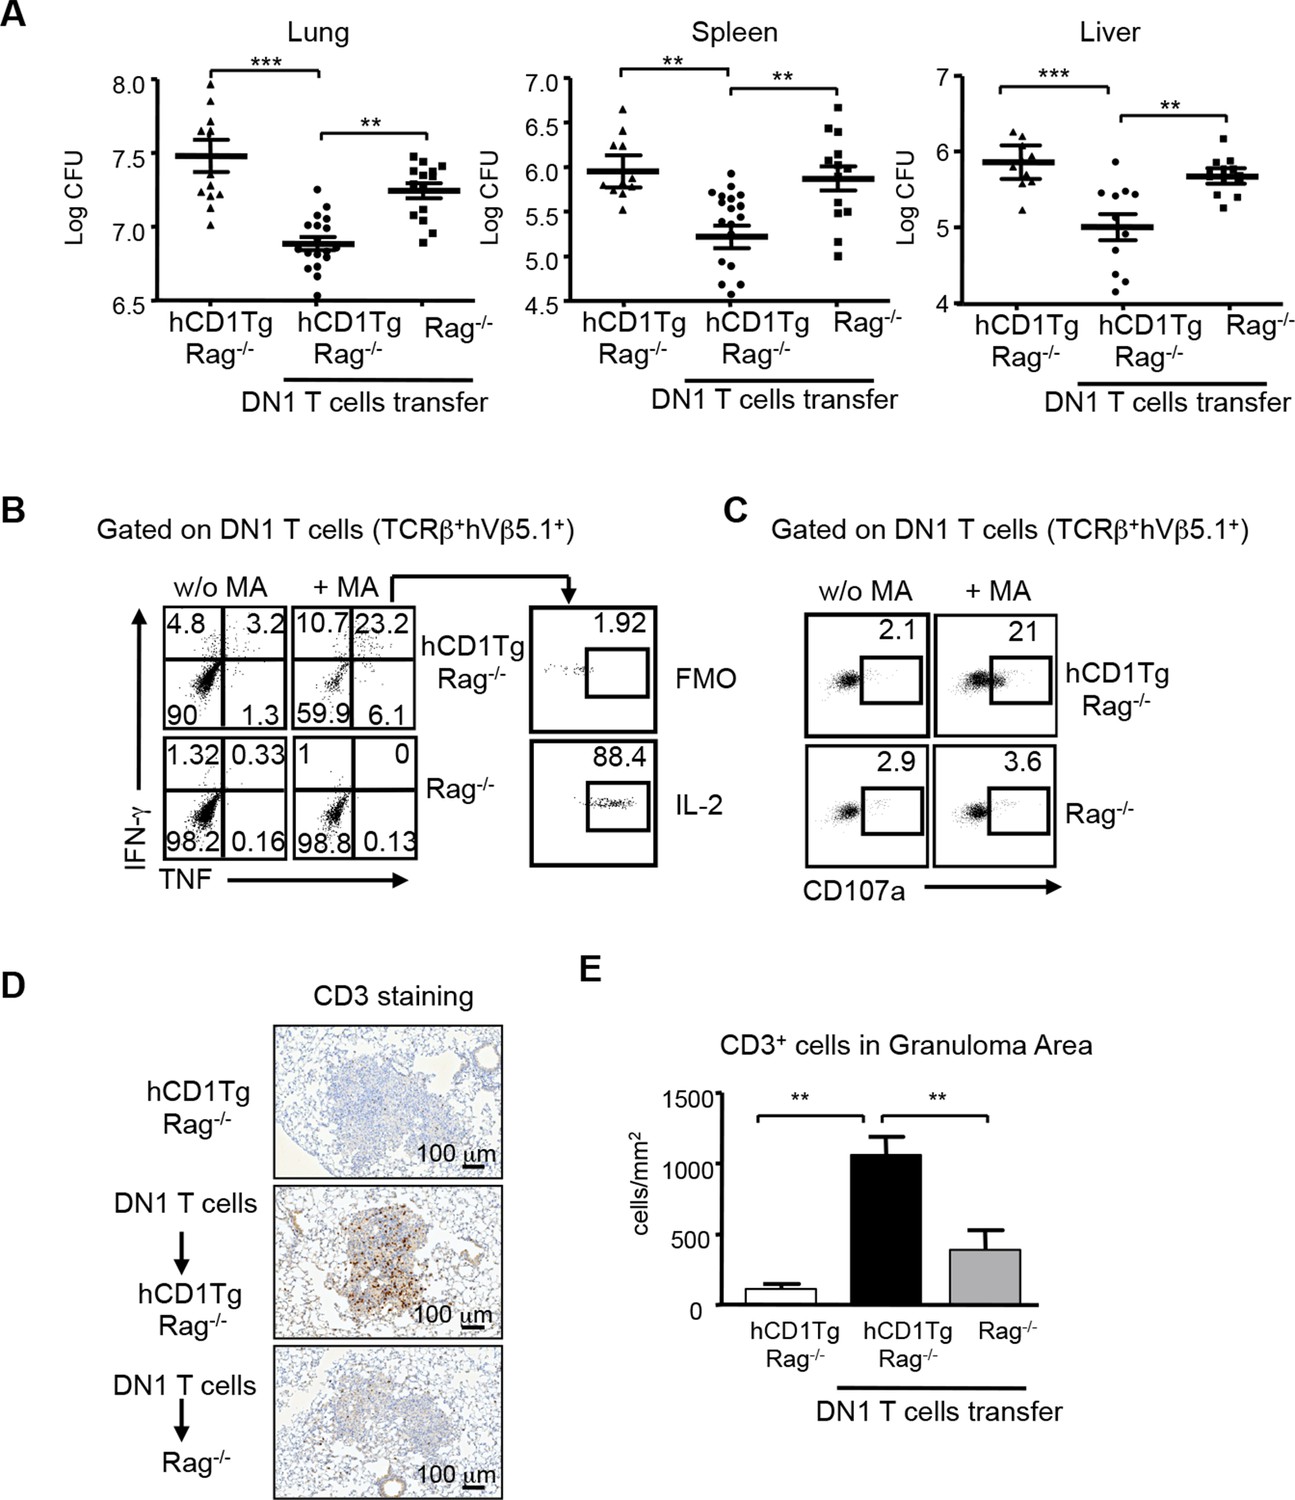
DN1 T cells contribute to protective immunity against Mtb infection.
Effector DN1 T cells (5-7x10⁶ cells) were transferred into hCD1Tg/Rag-/- or Rag-/- mice 1 day before infection. Mice were euthanized at 4 week post-infection. (A) The number of bacteria in the lung, spleen and liver of individual mouse in each group. Horizontal bars represent the mean CFU counts ± SEM for each group. (B, C) Cells harvested from lungs of hCD1Tg/Rag-/- or Rag-/- mice were stimulated with un-pulsed or MA-pulsed DC and intracellular stained for the indicated cytokines (B) and CD107a expression (C). (D) Immunohistochemistry staining of anti-CD3 (brown cells) of the lung section from indicated groups. Pictures show granuloma area in infected lung tissues. (E) Bar graphs depict the mean and SEM of number of CD3+ cells per mm2 within granuloma areas (n=3–6 mice each group). ***p<0.001; **p<0.01; *p<0.05.
Figure 7—figure supplement 1
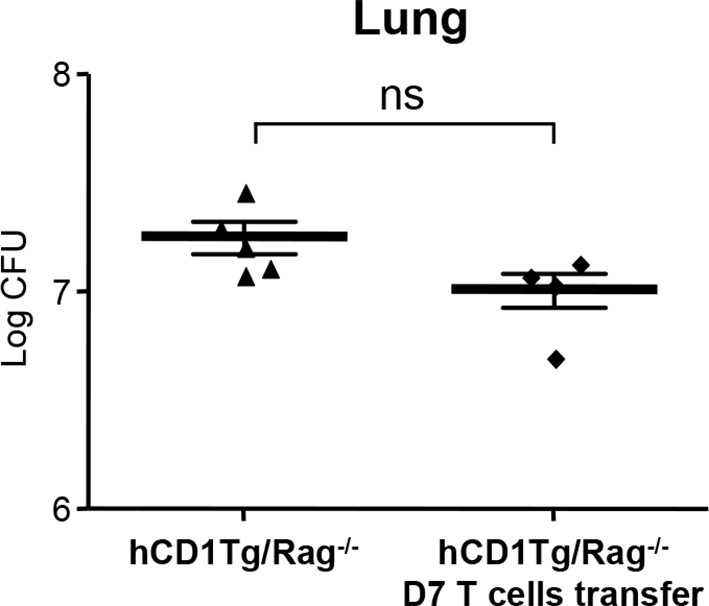
Adoptive transfer of listeria LemA-specific M3-restricted D7 T cells does not confer protection against Mtb infection.
Effector D7 T cells (5x10⁶ cells) were transferred into hCD1Tg/Rag-/- mice 1 day before infection. Bacterial load in the lung was measured at 4 week post-infection. Each symbol represents the bacterial burden in the lung of an individual mouse in each group. Horizontal bars represent the mean CFU counts ± SEM. NS, not significant.
Download links
A two-part list of links to download the article, or parts of the article, in various formats.
Downloads (link to download the article as PDF)
Open citations (links to open the citations from this article in various online reference manager services)
Cite this article (links to download the citations from this article in formats compatible with various reference manager tools)
Mycolic acid-specific T cells protect against Mycobacterium tuberculosis infection in a humanized transgenic mouse model
eLife 4:e08525.
https://doi.org/10.7554/eLife.08525


