Inactivation of the ATMIN/ATM pathway protects against glioblastoma formation
- The Francis Crick Institute, United Kingdom
- University College London, United Kingdom
- Okinawa Institute of Science and Technology, Japan
- Barts and the London School of Medicine and Dentistry, United Kingdom
- King's College London, United Kingdom
Figures
Figure 1 with 4 supplements
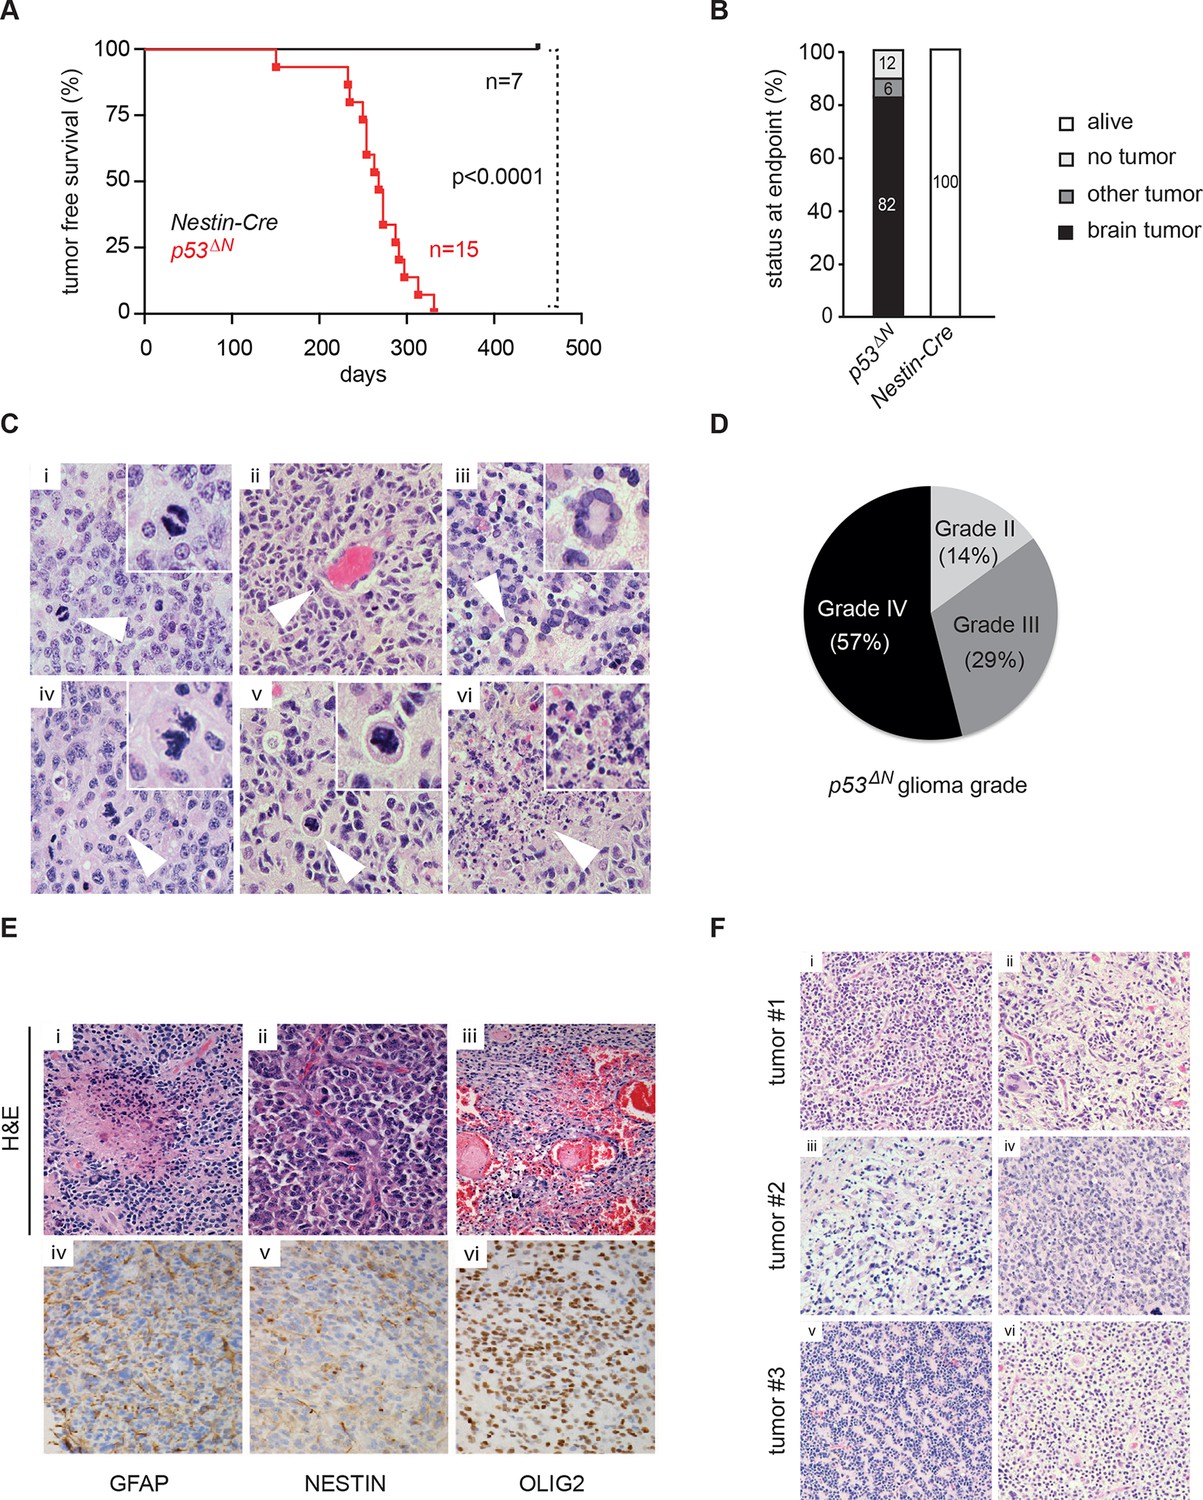
Loss of Trp53 is sufficient to induce GBM with high penetrance.
(A) Kaplan-Meier curves showing tumor-free survival in p53f/f; Nestin-Cre (p53ΔN) and control Nestin-Cre mice. (B) Status of mouse cohorts at 450 days, showing tumor incidence. (C) H&E-stained p53ΔN brain tumor sections showing histological features of malignant GBM. Arrowheads indicate (i) a mitotic cell, (ii) neo-vascularization, (iii) rosetta formation, (iv) mitotic catastrophe, (v) a multinucleated giant cell, and (vi) large areas of necrosis. (D) Grades of gliomas for p53ΔN mice. (E) Examples of human GBM hallmarks observed in p53ΔN tumors: pseudopalisading necrosis (i), microvascular proliferation with endothelial hyperplasia (ii), and endovascular thrombosis (iii) (all H&E). Immunohistochemistry shows expression of the glial markers GFAP (iv), NESTIN (v), and OLIG2 (vi) in p53ΔN tumors. (F) p53ΔN glioblastomas display high inter- and intra-tumoral heterogeneity. H&E images i-ii, iii-iv, and v-vi represent different regions of the same tumors #1, #2, and #3 respectively. GBM, Glioblastoma multiforme.
Figure 1—figure supplement 1
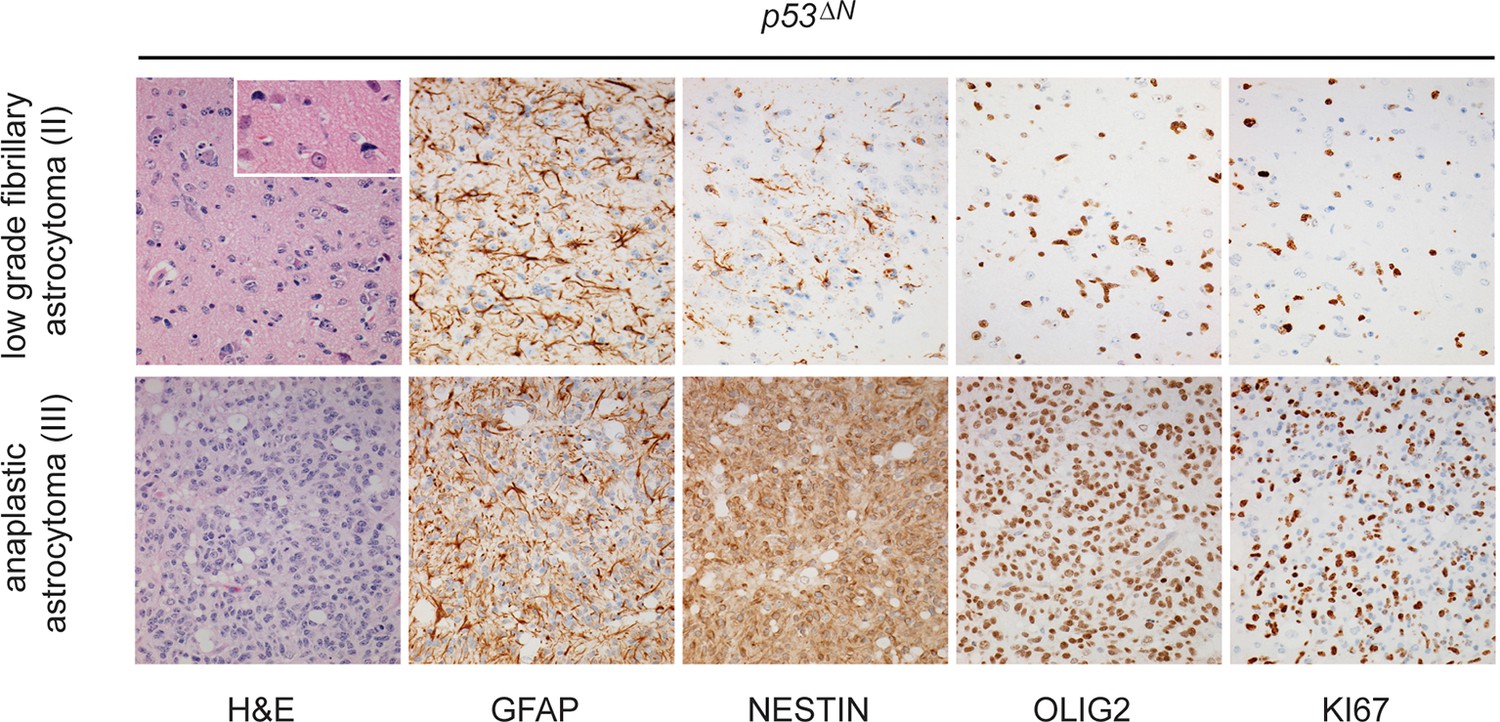
Histological features of lower grade tumors observed in p53ΔN animals.
Hematoxylin and Eosin (H&E) and antibody-stained sections of p53ΔN brains showing representative examples of low-grade fibrillary astrocytoma (WHO Grade II) and anaplastic astrocytoma (WHO Grade III). Ki67 immunolabeling indicates progressively increased proliferation of atypical glial cells with increased tumor grade
Figure 1—figure supplement 2
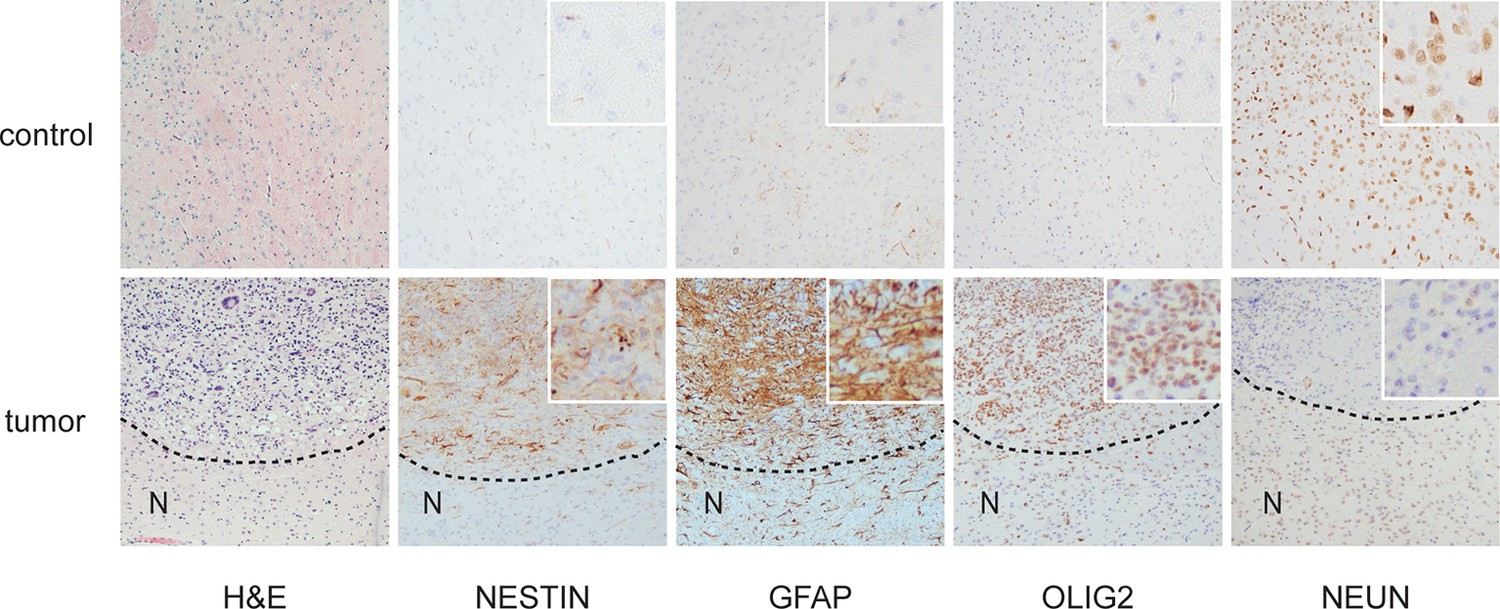
Histological features of glioblastomas observed in p53ΔN animals.
H&E and immunohistochemical staining of sections from p53ΔN control brain tissue (top row) and gliomas (lower row). 'N' denotes the normal brain region adjacent to the tumor mass.
Figure 1—figure supplement 3
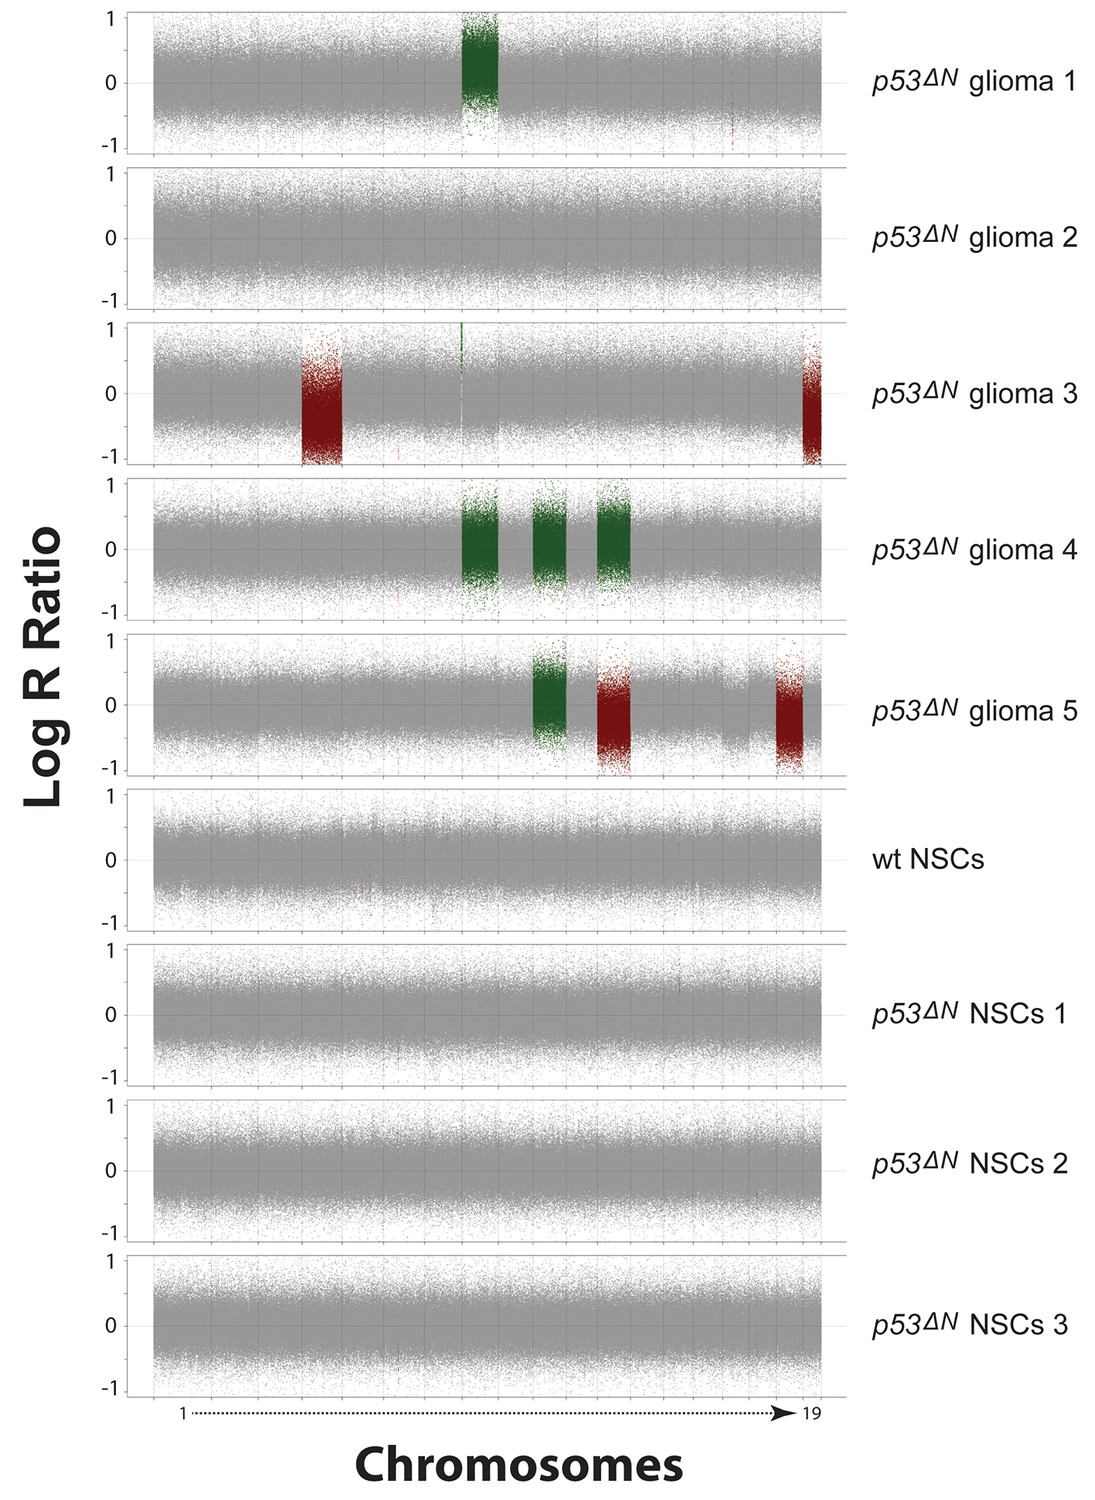
SNP array analysis on primary cells derived from GBM bearing p53ΔN, non-tumor bearing p53ΔN , and wild-type (wt) animals.
Chromosomal copy number variations are found in primary tumor cells derived from p53ΔN gliomas (Stupp et al., 2005; Wen and Kesari, 2008; Cancer Genome Atlas Research Network, 2008; Wen et al., 2006; Rich et al., 2004) but not in non-tumorous adult p53ΔN NSCs (Stupp et al., 2005; Wen and Kesari, 2008; Cancer Genome Atlas Research Network, 2008) or adult wt NSCs. Log R Ratio plots show copy number states for all mouse autosomes for tumor, wt, and p53ΔN cells. Grey points represent probes in a normal copy number state. Green and light green represents gain and amplification calls, respectively, while red and light red points represent hemi- and homozygous losses, respectively. NSC, Neural stem cell.
Figure 1—figure supplement 4
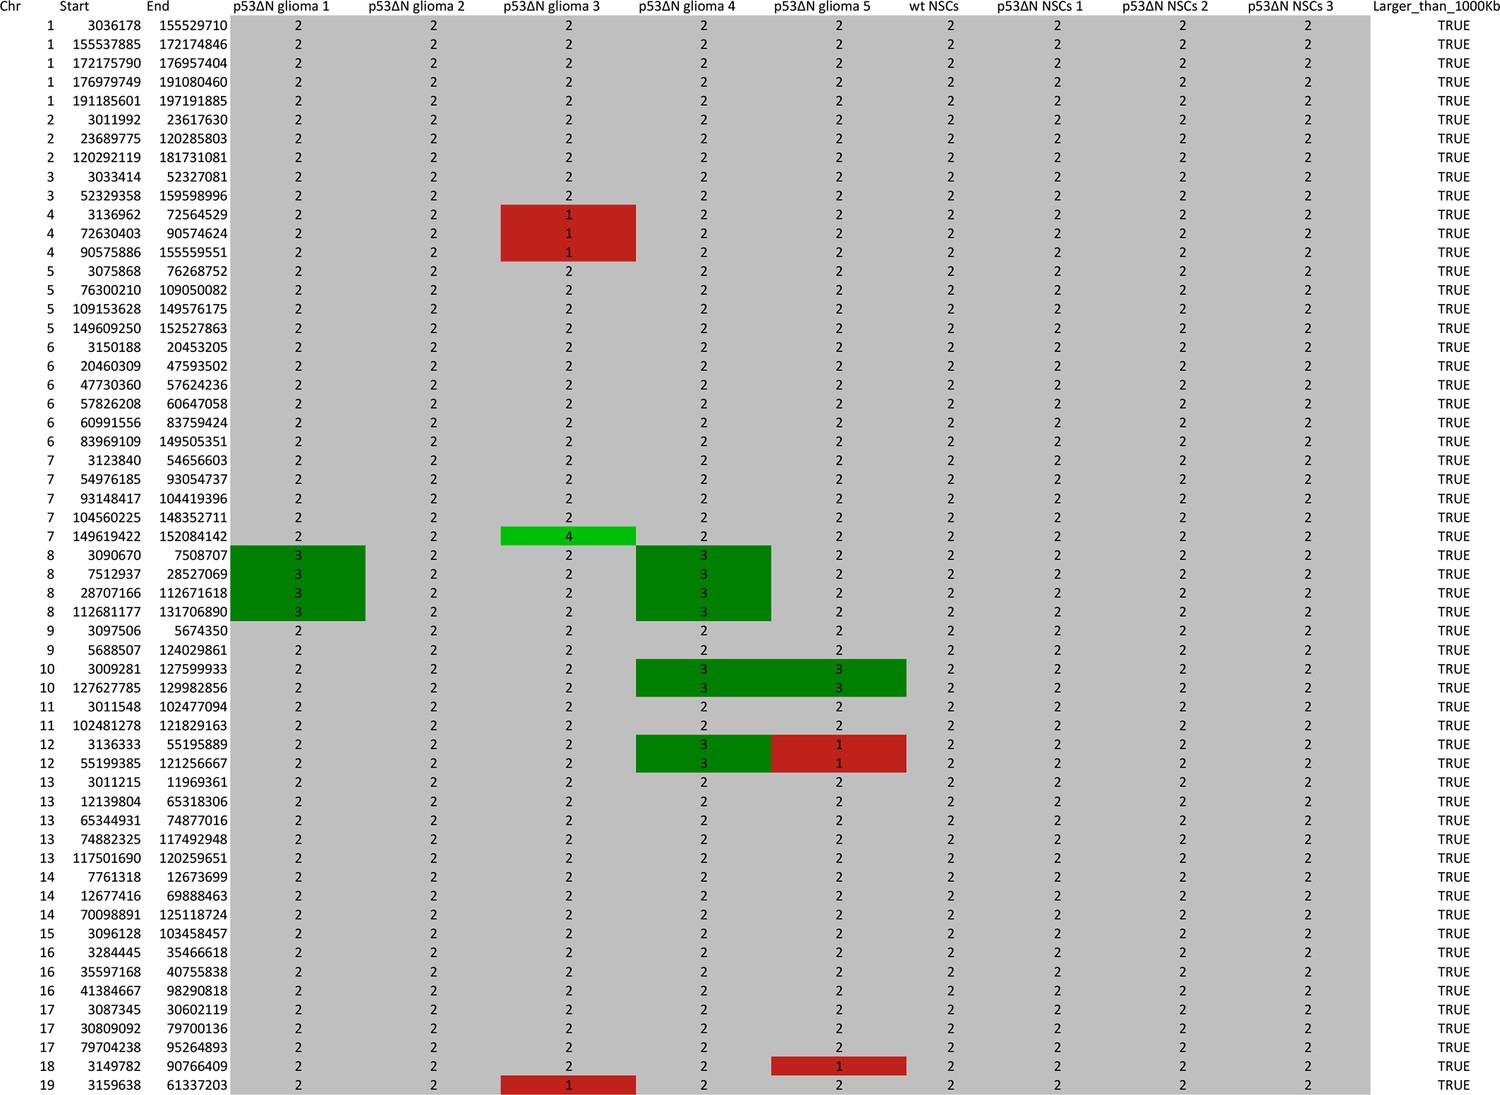
Table representing CGHcall output for SNP array analysis compressed to comparable regions between arrays in the series.
Genomic position and corresponding CGHcall copy number state of samples (0 – homozygous loss, 1 – hemizygous loss, 2 – normal state, 3 – gain, 4 – amplification) are included in the table.
Figure 2 with 7 supplements
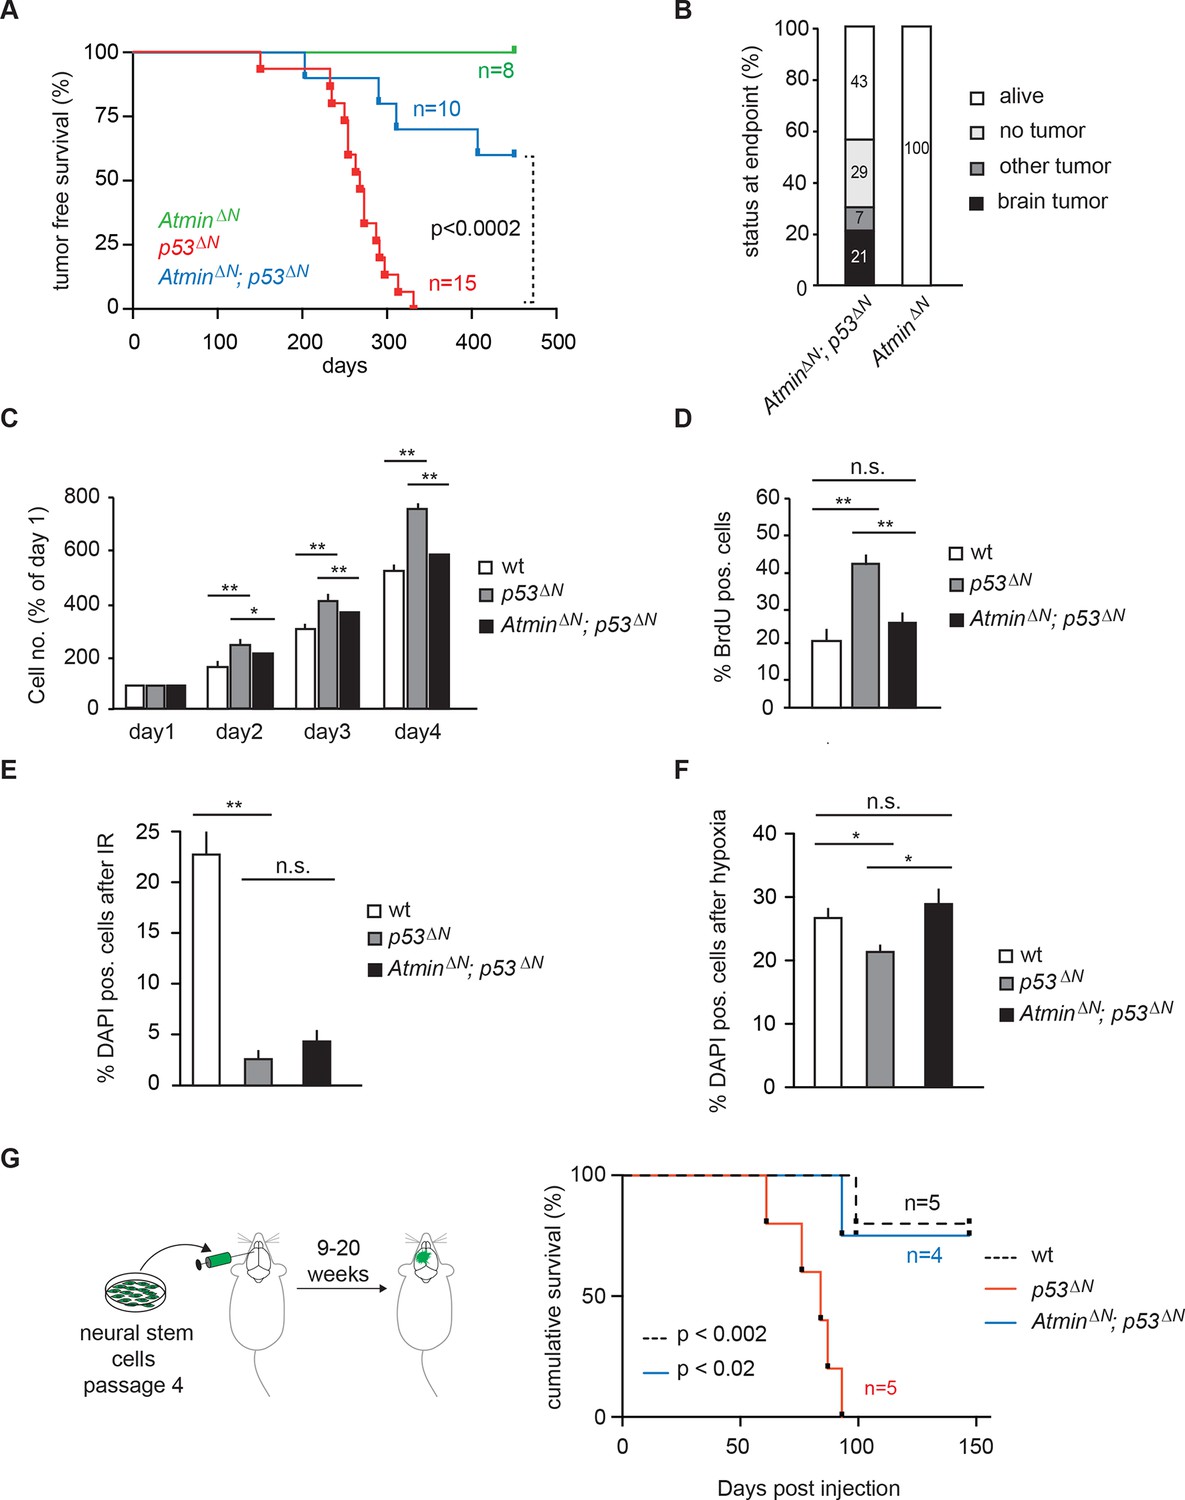
Loss of Atmin rescues GBM formation in p53ΔN brains.
(A) Kaplan-Meier curves showing tumor-free survival in AtminΔN and AtminΔN; p53ΔN mice. p53ΔN curve from Figure 1A (same experiment) is shown for comparison. (B) Status of mouse cohorts at 450 days, showing tumor incidence. (C) Atmin loss rescues the increased proliferation of p53ΔN NSCs. (D) Mean percentage of BrdU-positive NSCs from the indicated genotypes, assessed by FACS following a 2-hr BrdU pulse. (E) Mean number of DAPI-permeable (non-viable) cells after IR or (F) hypoxia, showing sensitivity of AtminΔN; p53ΔN NSCs to hypoxia but not IR. n.s., not significant; * p<0.05, ** p<0.01. (G) Scheme of orthotopic NSC transplant experiment (left) and Kaplan-Meier curves indicating survival of NOD/SCID mice orthotopically transplanted with p53ΔN and AtminΔN; p53ΔN NSCs (right). Error bars represent the SEM of three biological repeats, and two biological repeats for (E). IR, Ionizing radiation; NSC, Neural stem cell.
Figure 2—figure supplement 1
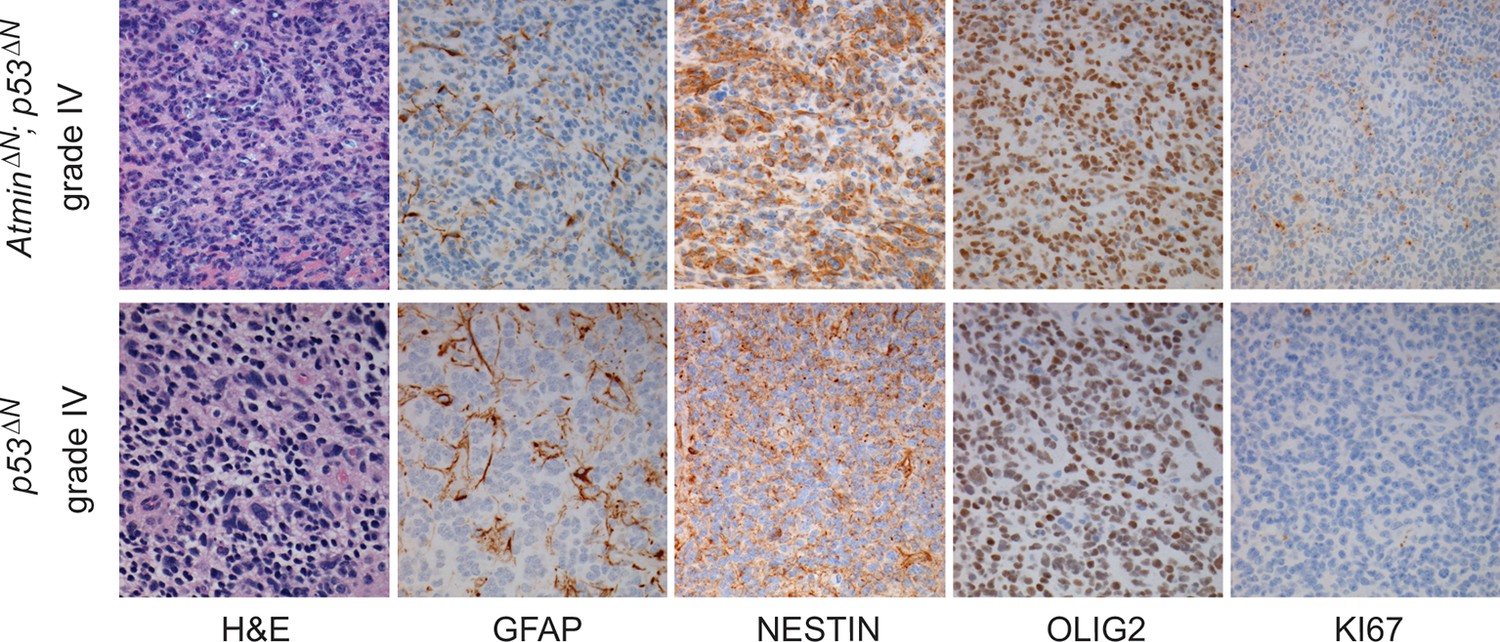
Histological features of glioblastomas observed in p53ΔN and AtminΔN; p53ΔN animals.
H&E and immunohistochemical staining of sections from gliomas derived from AtminΔN; p53ΔN brains (top row) showing expression of Nestin and Olig2 in the tumor cells as well as scattered expression of Gfap, similar to Grade IV GBMs from p53ΔN animals (lower row).
Figure 2—figure supplement 2
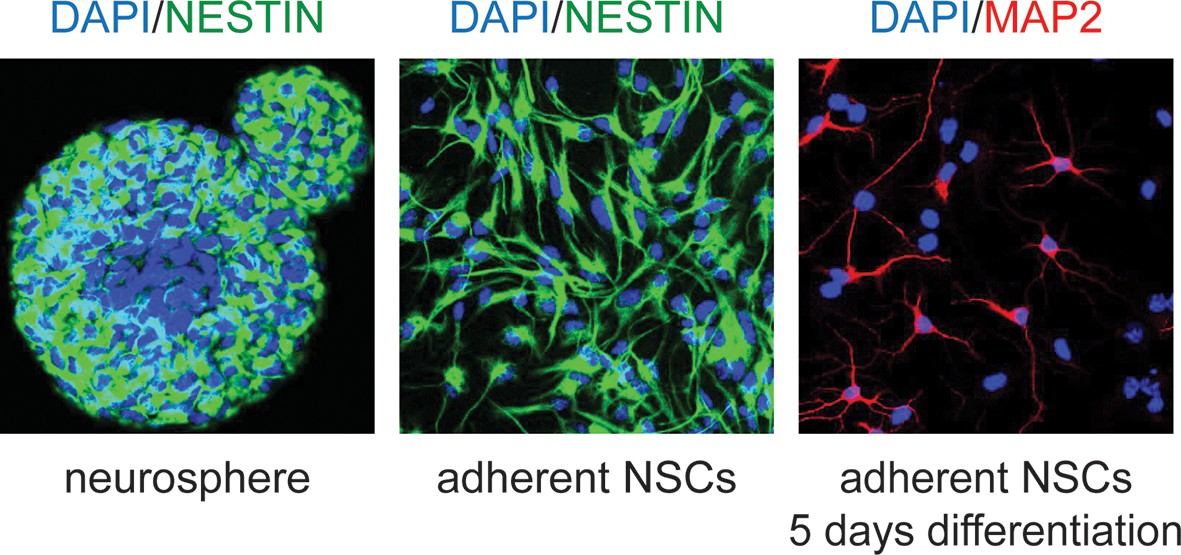
Examples of murine neural stem cells in culture.
Neural stem cells (NSCs) were isolated according to published protocols and cultured first as neurospheres (left), then maintained in adherent culture (center). They maintain the ability to differentiate, as shown by Map2 staining after 5 days (right).
Figure 2—figure supplement 3
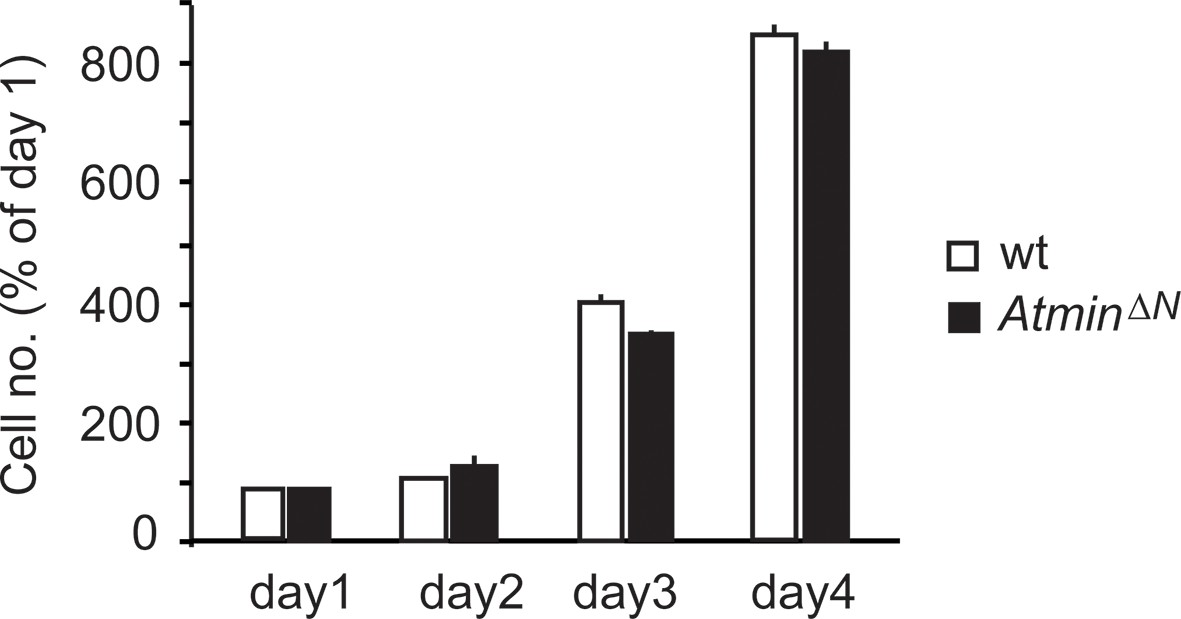
AtminΔN NSCs proliferate at a similar rate as wild-type NSCs.
Error bars represent the SEM of two biological repeats. NSC, Neural stem cell.
Figure 2—figure supplement 4
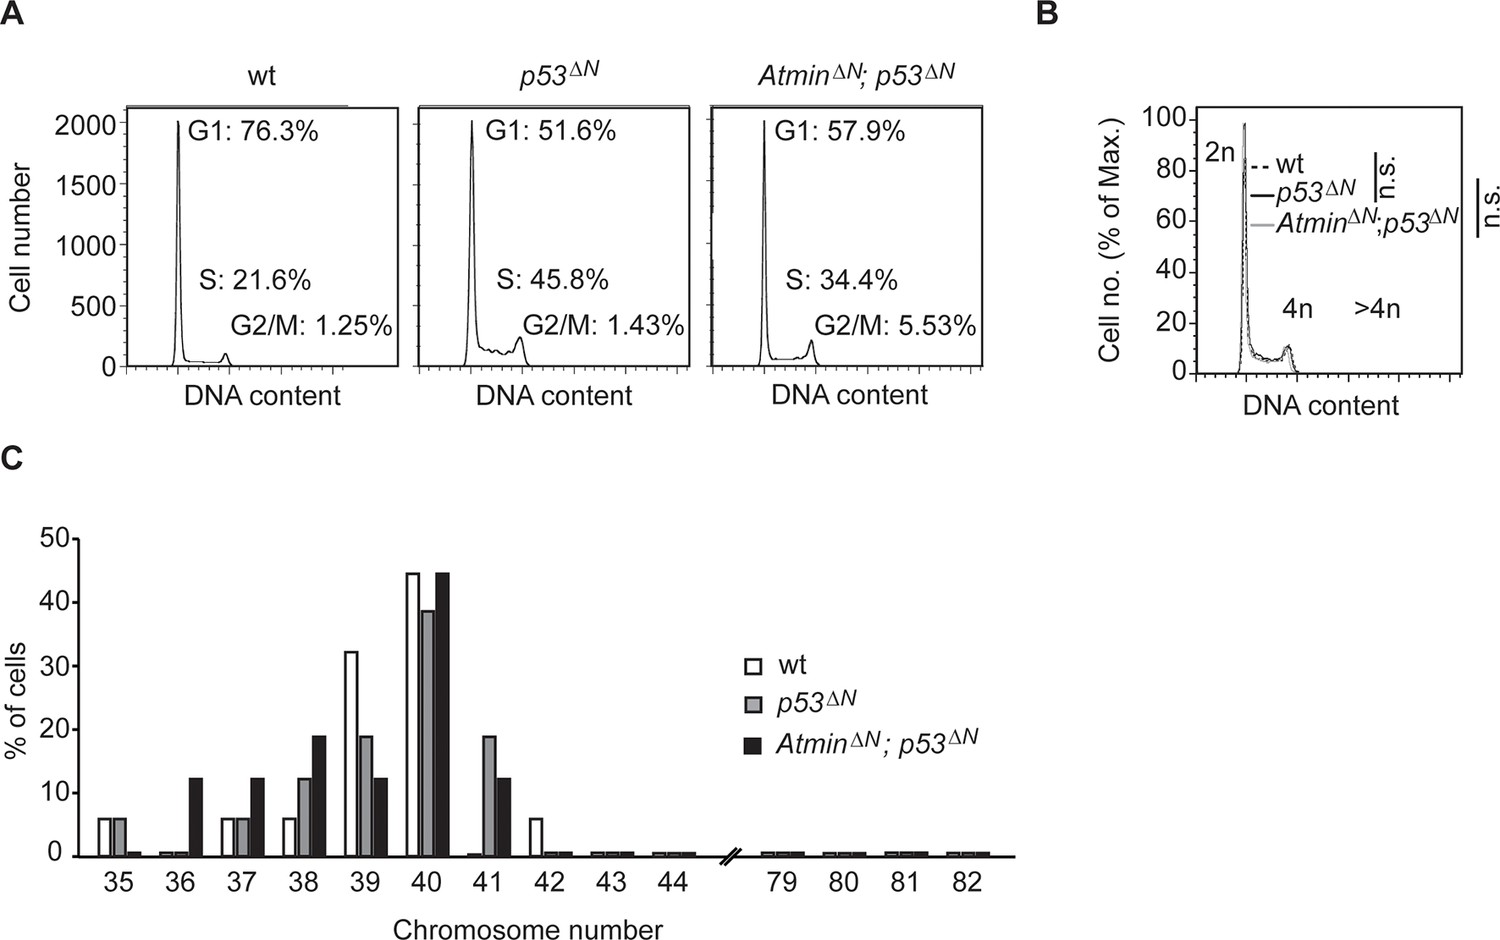
Gross genome stability is unaffected in Atmin/Trp53 double mutant NSCs.
(A) Percentages of cells in G1, S and G2/M cell cycle phases, as measured by FACS. (B) AtminΔN; p53ΔNand p53ΔN NSCs have similar proportions of cells with >4n DNA content as wild-type NSCs, as judged by FACS of propidium iodide (PI)-stained cells. Representative images of two biological repeats per genotype are shown for (A) and (B). (C) Metaphase spread analysis of chromosome number from NSCs of the indicated genotypes. At least 15 cells were analyzed for each indicated genotype. NSC, Neural stem cell.
Figure 2—figure supplement 5
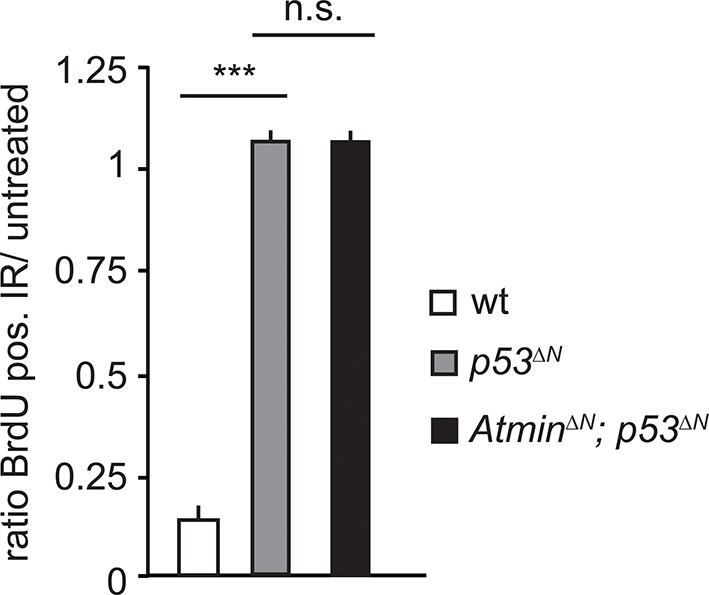
Radiation-induced arrest is similarly impaired in Trp53-mutant and Atmin/Trp53 double mutant NSCs.
Mean average ratio of BrdU-positive IR-treated NSCs relative to untreated NSCs, showing similar impaired arrest in AtminΔN; p53ΔNand p53ΔN NSCs. Error bars represent the SEM of two biological repeats. IR, Ionizing radiation; NSC, Neural stem cell.
Figure 2—figure supplement 6
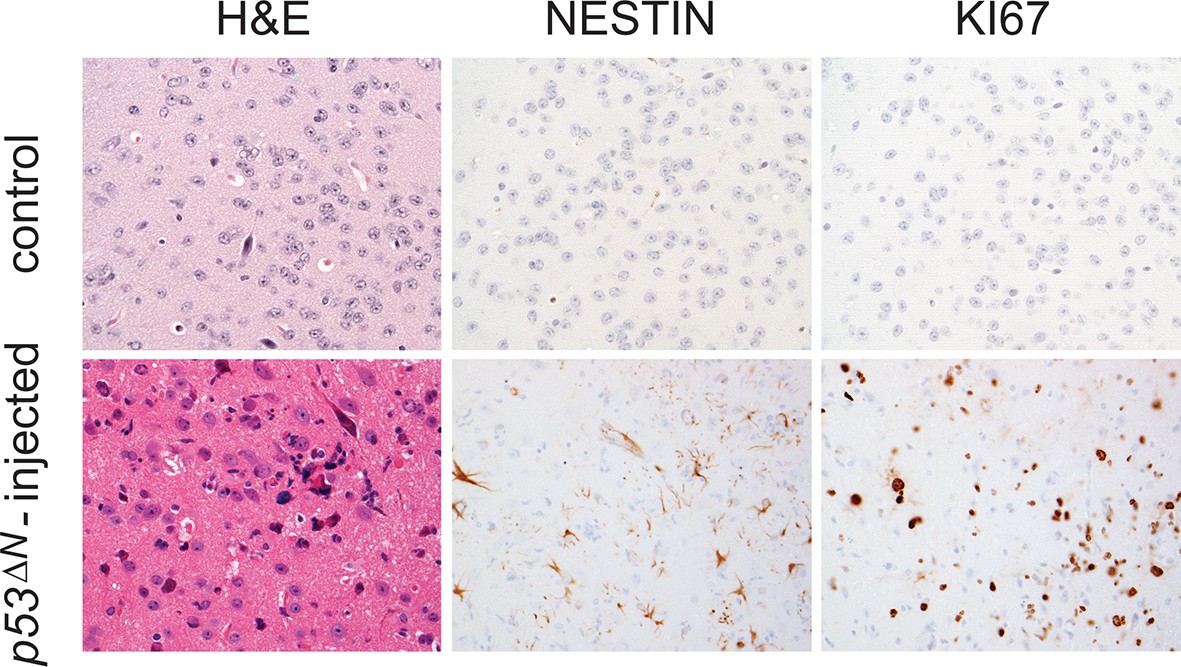
Tumors arising from orthotopic injection of NSCs are Nestin and Ki67-positive.
Adjacent sections from a representative tumor arising from injected p53ΔN NSCs stained with Nestin and Ki67. Control, uninjected brain. NSC, Neural stem cell.
Figure 2—figure supplement 7
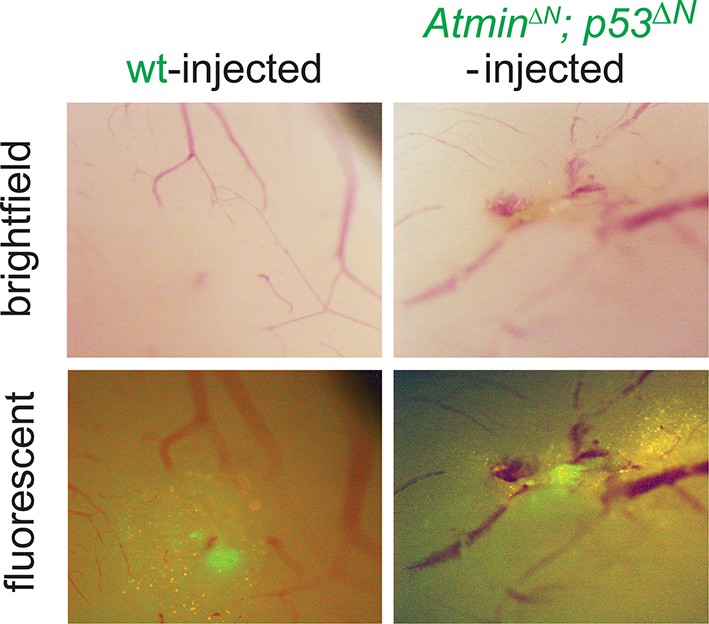
Asymptomatic AtminΔN; p53ΔN-injected animals show persistent GFP-positive cells.
Bright field and fluorescent images of asymptomatic mouse brains 155 days after injection with wt or AtminΔN; p53ΔN NSCs, showing persistence of injected cells. NSC, Neural stem cell
Figure 3 with 6 supplements

Atmin regulates Pdgfra expression in a mutant Trp53 background.
(A) Heatmap showing genes deregulated more than 1.5-fold in Trp53 null NSCs and their corresponding expression in AtminΔN; p53ΔN double null NSCs. (B, C) qRT-PCR validation of GBM implicated genes that show deregulated expression in p53ΔN but not AtminΔN; p53ΔN NSCs. (D) Elevated Pdgfra protein expression in p53ΔN but not AtminΔN; p53ΔN NSCs. Corresponding p-Akt and total Akt levels were probed to analyze pathway activation. Actin was used as loading control. (E) Tumor section from a GBM arising from a p53ΔN animal showing elevated Pdgfra expression. 'N' denotes the normal brain region adjacent to the tumor mass. Dotted lines indicate tumor border. (F) Myc-Atmin overexpression increases expression of Pdgfra mRNA in AtminΔN; p53ΔN but not wt cells. (G) Myc-Atmin overexpression increases Pdgfra protein levels in AtminΔN; p53ΔN NSCs. Tubulin was used as loading control. (H) Atmin silencing using two independent shRNA constructs reduces Pdgfra expression, assessed by qRT-PCR. (I) Stable Pdgfra silencing using two independent shRNA constructs reduces primary tumor cell proliferation, measured using IncuCyte timelapse microscopy. Error bars represent the SEM of at least three biological repeats and two biological repeats in (I).* p<0.05, ** p<0.01, *** p<0.001. NSC, Neural stem cell
Figure 3—figure supplement 1
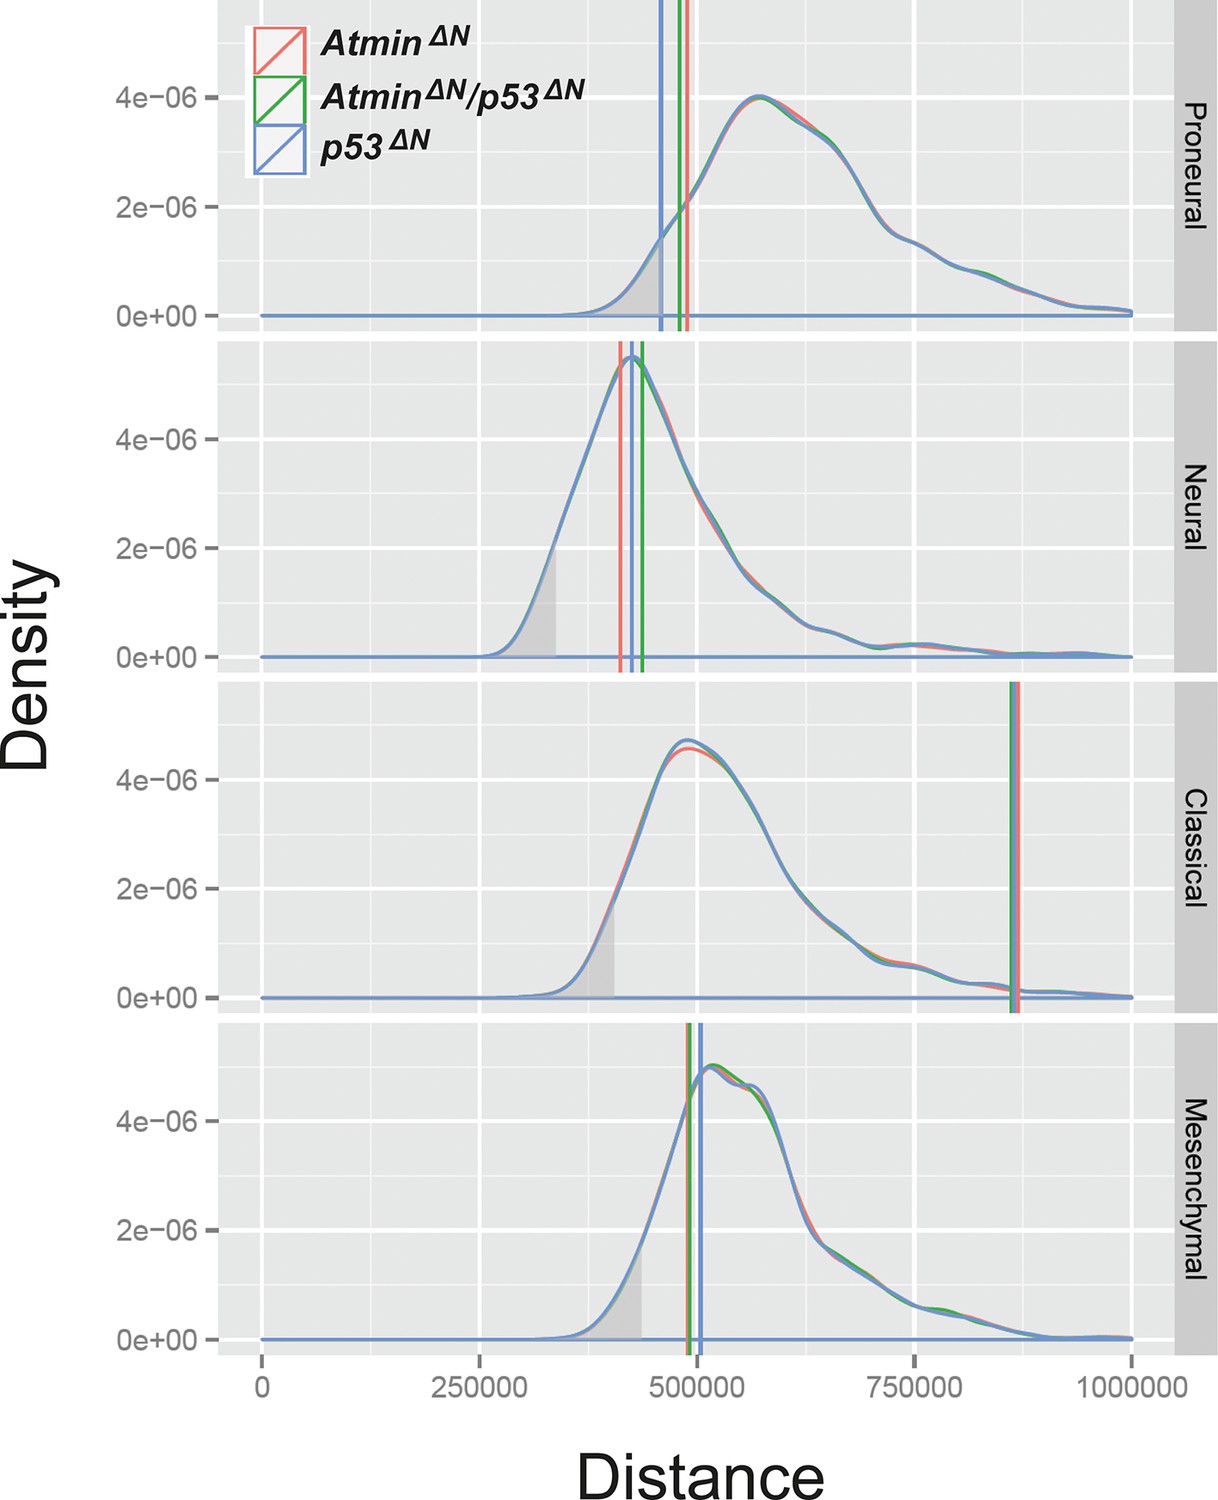
The transcriptional profile of p53ΔN NSCs is most closely related to the human proneural GBM subtype, relative to expected distances.
Relative to expected distance away from the centroids, p53ΔNis closest to the proneural category (p=0.036, simulation test) and the p53ΔN:proneural pairing is the only one that is significant – the grey shading represents the lower 5% tail of the simulated distances. NSC, Neural stem cell
Figure 3—figure supplement 2
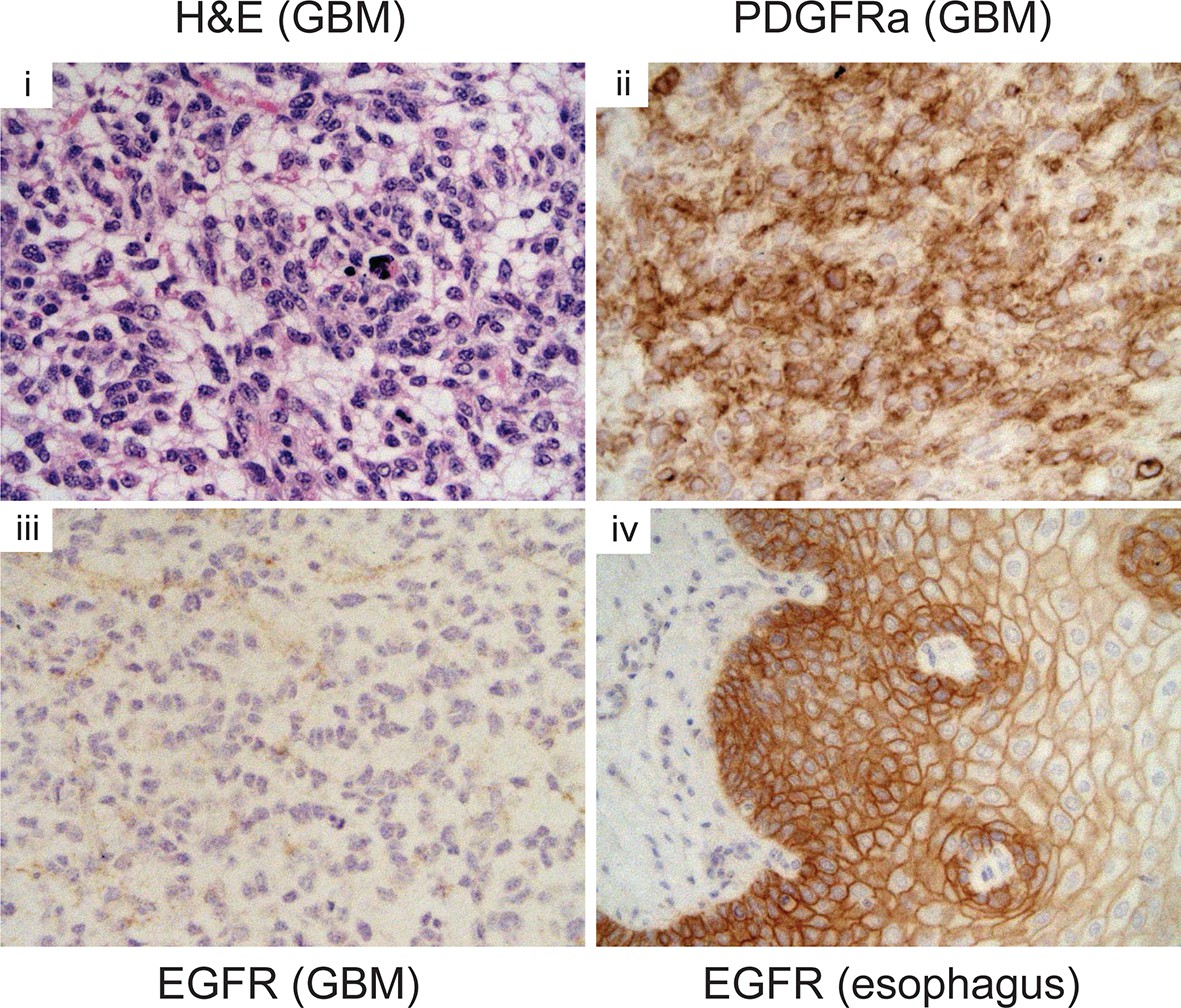
Pdgfra expression is elevated in p53ΔNtumors, but Egfr is not.
Immunohistochemistry of GBM sections showing elevated Pdgfra, but not Egfr, expression in a p53ΔN tumor. Esophagus section is shown as positive control for Egfr staining. GBM, Glioblastoma multiforme
Figure 3—figure supplement 3
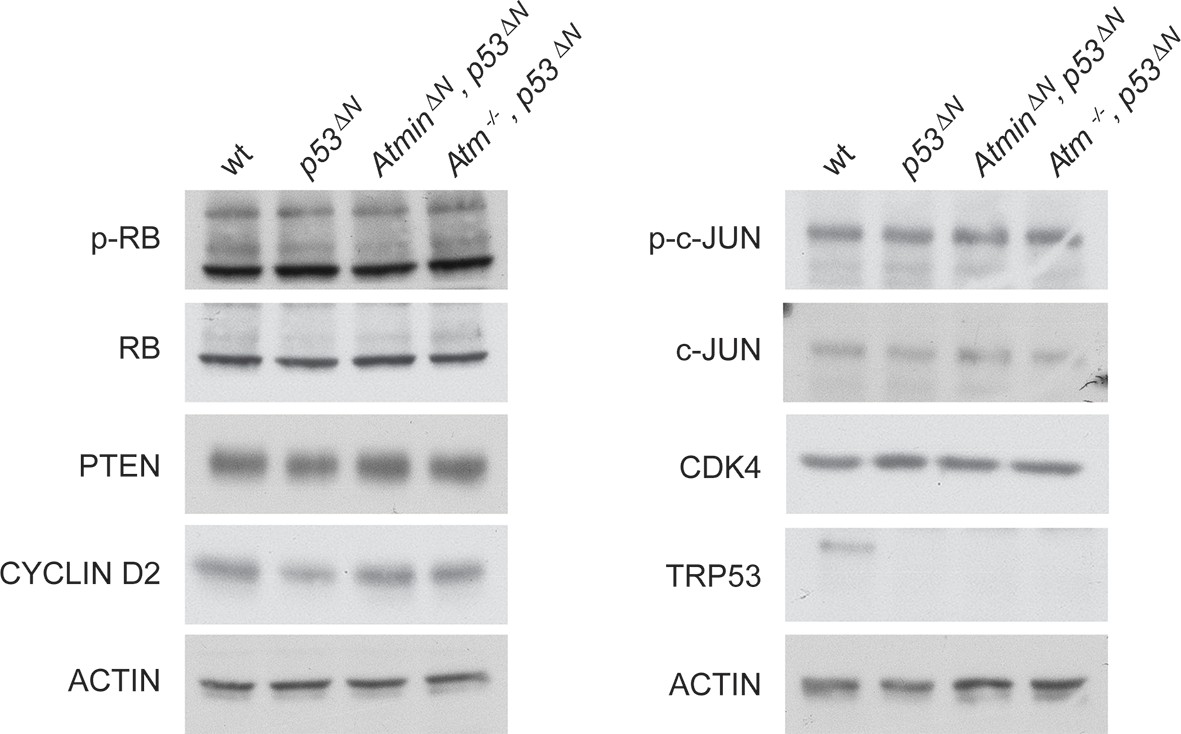
Some markers frequently altered in GBM are unaltered in p53ΔN NSCs.
Western blots of NSCs of the indicated genotypes showing levels of proteins commonly altered in glioma but unaffected by Atmin/Atm deletion. GBM, Glioblastoma multiforme; NSC, Neural stem cell
Figure 3—figure supplement 4
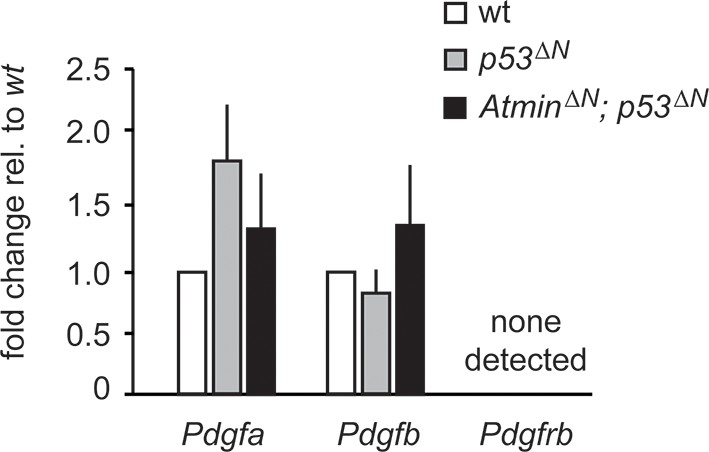
Pdgf ligand expression is not significantly altered in p53ΔN NSCs.
q-PCR showing similar expression levels of the Pdgfr ligands Pdgfa and Pdgfb in p53ΔN and AtminΔN; p53ΔN cells. Pdgfrb was not detected. Error bars represent the SEM of at least three biological repeats. NSC, Neural stem cell.
Figure 3—figure supplement 5
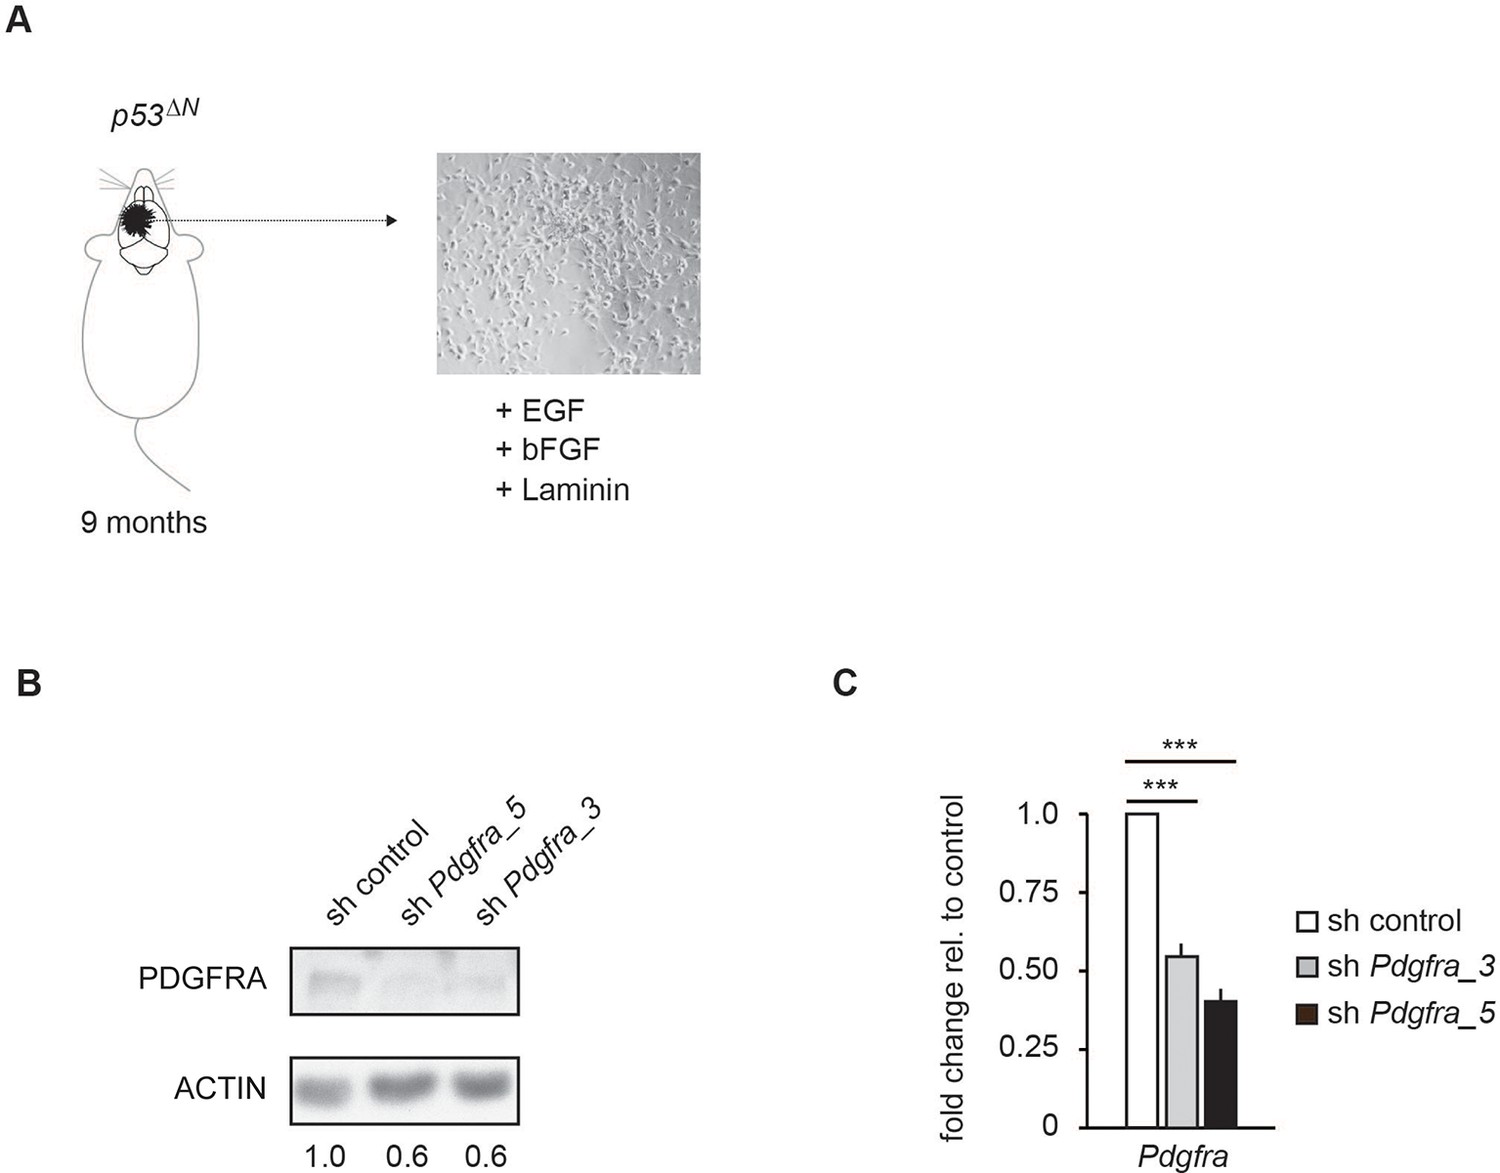
Two independent shRNAs cause Pdgfra knockdown.
(A) Isolation and culture of p53ΔN primary tumor cells from affected mice. (B–C) Western blot (B) and qPCR (C) showing knockdown of Pdgfra using two independent shRNA constructs. Error bars represent the SEM of at least two biological repeats. *** p<0.001
Figure 3—figure supplement 6
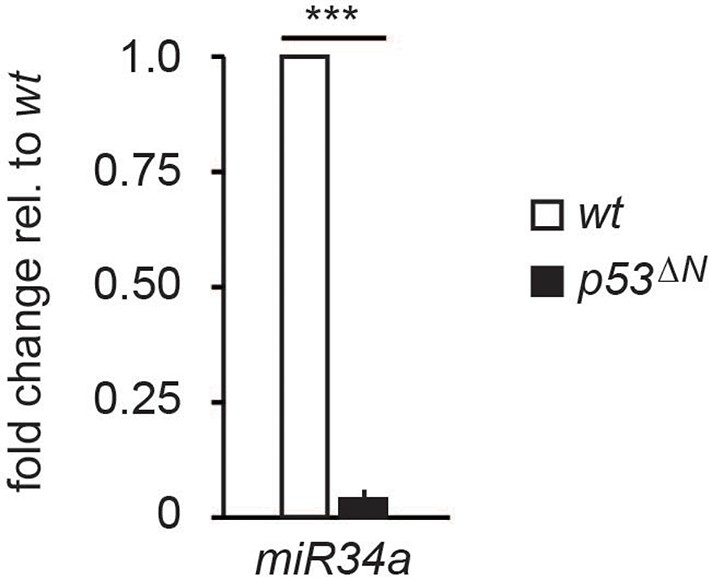
miR34a expression is reduced in p53ΔN NSCs.
Error bars represent the SEM of at least three biological repeats. *** p<0.001
Figure 4 with 1 supplement

Atm inhibition reduces Pdgfra expression and reduces tumorigenic potential in murine p53ΔN primary tumor cells and NSCs.
(A–B) Atm inhibitor (ATMi) treatment reduces Pdgfra protein levels (A) and Pdgfra expression (B) in p53ΔN primary tumor cells. (C) ATMi treatment reduces in vitro proliferation of p53ΔN primary tumor cells. Error bars represent the SEM of two biological repeats. (D) ATMi reduces Pdgfra expression in p53ΔN NSCs, assayed by qPCR. (E–F) Pdgfra expression (E) and Pdgfra protein levels (F) are reduced in Atm-/-; p53ΔN and AtminΔN; p53ΔN compared with p53ΔN NSCs. cDNA is normalized to Actin levels. Error bars represent the SEM of at least three biological repeats. s.e. and l.e. denote short and long exposures of the same blot, respectively. (G) Genetic loss of Atm reduces in vitro proliferation of p53ΔN NSCs. Error bars represent the SEM of two biological repeats. (H) Kaplan-Meier curves indicating increased survival of NOD/SCID mice orthotopically transplanted with Atm-/-; p53ΔN NSCs compared with p53ΔN NSCs. n.s., not significant; * p<0.05, ** p<0.01, *** p<0.001. NSC, Neural stem cell.
Figure 4—figure supplement 1
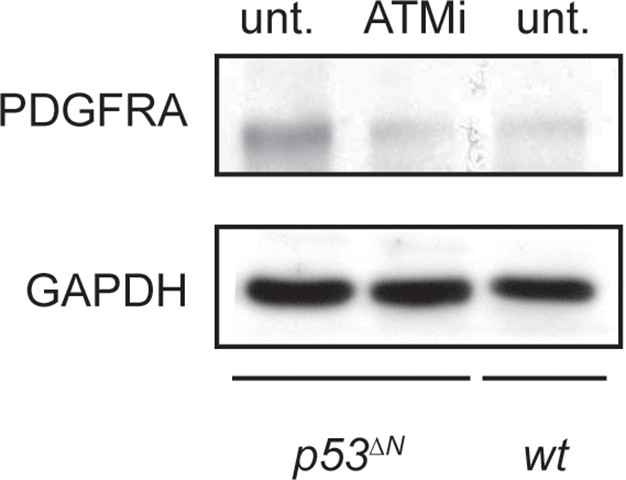
ATM inhibitor (ATMi) treatment reduces Pdgfra protein levels in p53ΔN NSCs. NSCs, Neural stem cells.
https://doi.org/10.7554/eLife.08711.024
Figure 5
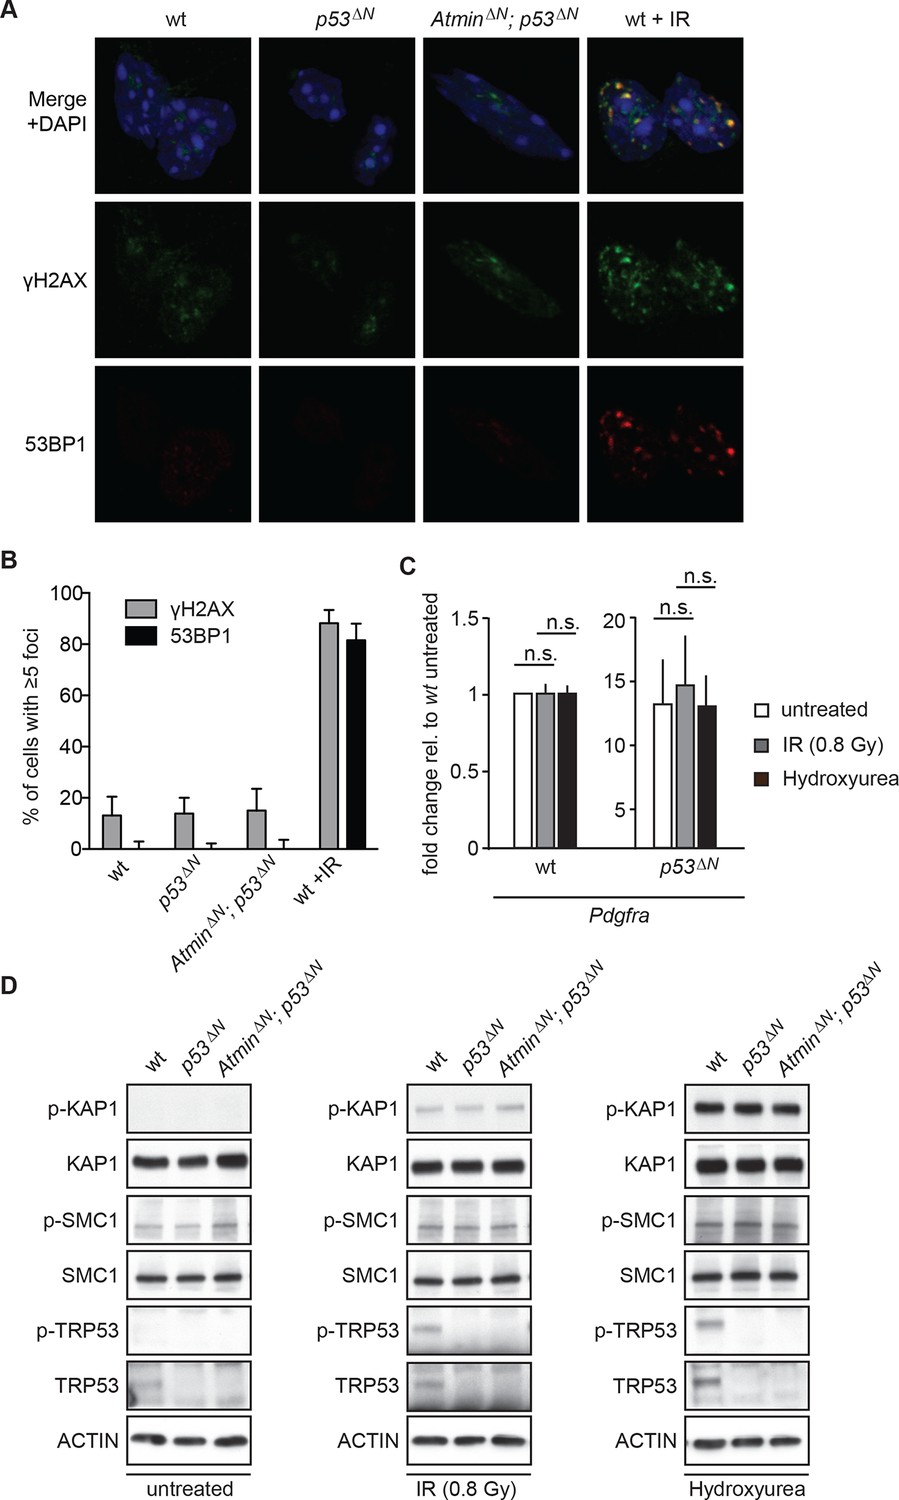
Atm signaling in response to DNA damaging agents is remarkably unaffected in p53ΔN and AtminΔN; p53ΔN cells and DNA damaging treatments do not affect Pdgfra expression.
(A) p53ΔN and AtminΔN; p53ΔN NSCs do not show elevated γh2ax and 53bp1 foci in untreated conditions, suggesting low endogenous damage. Cells treated with 5Gy IR (wt +IR) are shown as a positive control. (B) Quantification of γh2ax and 53bp1 foci in (A). Error bars indicate 95% confidence intervals. (C) qPCR of Pdgfra in wt and p53ΔN NSCs in untreated conditions and after DNA damage-inducing stimuli. cDNA is normalized to Actin levels. Error bars represent SEM of three biological repeats. (D) Western blots depicting Atm substrate phosphorylation after the indicated stimuli in NSCs of different genotypes.
Figure 6 with 5 supplements
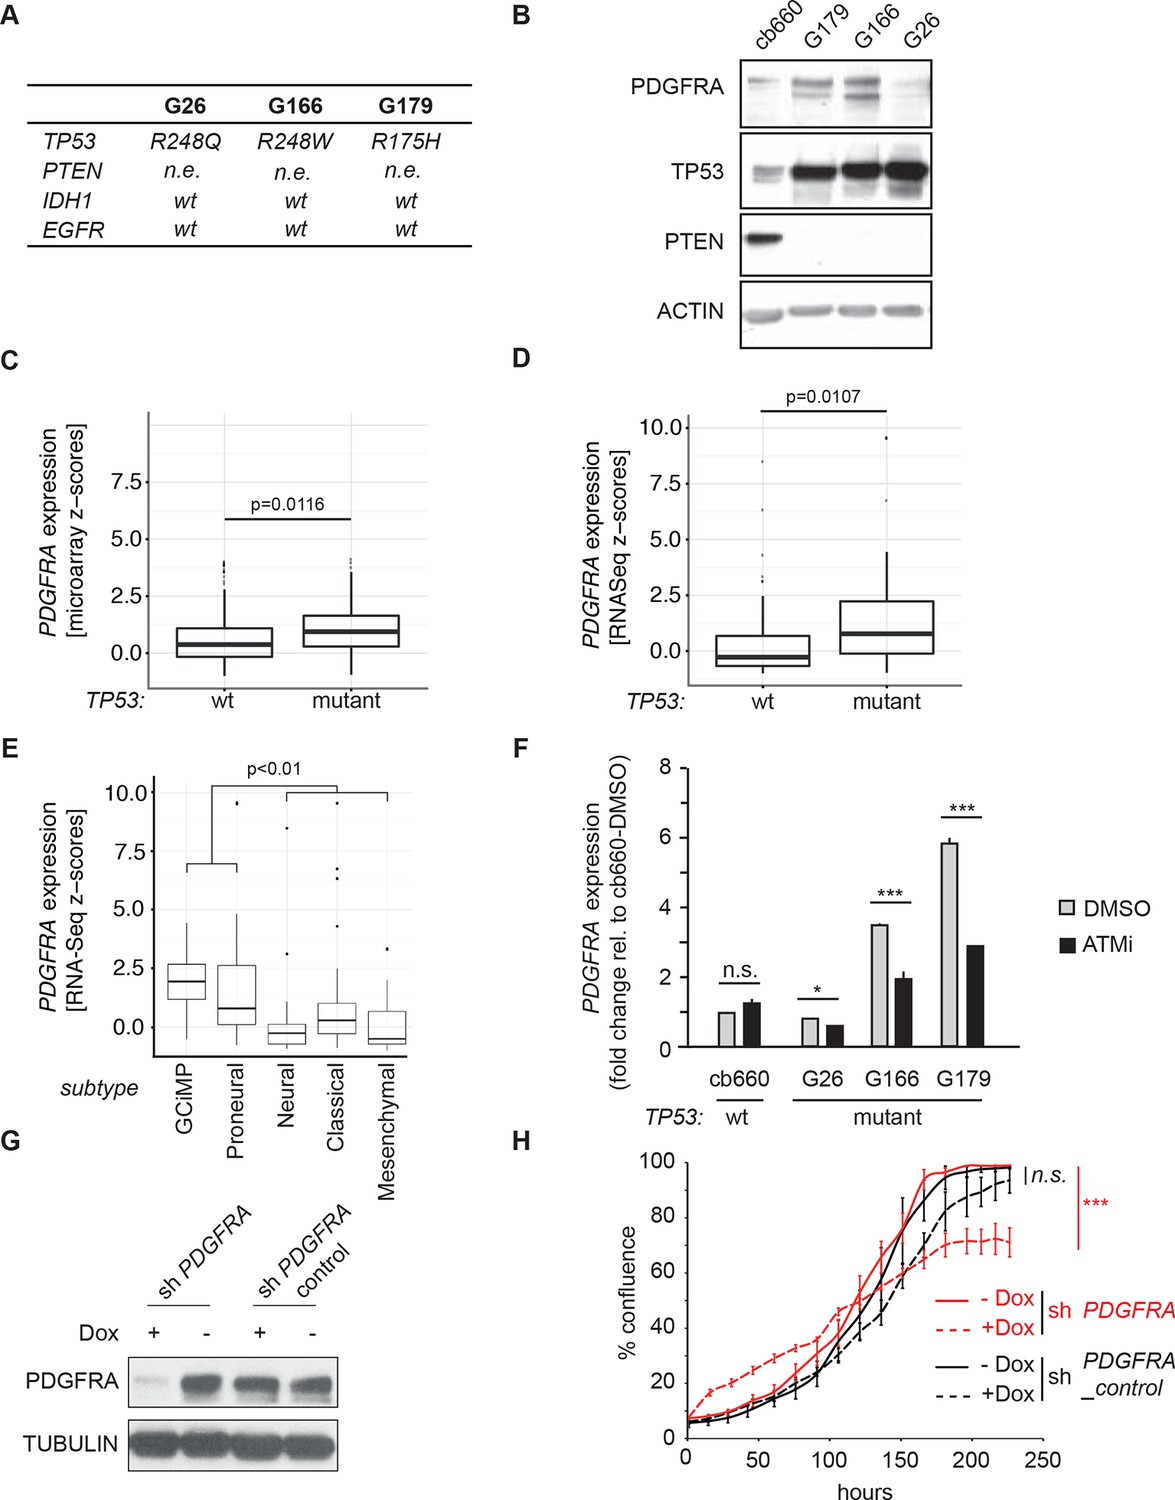
ATM inhibitor treatment reduces elevated PDGFRA expression and decreases proliferation in human GBM tumor cells.
(A) Mutational status of TP53, PTEN, IDH1, and EGFR in the indicated glioma neural stem stell (GNSC) lines. n.e., not expressed. wt, wild type. (B) Western blot depicting PDGFRA, TP53, PTEN, and ACTIN expression in three GNSC lines (G26, G166, and G179) and cb660 control cells. (C,D) Box plots showing PDGFRA expression in TP53-wt and TP53-mutant TCGA human glioblastoma datasets, measured by microarray (n=153). (C) or RNA-Seq (n=500). (D) Data from 518 patient samples in total with an overlap of 135 patients. (E) Box plots showing PDGFRA expression z-scores in TCGA human glioblastoma subtypes, measured by RNA-Seq (n=150). p-Values in (C–E) calculated using Wilcoxon’s test. (F) qRT-PCR showing decreased PDGFRA expression in TP53-mutant GNSC lines after ATM inhibitor (ATMi) treatment. cDNA is normalized to GAPDH levels. Error bars represent the STDEV of two biological repeats. (G) Western blot showing knockdown of PDGFRA using a doxycycline (Dox)-inducible shRNA construct. (H) PDGFRA knockdown using doxycycline (Dox)-inducible shRNA reduces proliferation of TP53-mutant G179 GNSCs. Cell confluence measured by IncuCyte timelapse microscopy. Error bars represent the SEM of three biological repeats. * p<0.05, *** p<0.001, n.s., not significant.
Figure 6—figure supplement 1
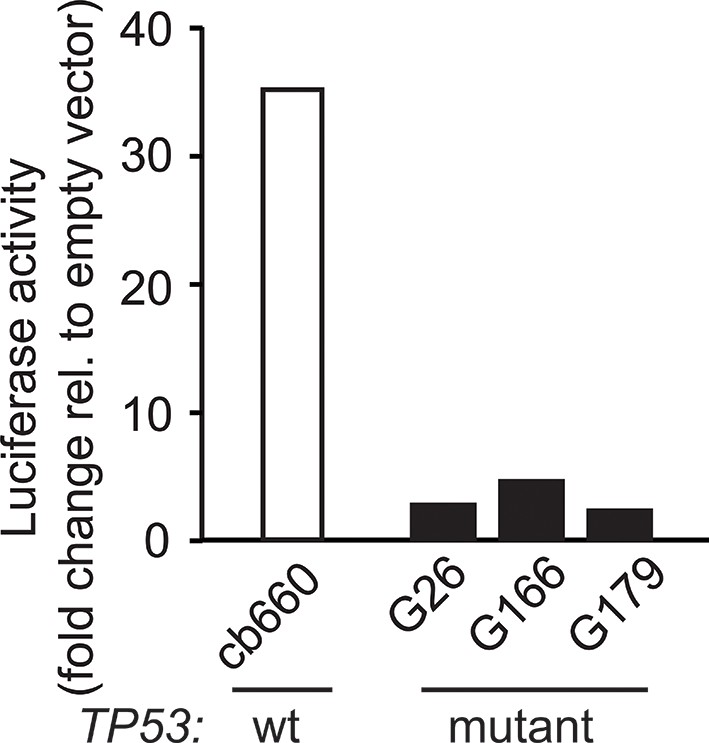
Luciferase reporter assay for TP53 activity using the p53-550RE construct in human GNSC (G26, G166, G179) and control NSC (cb660) lines. NSC, Neural stem cell.
https://doi.org/10.7554/eLife.08711.027
Figure 6—figure supplement 2
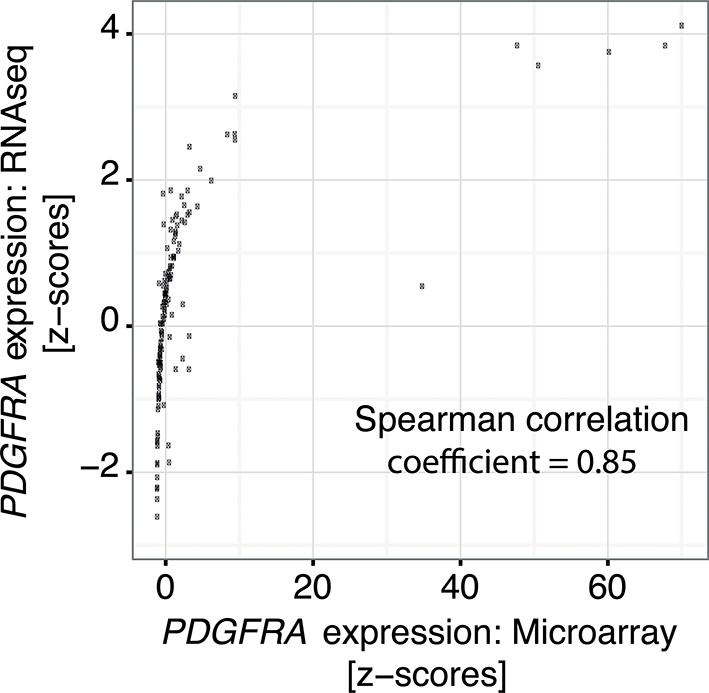
Correlation of PDGFRA expression levels in TCGA glioblastoma samples represented in both microarray and RNASeq datasets.
https://doi.org/10.7554/eLife.08711.028
Figure 6—figure supplement 3
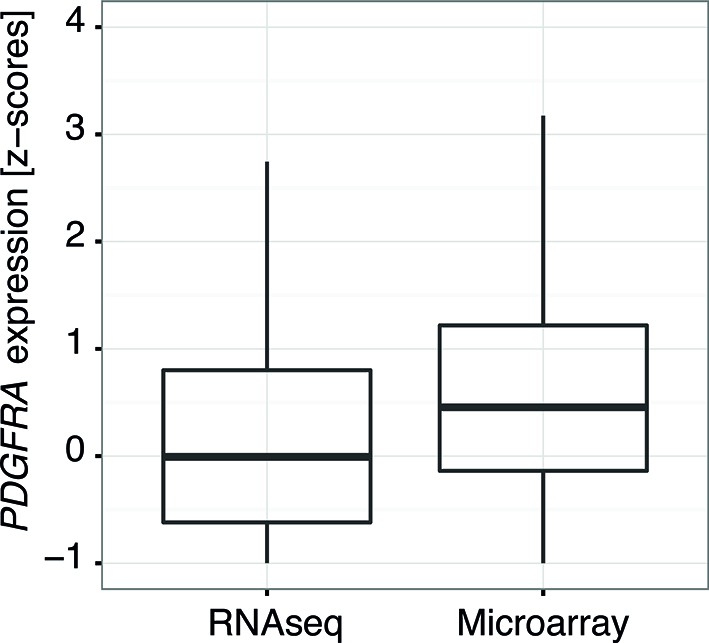
Comparison of the distribution of PDGFRA expression levels in human glioblastoma samples measured by RNASeq and by microarray.
Data from TCGA.
Figure 6—figure supplement 4
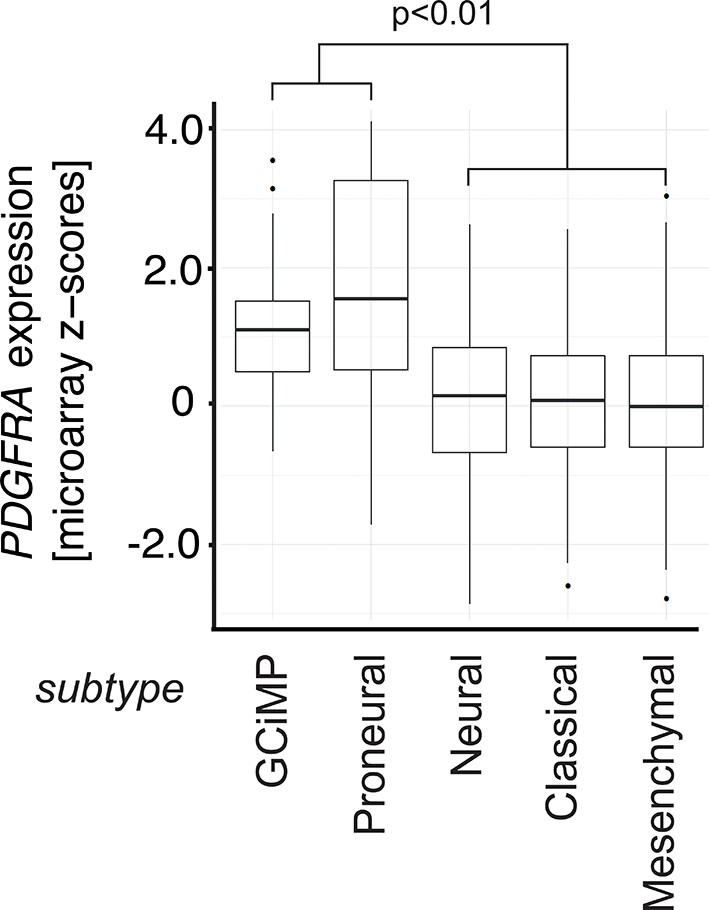
Box plots showing PDGFRA expression z-scores in TCGA human glioblastoma subtypes measured by microarray (n=487).
p-Value is calculated using Wilcoxon’s test, combining GCiMP and Proneural versus Neural, Classical, and Mesenchymal.
Figure 6—figure supplement 5
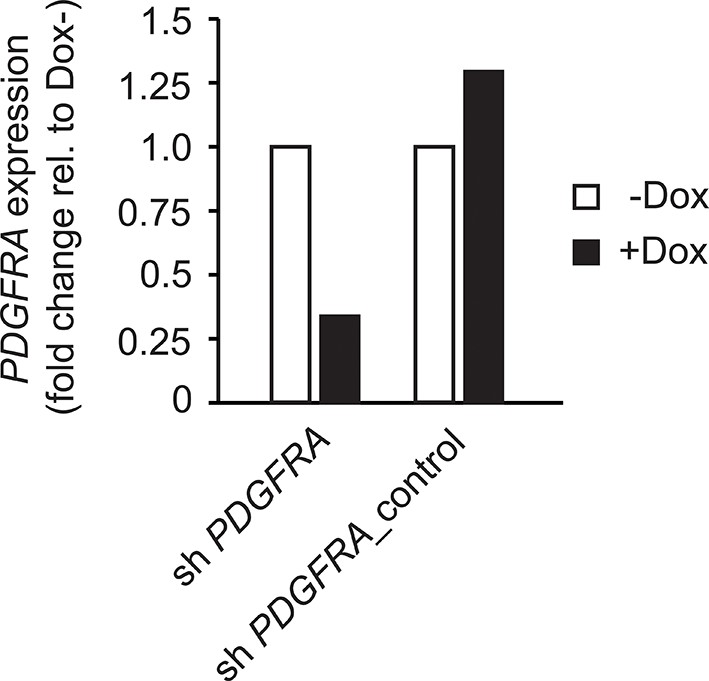
Control for Figure 6G and H showing efficient knockdown of PDGFRA after doxycycline administration.
q-PCR showing knockdown of PDGFRA in GNSCs using a doxycycline (Dox)-inducible shRNA construct.
Figure 7 with 3 supplements
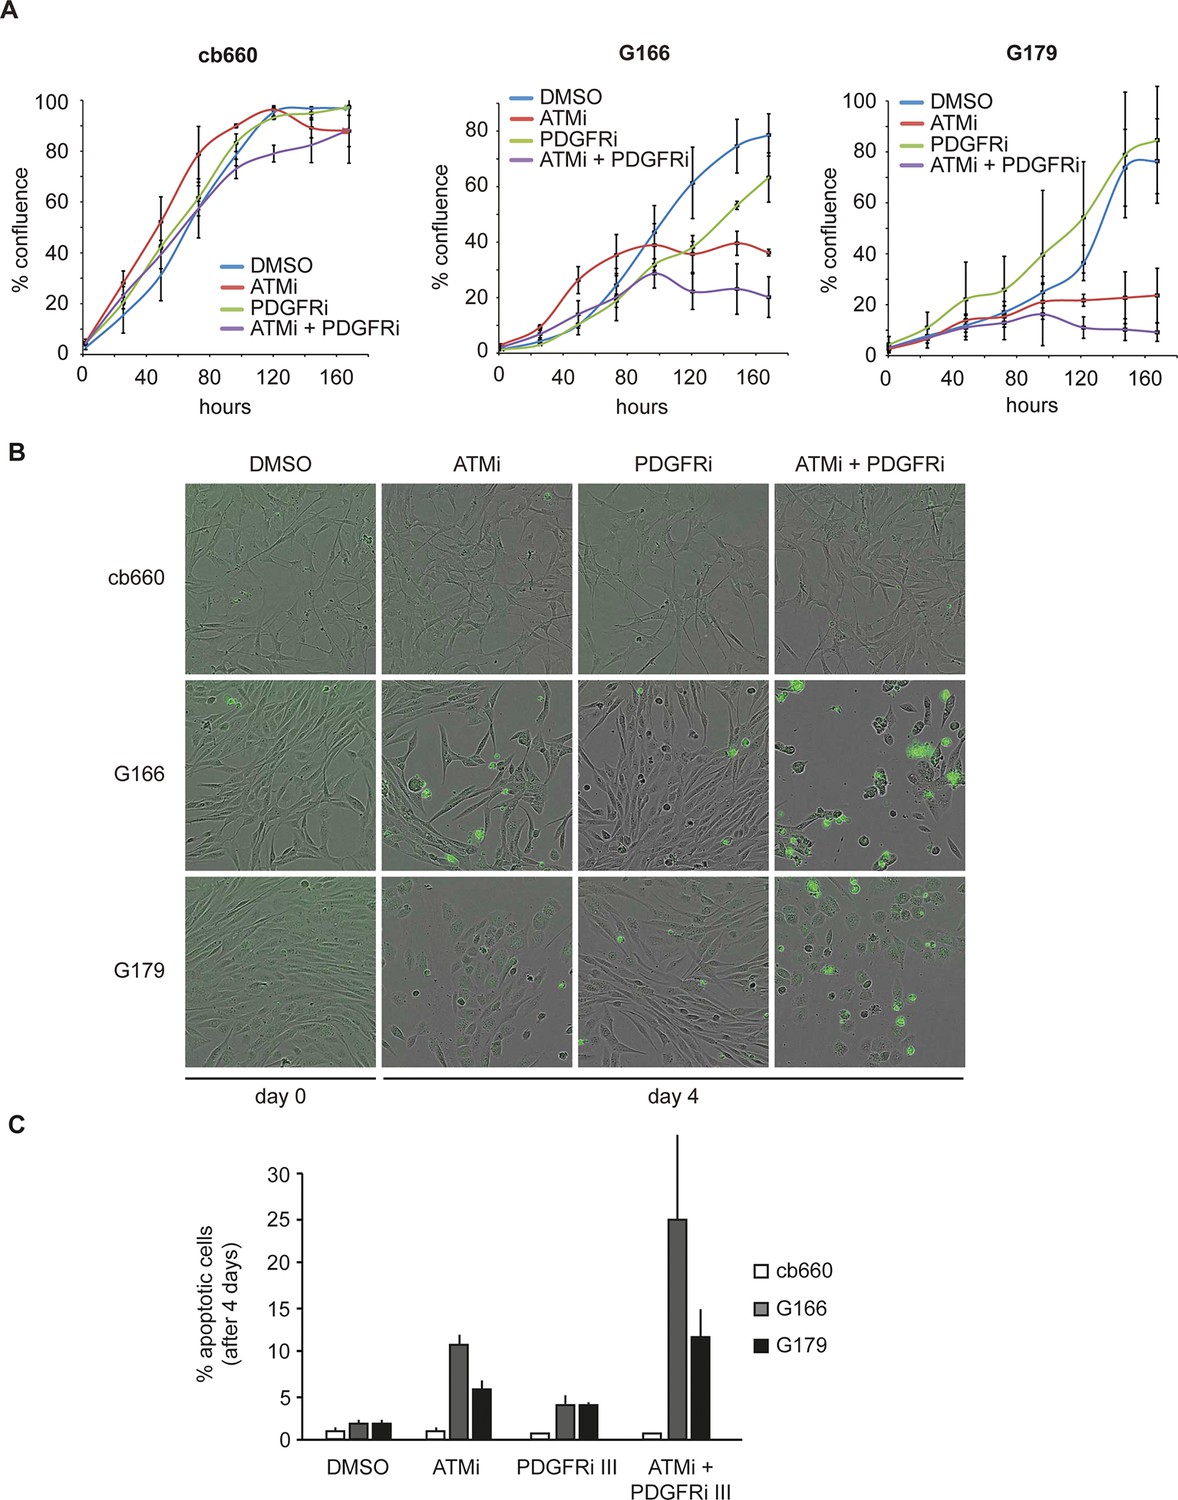
Combinatorial treatment with both ATM and PDGFR inhibitors induces apoptosis of human glioma stem cells.
(A) Growth curves showing the proliferation of wild-type control human neural stem cells (cb660) and two independent cell lines isolated from TP53-deficient human gliomas (G166 & G179) over 7 days in the presence of vehicle control (DMSO), ATM inhibitor (ATMi), PDGFR inhibitor (PDGFRi), or both inhibitors. Error bars depict STDEV from two biological repeats. (B) Representative bright-field/fluorescent images of the same cell types treated as above after 4 days. Cells undergoing apoptosis are labeled by emitting GFP. (C) Quantification of apoptotic cells after the treatments indicated above, represented as % apoptotic cells from total live cells. Error bars depict STDEV from three biological repeats. After four days, it became impossible to quantify apoptotic GNSCs receiving the combination treatment, since they detached completely from the culture plate. These percentages thus represent an underestimate of the total extent of G166 and G179 cell death with ATMi + PDGFRi.
Figure 7—figure supplement 1
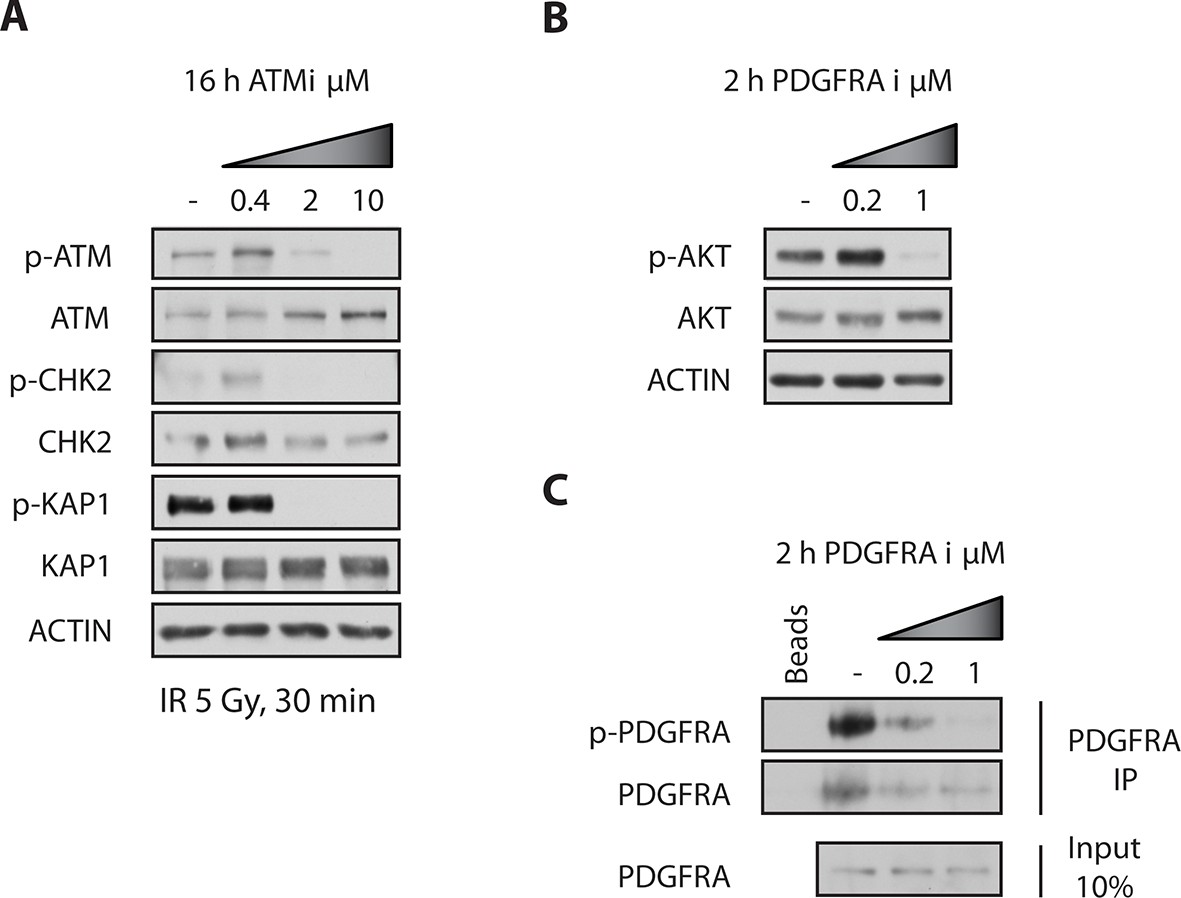
ATM and PDGFR inhibitors were used at minimally required concentration to achieve pathway inhibition.
(A) G179 cells were treated with DMSO or 400 nM, 2 μM or 10 μM of ATMi for 16 hrs, then subjected to 5Gy of ionizing irradiation, harvested 30 min later and analyzed by Western blotting. Pre-treatment of cells with the ATMi at 10 μM clearly prevented IR-induced ATM auto-phosphorylation at Serine 1981 and phosphorylation of its downstream substrates: KAP1 and CHK2, at Serine 824 and Threonine 68, respectively. (B) G179 cells were treated with DMSO, 200 nM or 1 μM of PDGFRA inhibitor III for 2 hrs, harvested and analyzed by Western blotting. 1 μM inhibitor prevented the phosphorylation of AKT (downstream substrate of PDGFRA) at Serine 473. (C) P-PDGFRA levels were below detection, therefore total PDGFRA was immunoprecipitated from cell lysates prior to Western blotting. Treatment of cells with the PDGFRA inhibitor III at 1 μM clearly reduced phosphorylation of PDGFRA at Tyrosine 754.
Figure 7—figure supplement 2
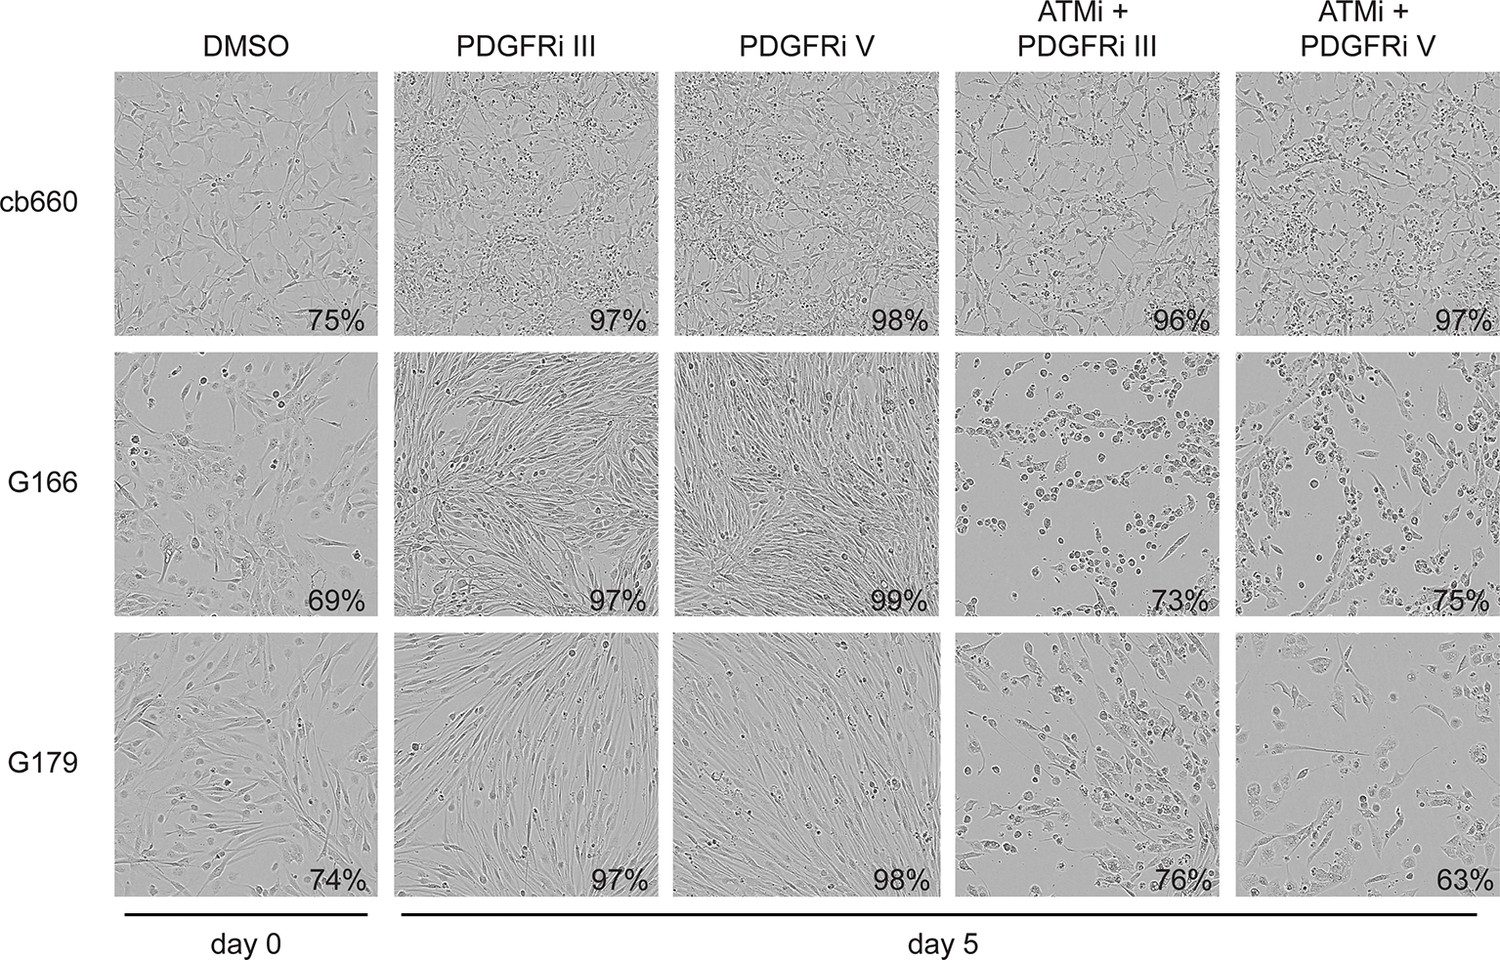
Bright-field images of timelapse microscopy using cells seeded at high confluency.
Representative bright-field images of cb660, G166, and G179 GNSC lines seeded at high confluency and treated over 7 days with vehicle control (DMSO), ATM inhibitor (ATMi), PDGFR inhibitors III or V, or both ATM and PDGFR inhibitors. Values indicate% confluence at the indicated point in the time course as measured using IncuCyte software.
Figure 7—figure supplement 3
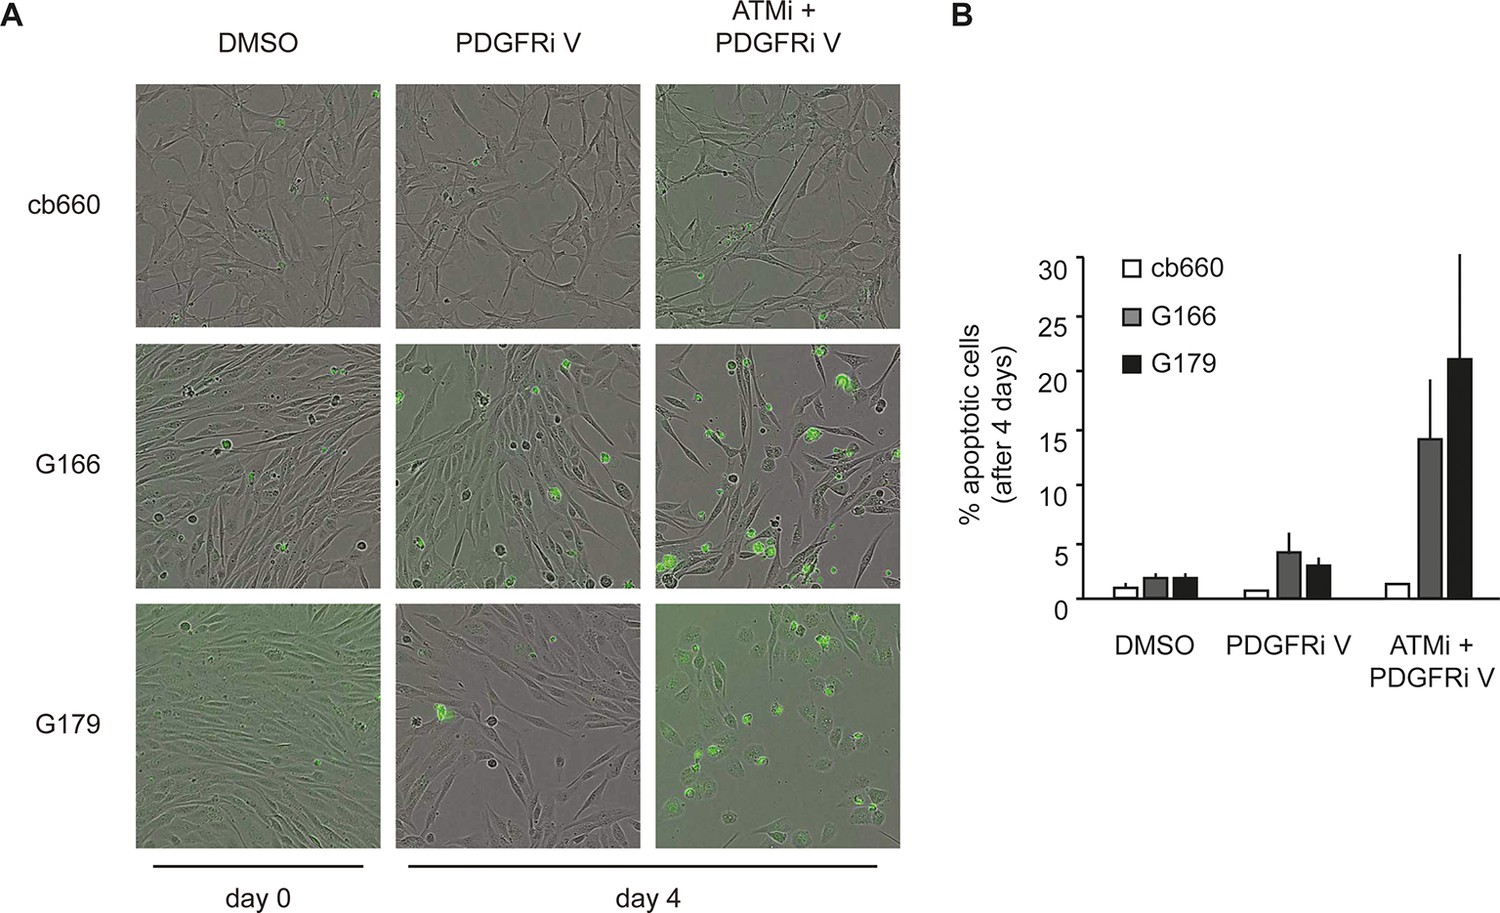
Apoptosis quantification of a second PDGFR inhibitor.
(A) Representative bright-field/fluorescent images of the same cell types treated over 4 days with vehicle control (DMSO), PDGFR inhibitor V (PDGFRi V), or ATM inhibitor in combination with PDGFR inhibitor V (ATMi + PDGFRi V). Cells undergoing apoptosis are labelled by emitting GFP. (B) Quantification of apoptotic cells four days after the treatments indicated above, represented as % apoptotic cells from total live cells. After four days, it became impossible to quantify apoptotic GNSCs receiving the combination treatment, since they detached completely from the culture plate. These percentages thus represent a large underestimate of the extent of G166 and G179 cell death with ATMi + PDGFRi V.
Additional files
-
Supplementary file 1
Causes of death for experimental cohorts in Figures 1 and 2.
- https://doi.org/10.7554/eLife.08711.036
-
Supplementary file 2
Primer sequences.
- https://doi.org/10.7554/eLife.08711.037
Download links
A two-part list of links to download the article, or parts of the article, in various formats.
Downloads (link to download the article as PDF)
Open citations (links to open the citations from this article in various online reference manager services)
Cite this article (links to download the citations from this article in formats compatible with various reference manager tools)
Inactivation of the ATMIN/ATM pathway protects against glioblastoma formation
eLife 5:e08711.
https://doi.org/10.7554/eLife.08711


