Molecular architecture of the yeast Mediator complex
- Stanford University School of Medicine, United States
- University of California, San Francisco, United States
- Structural Bioinformatics Unit, France
Figures
Figure 1 with 2 supplements
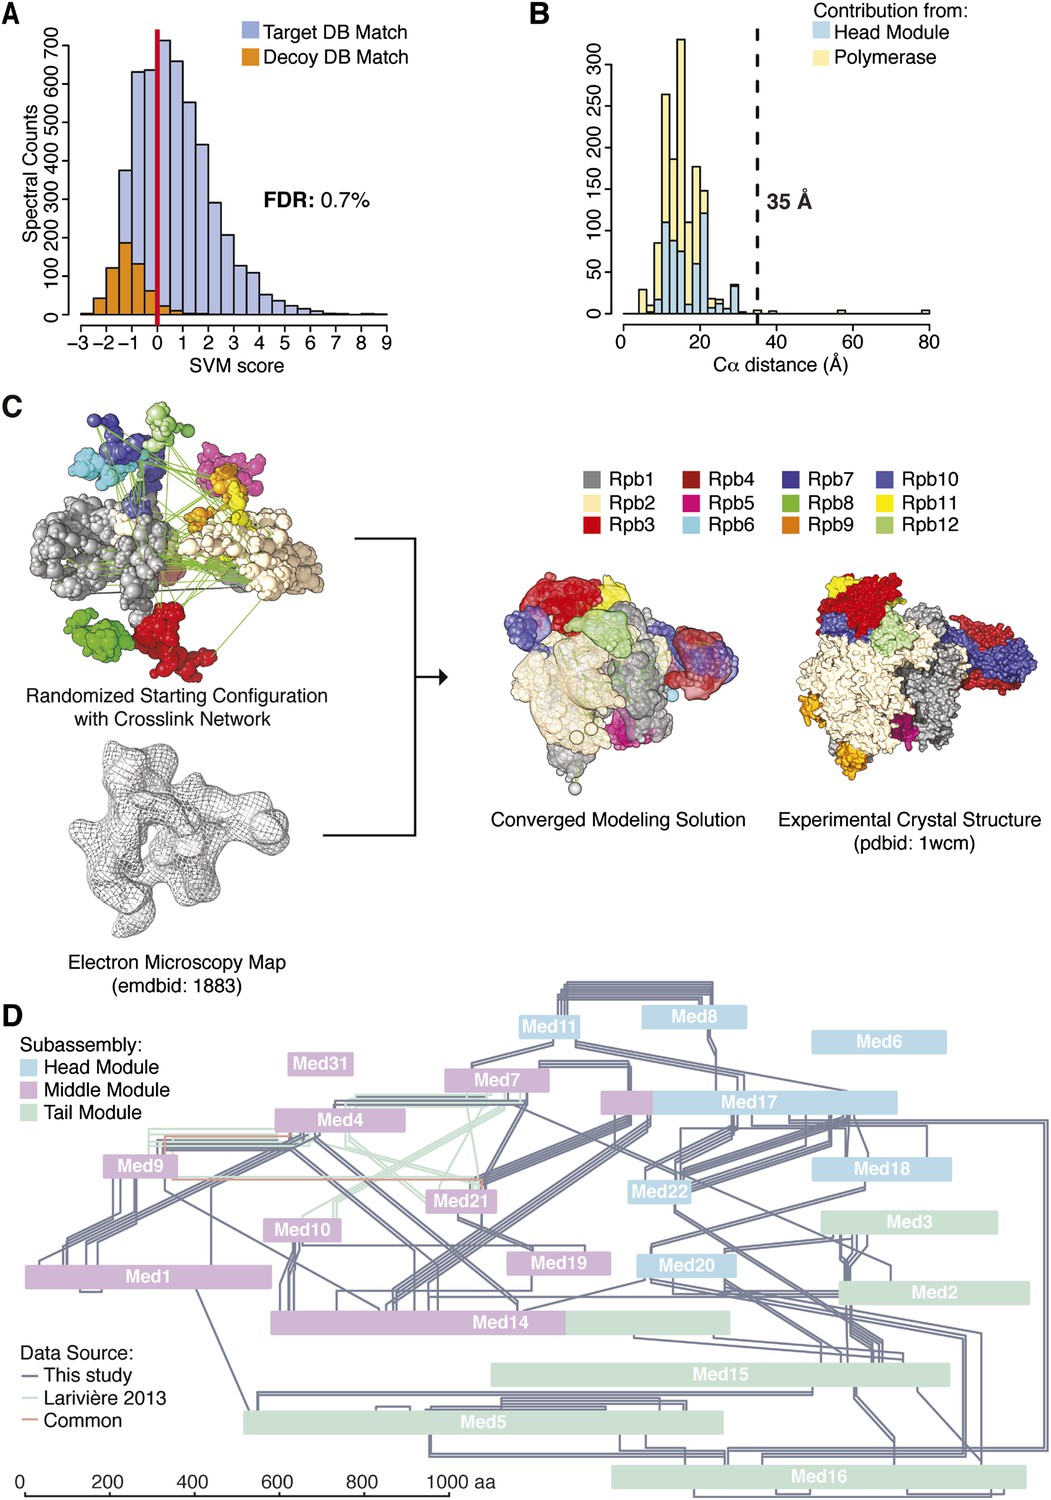
Holoenzyme cross-linking and modeling results and methodology.
(A) Cross-links were identified by searching MS2 product ion spectra against concatenated target and decoy databases containing 52 Saccharomyces cerevisiae transcription proteins +520 sequence randomized versions, respectively. Confidence in the spectral assignment is represented by an support vector machine (SVM) classifier (Trnka et al., 2014). The distribution of the target and decoy spectral matches in relation to the acceptance threshold (red line) is shown with an overall spectral false discovery rate (FDR) of 0.7%. (B) Mapping identified cross-linked spectra onto regions of known structure such as the Mediator Head module and RNA polymerase II yields distance distributions that reflect the accuracy of cross-link identification. The Cα violation distance of 35 Å is indicated with a dashed line. (C) Demonstration of RNA pol II structural recapitulation from a random starting configuration (top panel) of individual pol II subunits represented as rigid bead models and restrained by cross-links (green links) and electron microscopy (EM) density map (mesh). A representation of the converged modeling solution is presented alongside the 12-subunit pol II X-ray structure (PDB: 1WCM) for reference. (D) Schematic representation of the Mediator complex cross-linking network. Mediator subunits are colored according to their location within the Head, Middle and Tail modules. All Inter-subunit cross-links and selected intra-subunit cross-links from the current study as well from (Lariviere et al., 2013) are represented, colored according to their origin.
-
Figure 1—source data 1
Categorization of cross-links with respect to module and data source.
Numbers of unique cross-linked residue pairs (‘cross-links’) and cross-linked spectral matches used for integrative modeling of Mediator apo-complex (‘Total Mediator’) as well as total number of holoenzyme cross-links identified in this study (‘Total [this study]’).
- https://doi.org/10.7554/eLife.08719.004
Figure 1—figure supplement 1
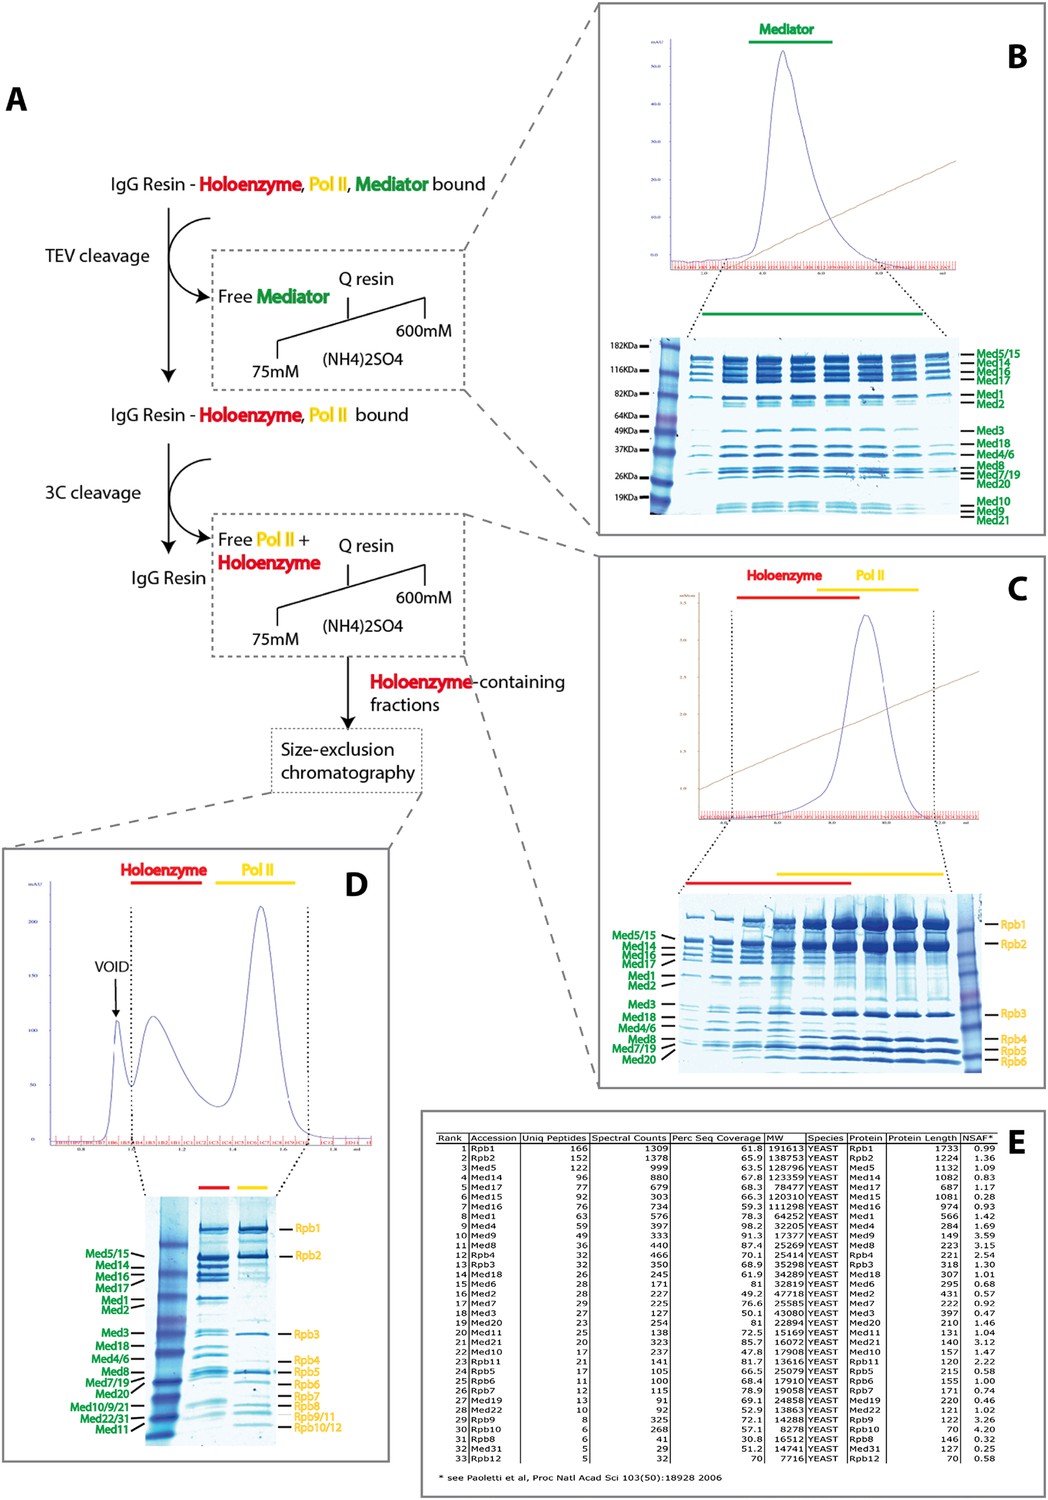
Purification of Native S. cerevisiae Holoenzyme complex.
(A) Schematic of the affinity capture and chromatographic fractionation of S. cerevisiae holoenzyme complex from whole-cell extract using a double-affinity tag and stepwise cleavage protocol. In the procedure, a mixture of holoenzyme and free Mediator and RNA Pol II are affinity captured, with release of free Mediator through TEV cleavage (panel B) and subsequent release of holoenzyme and free Mediator upon 3C protease cleavage (panel C). Following the enrichment of Mediator-bound pol II using ion-exchange chromatography, the holoenzyme was purified to homogeneity using size-exclusion chromatography (panel D). Mass spectrometry analysis confirmed the presence of all 21 Mediator and 12 pol II subunits (panel E).
Figure 1—figure supplement 2
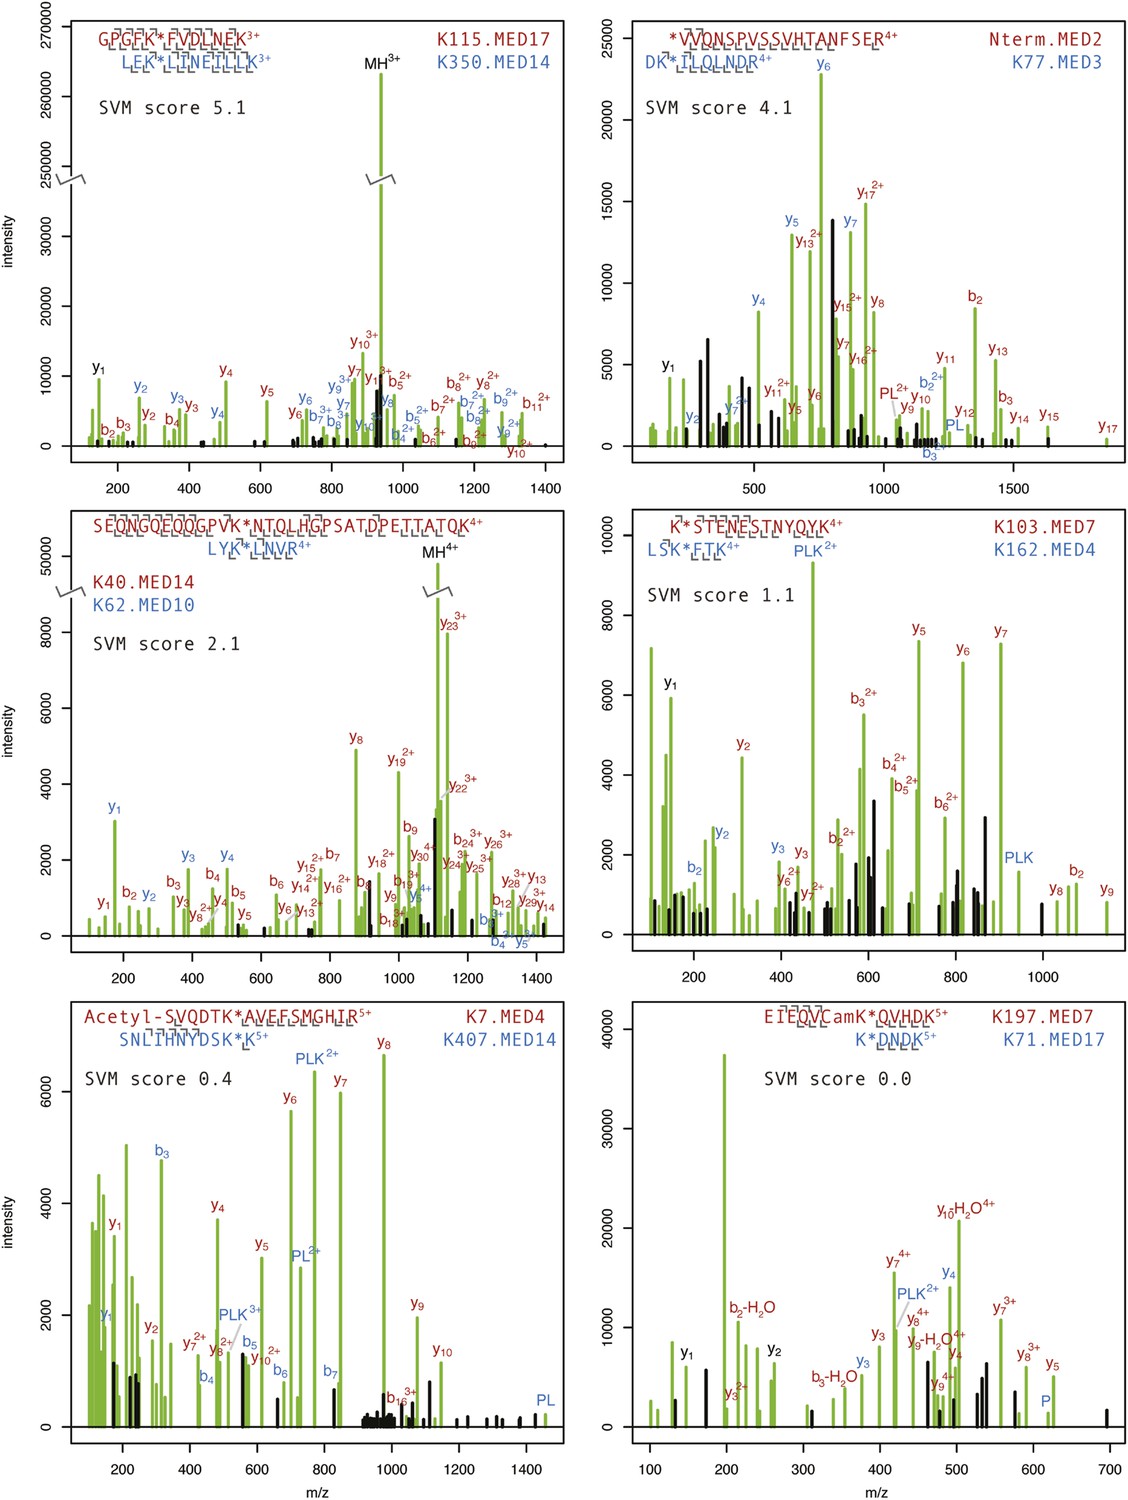
Annotated product ion spectra for selected cross-linked peptides.
HCD product ion spectra of BS3 cross-linked Mediator tryptic peptides classified by Protein Prospector. Spectra representing highly confident (SVM score 5.1) to less confident (SVM score 0.0) classifications are shown. The modified lysine position is denoted with a star. N-terminal acetylation and carbamidomethylation of cysteine residues (Cam) are denoted. P, PL, and PLK ions refer to ions formed from dissociation of the cross-linking reagent to lysine bond (Trnka et al., 2014). The full list of cross-linked Mediator peptides may be viewed online using search key = qzpxihtngx at: http://prospector2.ucsf.edu/prospector/cgi-bin/msform.cgi?form=msviewer.
Figure 2 with 5 supplements
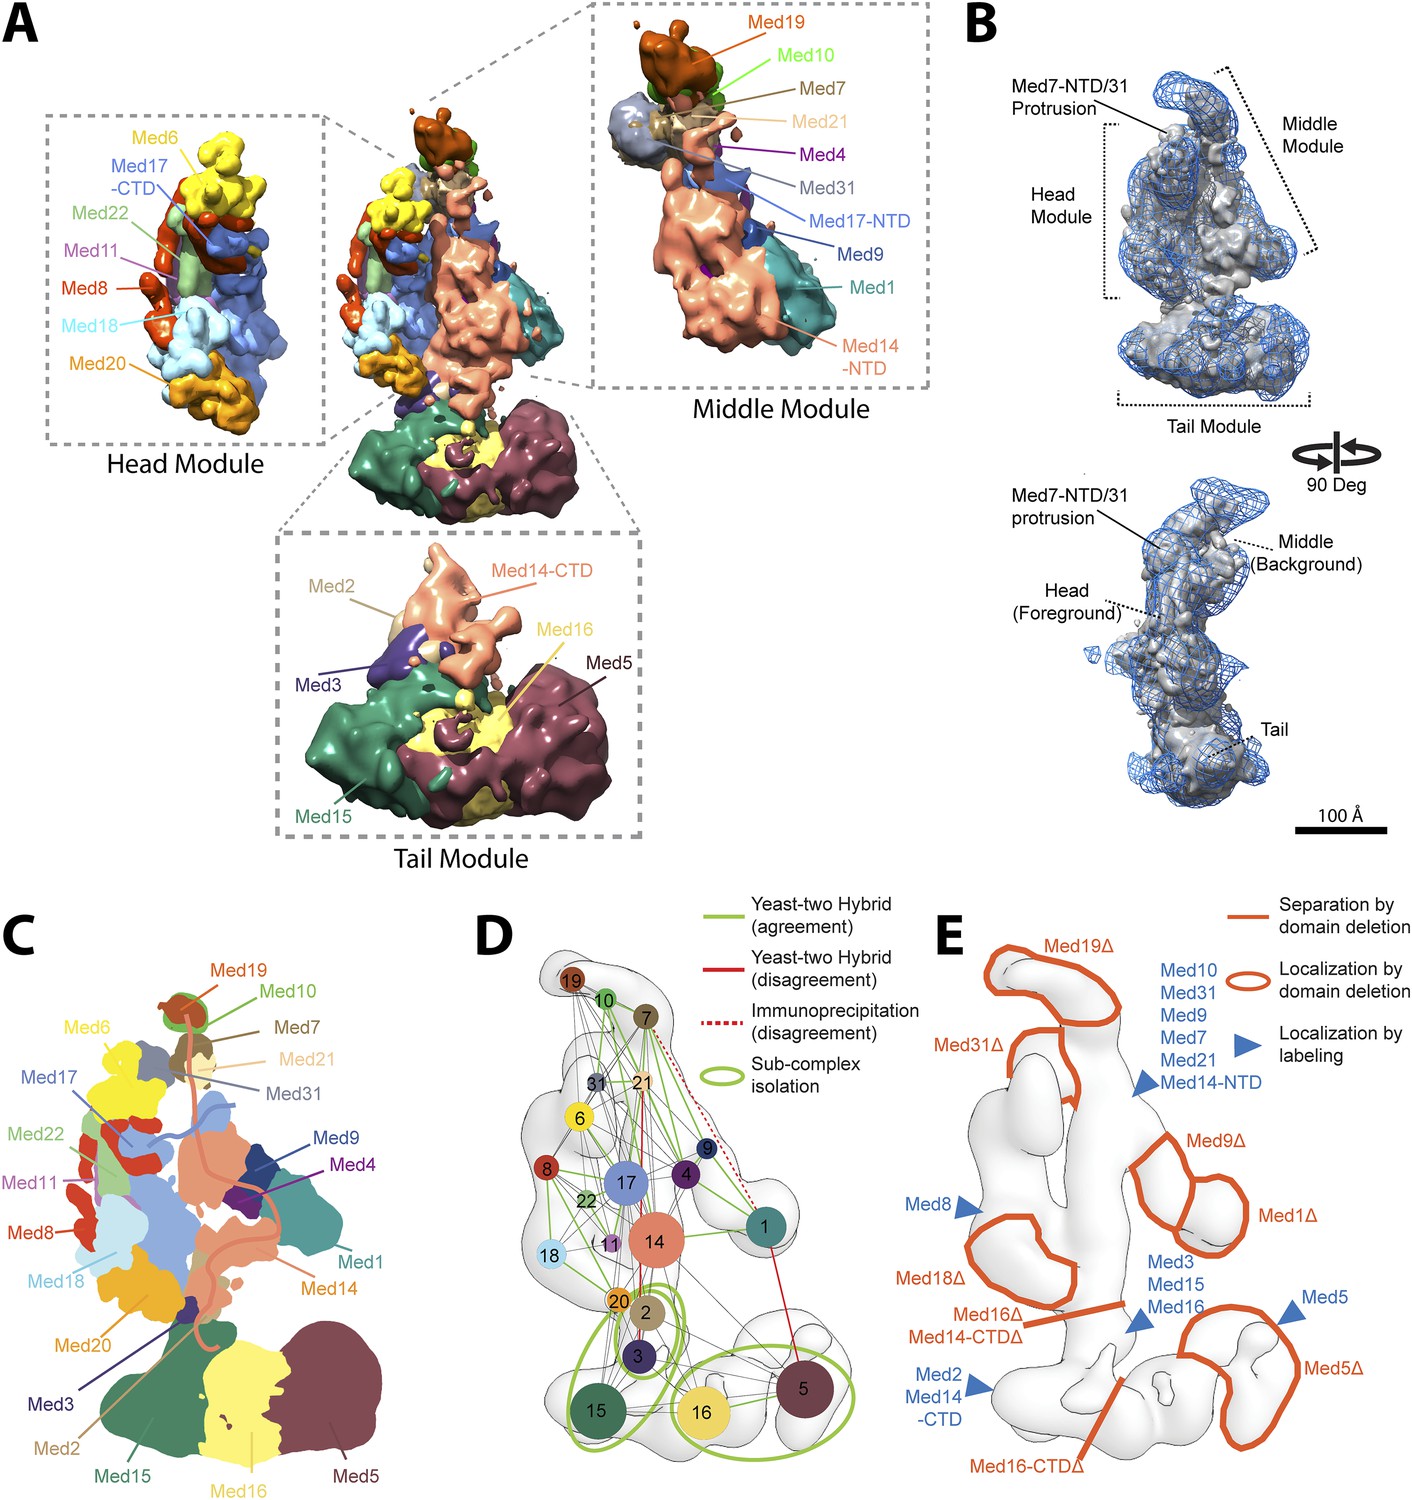
Mediator complex architecture.
(A) Mediator subunit localization density map colored by individual subunit. (B) Mediator localization density map (solid grey) calculated from the highest scoring model cluster and shown at a threshold level (T = 0.1) that most closely matches the volume of the EM density map used as 3D spatial restraint during modeling (EMD-2634, T = 0.35: Blue mesh). The position of the three Mediator modules (Head, Middle, and Tail) is indicated. (C) Schematics of the architecture of the Mediator complex obtained from the localization density analysis. Med14 and Med17-NTD are also schematically represented by splines. (D) Protein–protein interactions derived from published Yeast-two hybrid, immunoprecipitation and sub-complex isolation data (Uetz et al., 2000; Ito et al., 2001; Kang et al., 2001; Guglielmi et al., 2004; Zhang et al., 2004; Beve et al., 2005; Koschubs et al., 2010). The data is represented by a graph superposed on the EM density map of the complex (Tsai et al., 2014). Nodes are Mediator subunits, the edges are the observed proteomic interactions, and the green circles are isolated sub-complexes. Green and red edges are interactions that are in agreement and in disagreement with the Mediator model, respectively. (E) Localization by labeling (blue triangle) and domain deletion (areas encircled by light red closed lines) mapped on the EM density map (Tsai et al., 2014; Wang et al., 2014). Straight light-red lines represent domain deletion assays that split the complex.
Figure 2—figure supplement 1
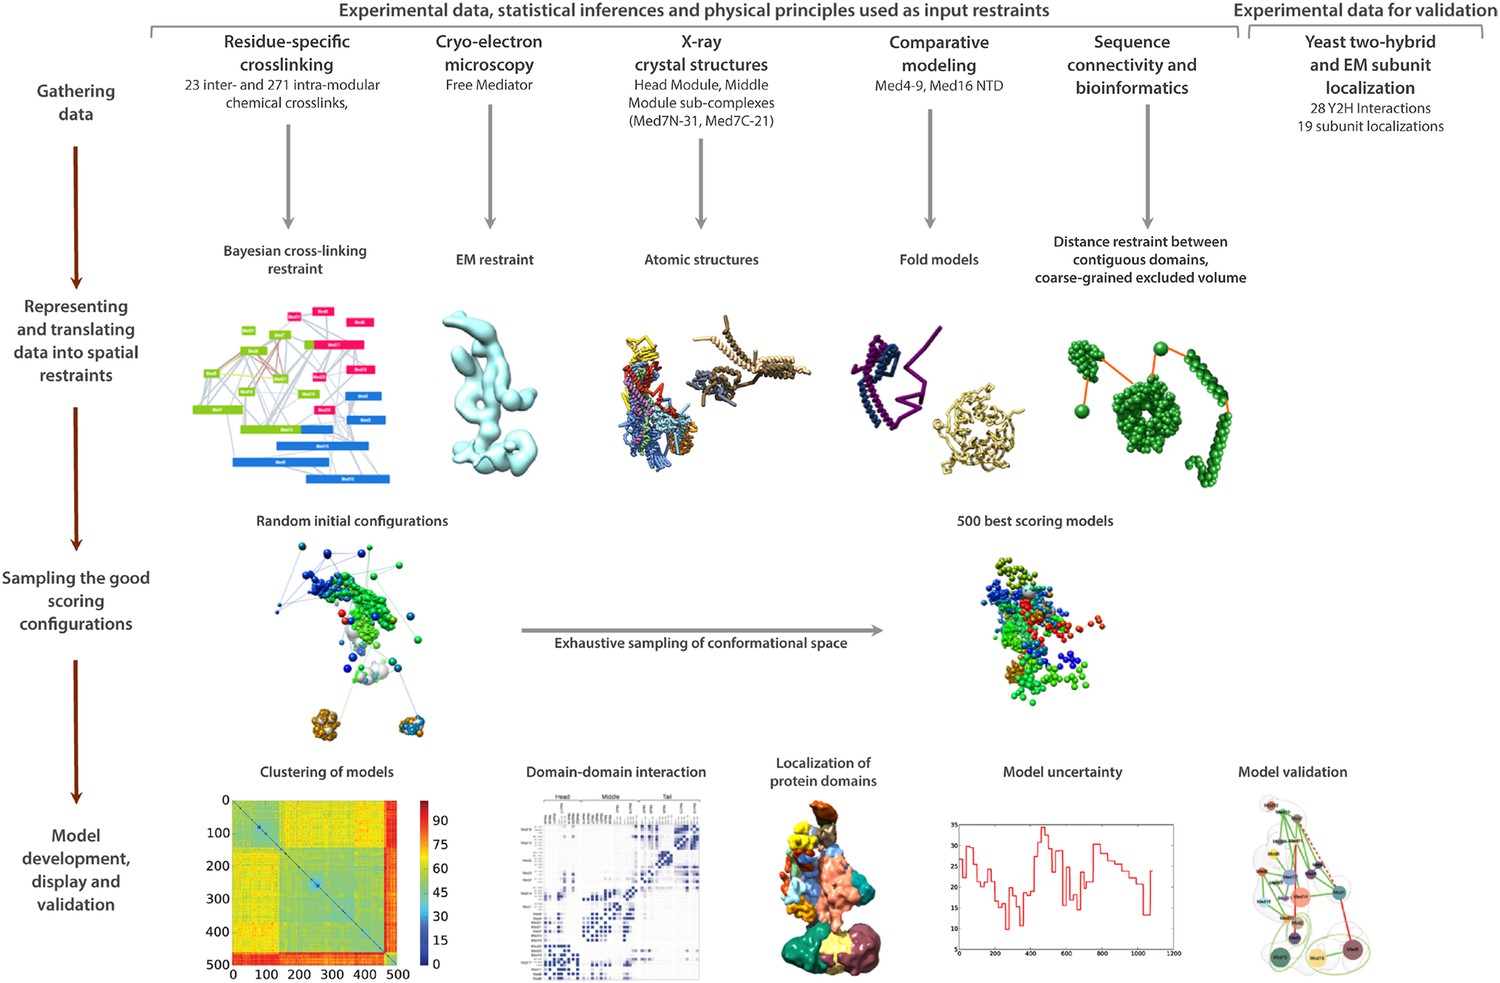
Schematic of integrative structure determination highlighting the individual data inputs and the four stages in our approach.
https://doi.org/10.7554/eLife.08719.008
Figure 2—figure supplement 2
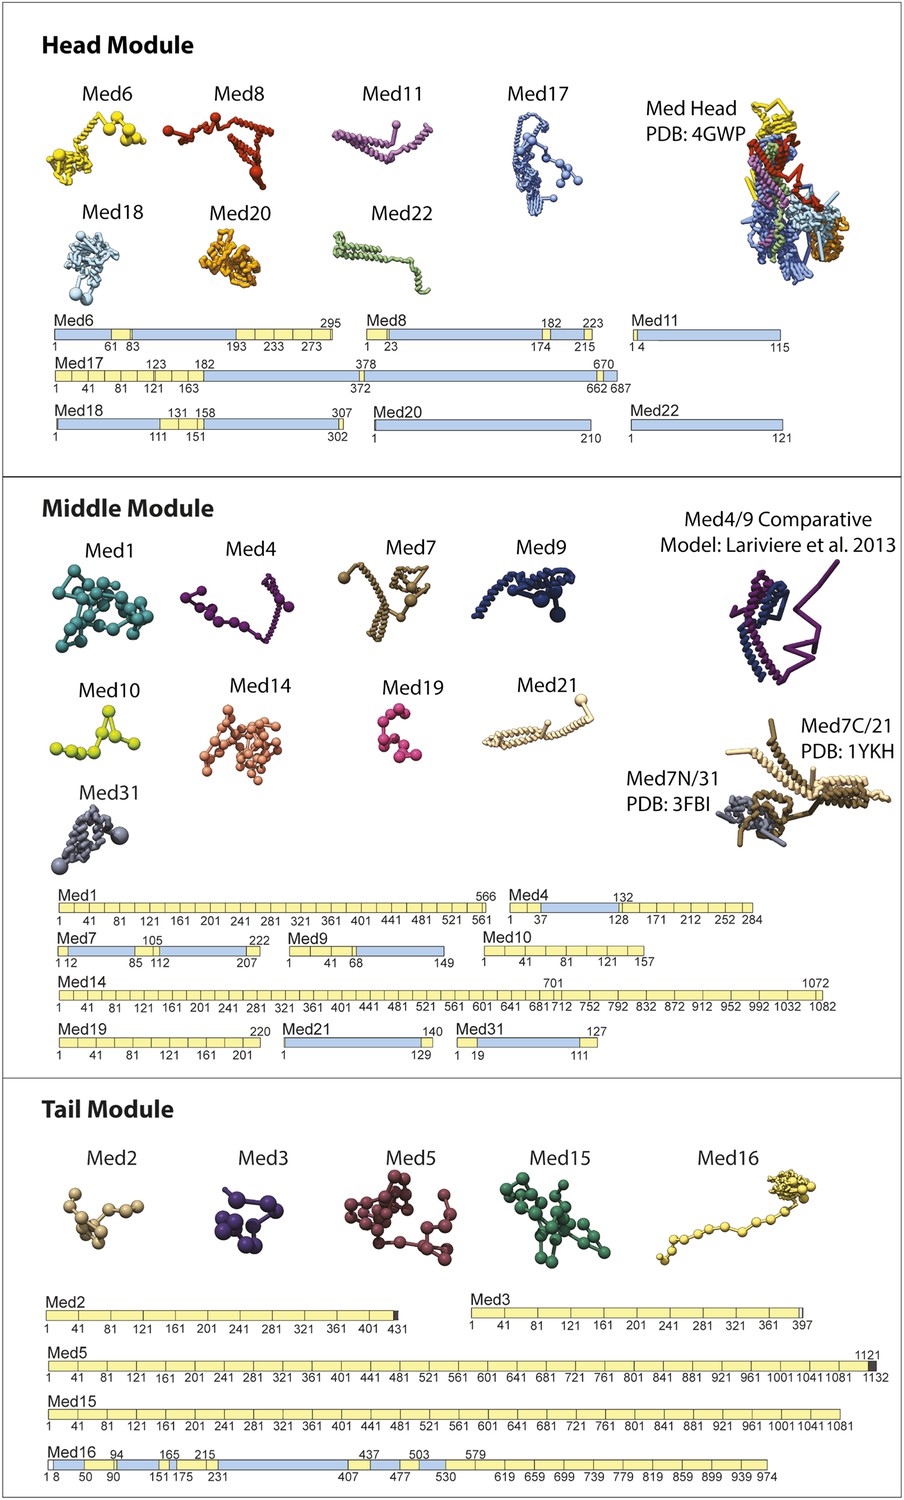
Input Model Representations.
Individual Mediator subunit model representations are grouped according by membership within the Head, Middle, and Tail modules. For each subunit, a schematic representation of the model substructure is shown below the corresponding bead representation. The subunit substructure is mapped onto the protein sequence and coloured according to atomic model coverage (blue fill) or bead structure (yellow) where each bead in the subunit model is represented by a single box in the schematic representation. The multi-protein complex structures from which most subunit atomic models are derived are represented on the right.
Figure 2—figure supplement 3
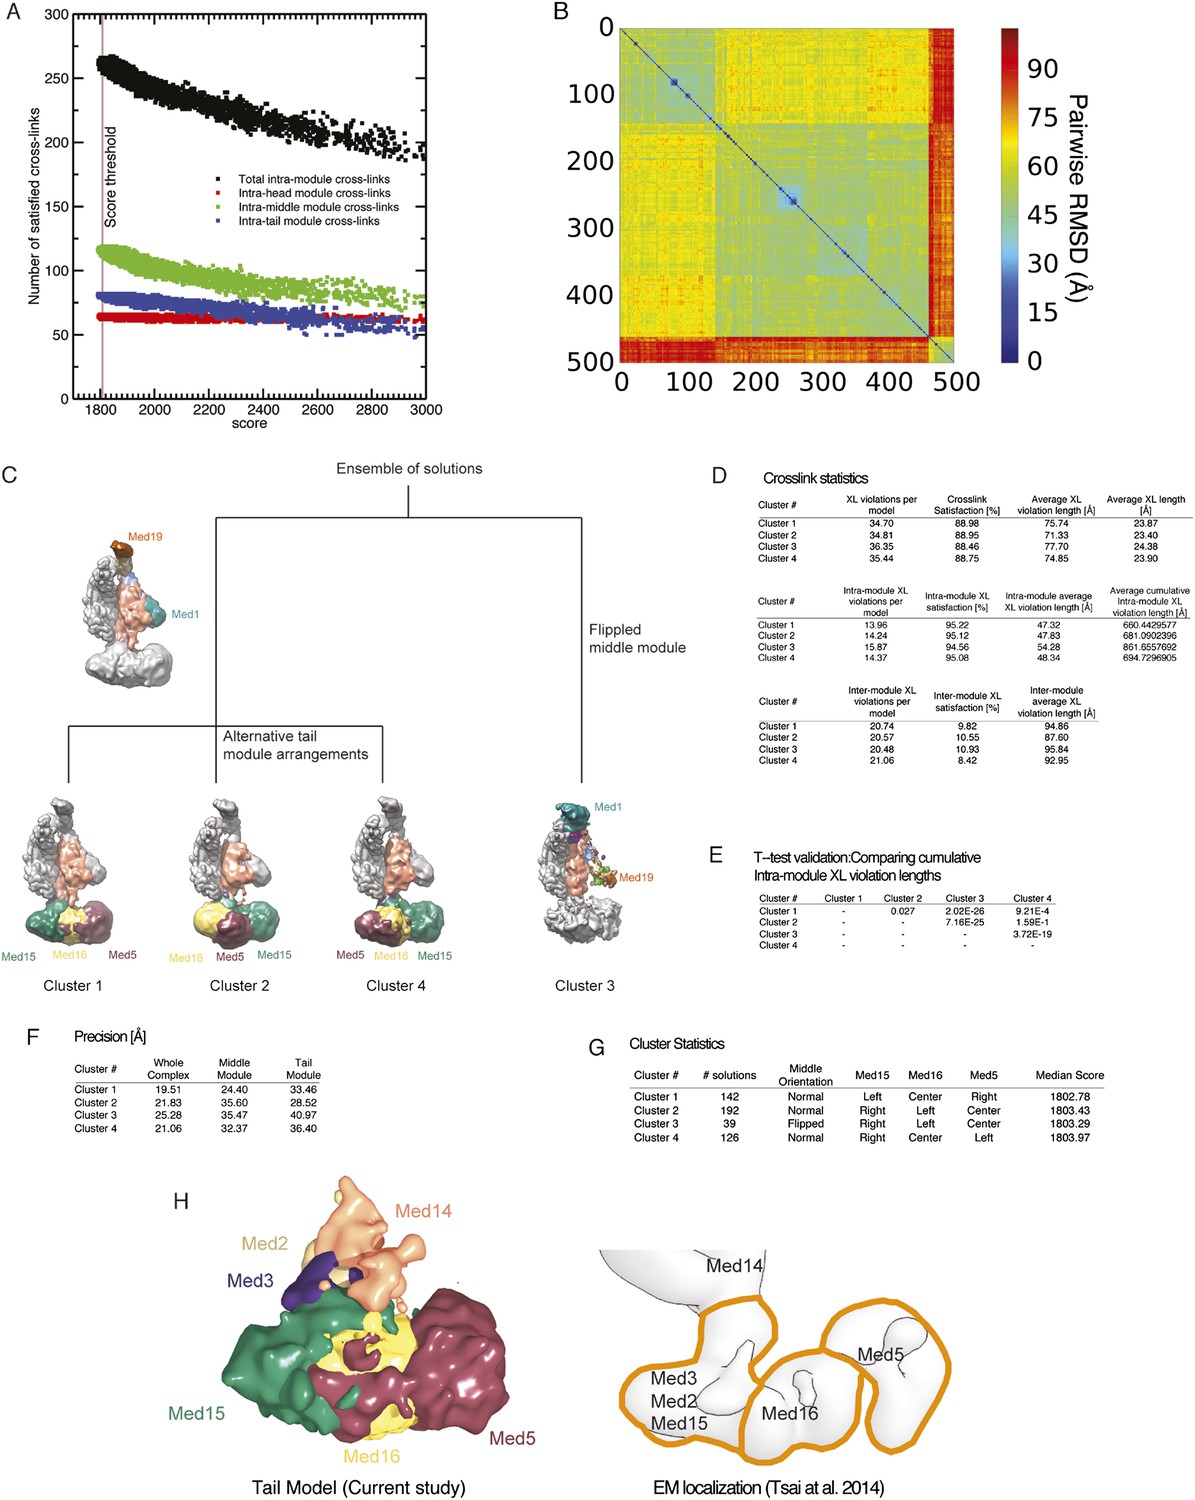
Cluster analysis of the solution ensemble.
(A) Number of satisfied intra-module cross-links plotted against the score for all 165,523 models. The vertical brown line represents the score threshold used to select the best scoring 500 models. (B) RMSD distance matrix for the 500 best-scoring models. The distance matrix is represented by a heat map, where the bin color is proportional to the RMSD distance of the corresponding solution pair. (C) Difference between the four clusters represented by a hierarchical graph. Clusters 1, 2, and 4 have the middle module oriented in the ‘normal’, expected orientation (i.e., Med1 and Med19 are at the bottom and at the top of the module, respectively). The three clusters differ in the arrangement of the tail subunits. Cluster 3 has the middle module oriented in a ‘flipped’ orientation (i.e., Med1 and Med19 are at the top and at the bottom of the module, respectively). (D) Detailed statistics of cross-link satisfaction for the whole dataset (top), intra-module cross links (middle), and inter-module cross-links (bottom). (E) Student t-test analysis of the intra-module cross-link violation distance. (F) Precision of the four clusters. (G) Statistical properties of the four clusters. (H) Agreement between subunit localization in Cluster 1 (left) and the interpretation of localization data mapped on the EM density map of the Tail module (right).
Figure 2—figure supplement 4
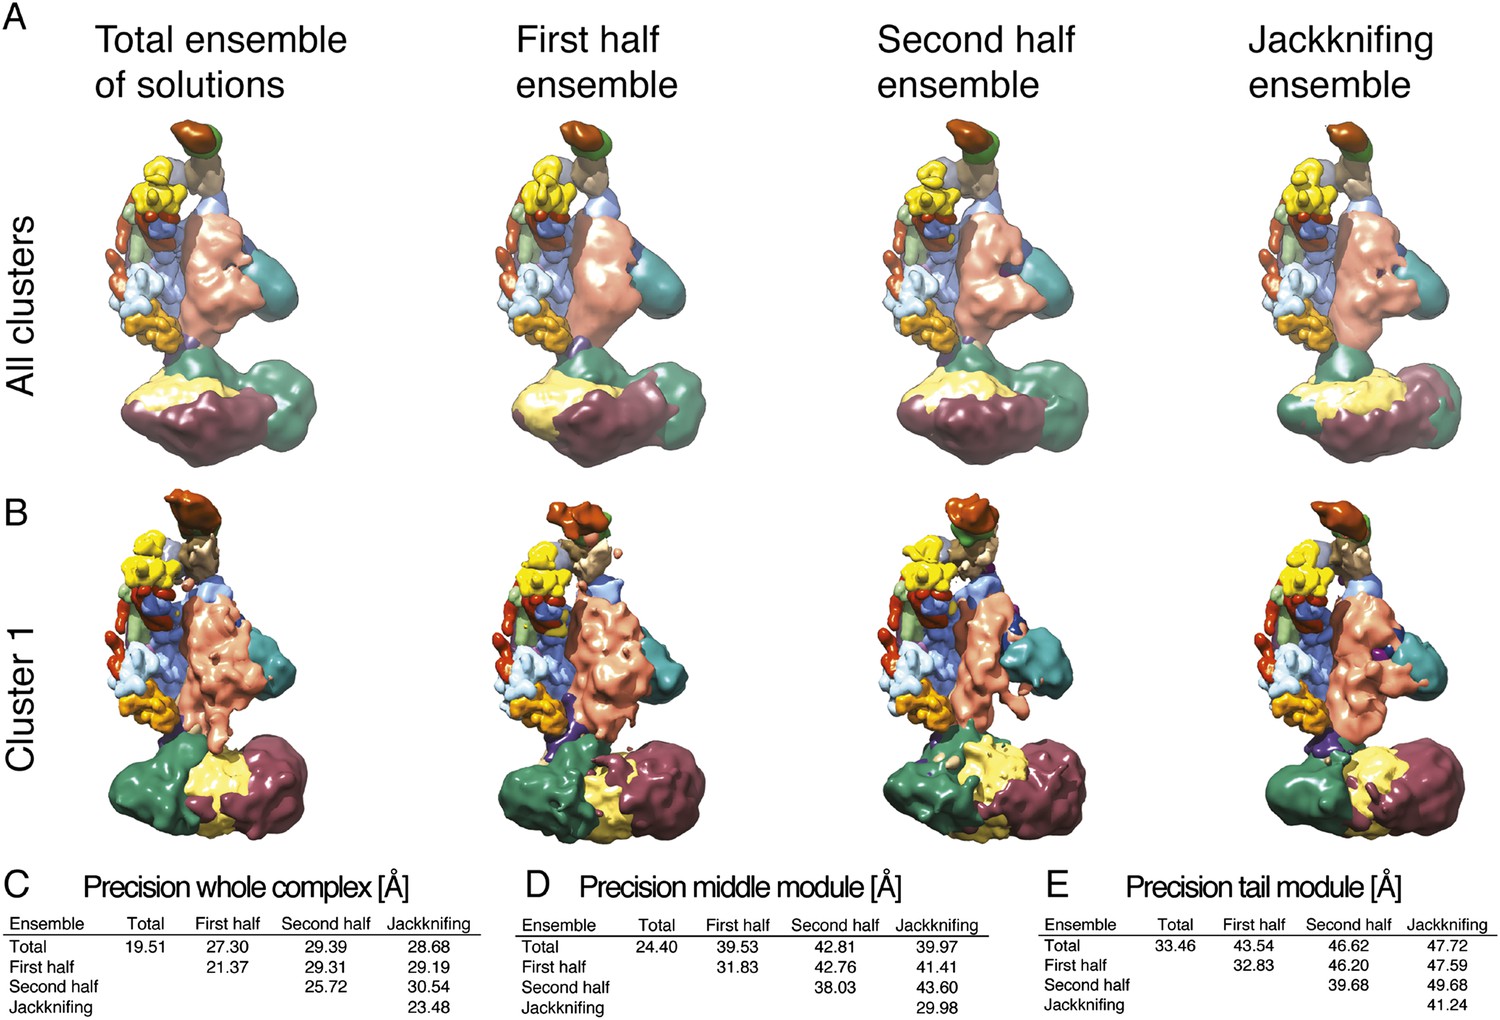
Exhaustiveness of sampling and robustness of cross-link data.
(A) Comparison of localization density maps calculated from the ensemble of solutions (500 best-scoring models) for the entire sample of models, the first half, the second half, and for jackknifing modeling runs (where 10% of cross-links were randomly removed). (B) Comparison of localization density maps calculated for Cluster 1 for the entire sample of models, the first half, the second half, and for jackknifing runs. (C, D, E) Precision of Cluster 1 solutions (diagonal values) and average RMSD between Cluster 1 solutions (off-diagonal values) computed for the four ensembles, considering the whole Mediator complex, the Middle module, and the Tail module.
Figure 2—figure supplement 5
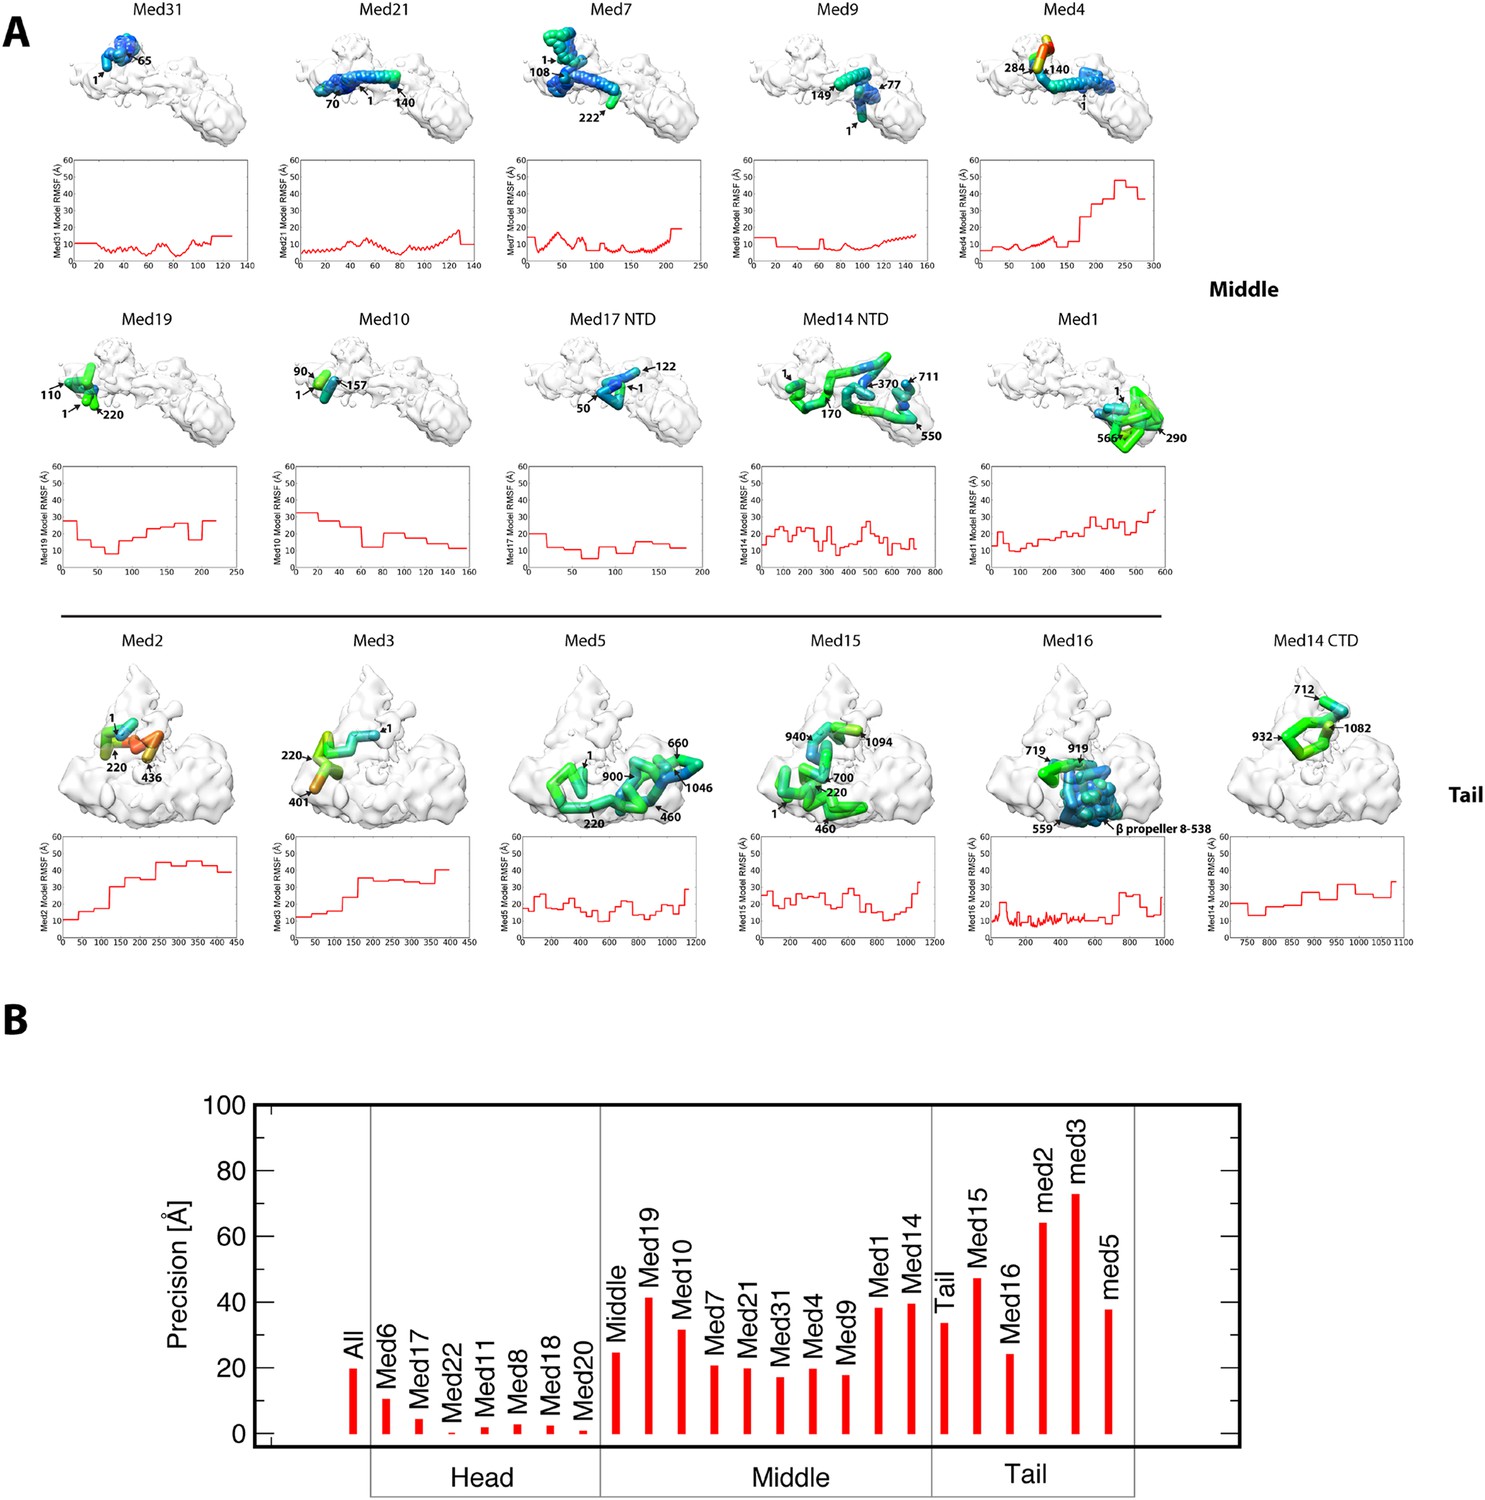
Representation of subunit position precision.
(A) Root-mean-square fluctuation (RMSF) plots for each subunit of the Middle and Tail modules show how precisely the residues of all proteins were localized within the best cluster of models. For each subunit, RMSF values are mapped onto a stick representation of their centroid model as a color gradient with low and high values of RMSF colored blue and red, respectively. Each subunit model is annotated with several residue numbers for reference. (B) Precision plots show the relative localization precision of each subunit of the Mediator complex, grouped by membership in the Head, Middle, and Tail domains. The high localization precision of Head module subunits is due to the Head module X-ray structure being fixed at a single position in the EM map. Within the Middle module, the subunits comprising the backbone scaffold (Med7-21-4-9) are all precisely localized.
Figure 3
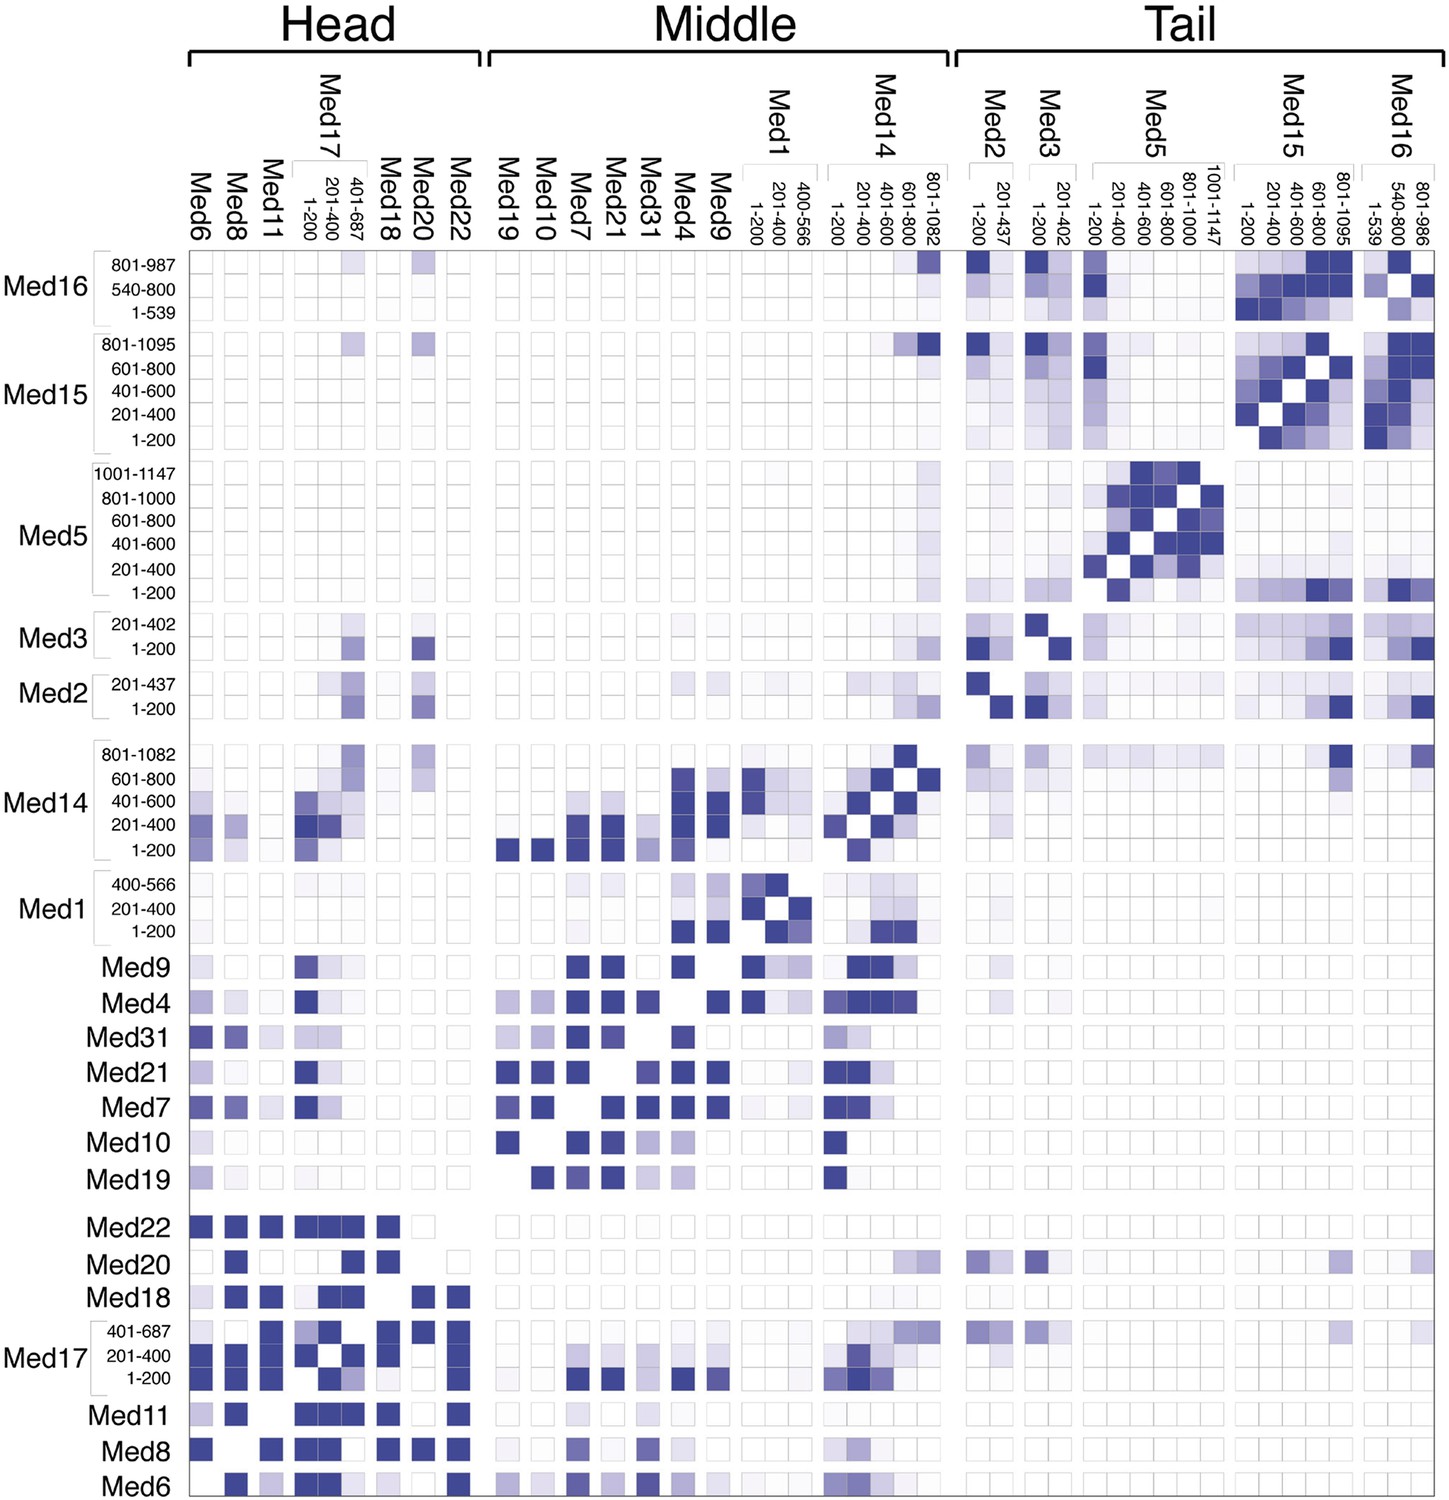
Mediator subunit domain interaction matrix.
Average domain–domain contact map calculated for the cluster of best-scoring solutions. Long sequences are divided into domains of 200 residues. The intensity of the color for each box is proportional to the fraction of models for which the contact between corresponding domains is formed. Two domains are in contact when the surface of the beads of one domain is within 10 Å from the surface of any of the beads of the other domain.
Figure 4
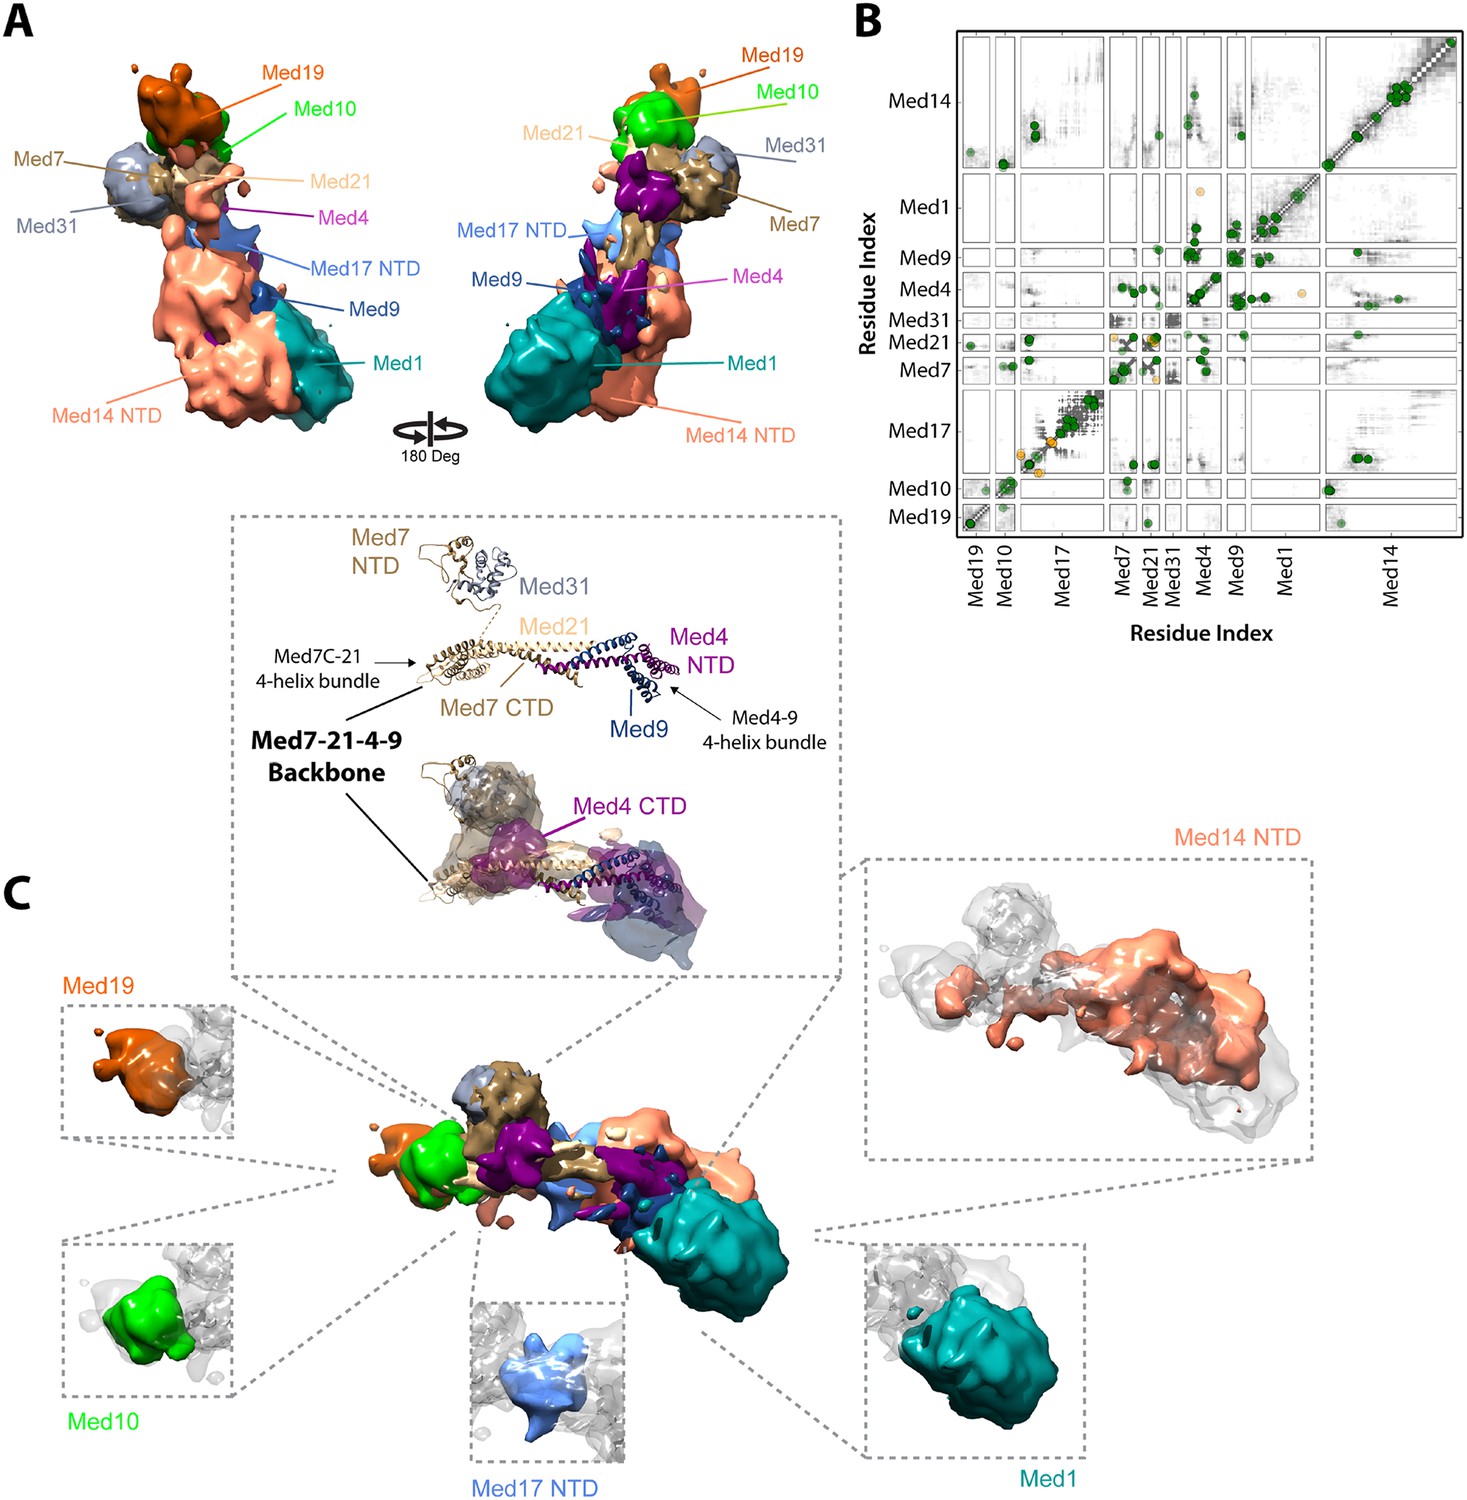
Architecture of the Mediator Middle module.
(A) Blow-out views of the Middle module subunit localization maps with the first view and coloring identical to Figure 2A and the second view related by a 180° rotation around the y-axis. (B) Average contact maps calculated for the cluster of best scoring solutions. Each square is a contact map calculated between a given pair of Middle module proteins with border length proportional to the length of corresponding subunit sequences. The grey-shaded areas indicate observed interactions, with the grey-scale proportional to the fraction of models observing the corresponding interaction. The colored circles are observed cross-links, where the green and orange colors represent respectively satisfied and violated cross-links for the cluster center (i.e., the solution that has the minimal root-mean-square deviation (RMSD) from all the other solutions in the cluster). (C) Top view of Middle module with individual panels showing the full localization map of each Middle subunit within its surrounding density, made semi-transparent for visual clarity. In the central portion of the Middle module the end-to-end stacking of Med7C-21 (PDB 1YKH) and Med4-9 (Homology Model [Lariviere et al., 2013]) heterodimers forms a backbone scaffold (top panel), upon which Med10 and Med19 associate at the Med7C-21 extreme (left panels) while Med1 associates closely with the N-terminal portions of Med4-9 (bottom right panel). The Med7N-31 complex (PDB 3FBI) is located proximal to the Med7C-21 heterodimer and the unmodeled carboxy-terminal domain (CTD) of Med4 (top panel). The centrally located Med17 NTD (bottom panel) is wedged between the Med7C-21-4-9 backbone and Med14, which forms contacts with Med10 and Med21 at its extreme NTD, while the bulk of its density localizes to Med4-9 and Med1 (top right panel). Subunit localization density and ribbon models are colored according to Figure 2A.
Figure 5
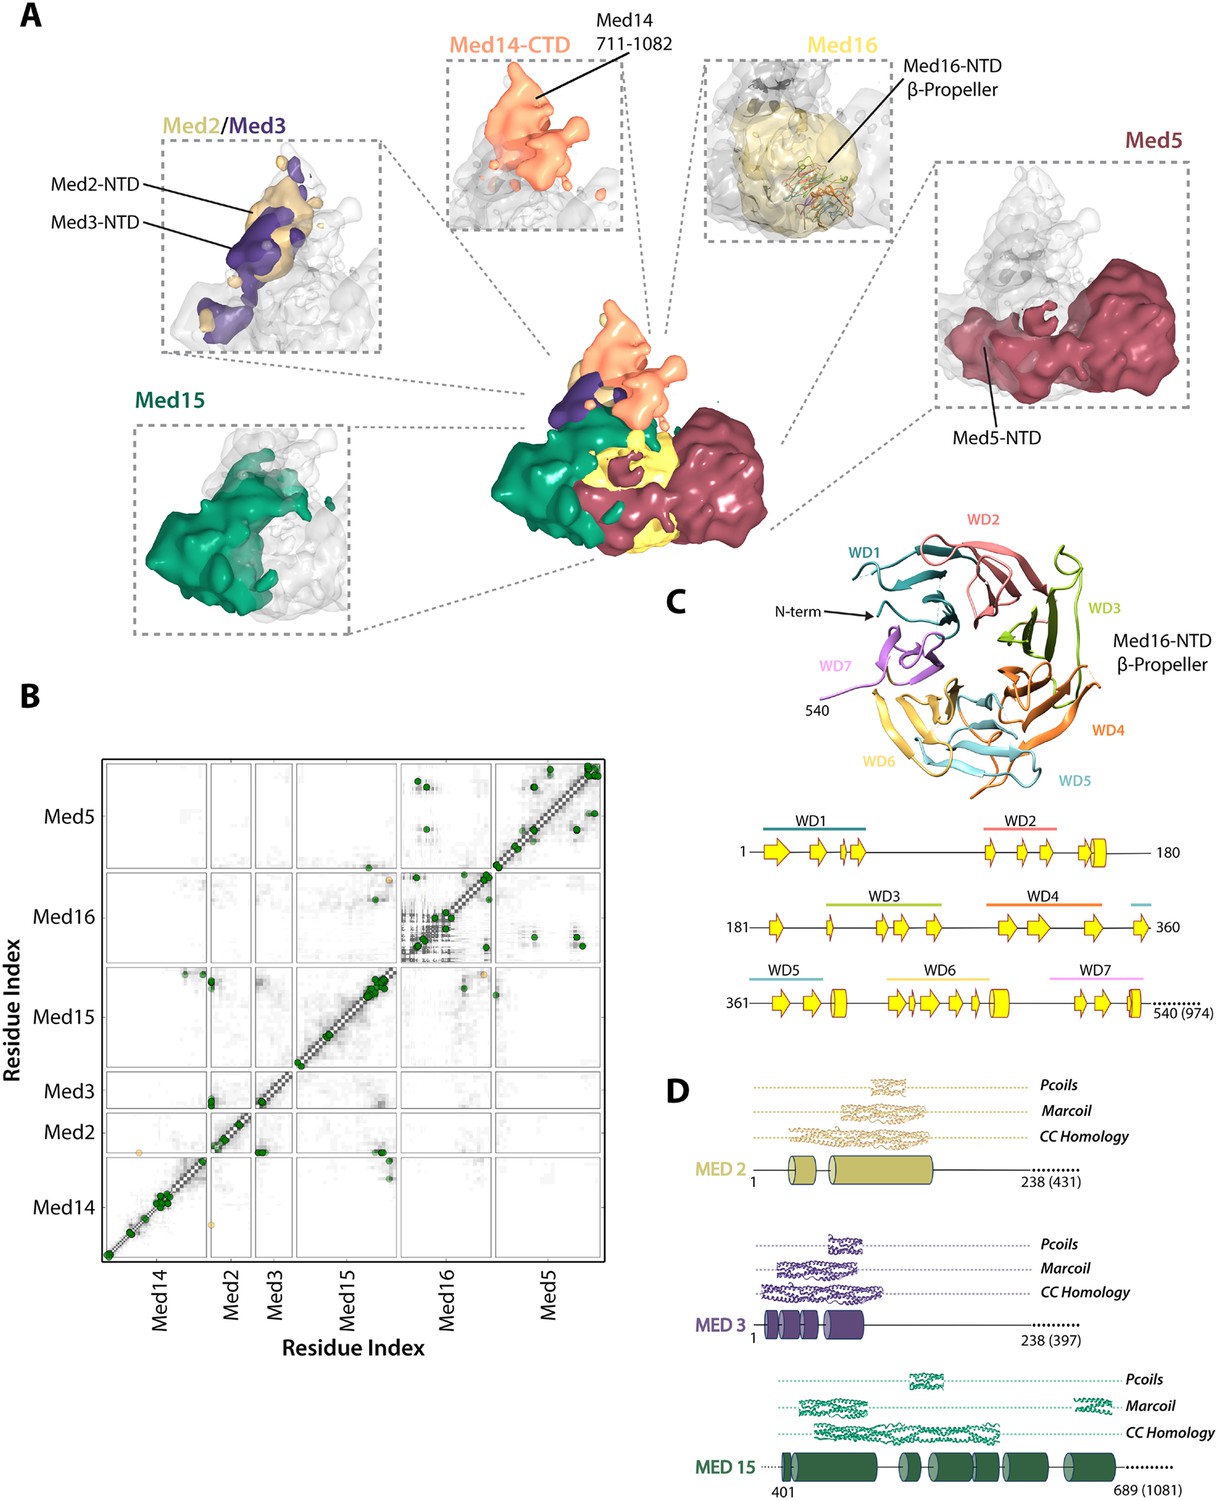
Architecture of the Mediator Tail module.
(A) Subunit localization within the Tail module. For each Tail subunit, the corresponding localization density is shown within a semi-transparent Tail density (grey) and colored according to Figure 2A. (B) Average contact maps calculated for the cluster of best-scoring solutions and represented as described in Figure 4B. (C) β-propeller model of the Med16 NTD. The location of 7 WD domains within the N-terminus of Med16, predicted by MSA analysis (Bourbon, 2008), is shown in the context of the predicted Med16 N-term secondary structure (bottom panel). Similarity searches identified a high-confidence match to the 7-bladed β-propeller of the S. cerevisiae vesicle coat protein Sec31 (PDB 2PM9). (D) Schematic showing the predicted coiled-coil regions of three interacting Tail proteins, Med2, Med3 and Med15. The co-localization of the Med2/3 N-termini and Med15 C-term (panel A) supports the formation of a coiled-coil at this tail locus.
-
Figure 5—source data 1
HHpred comparative modeling results for Tail module proteins.
- https://doi.org/10.7554/eLife.08719.016
Figure 6
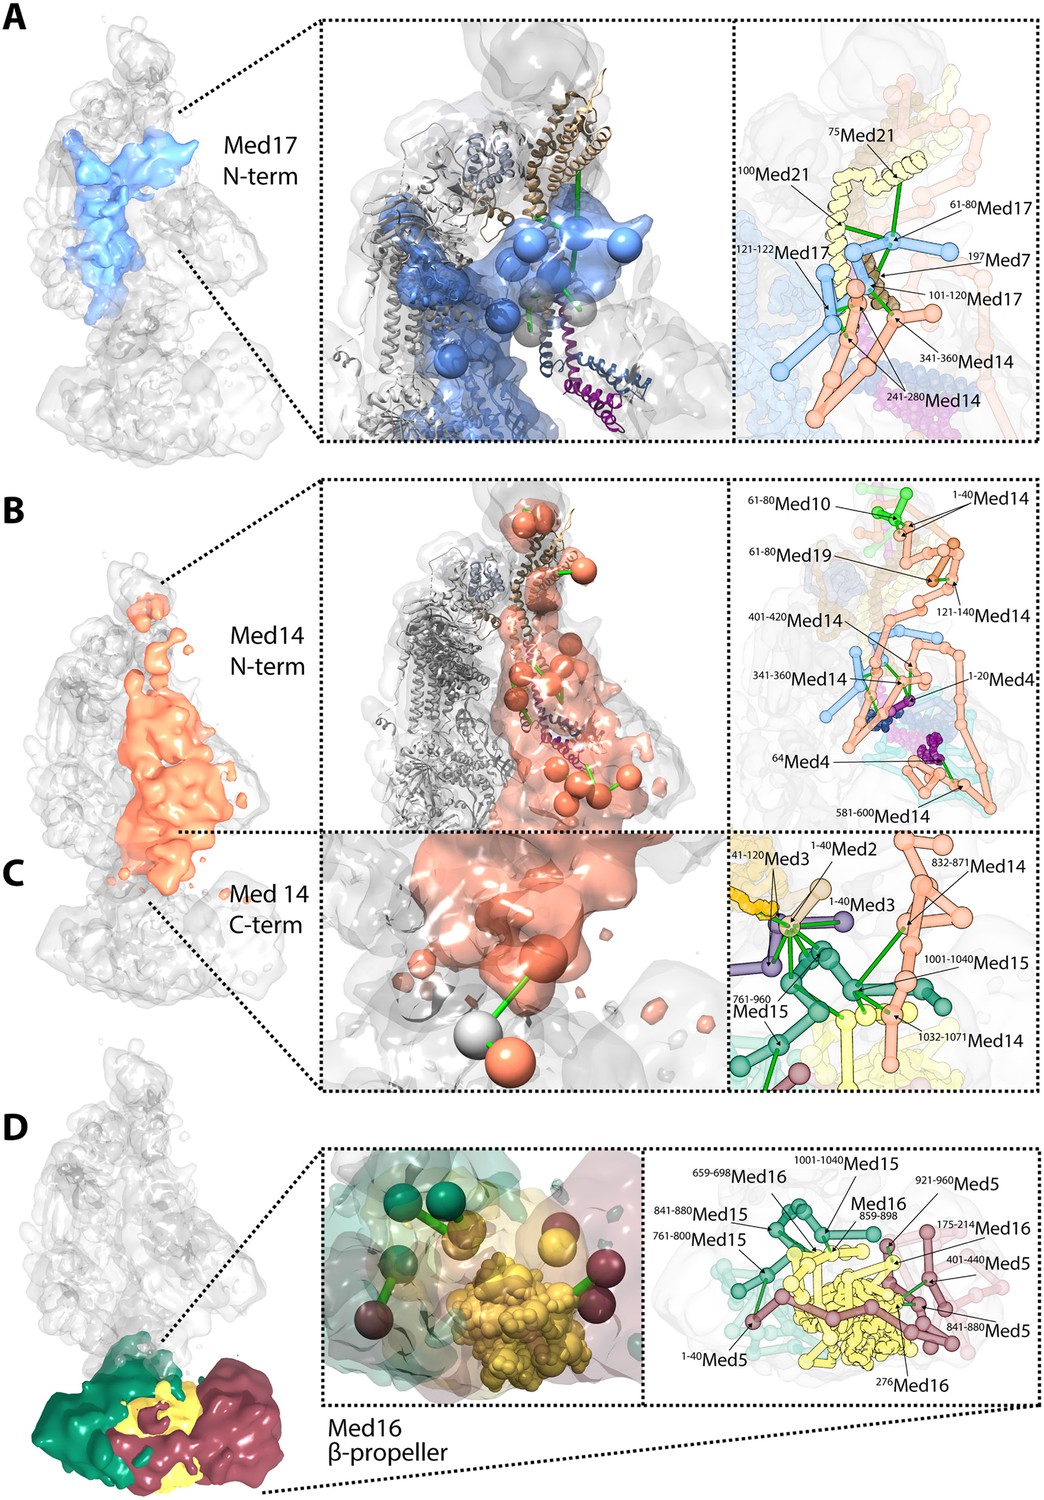
Novel structural insights into Mediator complex architecture and module connectivity.
(A) Subunit localization density for Med17 (blue) reveals the extension of the unmodeled N-terminal domain to contact Middle module subunits. (Left A panel) The N-terminus of the Head subunit Med17 (blue density and beads) forms an extensive cross-linking network (green links) within the Middle module, acting as an inter-modular bridge (see right A panel and Supplementary file 1 for detailed cross-link information). Head and Middle module ribbon models are colored light grey and according to their subunit color in Figure 2A, respectively, and unmodeled residues cross-linked to Med17 are represented with light grey beads. Only Med17 beads with cross-links are shown for clarity and coordinates are derived from the full-complex centroid model. (Right A panel) A detailed stick representation of the cross-linking network shown in the left panel. (B) Subunit localization density for Med14 (salmon) highlights its unique function as a Mediator scaffold protein spanning ∼220 Å to connect all three modules. (Left B panel) The N-terminus of Med14 forms an extensive cross-linking network across the full Middle module. The structural elements of Med14 and other subunits are represented as in left panel of (A). (Right B panel) A detailed stick representation of the cross-linking network shown in left panel. (C) The localization of the Med14 CTD to the Middle-Tail junction is observed through a pair of cross-links to a Tail protein located in the region (Left C panel). (Right C panel) A detailed stick representation of the subunit localization and cross-linking network within the Middle-Tail junction. (D) Subunit localization density for the subunits localized in the central portion of the Tail module. (Left D panel) Bead representation of the cross-links involving the N- and C-terminal portions of Med16 (yellow) with Med5 (brown) and Med15 (green), respectively. The Med16 N-terminal β-propeller is centrally located in the Tail module and forms extensive interactions with Med5. The Med16 CTD links Med16-Med5 with the remainder of the Tail. (Right D panel) A detailed stick representation of the cross-linking network shown in left panel. Coordinates for both panels of (C) and (D) are derived for the Tail module centroid model.
Figure 7 with 1 supplement
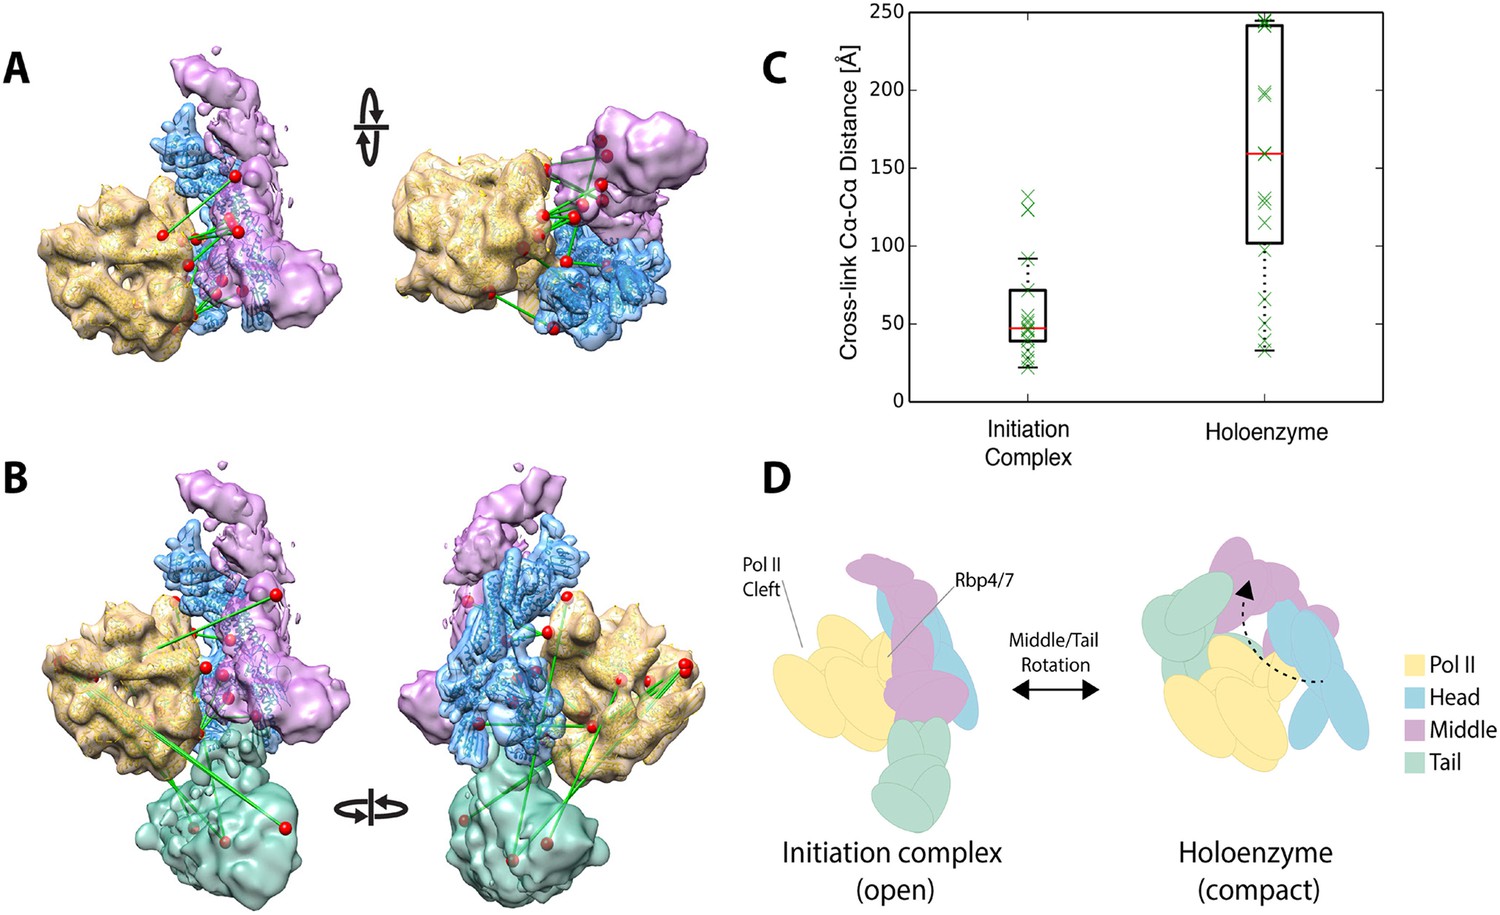
Holoenzyme cross-linking data indicate different conformational states between the holoenzyme and the core Mediator initiation complex.
(A) Docking of our Mediator model to the EM density of Plaschka et al. (2015) provides a subunit architectural map that is highly consistent with the 12 Mediator to pol II cross-links of Plaschka et al. (2015) (non-redundant and within modeled sequence), collected on a core initiation complex containing the Mediator Head and Middle modules with pol II, nucleic acid scaffold and the general factors TBP, TFIIB and TFIIF. (B) In contrast, the 17 equivalent Mediator to pol II cross-links of the current study are largely inconsistent with the position of Mediator modules found in the core initiation complex. (C) Distributions of cross-link Cα distances from the two datasets measured in the context of the docked Mediator model. (D) The pattern of holoenzyme cross-links implies a major conformational rearrangement in the presence of the Tail module and absence of DNA scaffold and general transcription factors.
Figure 7—figure supplement 1
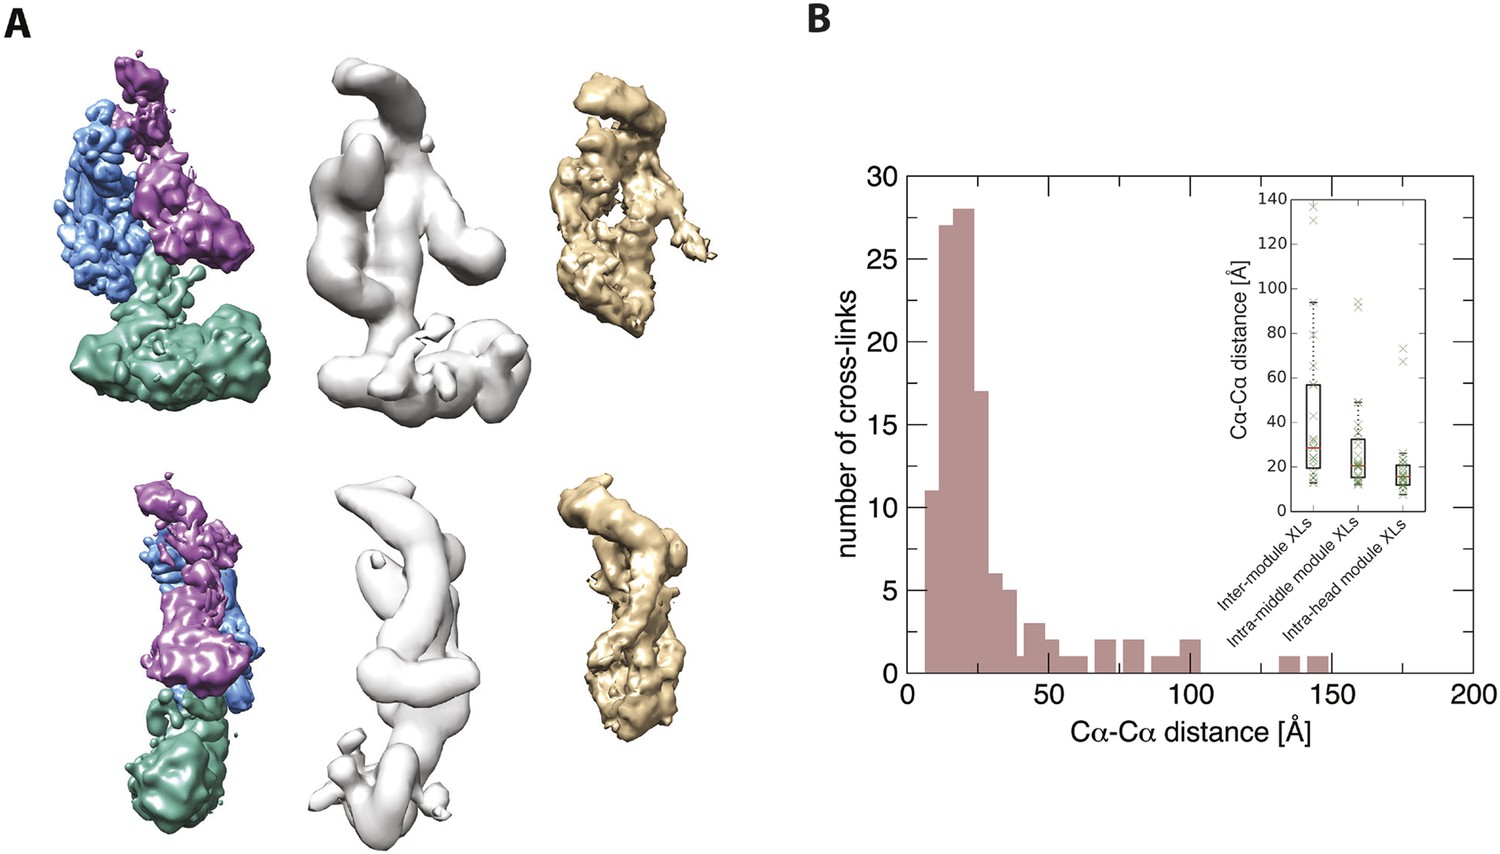
Further validation of the Mediator model.
Agreement between the structural model of the Mediator complex and the data for the core initiation complex collected by Plaschka et al. (2015). (A) Comparison between our model (left), the EM map of the apo-mediator complex (center) (Tsai et al., 2014), and the Mediator Head-Middle EM density from the core initiation complex (right) (Plaschka et al., 2015). (B) Agreement between our model and the CX-MS data from the core initiation complex. The histogram is obtained from cross-linked residue–residue distances calculated on our model. In the inset, the box plots are calculated on the inter-module, intra-head module, and intra-middle module cross-links. The solid box represents the interquartile range of the distance distribution. The median is represented by the red line, and the cross-link distances are represented with green crosses. To make the comparison more stringent, we removed distances of intra-molecular cross-links calculated on residues pairs that were less than 50 residues apart in the sequence.
Additional files
-
Supplementary file 1
Full list of Mediator–Mediator cross-linked peptides discovered by mass spectrometry.
Separate Microsoft Excel File.
- https://doi.org/10.7554/eLife.08719.020
Download links
A two-part list of links to download the article, or parts of the article, in various formats.
Downloads (link to download the article as PDF)
Open citations (links to open the citations from this article in various online reference manager services)
Cite this article (links to download the citations from this article in formats compatible with various reference manager tools)
Molecular architecture of the yeast Mediator complex
eLife 4:e08719.
https://doi.org/10.7554/eLife.08719


