Localized hypoxia within the subgranular zone determines the early survival of newborn hippocampal granule cells
- Oregon Health and Science University, United States
- VA Portland Health Care System, United States
Figures
Figure 1
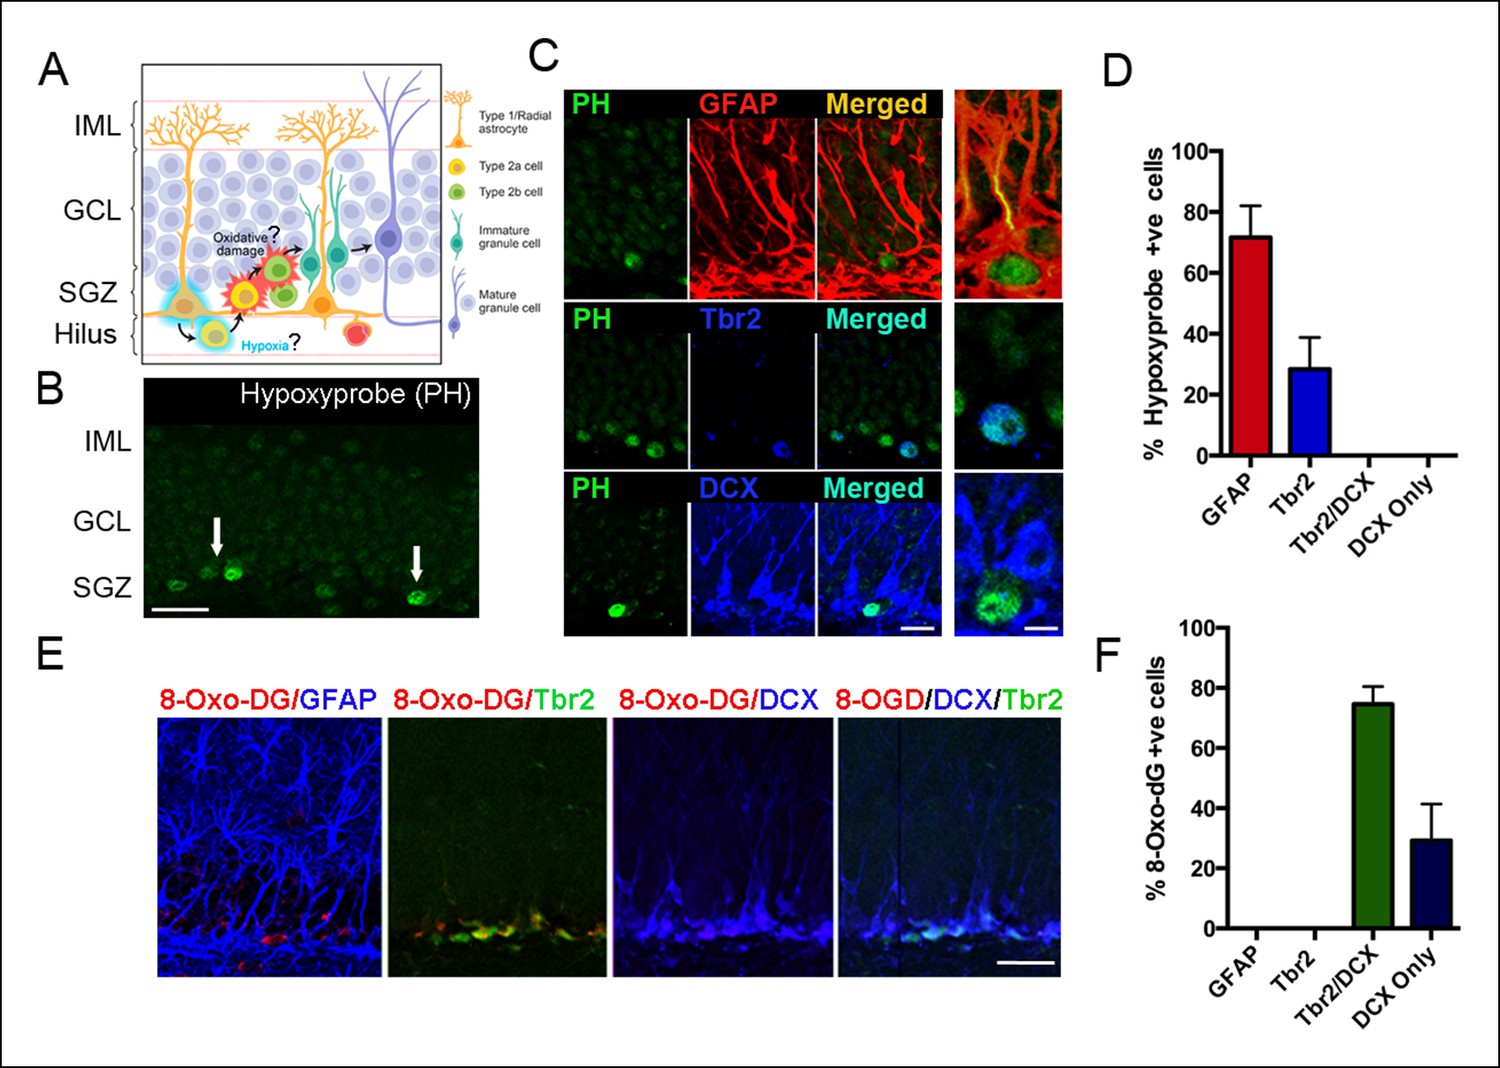
Detection of hypoxia and oxidative stress in SGZ niches of the adult DG.
(A) Schematic diagram of experimental design. (B) Immunostaining with pimonidazole hydrochloride marks hypoxic areas (white arrows) within the adult SGZ (scale bar: 20 μm). (C) Pimonidazole-positive cells colocalized with stem cell marker GFAP (red, top row), intermediate progenitor marker Tbr2 (blue, middle row) but not with neuroblast marker DCX (blue, bottom row). The enlargement in the rightmost panel in the top row indicates a hypoxic neural stem cell (green) that colocalizes with a GFAP+ radial glial cell (yellow). A smaller fraction of early progenitors (Tbr2+) also were pimonidazole-positive (middle row, rightmost panel). Scale bar: 15μm left panel, 5 μm right panel. (D) Quantification of SGZ cells types expressing pimonidazole. (E) Oxidized 8-deoxyguanosine (8OHdG), a marker of oxidized nucleic acids, was not detected in GFAP positive neural stem cells, but in Tbr2- and DCX-expressing intermediate progenitors and neuroblasts (scale bar: 25 μm). (F) Quantification of SGZ cell types expressing oxidized 8-deoxyguanosine. For all quantifications data are plotted as mean ± SD.
Figure 2
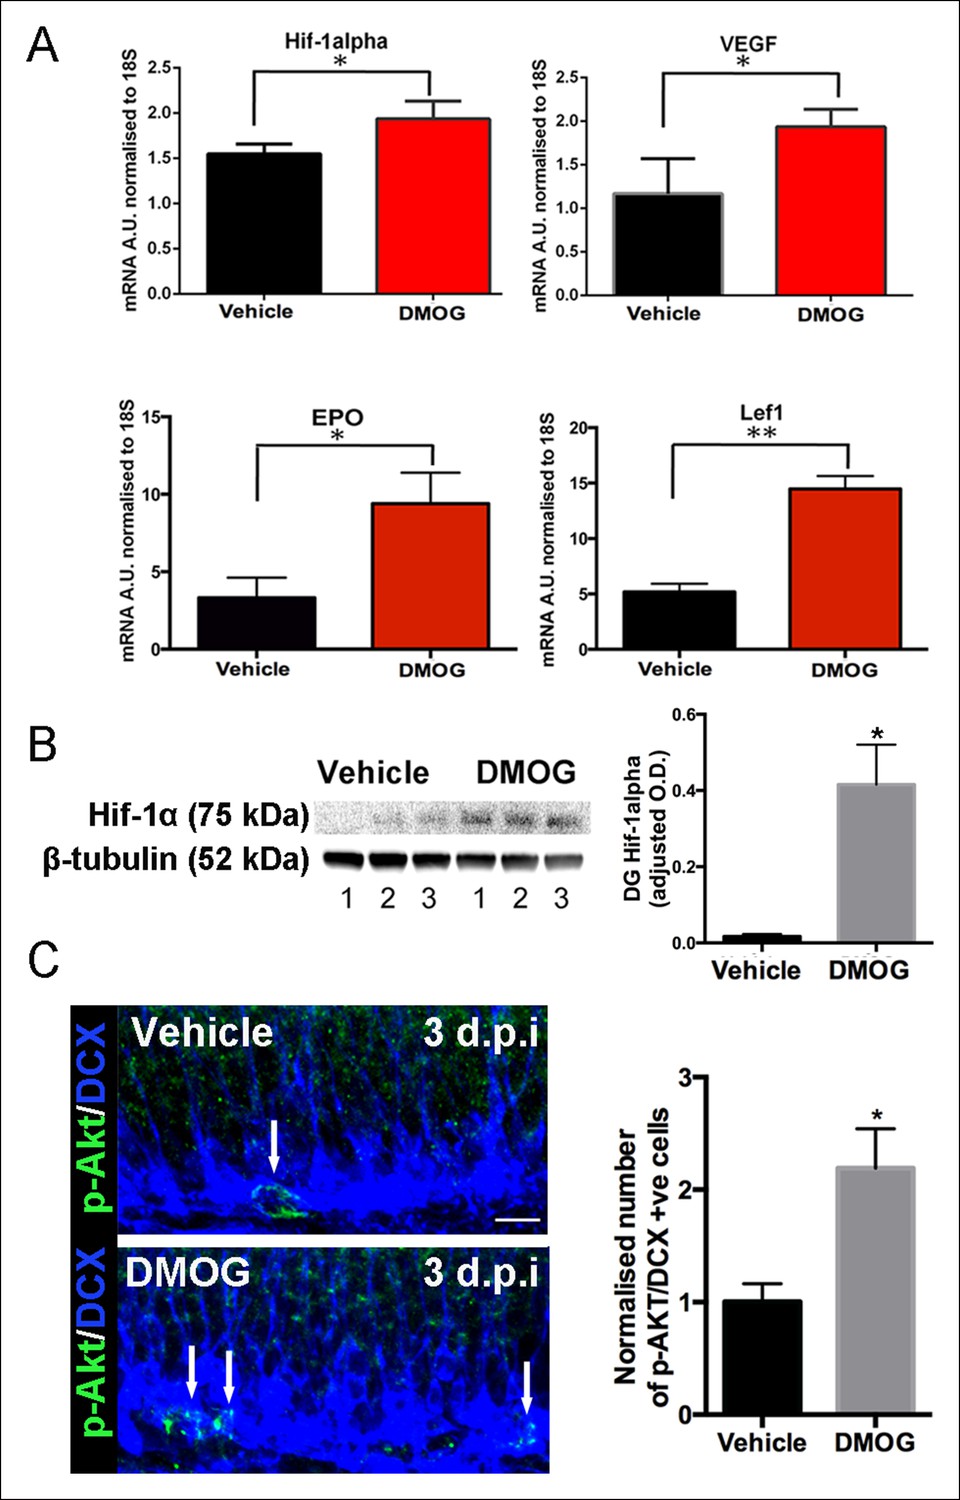
DMOG stabilized and activated Hif-1α signaling in vivo.
(A) DMOG treatment elevated mRNA levels of HIF1-α and its downstream targets. HIF1-α, VEGF, EPO and Lef1 in the microdissected DG of animals treated with DMOG for 3 days. (HIF1-α, p = 0.04, n = 3; VEGF, p = 0.03, n = 3, EPO = 0.02, n = 3, Lef1, p = 0.002, n = 3). Data are mean ± SD. (B) Representative western blots of DG protein extracts probed with antibody against HIF1-α, from animals treated for 3 days with vehicle or DMOG (n = 3 each group, left panel). Semiquantitative densitometry for HIF1-α protein normalized to β-tubulin levels (right panel). HIF1-α DG protein levels were significantly elevated in DMOG treated animals. Data are mean ± SD, p = 0.03. (C) DMOG increases phosphorylation of Akt (Ser473) in DG newborn cells. Representative images of adult DG sections stained with anti-phospho-Akt (green) and anti-DCX (blue) after 3 days treatment with vehicle or DMOG. Note the higher density of phospho-Akt positive cells in the SGZ of DMOG treated animals (below) compared to vehicle treated controls (above) (scale bar: 8 μm). Data are mean ± SD, p = 0.01.
Figure 3
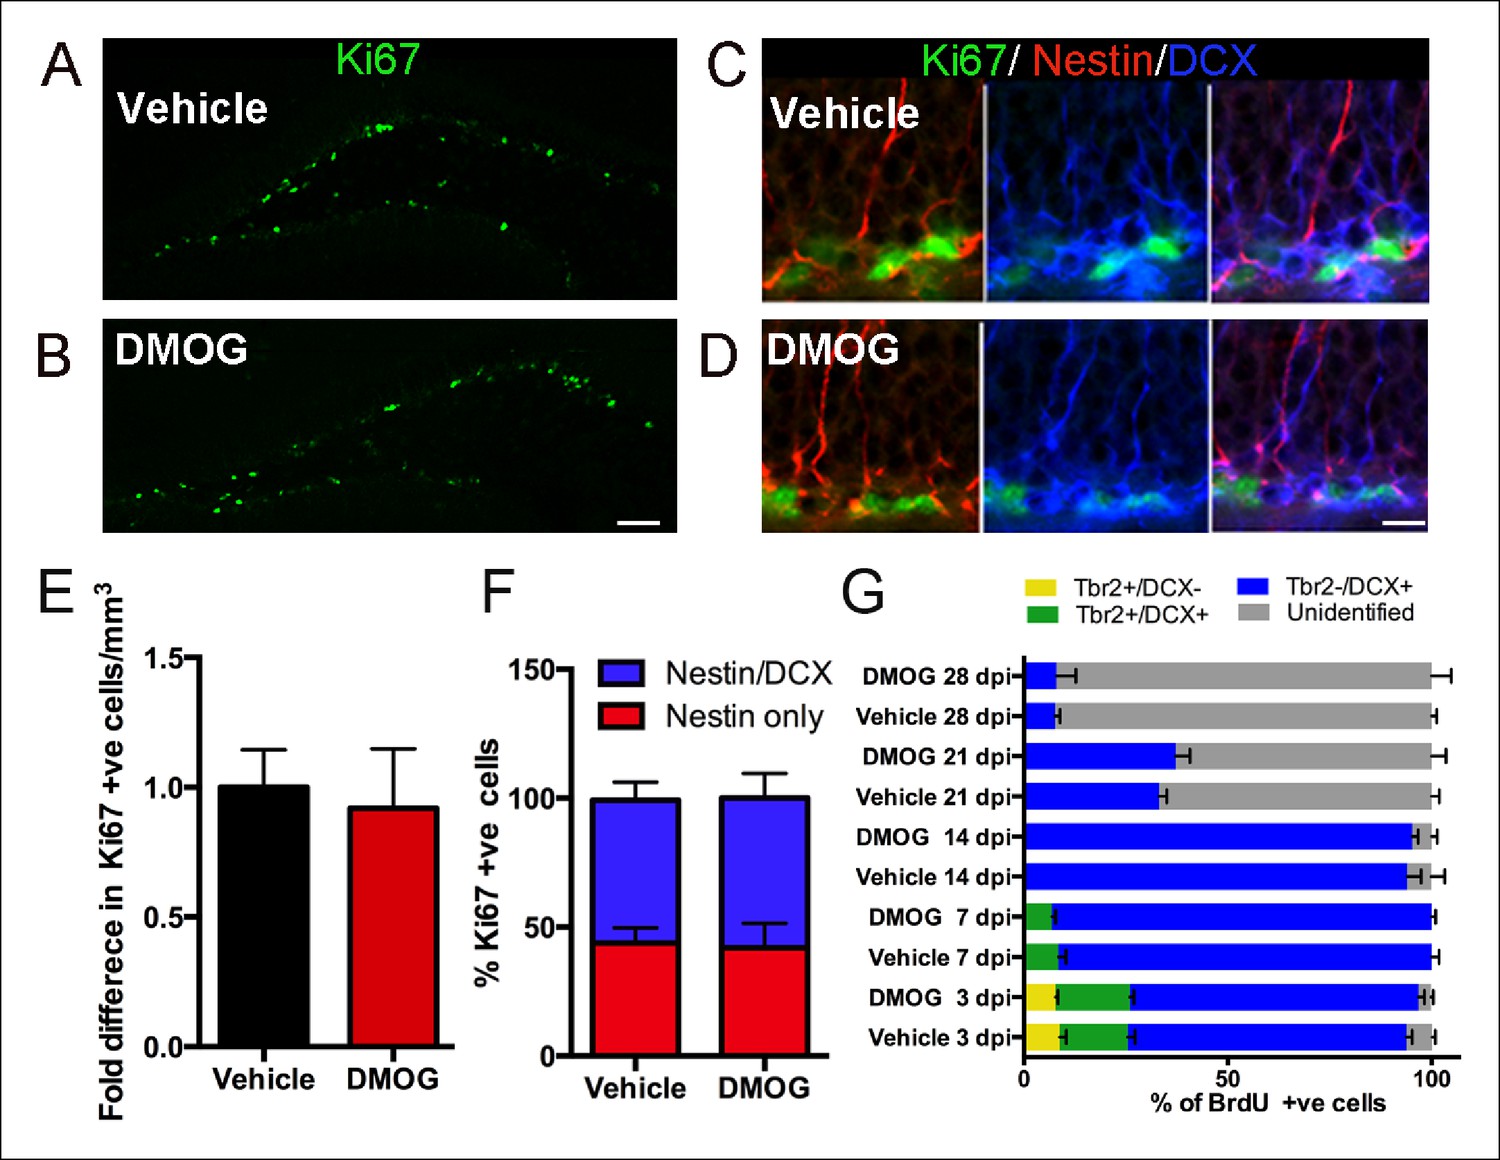
DMOG does not affect the proliferation and differentiation of 3 day old cells in the adult DG.
(A,B) Representative images of proliferating cells Ki67+ cells in the SGZ (A, B, scale bar: 100 μm). (C,D) Triple labeling with Ki67/ Nestin/DCX (C, D, scale bar: 10 μm). (E) The density of proliferating cells (Ki67+) was comparable between vehicle controls and DMOG treated animals. (F) The proportion of the DG proliferative progenitors remained unaltered following DMOG administration. (G) To analyze the phenotype of Brdu+ cells, brains were collected 3, 7, 14, 21 and 28 days after two pulses of BrdU (300 mg/kg with a 4 hr interval between doses) and triple labeled with BrdU/Tbr2/DCX. DMOG treatment did not affect the composition of the SGZ progenitor subtypes at any of the examined time-points. For all quantifications data are plotted as mean ± SD. The percentages at each time point are as follows: 3 dpi.: Control: 8.8 ± 3.2% Tbr2+/DCX-, 16.78 ± 3.6% Tbr2+/DCX+, 68.4 ± 2.7 Tbr2-/DCX+; DMOG: 7.8 ± 1.1% Tbr2+/DCX-, 18.8 ± 1.9% Tbr2+/DCX+, 70.7 ± 2.9% Tbr2-/DCX+. 7 dpi.: Control: 8.4 ± 3.2% Tbr2+/DCX+, 91 ± 3.1% Tbr2-/DCX+; DMOG: 6.8 ± 1.8% Tbr2+/DCX+, 93.2 ± 1.7%. 14 dpi.: Control, 94 ± 5.6% Tbr2-/DCX+; DMOG: 95 ± 2.5% Tbr2-/DCX+. 21 and 28 dpi.: Control: 21 dpi. 33 ± 3.2% Tbr2-/DCX+, 28 dpi. 7.6 ± 2% Tbr2-/DCX+; DMOG: 21 dpi 37.2 ± 6.2% Tbr2-/DCX+, 28 dpi. 7.9 ± 8.4% Tbr2-/DCX+.
Figure 4
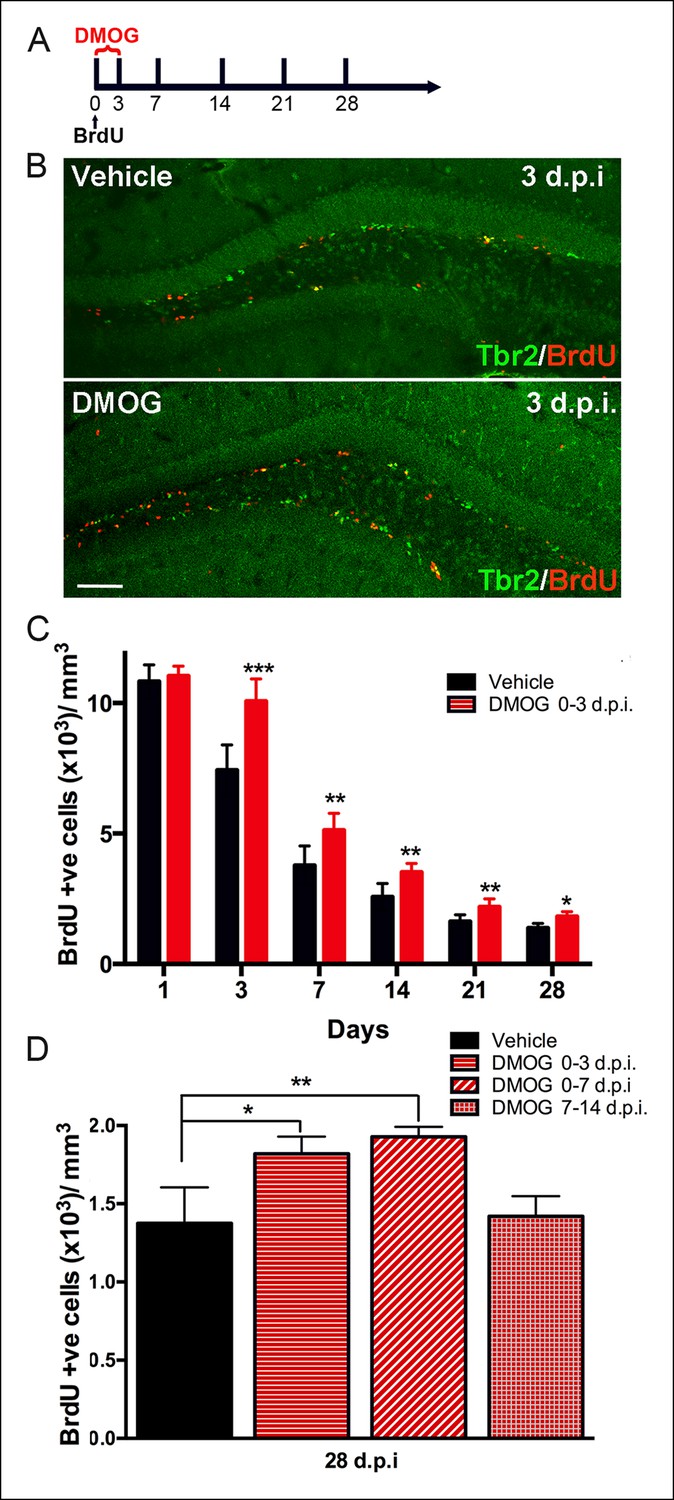
Hypoxia mimetic agent DMOG increases early survival of newborn cells in the adult SGZ.
(A) The schema shows the experimental design for BrdU pulse labeling of newborn cells at day 0 followed by 3 days treatment with DMOG or vehicle and the different timepoints studied thereafter. (B) Representative immunofluorescence in sections of adult DG treated either with vehicle or with DMOG for 3 days double labeled with anti-BrdU and anti-Tbr2, which increased BrdU+ cells following DMOG treatment (scale bar: 100 μm). (C) Quantification of the BrdU positive cells along the time course of 28 days post injection (dpi) following 3-day treatment with vehicle or DMOG. (D) Quantification of the survival of BrdU positive cells at 28 dpi. following different DMOG treatment periods. For all quantifications data are plotted as mean ± SD (*p <0.05;**p <0.01;***p <0.001).
Figure 5
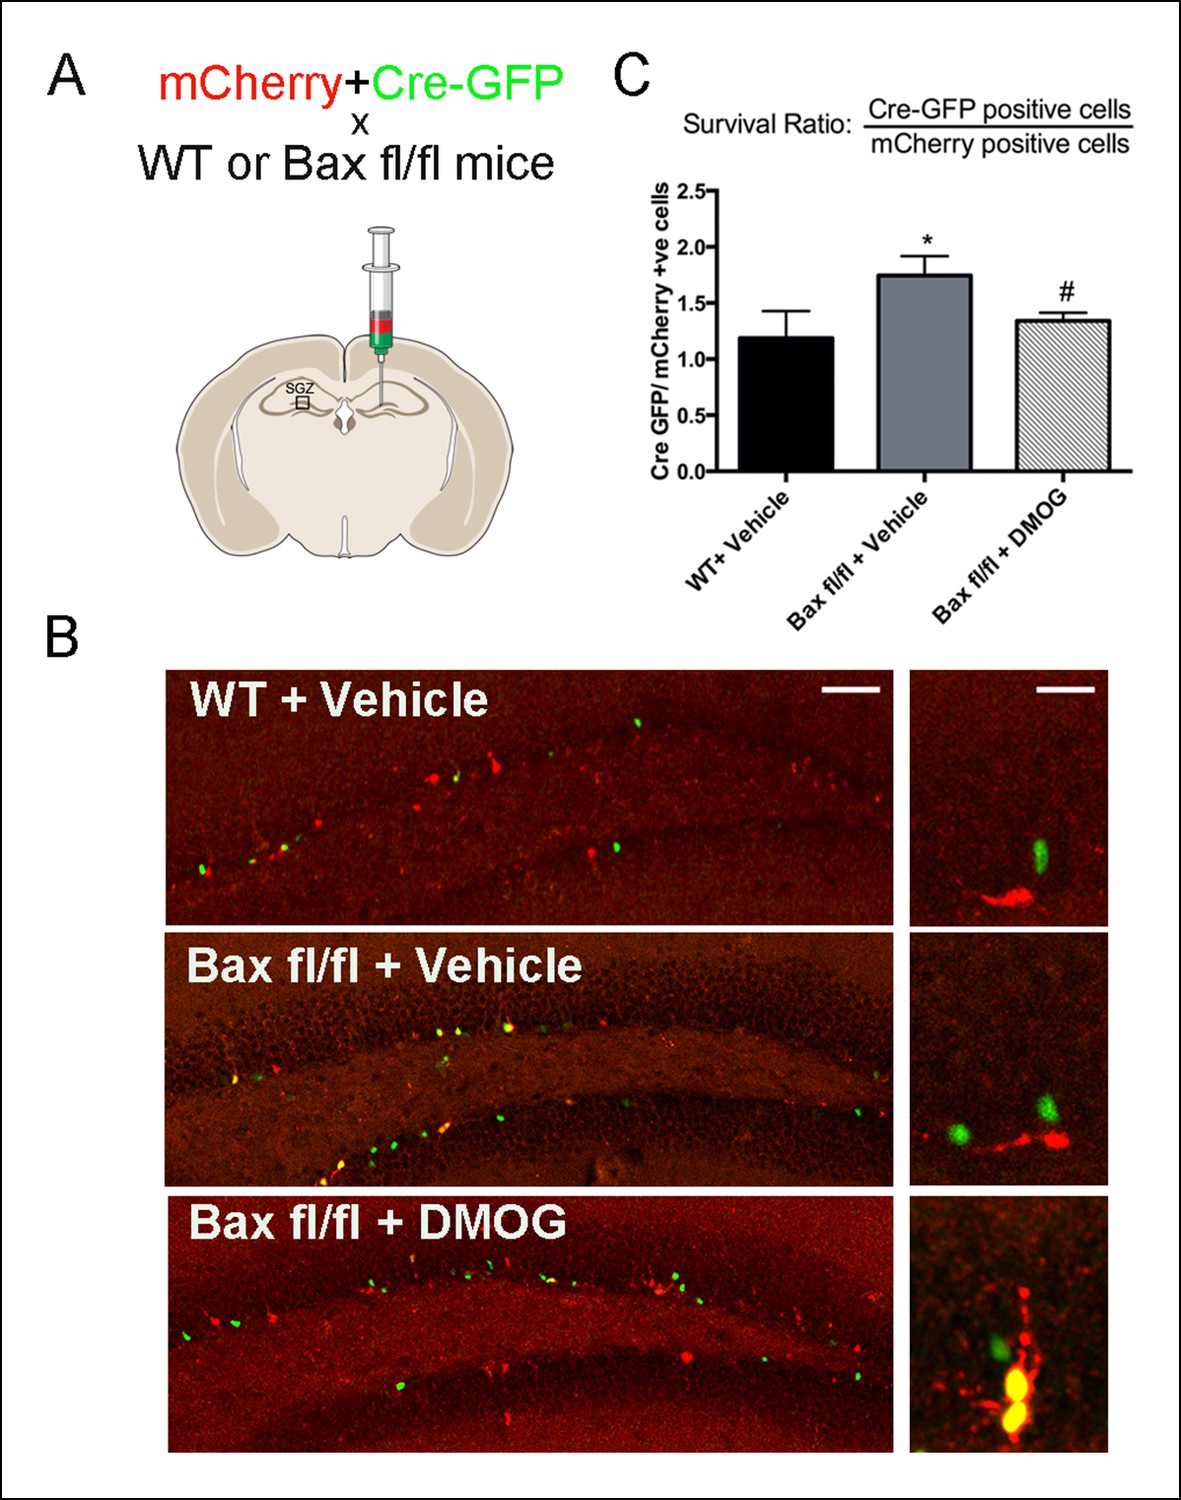
DMOG mimics the ablation of pro-apoptotic gene Bax in promoting survival of SGZ newborn cells.
(A) A fixed ratio mixture of two retoviruses (encoding nuclear Cre-GFP and mCherry) was injected into the adult DG of WT and Baxfl/fl mice. Survival of the newborn cells was analyzed at 7 days post injection following treatment with either vehicle or DMOG. (B) Representative images of virus-labeled cells from co-injection experiments in WT mice treated with vehicle, Baxfl/fl mice treated with vehicle and Baxfl/fl mice treated with DMOG (scale bar: left 100 μm, right 20 μm). (C) The ratio of Cre-positive to mCherry-positive cells at 7 dpi was used as a measure cell survival (see text). Data are plotted as mean ± SD. *: WT+ Vehicle vs Baxfl/fl + Vehicle, p = 0.002; #: Baxfl/fl + Vehicle vs Baxfl/fl + DMOG, p = 0.03; WT+ Vehicle vs Baxfl/fl vs DMOG: not significant.
Figure 6
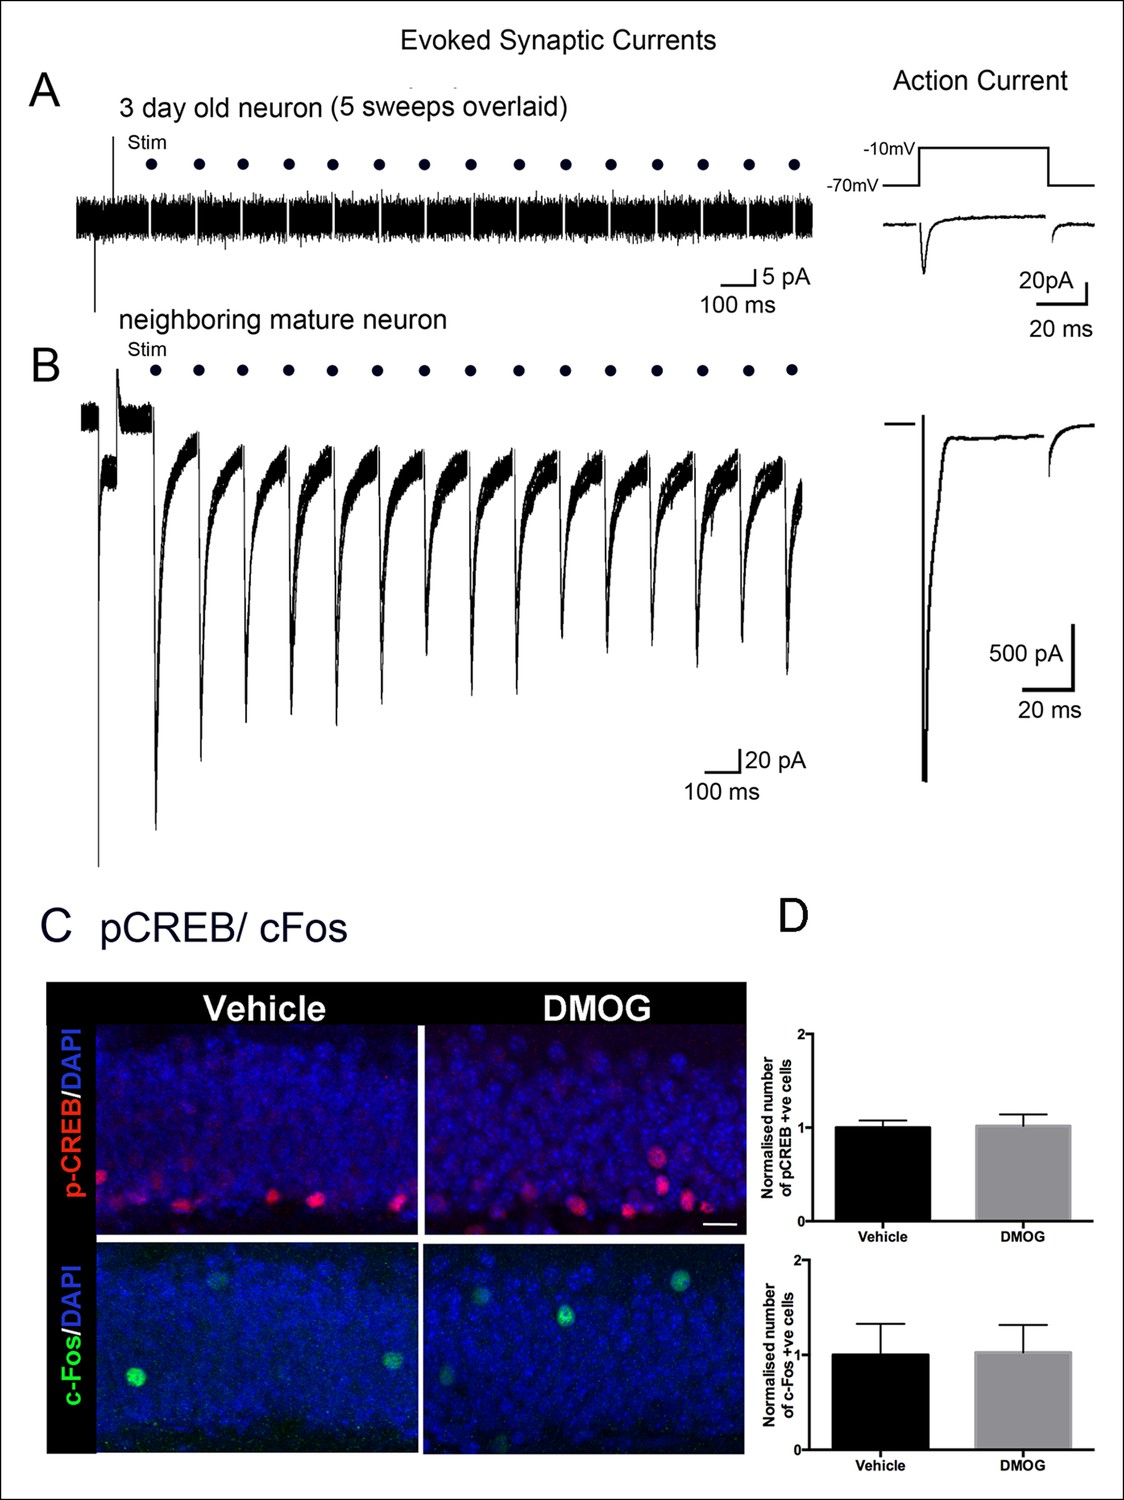
Adult-born granule cells lack synaptic responses 3 days post-mitosis.
(A) At 3-days post-mitosis, granule cell lack responses to afferent stimulation. Five consecutive sweeps from a retrovirus-labeled 3-day-old cell, recorded in whole-cell voltage clamp mode while stimulating afferent inputs in the middle molecular layer. A -10 mV voltage step at the beginning of each sweep demonstrated the high input resistance of these cells, which lacked any postsynaptic responses to stimulation (dots). (B) A mature granule cell immediately adjacent to the cell in A had robust post-synaptic currents to the same stimulation. Right panels: Voltage-dependent sodium current evoked in a 3-day-old granule cell during a step from -70 to -10 mV, demonstrating the neuronal identity of the cell (right upper panel). The voltage-dependent sodium current recorded from a mature granule cell was much larger (right lower panel). (C) Representative confocal images of p-CREB+ and c-Fos+ cells in the DG of animals treated with vehicle or DMOG for 3 days (scale bar: 10 μm). (D) Quantification of the normalized number of p-CREB+ and c-Fos+ cells in the DG of DMOG treated animals relative to vehicle treated ones. DMOG treatment did not alter the number of p-CREB+ or c-Fos+ cells. Bar charts are mean ± SD.
Figure 7
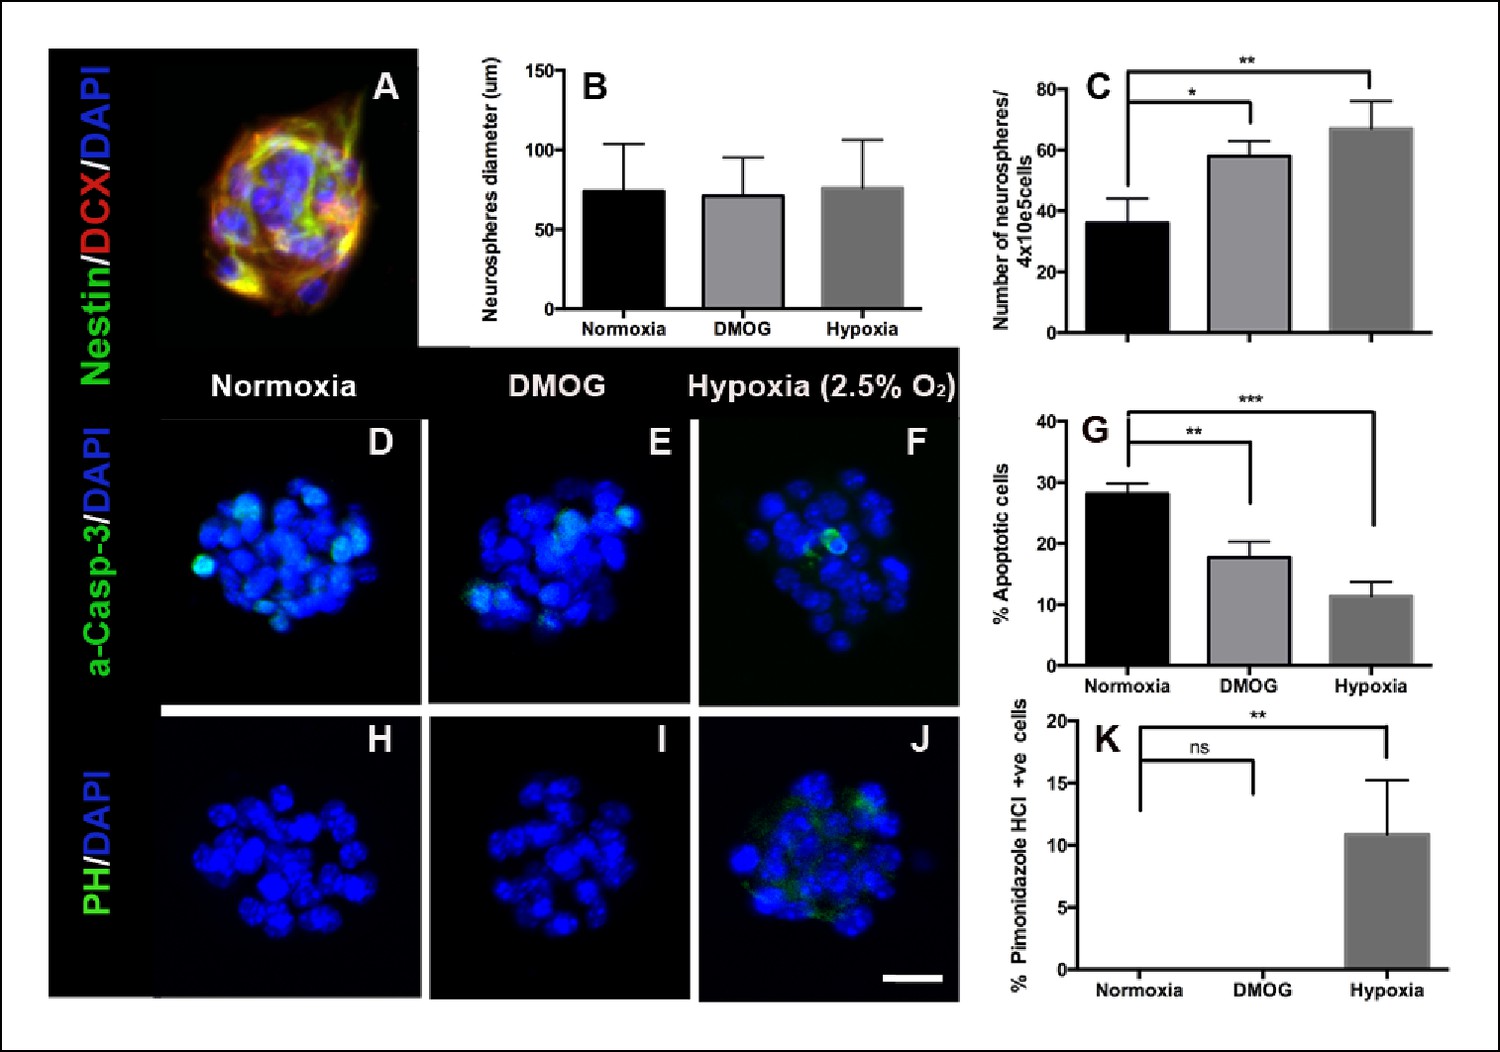
DMOG and Hypoxia increase survival of adult DG- derived neurospheres.
(A) Representative immunofluorescence image of an adult DG-derived neurosphere, composed of nestin+ and DCX+ progenitors. Quantification of neurosphere diameter (B) and number (C) in cultures grown at normoxia, in the presence of DMOG or under hypoxia (2.5% O2) for 7 days. (D–F) Representative immunocytochemistry for activated caspase-3 in neurospheres cultured under the 3 different experimental conditions. (G) Quantification of apoptotic (activated Caspase-3+) cells among the total number of cells in neurospheres exposed to normoxia, DMOG or hypoxia for 7 days. (H–J). Immunostaining with pimonidazole hydrochloride detected some hypoxic cells only in neurospheres cultured in 2.5% O2 for 7 days. (Scale bar: 25 μm). (K) Quantification of pimonidazole hydrochloride-positive cells among the total cell number in neurospheres exposed to normoxia, DMOG or hypoxia. Bar charts are mean ± SD (*p <0.05; **p <0.01; ***p <0.001).
Author response image 1
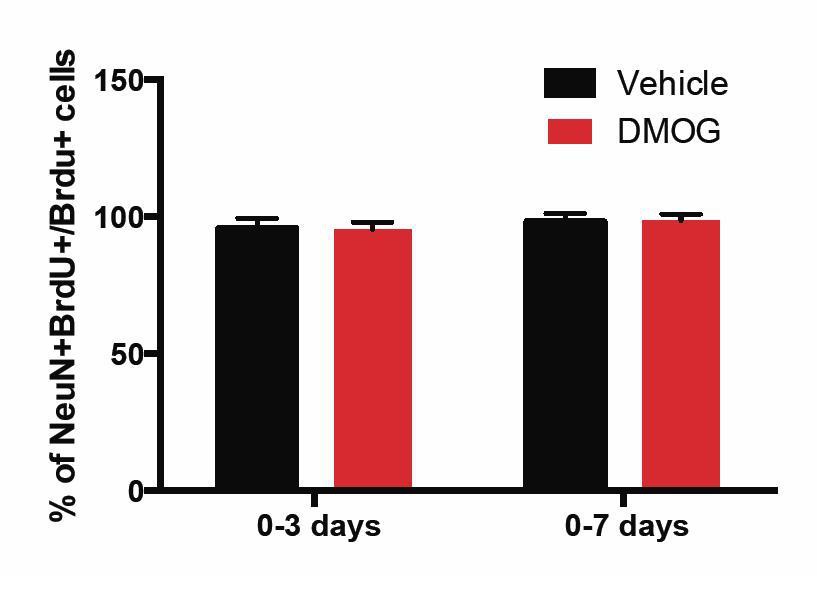
The percentage of BrdU+ cells in the GCL that was positive for the mature neuronal marker NeuN at 28 d.p.i. was similar between vehicle or DMOG treated animals during the two time-windows (0-3 and 0-7 days) of treatment that promoted survival of newborn neurons.
(0-3 days, Vehicle: 96 ± 4, DMOG: 95 ± 2 n=3; 0-7 days, Vehicle: 98 ± 3, DMOG: 96 ± 2, n=3).
Author response image 2
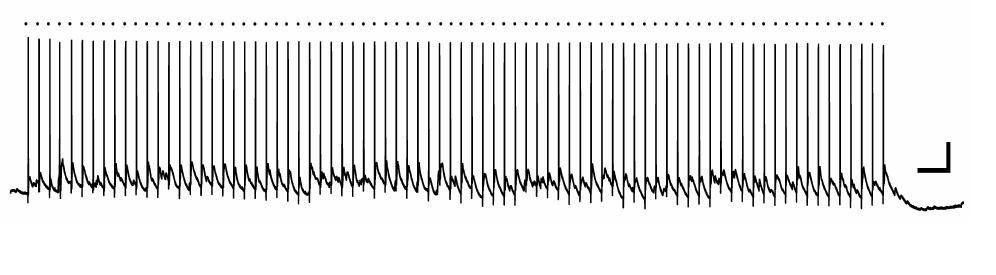
Hilar neuron activation by MML 8 Hz stimulation.
A bipolar stimulating electrode was placed in the middle molecular layer of the dentate gyrus of a mouse hippocampal slice, and a whole-cell current clamp recording was made from a hilar neuron. In this example, the hilar neuron spiked reliably in response to each stimulation episode (dot above trace). Scale bars, 20mV, 0.5 sec.
Download links
A two-part list of links to download the article, or parts of the article, in various formats.
Downloads (link to download the article as PDF)
Open citations (links to open the citations from this article in various online reference manager services)
Cite this article (links to download the citations from this article in formats compatible with various reference manager tools)
Localized hypoxia within the subgranular zone determines the early survival of newborn hippocampal granule cells
eLife 4:e08722.
https://doi.org/10.7554/eLife.08722


