Layer 2/3 pyramidal cells in the medial prefrontal cortex moderate stress induced depressive behaviors
- Howard Hughes Medical Institute, The Rockefeller University, United States
Figures
Figure 1 with 1 supplement
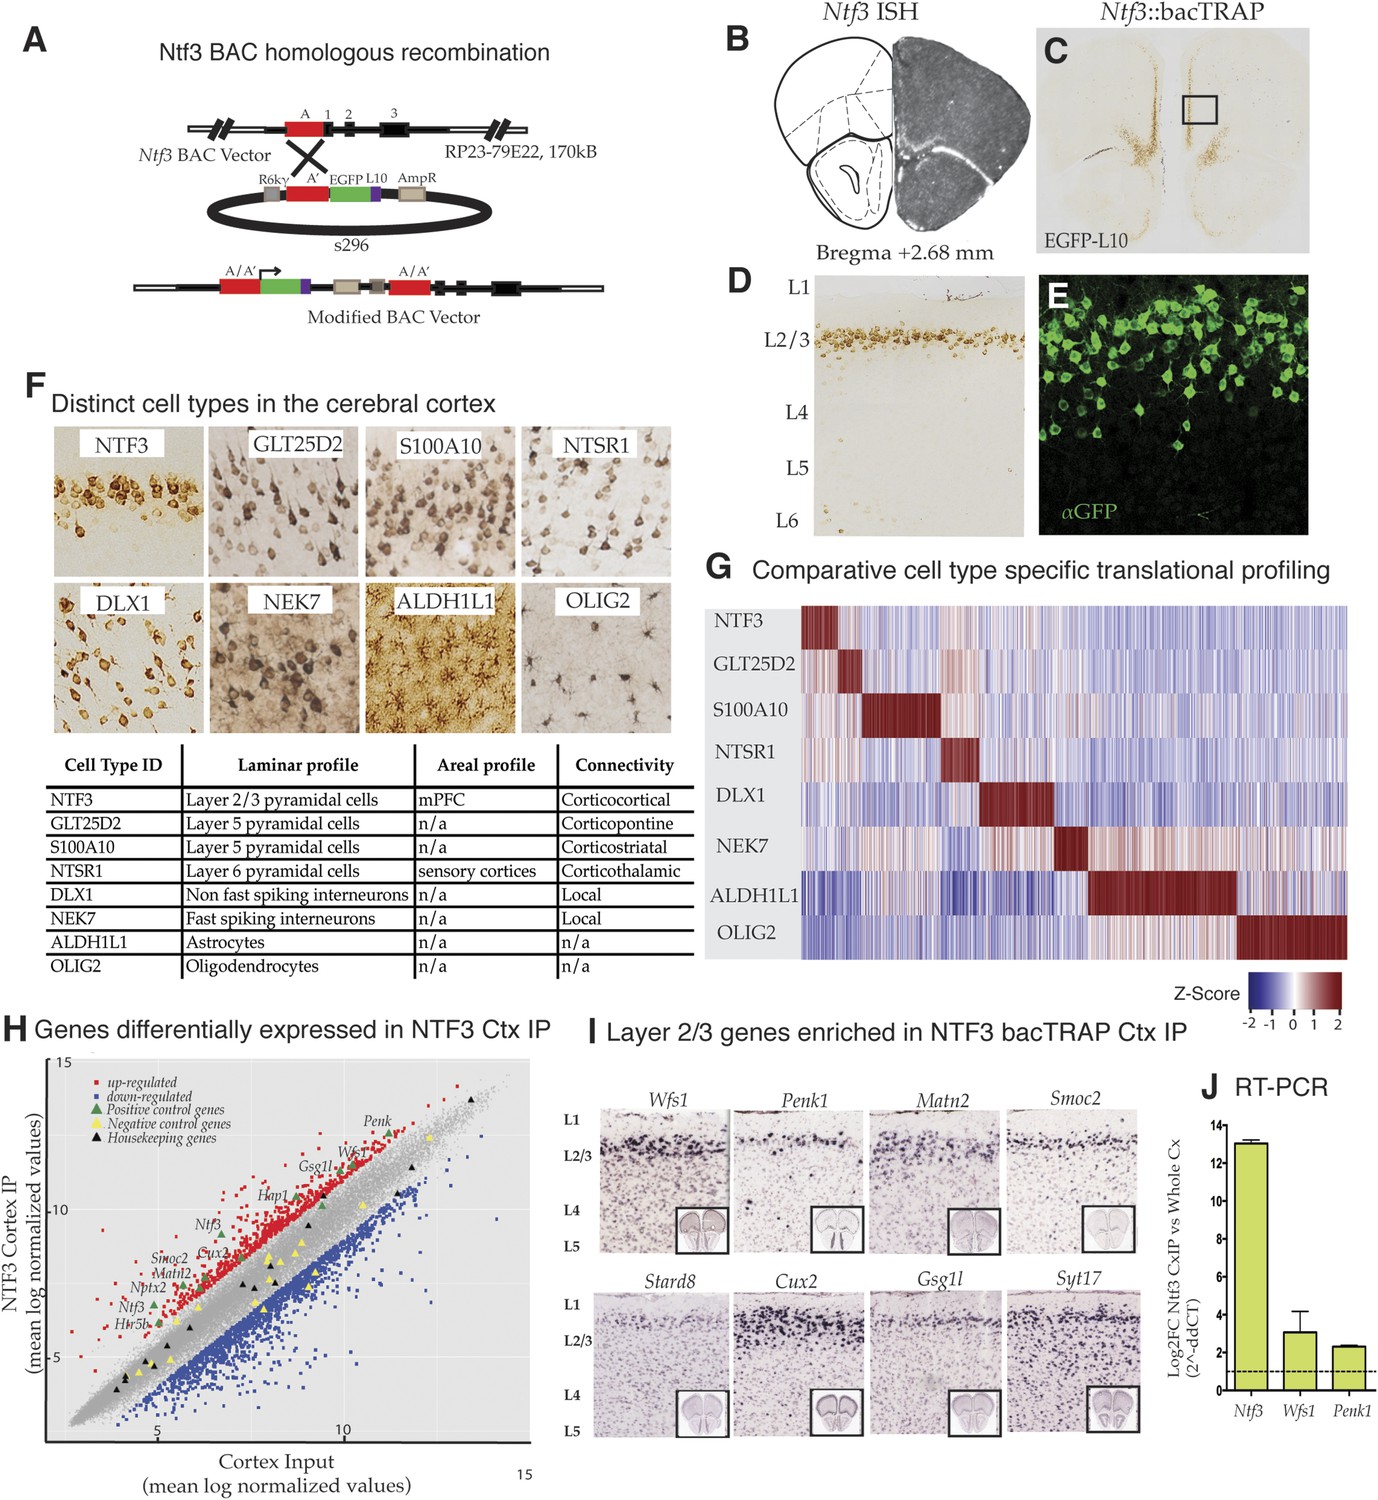
Identification and translational profile of a novel layer 2/3 pyramidal cell type in the cerebral cortex.
(A) Ntf3 BAC RP23-79E22 was modified with an EGFP/L10 cassette using BAC homologous recombination methodology as previously described (Gong et al., 2003). EGFP/L10 expression in Ntf3::bacTRAP line PS1046 recapitulates the pattern of endogeneous Ntf3 gene expression (B) (BGEM, ISH) in layer 2 of the medial prefrontal cortex (C, D). The EGFP/L10-positive cells in mPFC have pyramidal cellular morphology with an apical dendrite (E). Translational profiles of eight distinct cell types (F) in the cerebral cortex including distinct pyramidal cell types (NTF3, GLT25D2, S100A10, NTSR1), interneuron cell types (DLX1, NEK7), and glial cell types (ALDH1L1, OLIG2) were compared and shown in a heat map of cell-specific genes at 0.01 specificity index statistic threshold (G). Average normalized expression values of cell-specific enriched genes were z-transformed and plotted. Dark red = highly enriched. (H) Scatter plot of mean log normalized values of NTF3 Cortex IP vs cortex input. Red and blue closed squares represent differentially expressed genes at 0.05 FDR corrected p-values and twofold change in expression. Yellow triangles represent negative control genes that are markers for non-neuronal cell types. Black triangles represent housekeeping genes whose expression is expected to be constant between the NTF3 cortex IP and cortex input. (I) Several layer 2/3 genes were enriched in NTF3 cortex IP such as Wfs1, Penk1, Matn2, Smoc2, Stard8, Cux2, Gsg1l, and Syt17 (www.brain-map.org). (J) Quantitative RT-PCR independently confirm that Ntf3 (2^-ddCT = 12.09 ± 1.37), Wfs1 (2^-ddCT = 3.07 ± 0.86), and Penk1 (2^-ddCT = 2.69 ± 0.31) are enriched in the Ntf3 cortex IP.
-
Figure 1—source data 1
Top genes with the highest fold change difference in average expression between the NTF3 cortex IP and cortex input.
(N = 3 biological replicates).
- https://doi.org/10.7554/eLife.08752.004
-
Figure 1—source data 2
Genes highly ranked in NTF3 cell type by specificity index analysis across 8 cell types—GLT25D2 (corticopontine Layer 5 pyramidal cell type), S100A10 (corticostriatal Layer 5 pyramidal cell type), NTSR1 (corticothalamic Layer 6 pyramidal cell type), DLX (fast spiking inter-neurons), NEK7 (non-fast spiking inter-neurons), ALDH1L1 (astrocytes), and OLIG2 (oligodendrocytes).
- https://doi.org/10.7554/eLife.08752.005
Figure 1—figure supplement 1
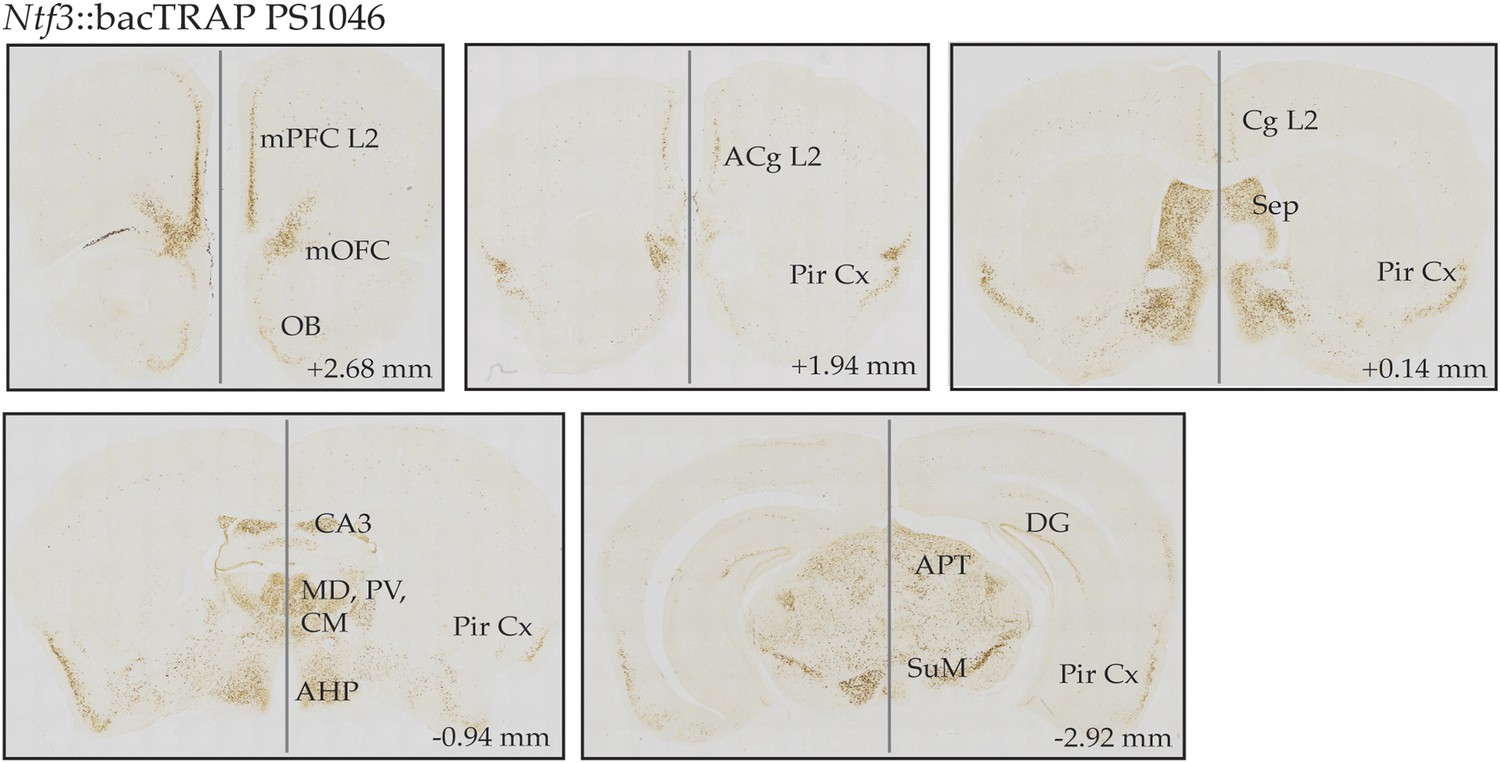
CNS expression pattern of EGFP.L10 in Ntf3 bacTRAP line PS1046.
DAB-based EGFP immunostaining is detected in the superficial layer 2/3 of medial cortical areas including medial prefrontal cortex (mPFC), medial orbitofrontal cortex (mOFC), anterior cingulate cortex (ACg), cingulate cortex (Cg); piriform cortex (Pir Cx), septum (Sep); thalamic nuclei such as mediodorsal thalamus (MD), paraventricular thalamus (PV), centromedial thalamus (CM); subregions of hippocampus including dorsal CA3 and dentate gyrus (DG); anterior nucleus of hypothalamus (AHP), anterior pretectal nucleus (APT), and supramamillary nucleus (SuM). Coordinates in the anterior–posterior (AP) axis relative to the bregma are indicated.
Figure 2

WFS1 is selectively enriched in NTF3 pyramidal cell population in the medial PFC.
Using custom synthesized antiserum for WFS1, it is evident that the medial PFC EGFP/L10 neuronal population of Ntf3::bacTRAP transgenic mice co-immunostains for WFS1 (A). WFS1 is present in layer 2/3 of the cerebral cortex including medial PFC, and at higher magnification, it is evident that WFS1 is distributed in the cell soma as well as primary dendrites of layer 2 pyramidal cells (B). The co-expression of WFS1 and Ntf3::EGFP is region specific. In the hippocampus, WFS1 is expressed in CA1, whereas Ntf3::EGFP is expressed in the dentate gyrus (C). Immunoelectron micrography with WFS1 antiserum further shows that WFS1 is associated with rough endoplasmic reticulum in layer 2/3 pyramidal cells in the medial PFC neurons that express WFS1 (D).
Figure 3
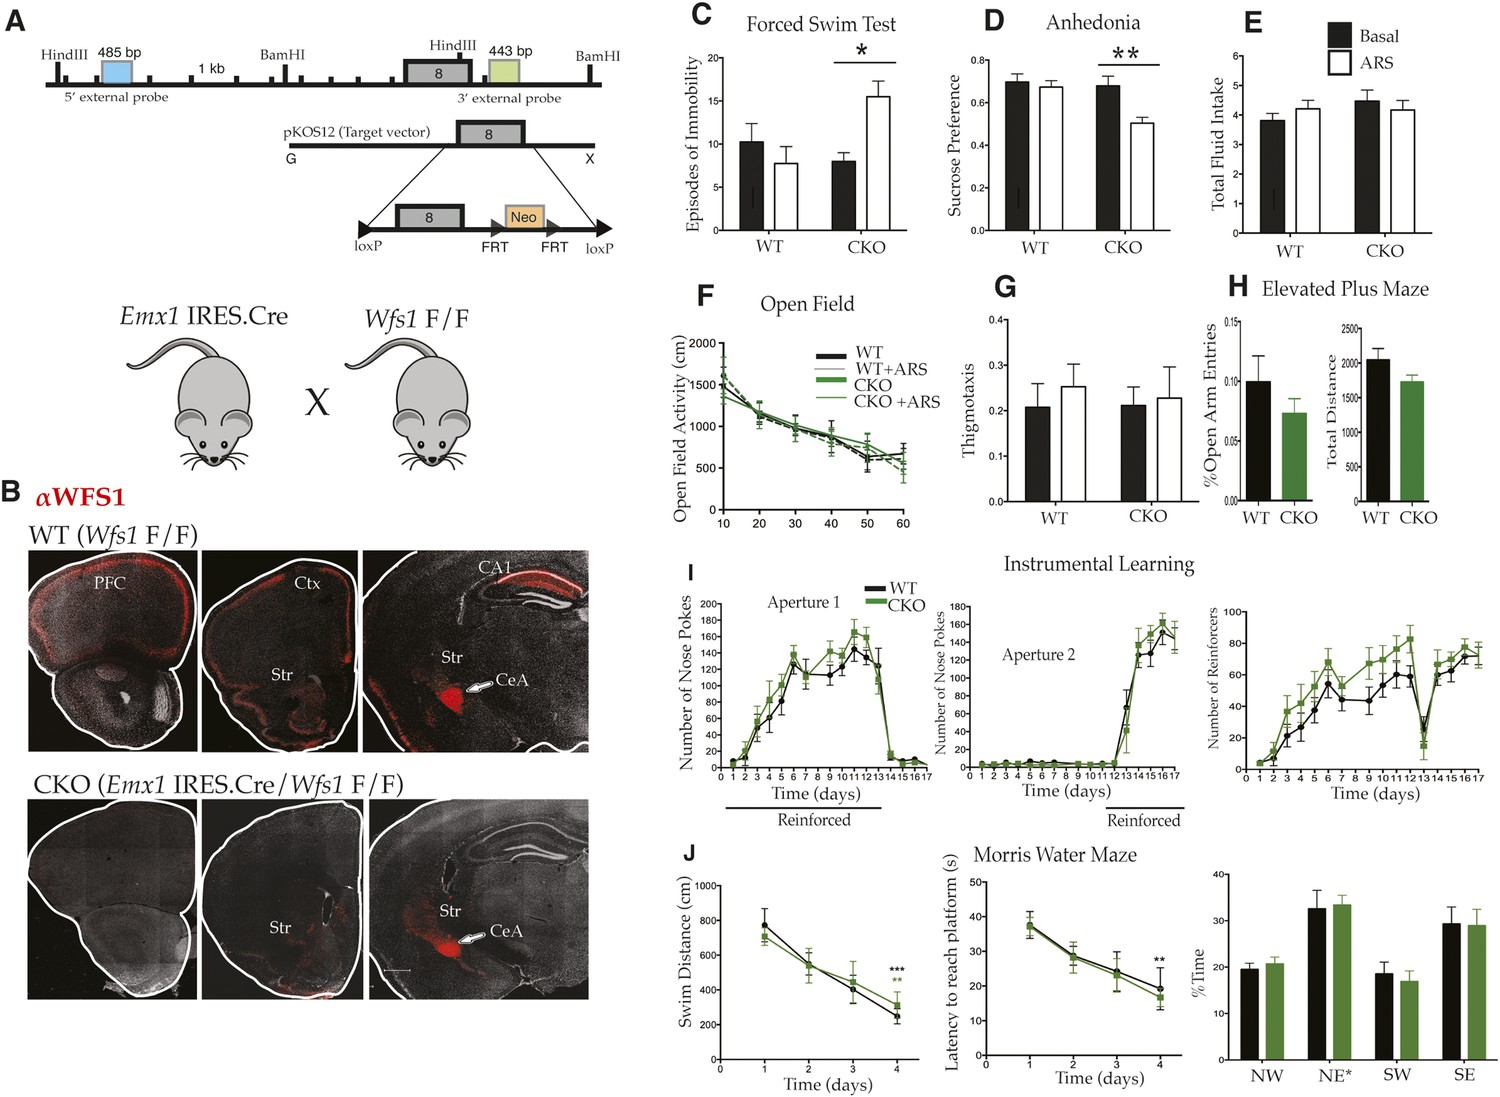
Selective deletion of Wfs1 in cortical excitatory neurons precipitates stress-induced depression-related behaviors.
(A) Wfs1-mutant mice were generated by incorporating the conditional Wfs1-targeting vector that has the largest exon, exon 8, flanked by loxP sites. Wfs1 conditional KO (Wfs1/CKO) mice were produced by breeding Wfs1-mutant mouse bearing the Wfs1 conditional allele with Emx1.IRES.cre knock in mouse. (B) Normal pattern of WFS1 expression in the cerebral cortex (PFC, Ctx) and subcortical structures including striatum (Str), central amygdala (CeA), and hippocampus (CA1) is evident in wt (Wfs1 F/F) mice (top panel) whereas the cortical expression (cerebral cortex and hippocampus) of WFS1 is lost in Emx1.IRES.Cre Wfs1 F/F (Wfs1/CKO) mice. Wfs1 expression in CeA of Wfs1/CKO mouse brain is intact (bottom panel). (C) Wfs1/CKO mice exhibit equivalent episodes of immobility as WT mice in Porsolt's Forced Swim Test (FST) under baseline conditions but following acute restraint stress (ARS), they exhibit behavioral despair as indicated by increased episodes of immobility. FST: Two-way ANOVA—Bonferroni post hoc test: CKO Basal vs CKO + ARS, p < 0.05*, n = 8 per group. (D) Wfs1/CKO mice become anhedonic following ARS and lose normal preference for sucrose, but their total fluid intake is unchanged compared with WT regardless of exposure to stress (E). Sucrose preference test: Two-way ANOVA—Bonferroni post hoc test: CKO Basal vs CKO + ARS, p < 0.001**, n = 10 per group. Wfs1/CKO mice exhibit normal levels of spontaneous locomotion and acclimation to a novel arena in the open field test under baseline conditions and following ARS (F). Wfs1/CKO mice do not exhibit anxiety-related behavior following ARS as assayed by thigmotaxis in the open field arena (G). Likewise, the percentage time spent in open arms of the elevated plus maze is comparable for both genotypes (H). Wfs1/CKO mice display normal instrumental learning and reversal in three-choice operant chamber (I), and they display normal spatial learning and memory in Morris water maze in measures of swim distance, latency to reach platform, and % time spent in the probe quadrant NE post training (J).
Figure 4
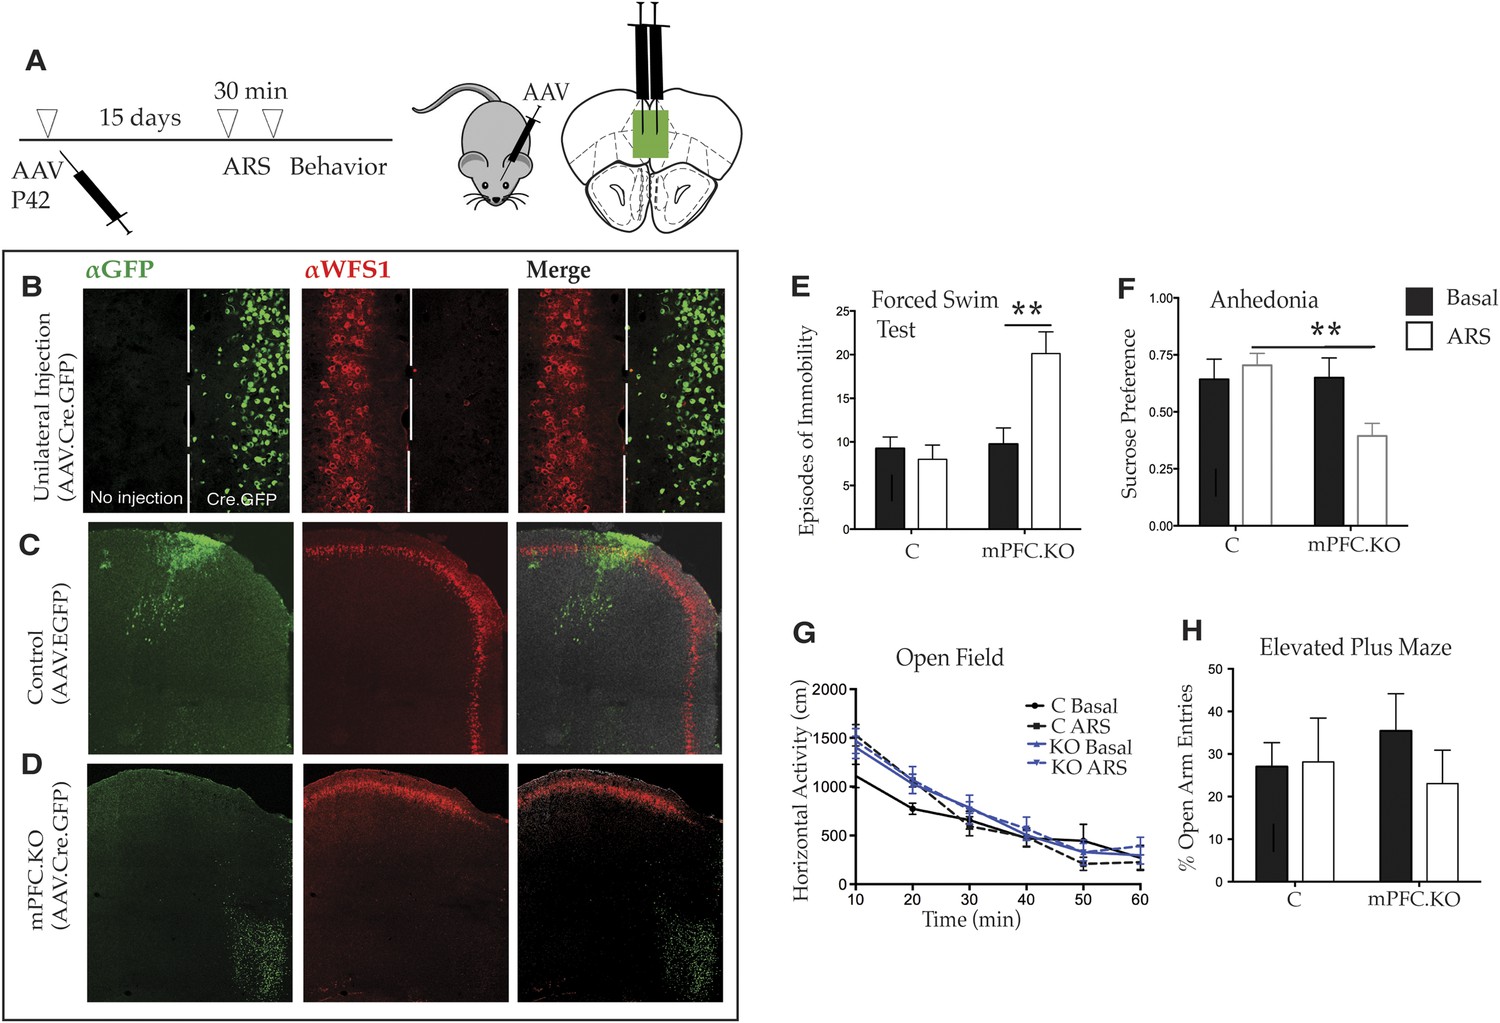
Deletion of Wfs1 in the medial PFC is sufficient to cause stress-induced depression-related behavior.
(A) AAV2 expressing Cre recombinase tagged at the N-terminus with GFP (AAV2.CMV.HI.GFP-Cre.SV40) or control AAV2 expressing EGFP (AAV2.CMV.PI.EGFP.WPRE.bGH) was injected bilaterally in the medial PFC of Wfs1 F/F mice at P42 and allowed to express for 15 days. A subset of mice from both injected groups was subjected to 30 min ARS and 5 min short recovery followed by relevant behavioral assays. (B) Stereotaxic unilateral injection of AAV2.CMV.HI.GFP-Cre.SV40 in medial PFC demonstrates extremely high efficiency of the viral knockout strategy in deleting Wfs1 around site of injection. Compared with control vector injected mice which did not affect WFS expression, bilateral injection of AAV2.CMV.HI.GFP-Cre.SV40 results in loss of WFS1 in medial PFC (Wfs1/mPFC.KO) (C and D). (E) Under baseline conditions, Wfs1/mPFC.KO mice do not exhibit depression-related behaviors but following ARS, Wfs1/mPFC.KO mice exhibit a strong increase in episodes of immobility in Forced Swim Test (FST) (Two-way ANOVA—Bonferroni post hoc test: mPFC.KO Basal vs mPFC.KO + ARS, p < 0.01**, N = 8 per group). Wfs1/mPFC.KO mice also exhibit anhedonia following ARS in the sucrose preference test (SPT) (Two-way ANOVA—Bonferroni post hoc test: C + ARS vs mPFC.KO + ARS, p < 0.01**, N = 7 per group) (F). Wfs1/mPFC.KO mice have normal levels of spontaneous activity in the open field arena (G) and do not exhibit anxiety-related behavior in elevated plus maze as measured by percentage open arm entries (H).
Figure 5

Wfs1/CKO mice display hyperactivation of the hypothalamic–pituitary–adrenal (HPA) axis in response to stress.
Acute exposure to restraint stress significantly elevates cFos activation in the hypothalamic paraventricular nucleus in both groups of animals compared to basal conditions, but ARS also leads to a significantly higher increase of cFOS immunostaining in the PVN of Wfs1/CKO mice compared with controls (A and B) (Two-way ANOVA—Bonferroni post hoc test: WT + ARS vs CKO + ARS, p < 0.001***, N = 3 per group). Further downstream in the HPA axis, Wfs1/CKO mice release a significantly higher level of serum corticosterone (p < 0.001***) compared with controls (C) up on exposure to ARS (Two-way ANOVA—Bonferroni post hoc test: WT + ARS vs CKO + ARS, p < 0.001***, N = 5 per group). The intra-assay and inter-assay variability for the RIA were 5.08% CV and 1.99% CV, respectively. Our data support a model in which loss of Wfs1 in forebrain neurons causes hyperactivation of the PVN and the HPA axis is response to stress (D).
Figure 6
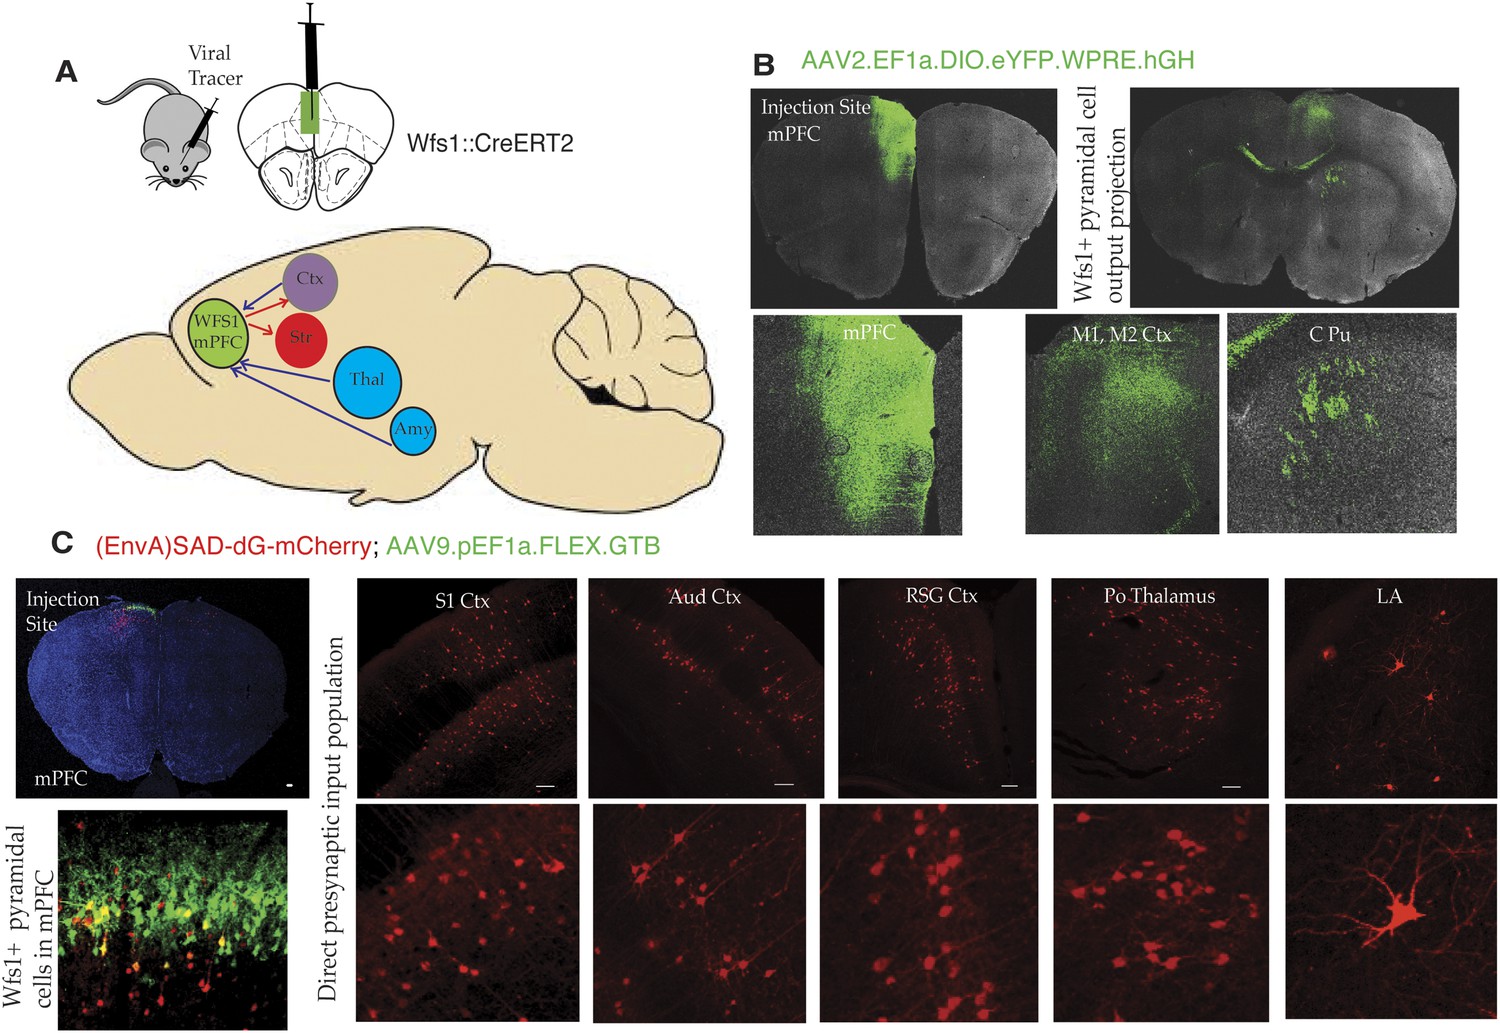
Connectivity of Wfs1-expressing pyramidal cells in the medial PFC.
(A) Two different viral tracer strategies were applied to identify projections originating in mPFC Wfs1 pyramidal neurons (output) and monosynaptically connected presynaptic partners (input). (B) Cre-dependent AAV reporter virus (AAV2.EF1a.DIO.eYFP.WPRE.hGH) was injected in the mPFC of Wfs1::CreERT2 mice to map projections of Wfs1 pyramidal neurons expressing CreERT2 to the contralateral motor cortex (M1, M2) and caudate putamen (CPu). (C) Two-virus monosynaptic circuit tracing approach was used to identify direct presynaptic partners of Wfs1-expressing cells in the mPFC. A helper virus expressing Cre-dependent eGFP and TVA (AAV9-pEF1a-FLEX-GT) was injected into mPFC of Wfs1:CreERT2 mice and allowed to express for 6 weeks, followed by injection of glycoprotein deleted rabies virus expressing mCherry [(EnvA)SAD-dG-mCherry] that allows specific retrograde labeling of neurons making direct monosynaptic connections to the Wfs1 cells in mPFC. This strategy reveals that Wfs1 pyramidal neurons receive direct presynaptic input from neuronal populations in cortical areas including primary somatosensory cortex (S1 Ctx), auditory cortex (Aud Ctx), retrospenial granular cortex (RSG Ctx), posterior thalamic nuclear group (Po), and lateral amygdala (LA).
Figure 7

Wfs1 is required for normal endoplasmic reticulum function in the prefrontal cortex.
Abundance of secreted polypeptides specifically enriched in the layer 2/3 pyramidal neurons is altered in the prefrontal cortex of Wfs1/CKO mice following ARS. (A) In the PFC lysates, WNT7a is significantly reduced in the Wfs1/CKO mice exposed to ARS (Two-way ANOVA—Bonferroni post hoc test: CKO Basal vs CKO + ARS, p < 0.001**, N = 3 per group). (B) proNTF3, the 23 kDa precursor of NTF3, is strongly elevated in Wfs1/CKO mice exposed to ARS indicating dysregulated precursor processing (Two-way ANOVA—Bonferroni post hoc test—CKO Basal vs CKO + ARS, p < 0.0001***, N = 3 per group). (C) BDNF, whose expression is not restricted to the layer 2/3 pyramidal cells in the prefrontal cortex, is not significantly altered. Abundance of the same polypeptides, WNT7a, proNTF3 and BDNF are not altered in the hippocampus (HPC) lysates regardless of the genotype and exposure to stress (D, E, F).
Download links
A two-part list of links to download the article, or parts of the article, in various formats.
Downloads (link to download the article as PDF)
Open citations (links to open the citations from this article in various online reference manager services)
Cite this article (links to download the citations from this article in formats compatible with various reference manager tools)
Layer 2/3 pyramidal cells in the medial prefrontal cortex moderate stress induced depressive behaviors
eLife 4:e08752.
https://doi.org/10.7554/eLife.08752


