A neural command circuit for grooming movement control
- Howard Hughes Medical Institute, United States
- University of California, Santa Barbara, United States
Figures
Figure 1 with 4 supplements
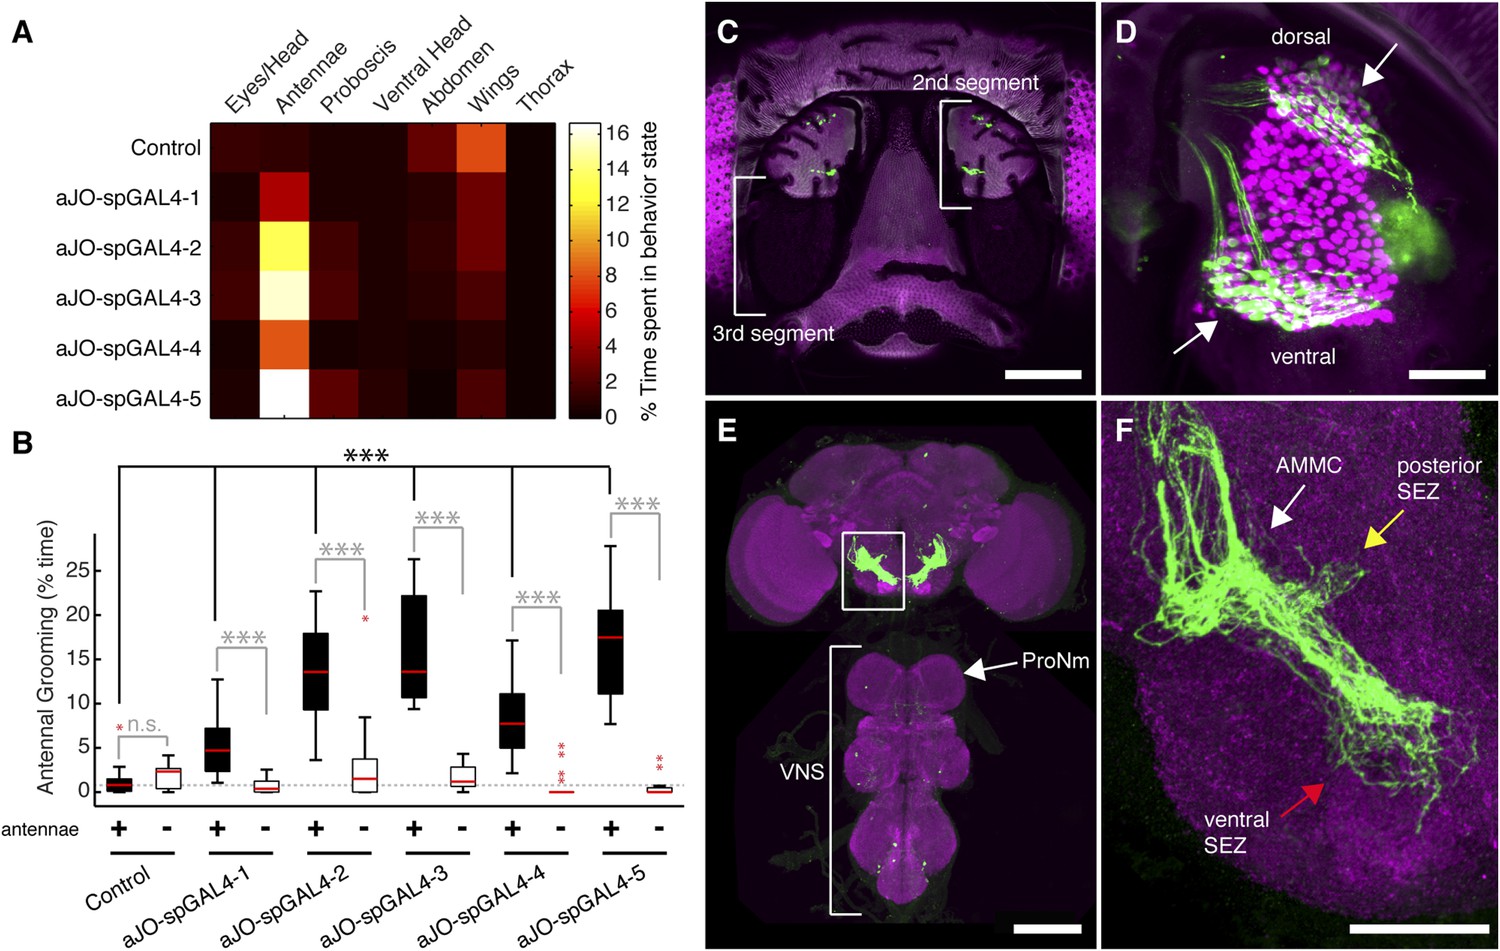
Sensory neurons that elicit antennal grooming.
(A) Grooming movements performed by flies in which aJO spGAL4 pairs drove expression of thermally activated dTrpA1. Movements were manually scored from 2 min of recorded video per fly (n ≥ 17 flies per spGAL4). Colors correspond to the percent of total time spent performing each movement. (B) Percent time flies spent antennal grooming with thermogenetic activation of neurons targeted by spGAL4 pairs, with or without their antennae (filled or open boxes, respectively). Bottom and top of the boxes indicate the first and third quartiles respectively; median is the red line; whiskers show the upper and lower 1.5 IQR; red dots are data outliers (n ≥ 17 for each box; asterisks show p < 0.0001, Kruskal–Wallis and post hoc Mann–Whitney U pairwise tests with Bonferroni correction). Dotted line marks the median of the intact control. (C–F) aJO-spGAL4-1 driving expression of green fluorescent protein (GFP). Maximum intensity projections are shown. (C) Frontal view of the head (native GFP fluorescence, green; cuticle autofluorescence, magenta). Left bracket shows the third antennal segment. Right bracket marks the second antennal segment, which is shown in (D). Scale bar, 100 μm. (D) Second antennal segment co-stained with anti-GFP (green) and anti-Elav (magenta, marks neuronal nuclei) antibodies. White arrows show the ventral and dorsal aJO clusters. Scale bar, 25 μm. (E, F) Central nervous system (CNS) co-stained with anti-GFP (green) and anti-Bruchpilot (magenta) to visualize the aJO afferent projections into the ventral brain neuropile (E) and their specific targeting of the indicated antennal mechanosensory and motor center (AMMC) and subesophageal zone (SEZ) regions (arrows shown in F). Box in (E) indicates region shown in F. Scale bars, (E) 100 μm and (F) 25 μm. Prothoracic neuromeres (ProNm). Ventral nervous system (VNS). See also Figure 1—figure supplement 1 and Figure 1—figure supplement 2.
Figure 1—figure supplement 1
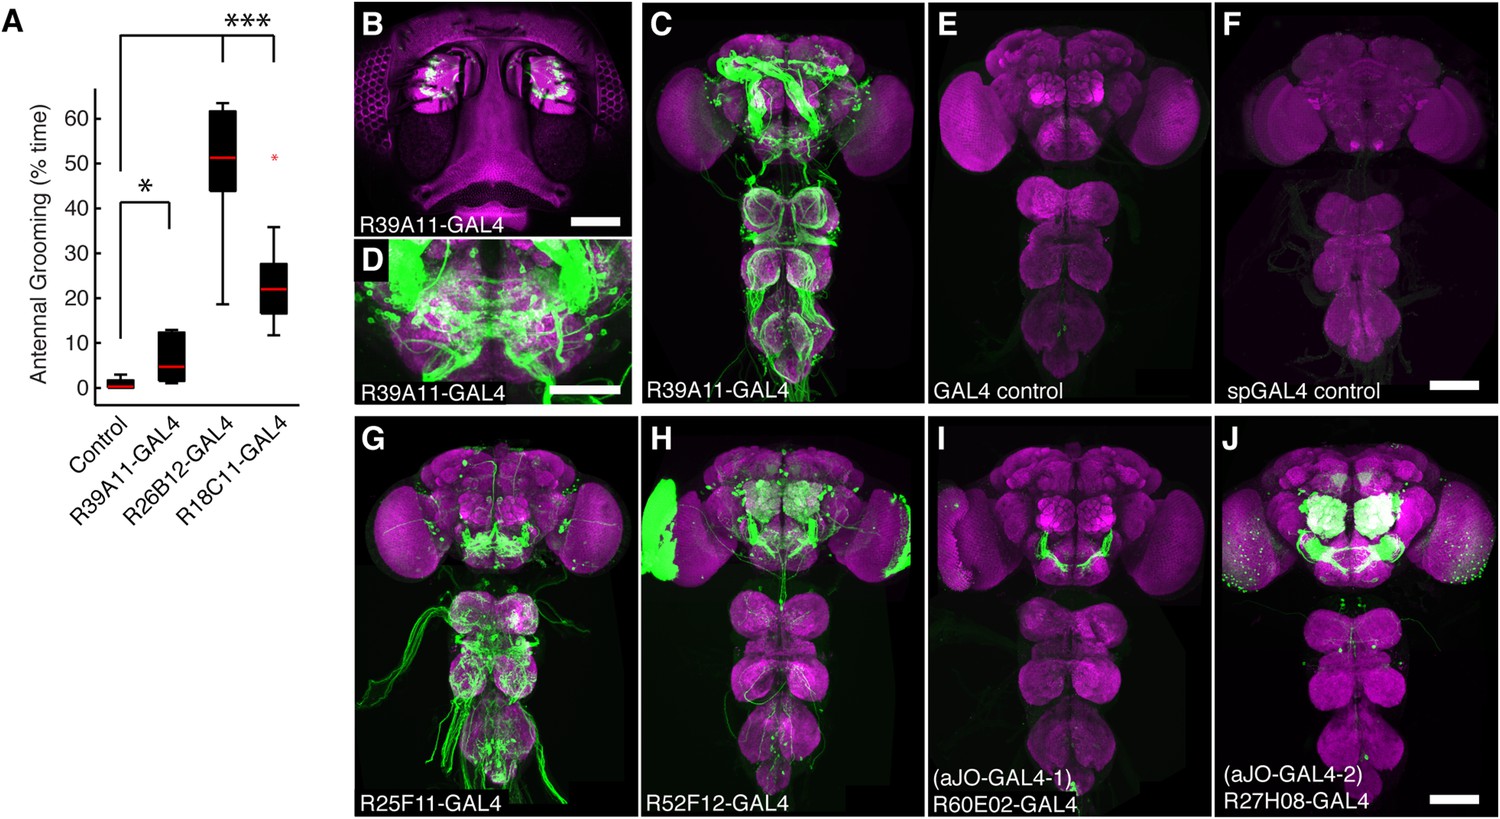
GAL4 lines that target expression to sensory neurons from the antennae and elicit grooming.
(A) Percent of total time three GAL4 lines expressing dTrpA1 spent antennal grooming, compared with controls. Box plots, statistics, and experimental conditions are as described in Figure 1A,B (n ≥ 10, asterisks represent: ***p < 0.001, *p < 0.01). R26B12-GAL4 and R18C11-GAL4 expression patterns are shown in Figure 2—figure supplement 1B,C. (B) Head GFP expression pattern of R39A11-GAL4 (native GFP fluorescence shown, green). The cuticular autofluorescence is shown in magenta. Scale bar, 100 μm. (C, D) Expression in (C) the CNS and (D) SEZ of R39A11-GAL4. Brains were co-stained with anti-GFP (green) and anti-bruchpilot (magenta). Scale bar, (D) 50 μm. (E, F) CNS images of control lines used in this study: (E) GAL4 and (F) spGAL4 controls do not show significant expression. Scale bars, 100 μm. (G, J) GFP expression patterns of the CNS of GAL4 lines that had expression in sensory neurons projecting from the antennae and displayed increased antennal grooming with dTrpA1. (G) R25F11-GAL4, (H) R52F12-GAL4, (I) R60E02-GAL4 (aJO-GAL4-1) and (J) R27H08-GAL4 (aJO-GAL4-2).
Figure 1—figure supplement 2
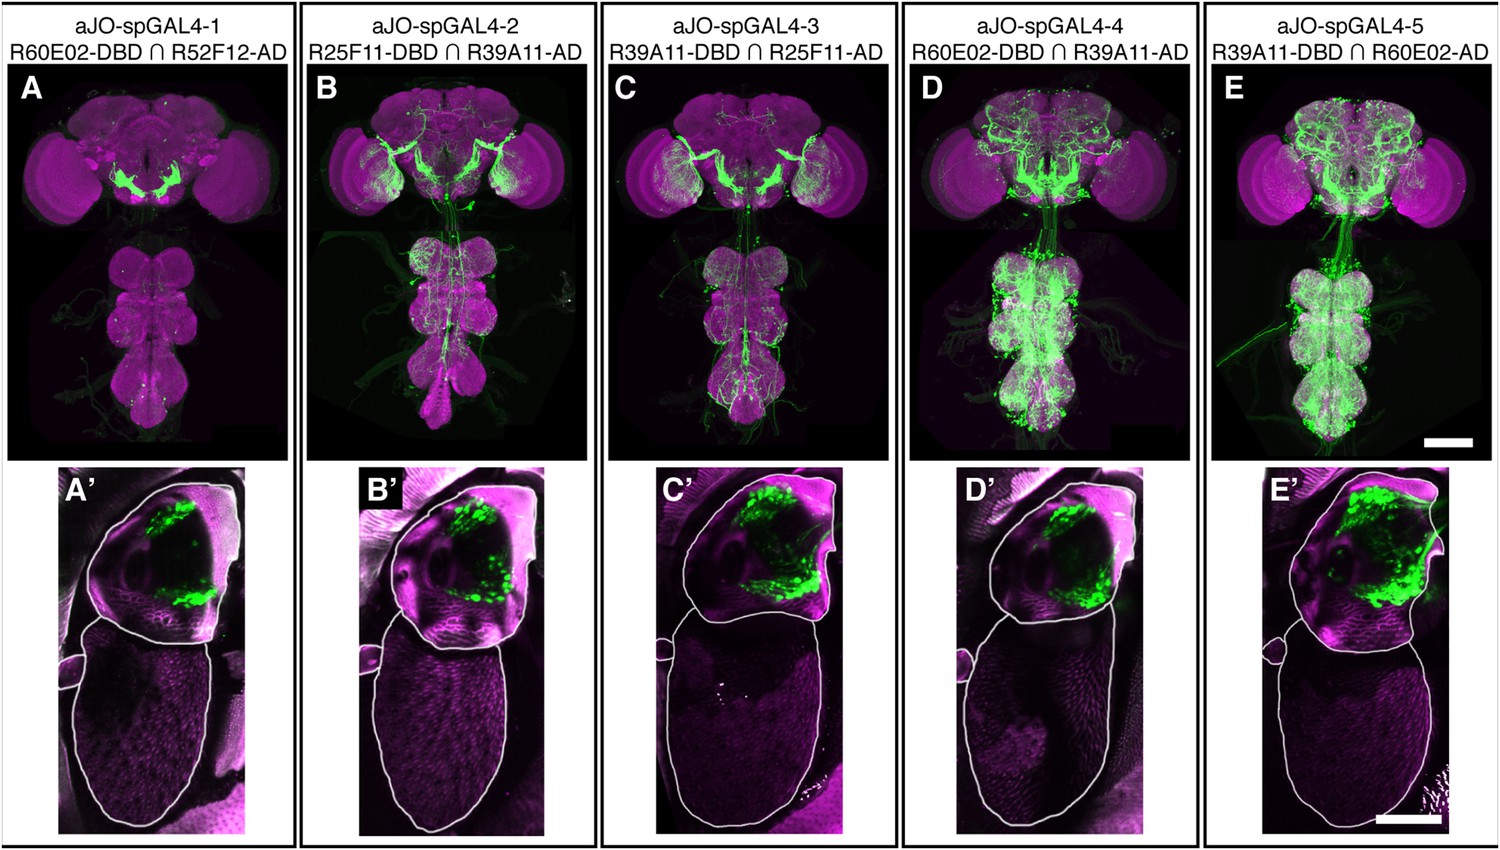
spGAL4 pairs that target expression to sensory neurons in the antennae and elicit grooming.
(A–E) CNS expression patterns of spGAL4 line pairs that displayed increased antennal grooming with dTrpA1. (A′–E′) Native GFP expression (green) in the antennae of corresponding spGAL4 lines shown in A–E. The cuticular autofluorescence is shown in magenta. Scale bars, 50 μm.
Figure 1—figure supplement 3

JO neurons projecting to zone C/E elicit antennal grooming.
(A, B) Co-expression of JO sensory neurons using aJO-LexA to express GFP (green) and (A) JO4-GAL4 or (B) JO31-GAL4 lines to express tdTomato (magenta). See Figure 4—figure supplement 1 for more details about aJO-LexA. aJO-LexA neurons have distinct projections in the ventral SEZ (middle and right panel, red arrows), but show overlapping arborizations with zone C/E neurons in the AMMC region (right panel, white arrows) driven by JO4-GAL4. Note in A (left and right panel) that aJO-LexA does not overlap with the zone A projections (blue arrow). Scale bar, 50 μm. (C–G) CNS expression patterns of JO-GAL4 lines that target different zones in the AMMC. (C) JO4-GAL4 (zones A and C/E); (D) JO31-GAL4 (zones C/E); (E) JO3-GAL4 (zones A, B, C/E, D); (F) JO22-GAL4 (zone A), and (G) JO15-GAL4 (zone A and B). Scale bar, 100 μm. (H) Number of bouts per minute of antennal grooming that each JO-GAL4 line expressing CsChrimson performed with optogenetic activation, with or without their antennae (filled or open boxes, respectively). Box plots and statistics are described in Figure 1B. (n ≥ 4 flies per JO-GAL4, asterisks represent: *p < 0.05, **p < 0.01, ***p < 0.001.)
Figure 1—figure supplement 4
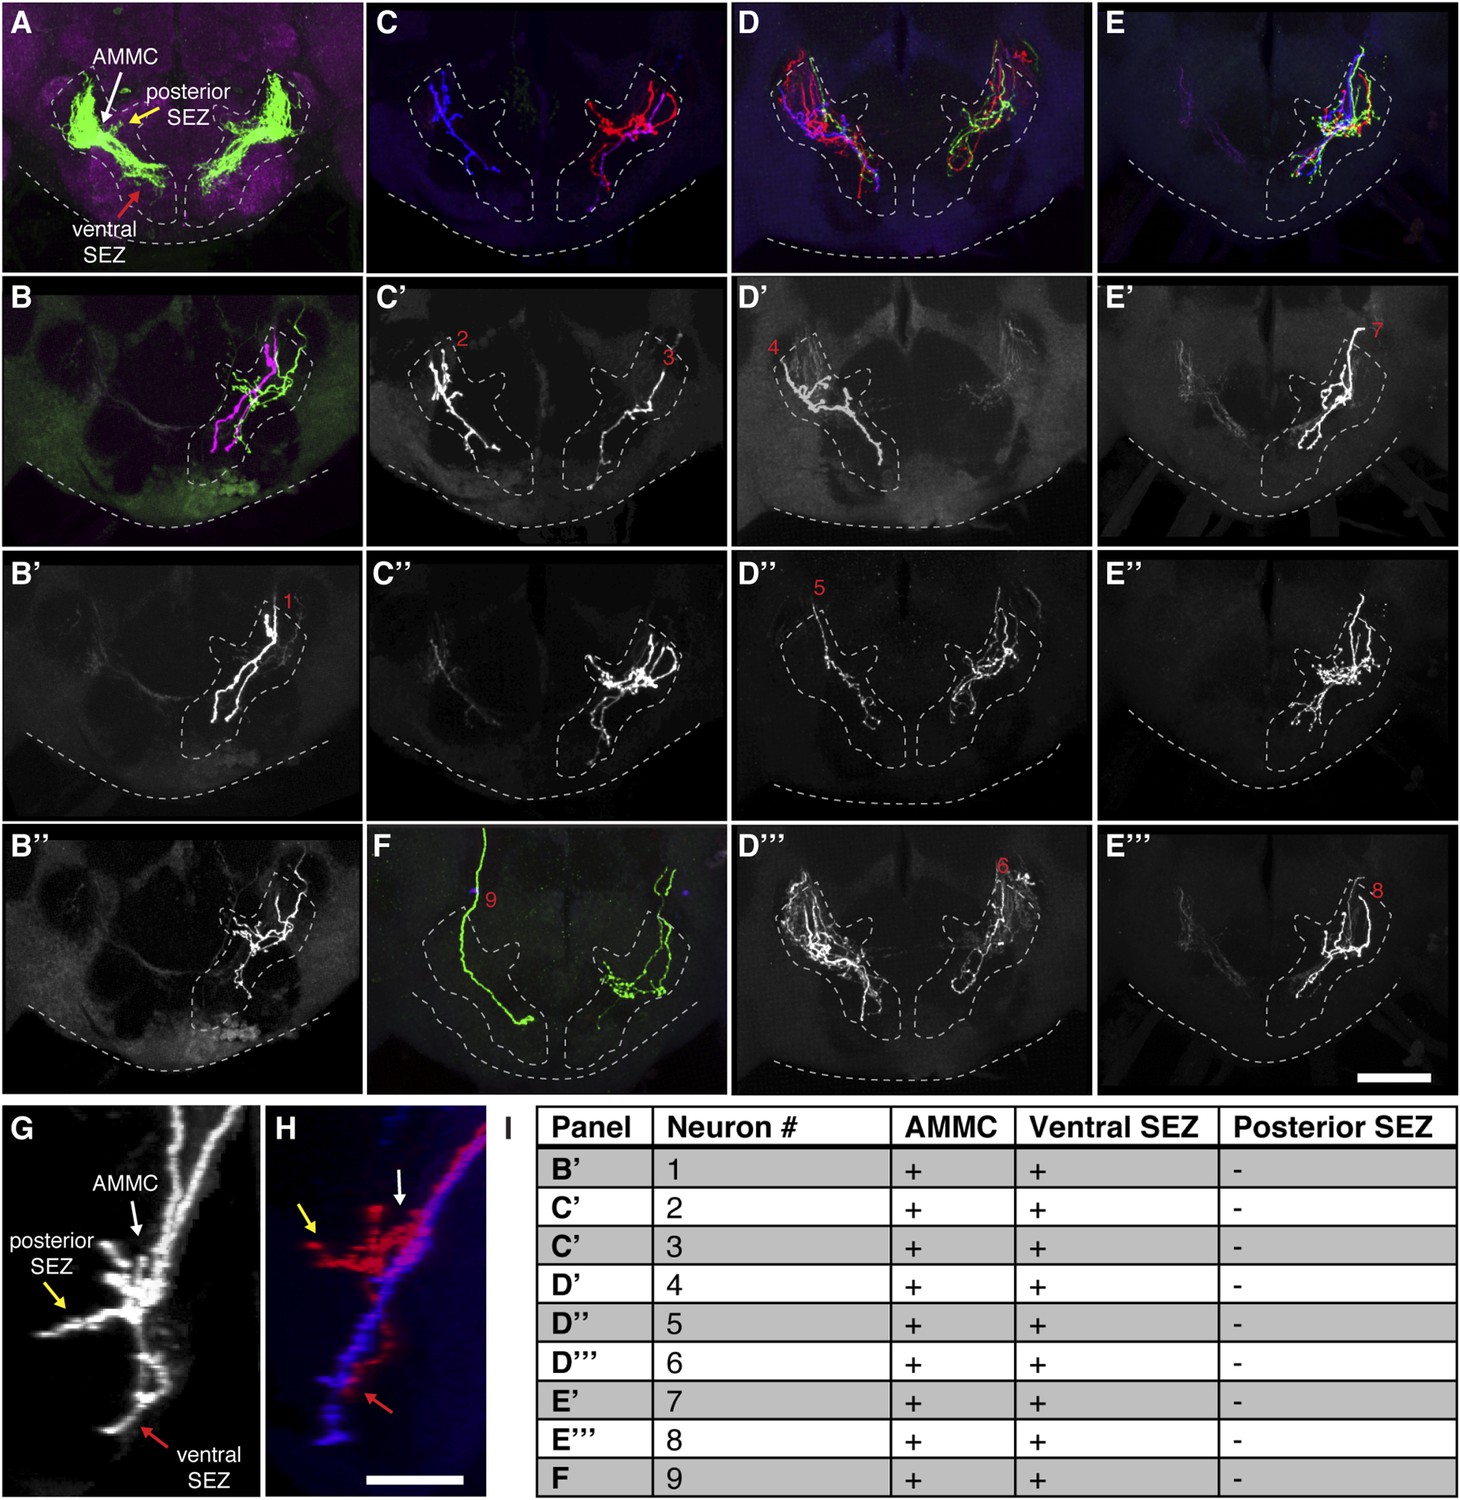
Most stochastically labeled aJO neurons show projections to both the AMMC and ventral SEZ.
(A) Overview of the aJO neuron population with AMMC, posterior, and ventral SEZ projections (white, yellow, and red arrows point to each projection respectively). (B–F) Multicolor stochastic labeling of aJO neurons in five different brains. The full patterns shown in panels B, C, D, E, F, whereas the separated channels are shown in panels B′, B′′, C′, C′′, D′–D′′′, E′–E′′′. Cases where single neuron clones were obtained using this method are labeled with red numbers. (G, H) Lateral view of two neurons labeled with the same color from panel B′′ in (G) and from panel C in (H) show projections to the AMMC (white arrow), ventral SEZ (red arrow) and posterior SEZ (yellow arrow). (I) Table shows the analysis of the projection branches of individual neurons corresponding with the red numbers in the figure panels. The + or − signs indicate that the neurons either do or do not project to the indicated region respectively. Scale bars, 50 μm.
Figure 2 with 2 supplements
Interneurons that elicit antennal grooming.
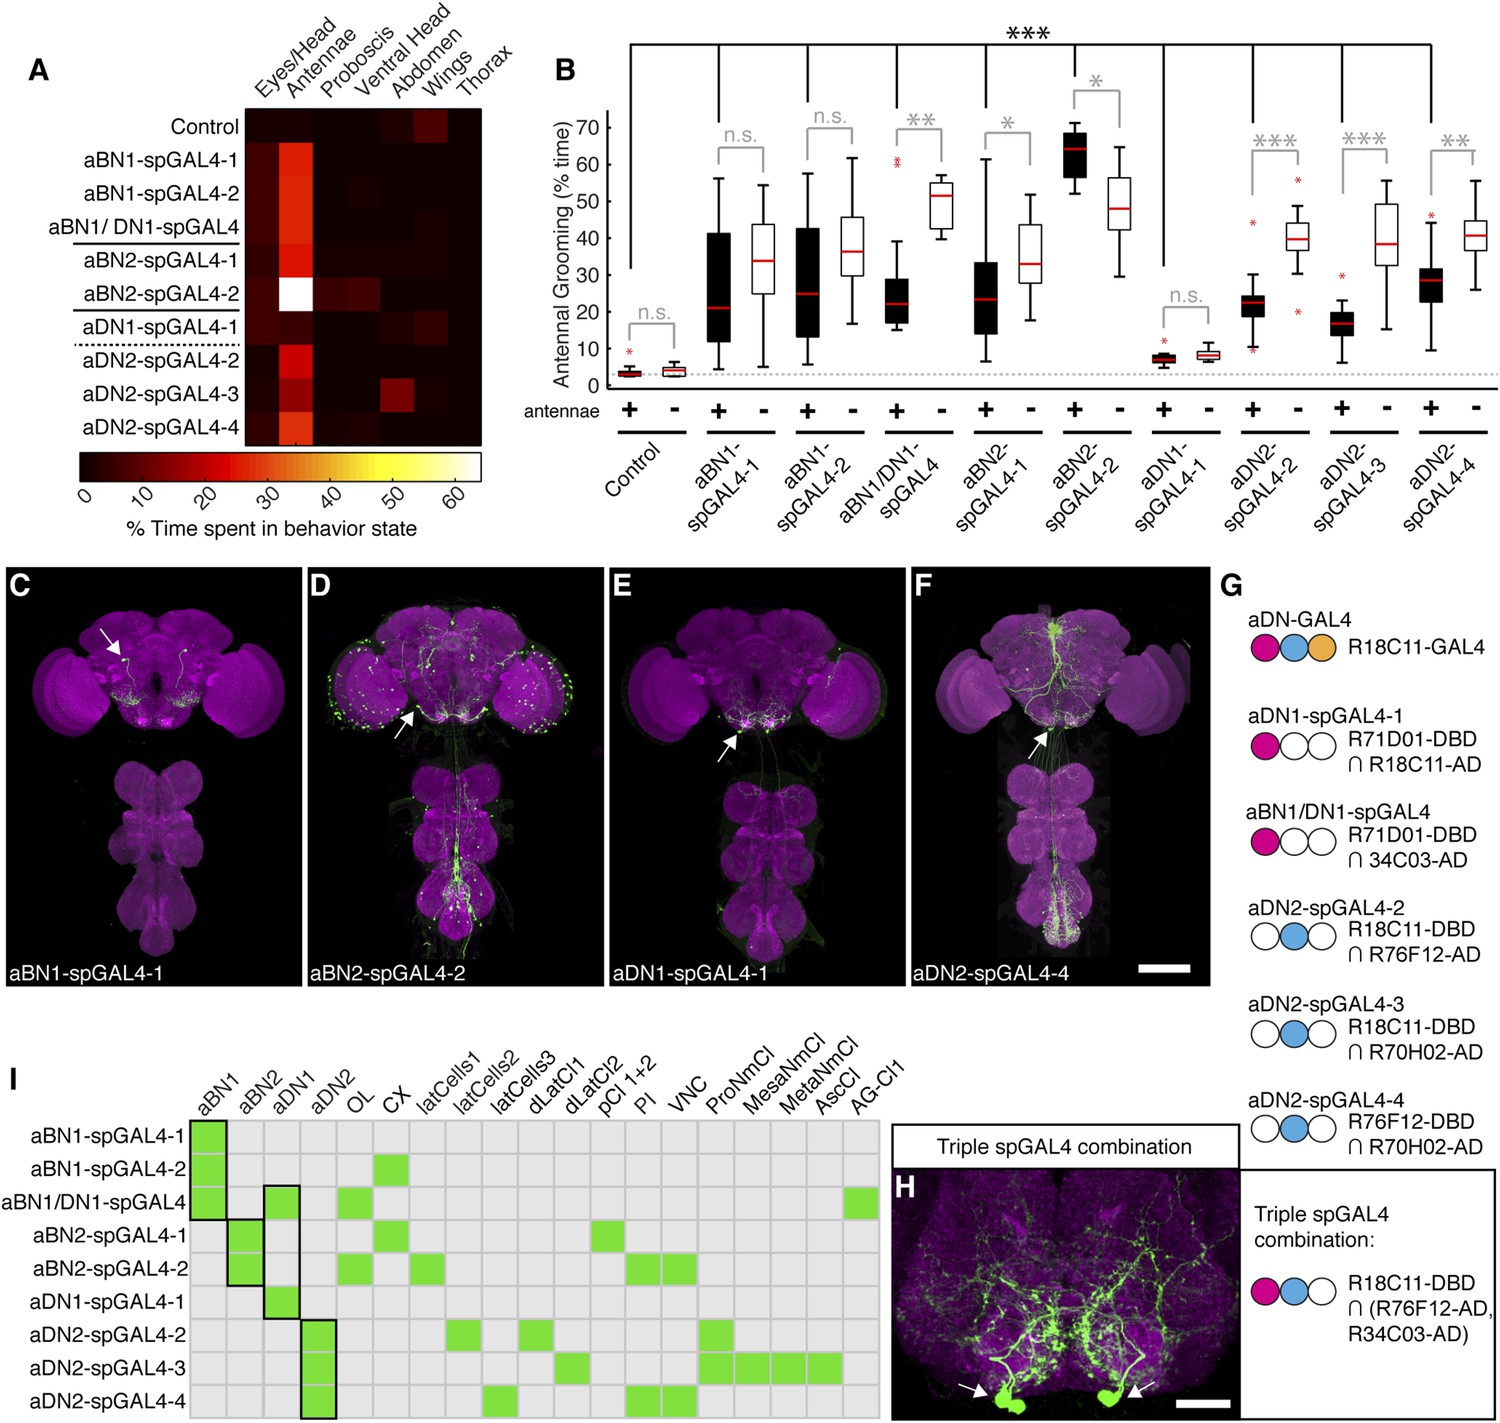
(A) Grooming movements performed by interneuron spGAL4 pairs expressing thermally activated dTrpA1. Data was obtained and displayed as described in Figure 1A. (B) Percent time flies spent antennal grooming with thermogenetic activation of interneurons targeted by spGAL4 pairs, with or without their antennae (filled or open boxes respectively). Box plots and statistics are described in Figure 1B. Asterisks represent the following p values: *p < 0.01, **p < 0.001, ***p < 0.0001 (n ≥ 9 flies per spGAL4). Black p value statistics show differences between control and spGAL4 flies with their antennae. Gray statistics show differences between each spGAL4 with and without the antennae. (C–F) GFP expression patterns of spGAL4 lines: (C) aBN1-spGAL4-1, (D) aBN2-spGAL4-2, (E) aDN1-spGAL4-1, (F) aDN2-spGAL4-4. Images show maximum intensity projections of co-staining with anti-GFP (green) and anti-Bruchpilot (magenta). White arrows show cell bodies. Scale bars, 100 μm. (G) antennal descending neurons (aDNs) targeted by each spGAL4 pair. Circles represent one of three neurons in aDN-GAL4. Filled circles show which neurons are targeted by each spGAL4 (enhancer pairs listed). (H) Two aDN neurons are targeted in a triple spGAL4 combination expressing GFP (white arrows). No spGAL4 combinations were identified that exclusively target aDN3. Scale bar, 25 μm. (I) Graphical summary of neuronal expression patterns of the spGAL4 pairs. Green boxes indicate expression of the pair on the left (rows) in the indicated neurons or region listed above the grid (columns). Figure 2—figure supplement 2 shows the locations of these neurons. Black framing highlights antennal grooming neurons.
Figure 2—figure supplement 1
GAL4 lines that elicit antennal grooming.
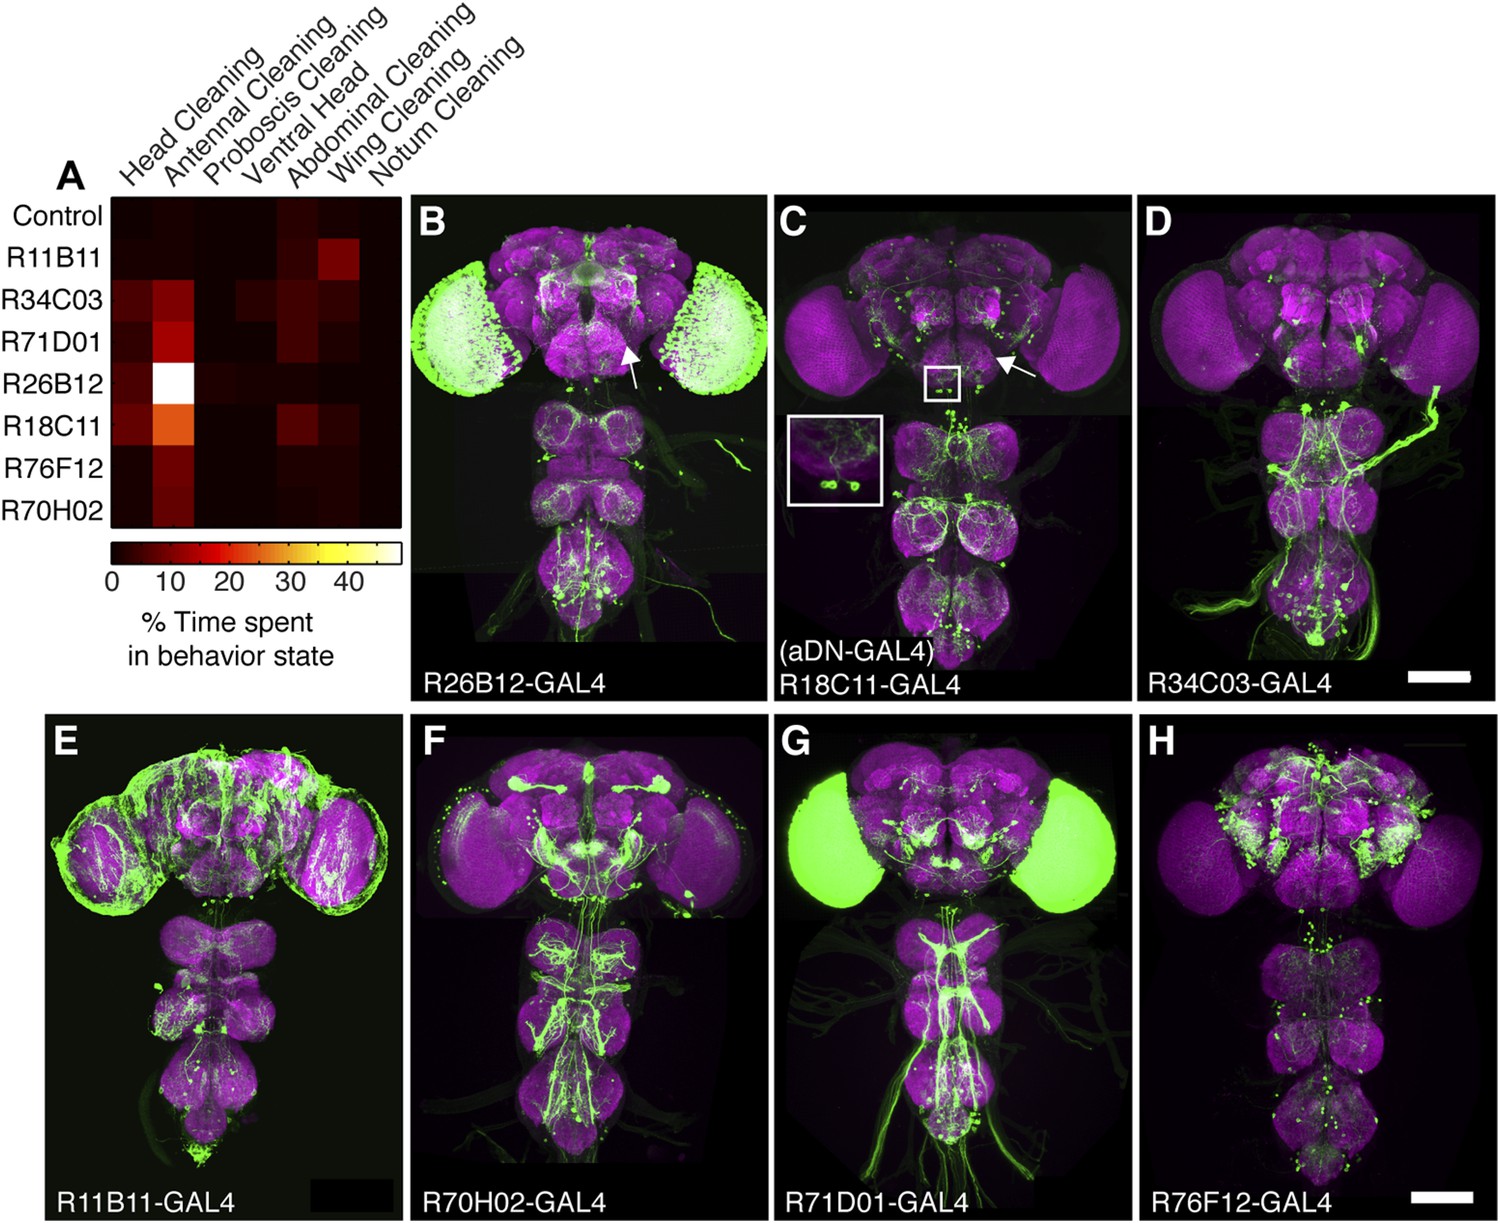
(A) Grooming movements performed by GAL4 lines expressing thermally activated dTrpA1. Data was obtained and displayed as described in Figure 1A (n = 10 per line). Note: R11B11-GAL4 did not perform significantly increased antennal grooming, however, this line was able to target antennal grooming interneurons when its enhancer was used for generating spGAL4 intersections. (B–H) Images of antennal grooming GAL4 lines expressing GFP. CNSs were co-stained with anti-GFP (green) and anti-bruchpilot (magenta). (B) R26B12-GAL4, (C) R18C11-GAL4 (aDN-GAL4), (D) R34C03-GAL4, (E) R11B11-GAL4, (F) R70H02-GAL4, (G) R71D01-GAL4, and (H) R76F12-GAL4. Inset in C shows higher magnification of three candidate antennal grooming interneuron cell bodies. White arrow in (B, C) show where projections from JO sensory neurons would enter the brain if the GAL4 line targeted expression to them. Scale bars, 100 μm.
Figure 2—figure supplement 2
spGAL4 lines with interneuron expression that elicit antennal grooming.
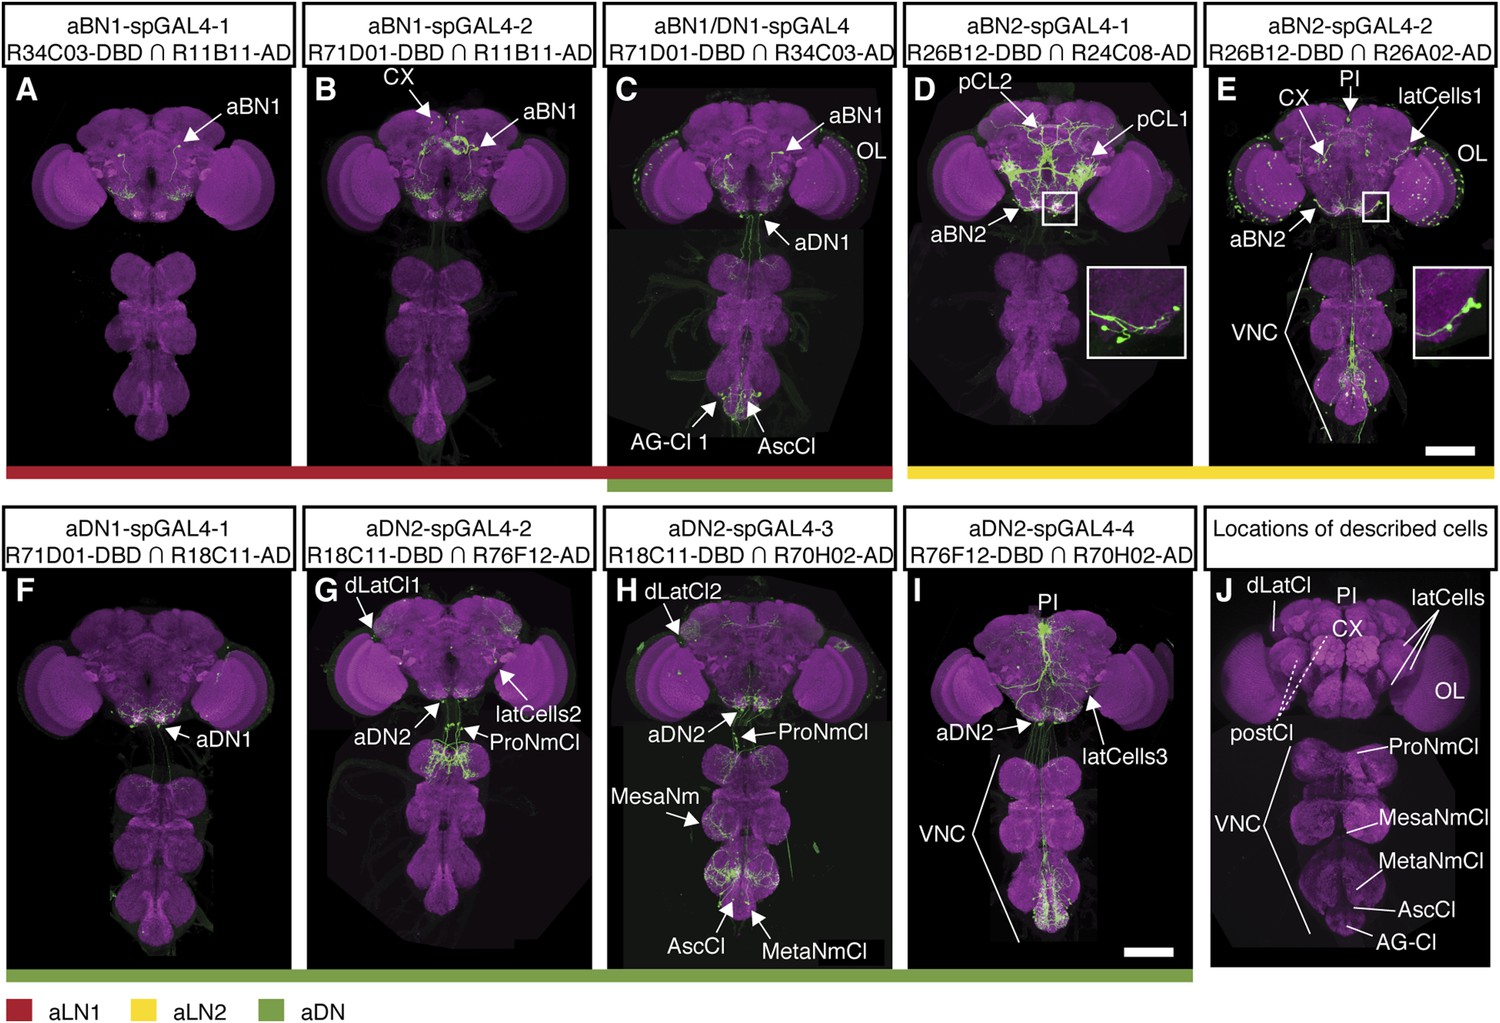
(A–I) spGAL4 lines expressing GFP (green) are co-stained with anti-GFP (green) with anti-bruchpilot (magenta). The activation domains (ADs) and DNA binding domains (DBDs) used are shown below each corresponding spGAL4 pair name. Arrows or lines indicate neurons or populations of neurons targeted by each pair. Summary expression data for all spGAL4 pairs are shown in Figure 2I. (A) aBN1-spGAL4-1, (B) aBN1-spGAL4-2, (C) aBN1/aDN1-spGAL4, (D) aBN2-spGAL4-1, (E) aBN2-spGAL4-2, (F) aDN1-spGAL4-1, (G) aDN2-spGAL4-2, (H) aDN2-spGAL4-3, and (I) aDN2-spGAL4-4. Insets in D, E show aBN2 cell bodies at higher magnification; (D) shows three cell bodies and (E) shows five. Scale bars, 100 μm. (J) Summary of neuronal types targeted by interneuron spGAL4 pairs. Abbreviations: abdominal ganglion cluster (AG-Cl), ascending cluster (AscCl), metathoracic neuromere cluster (MetaNmCl), mesothoracic neuromere cluster (MesaNmCl), ProNm cluster (ProNmCl), posterior cluster (pCl 1 + 2), dorsolateral cluster (dLatCl), lateral cells (latCells), VNS, central complex (CX), optic lobes (OL), aDN, antennal local interneurons (aBN), pars intercerebralis cluster (PI). Dashed lines show neuronal population on posterior side of the brain.
Figure 3
Neurons that elicit antennal grooming have neurites in the AMMC and/or SEZ.
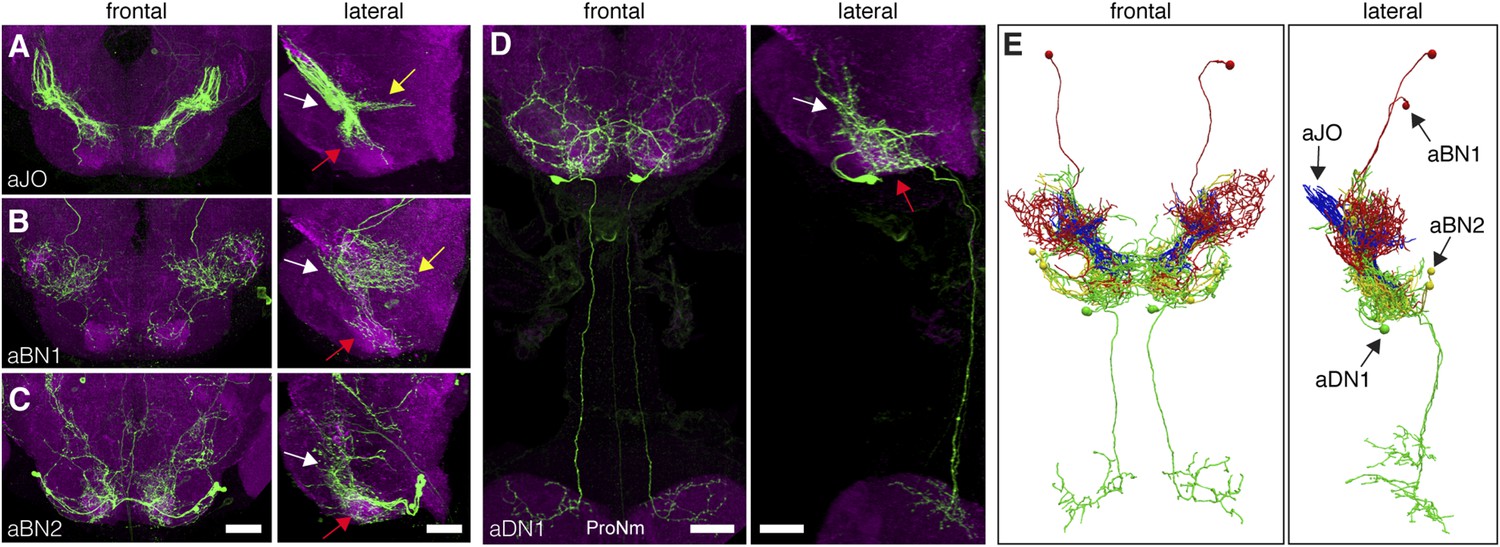
(A–D) spGAL4 pairs targeting each neuronal class in the ventral brain: (A) aJO-spGAL4-1, (B) aBN1-spGAL4-1, (C) aBN2-spGAL4-2, and (D) aDN1-spGAL4-1. aDN1 is shown as an example in (D), but there are additional aDNs (aDN2 and aDN3, see Figure 2F and Figure 2—figure supplement 2G–I). CNSs stained with anti-GFP (green) and anti-bruchpilot (magenta). Maximum intensity projections are shown from frontal and lateral views. Arrows show the different projection regions: AMMC (white), posterior SEZ (yellow), and ventral SEZ (red). Scale bars, 25 μm. (E) Traced neurons in different colors manually aligned (also shown in Video 1).
Figure 4 with 3 supplements
Functional relationships among putative antennal circuit components.
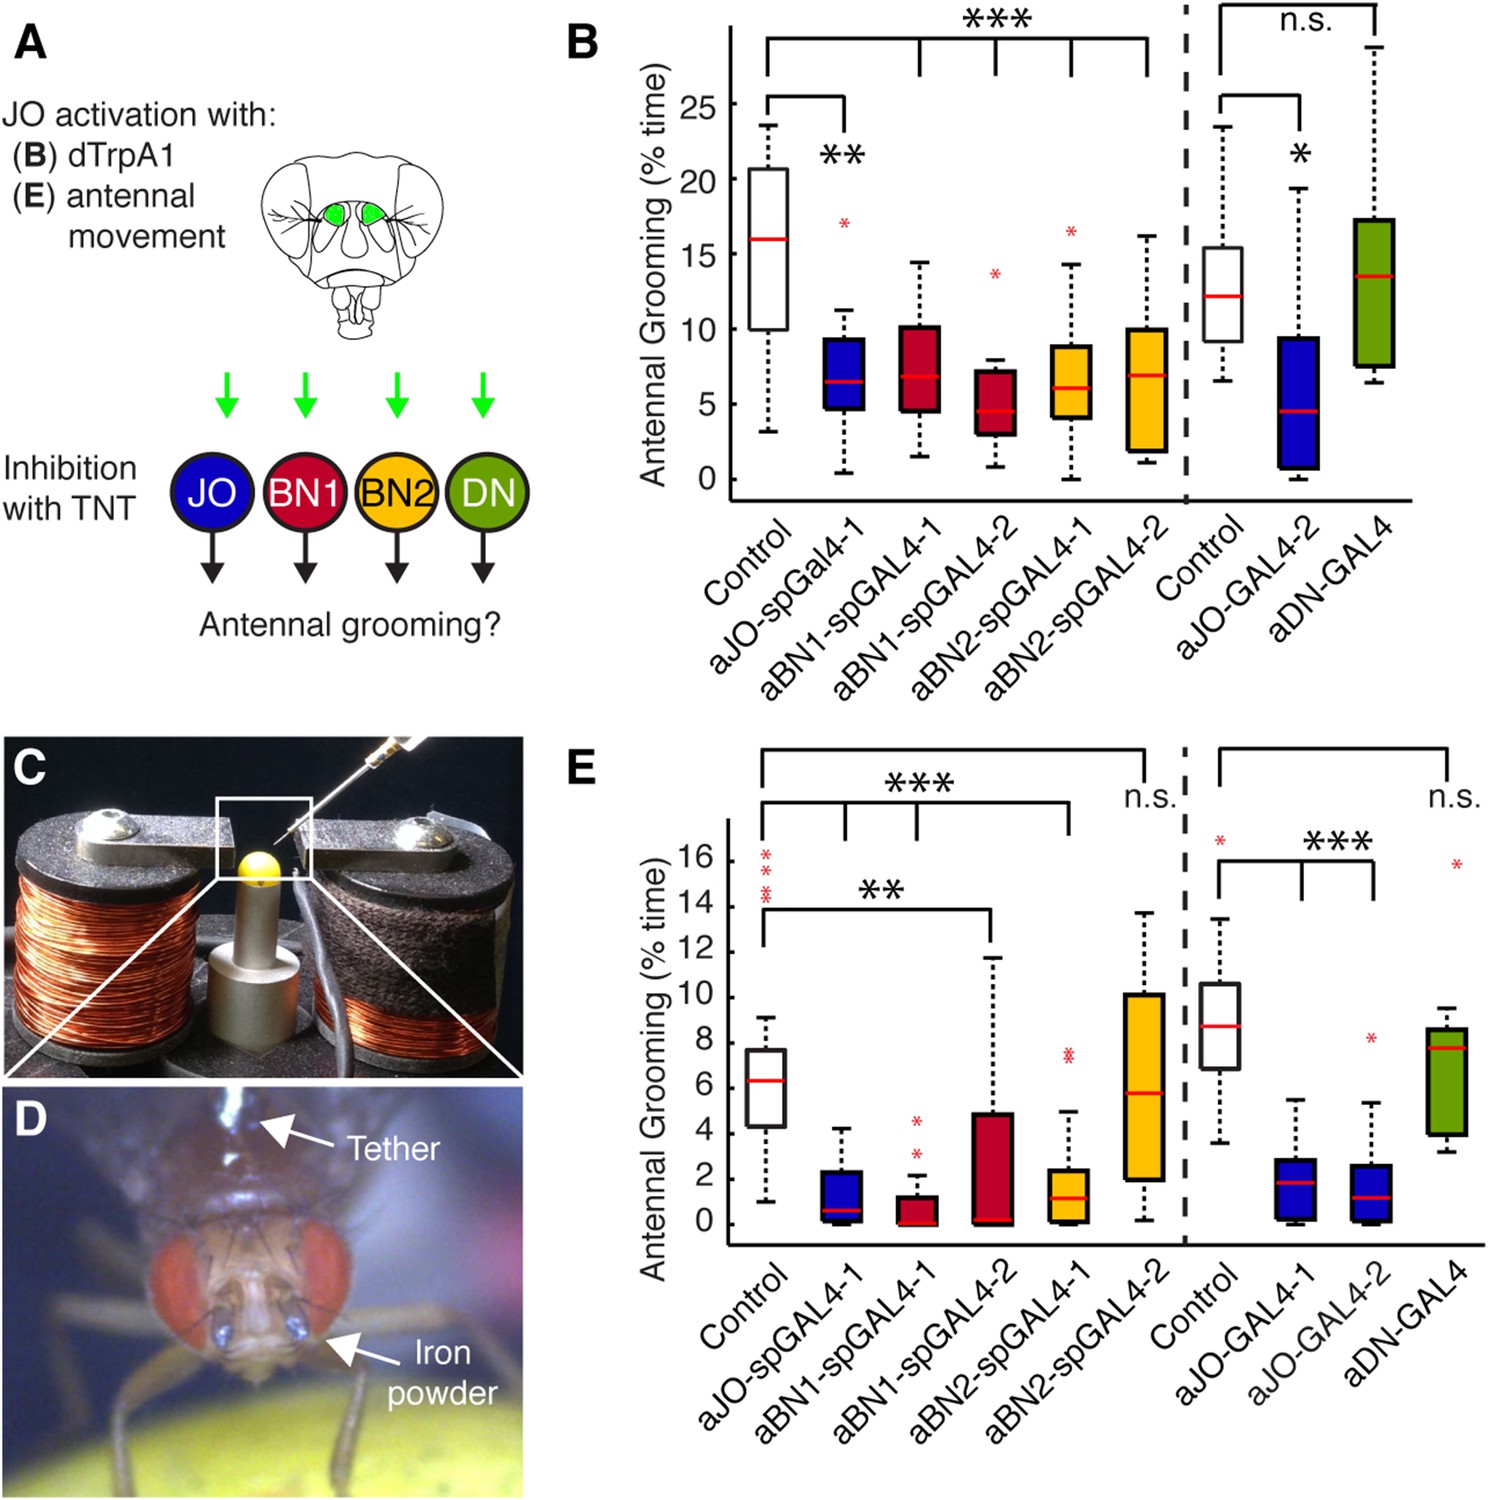
(A) Overview of experiments shown in (B, E). Grooming was induced by thermogenetic activation of Johnston's Organ (JO) neurons (dTrpA1) or by imposed displacements of the antennae. Synaptic release was blocked in different neuronal classes expressing tetanus toxin (TNT). (B) Antennal grooming performed by flies with thermogenetic activation of the aJO while inhibiting synaptic release in interneuron classes. The experiment was performed and data is displayed as described in Figure 1B (n ≥ 11 flies per spGAL4). (C–E) To displace the antennae, iron powder was glued to the third antennal segment and the flies were tethered within an electromagnet. (C) Image of the electromagnet apparatus. (D) Tethered fly with iron powder on its antennae. Magnetic pulses were delivered to displace the third antennal segment at 1 Hz for 4 × 10 s periods, with 30 s rests between stimulations. Flies were recorded and their grooming movements were manually scored (see Figure 4—figure supplement 3D for ethograms). (E) The percent time that flies spent grooming their antennae within the total assay time is shown. The grooming responses to antennal movements were also tested while blocking synaptic release in the different neuronal types with TNT. Box plots and statistics are shown as described in Figure 1B (n ≥ 11 flies per line).
Figure 4—figure supplement 1
aJO-, aBN2-, and aDN-LexA lines.
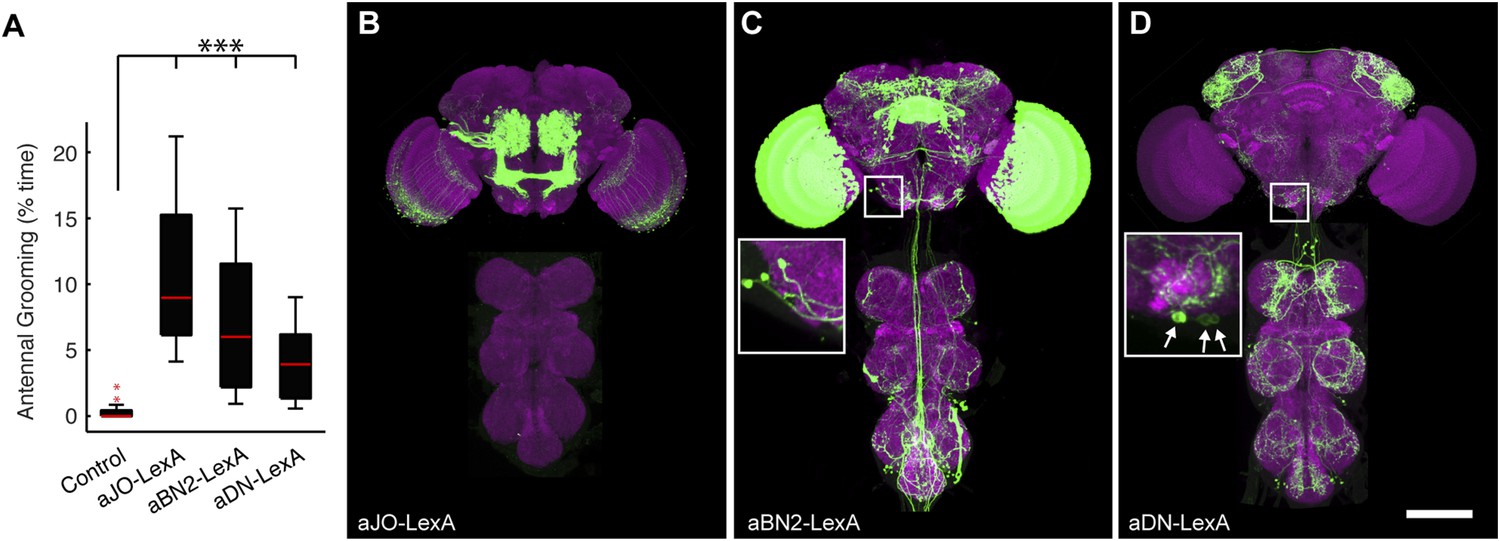
(A) Percent of total time that LexA lines expressing thermally activated dTrpA1 spent antennal grooming. Box plots, statistics, and experimental conditions are as described in Figure 1A,B (n > 10; ***p < 0.001). (B–D) CNSs co-stained with anti-GFP (green) and anti-bruchpilot (magenta). LexA lines are as follows: (B) aJO-LexA, (C) aBN2-LexA, and (D) aDN-LexA. Scale bar, 100 μm. Box insets show higher magnification of cell bodies of interneurons involved in antennal grooming; (C) shows four cell bodies and (D) shows three.
Figure 4—figure supplement 2
Co-expression of LexA lines with selected spGAL4 pairs.
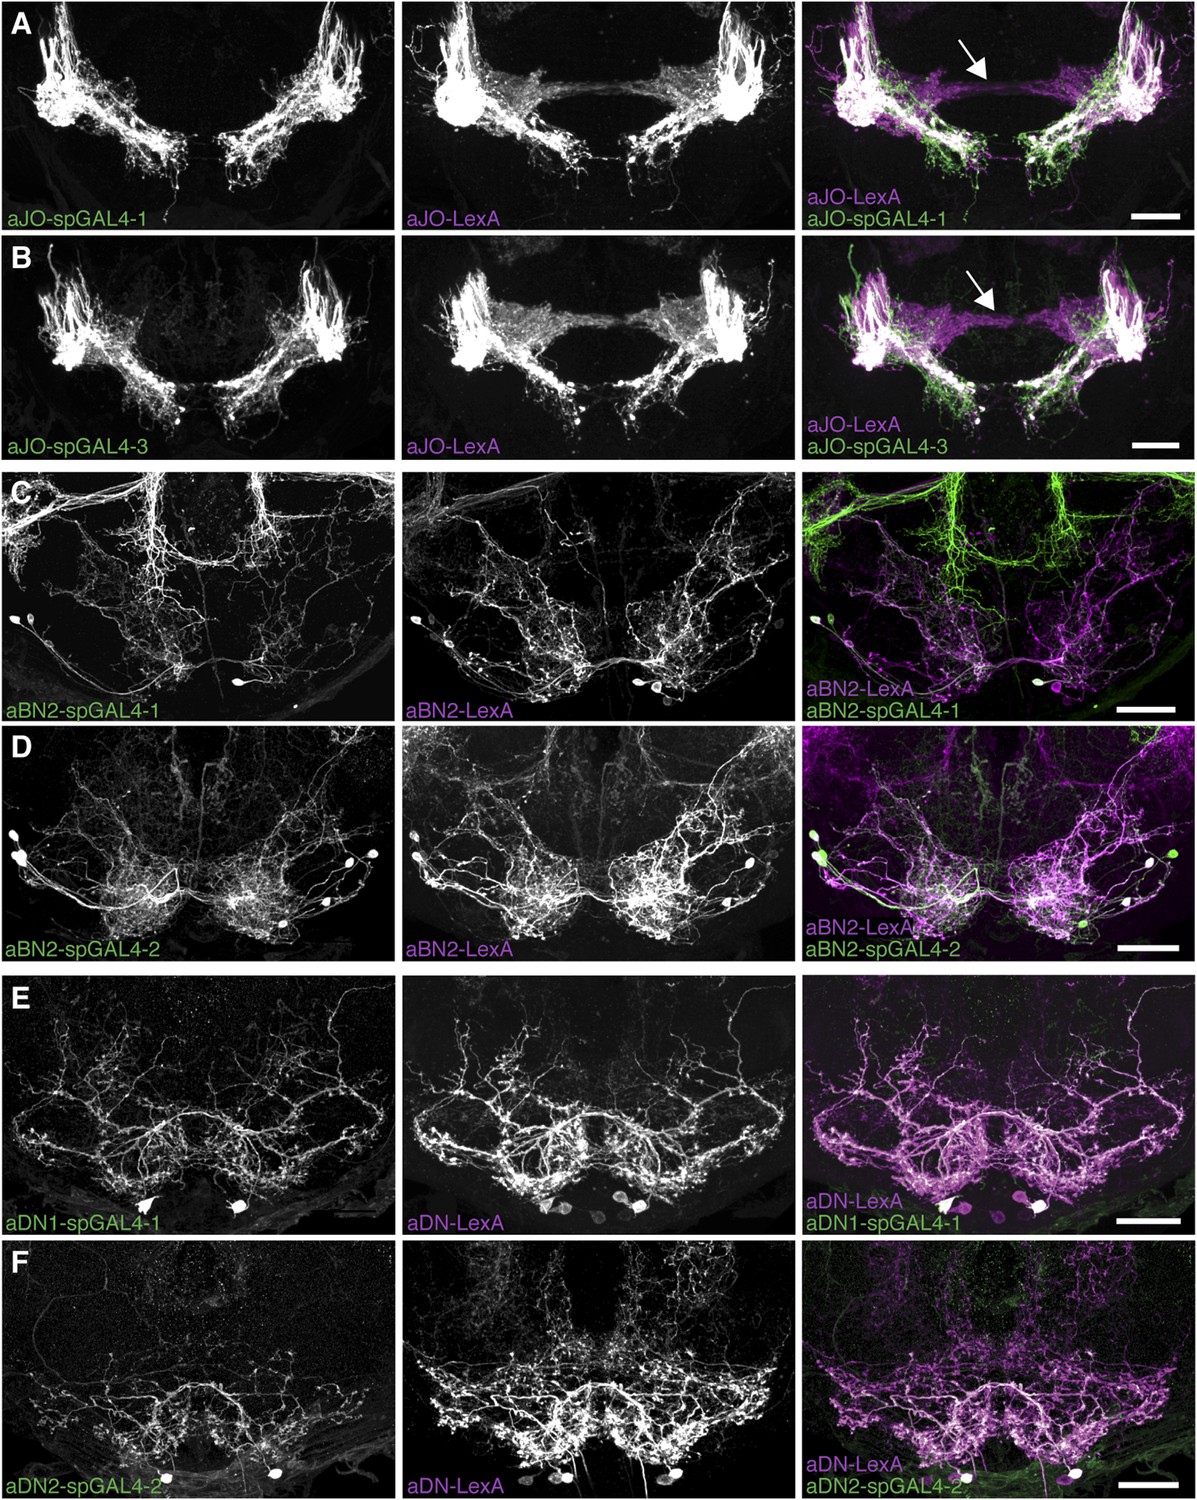
(A–F) Co-expression of LexA and spGAL4 lines. Left column: spGAL4 expression patterns. Middle column: LexA expression patterns. Right column: Merged expression patterns. (A, B) Co-expression of aJO-LexA (magenta) with (A) aJO-spGAL4-1 or (B) aJO-spGAL4-3 (green). Frontal views: Arrows point to JO projections that do not co-localize with aJO projections. (C, D) aBN2-LexA (magenta) expressed with (C) aBN2-spGAL4-1 or (D) aBN2-spGAL4-2 (green). (E, F) Co-expression of aDN-LexA with (E) aDN1-spGAL4-1 or (F) aDN2-spGAL4-2. Scale bar, 25 μm.
Figure 4—figure supplement 3
Testing of stimulus parameters for the antennal displacement assay.
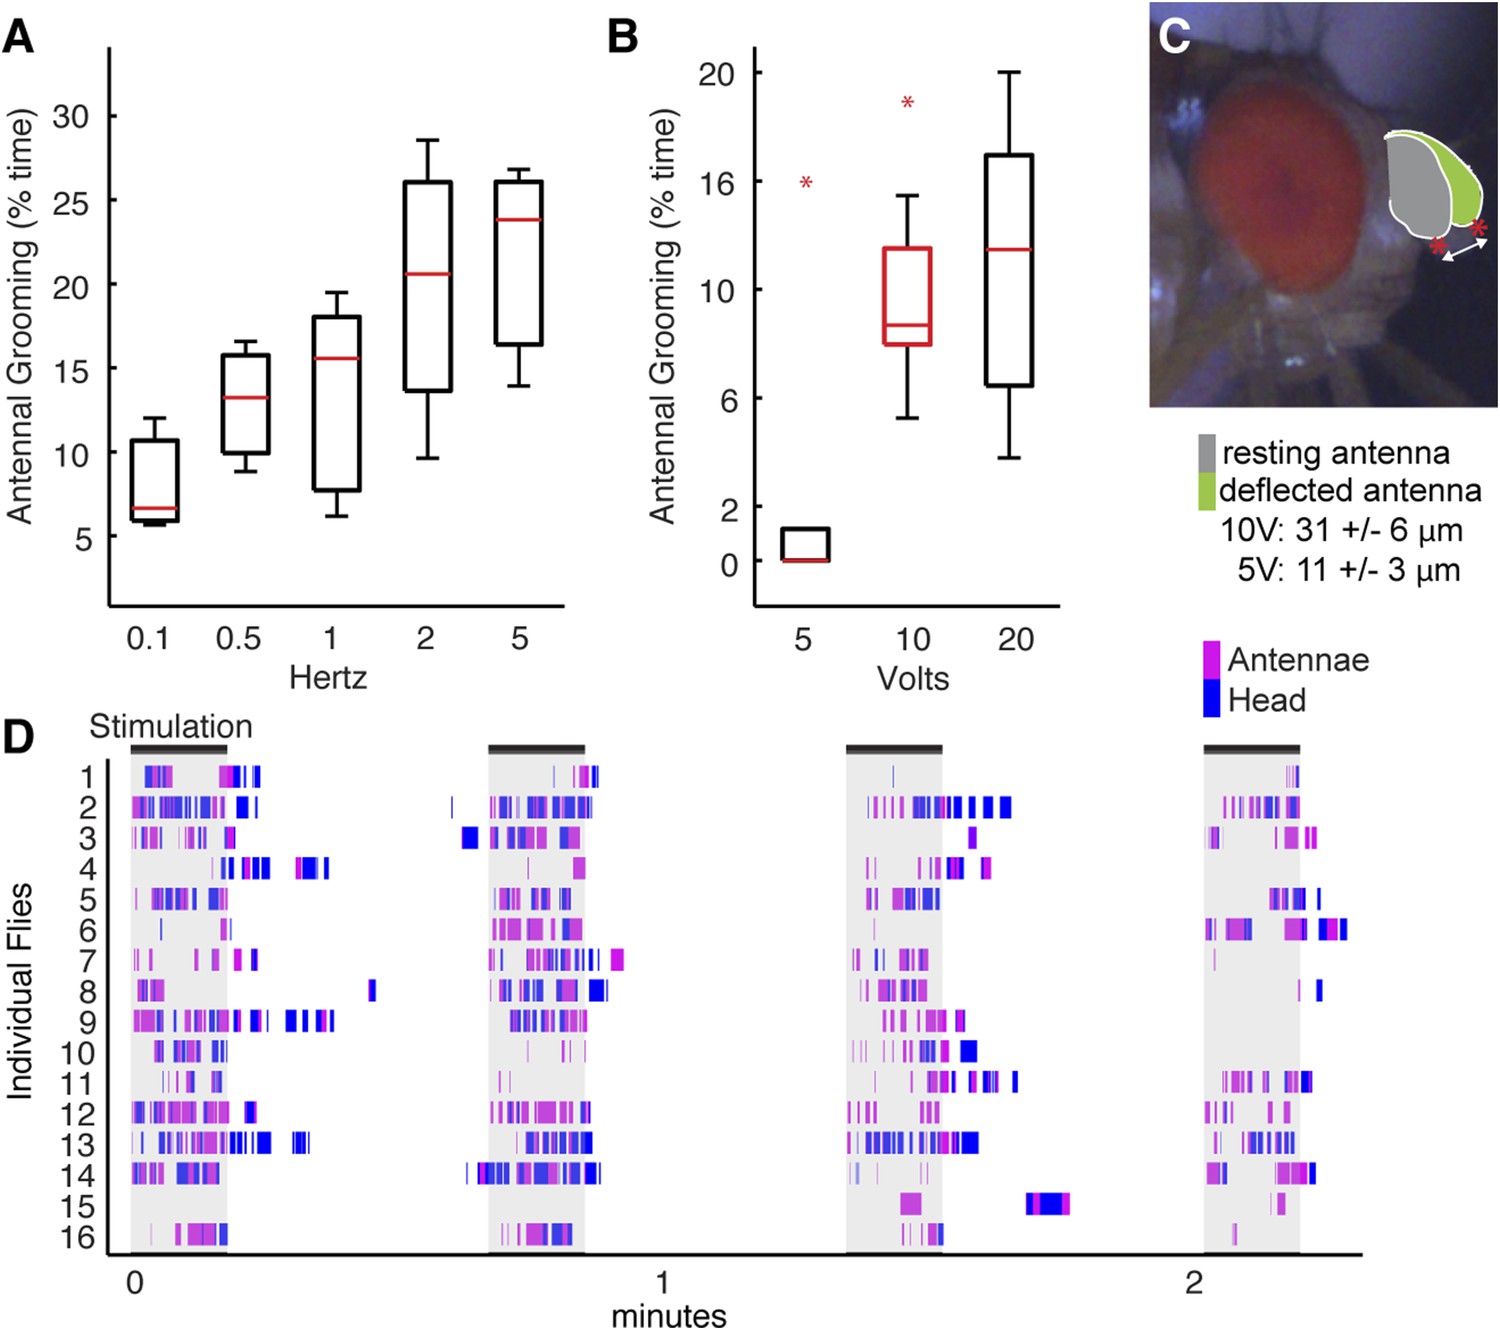
(A–C) Flies were prepared as shown in Figure 4C,D (see ‘Materials and methods’) and tested for their grooming responses when different magnetic field frequencies (A) or voltages (B) were applied to displace their antennae. The grooming responses were recorded and manually scored. Plots are displayed as described in Figure 1B. (A) Box plots show the percent time that flies groomed their antennae when the magnetic field that was turned on and off at different frequencies (magnetic strength was set at 10 Volts). (B) Percent time that flies groomed their antennae when the magnetic field was applied at different voltages (frequency set at 1 Hz). Raw data used to generate the red box is shown in D. (C) Side view of a fly head showing the trajectories of the antennae before (grey) and after (green) the magnetic field was applied. Red asterisks and arrow show the measured distances. The values shown below the image represent the measured distances that the antennae moved at the indicated voltages. (D) Ethograms of grooming movements performed by 16 control flies (w1118; UAS-TeTxLC.tnt; pBPGAL4U) whose antennae were stimulated in 4 × 10 s periods by a magnetic field of 570 gauss (10 Volts) at a frequency of 1 Hz. The magnet was left off for 30 s between periods. These flies are the controls used for the experiment shown in Figure 4E.
Figure 5 with 2 supplements
Antennal grooming neurons are in close proximity.
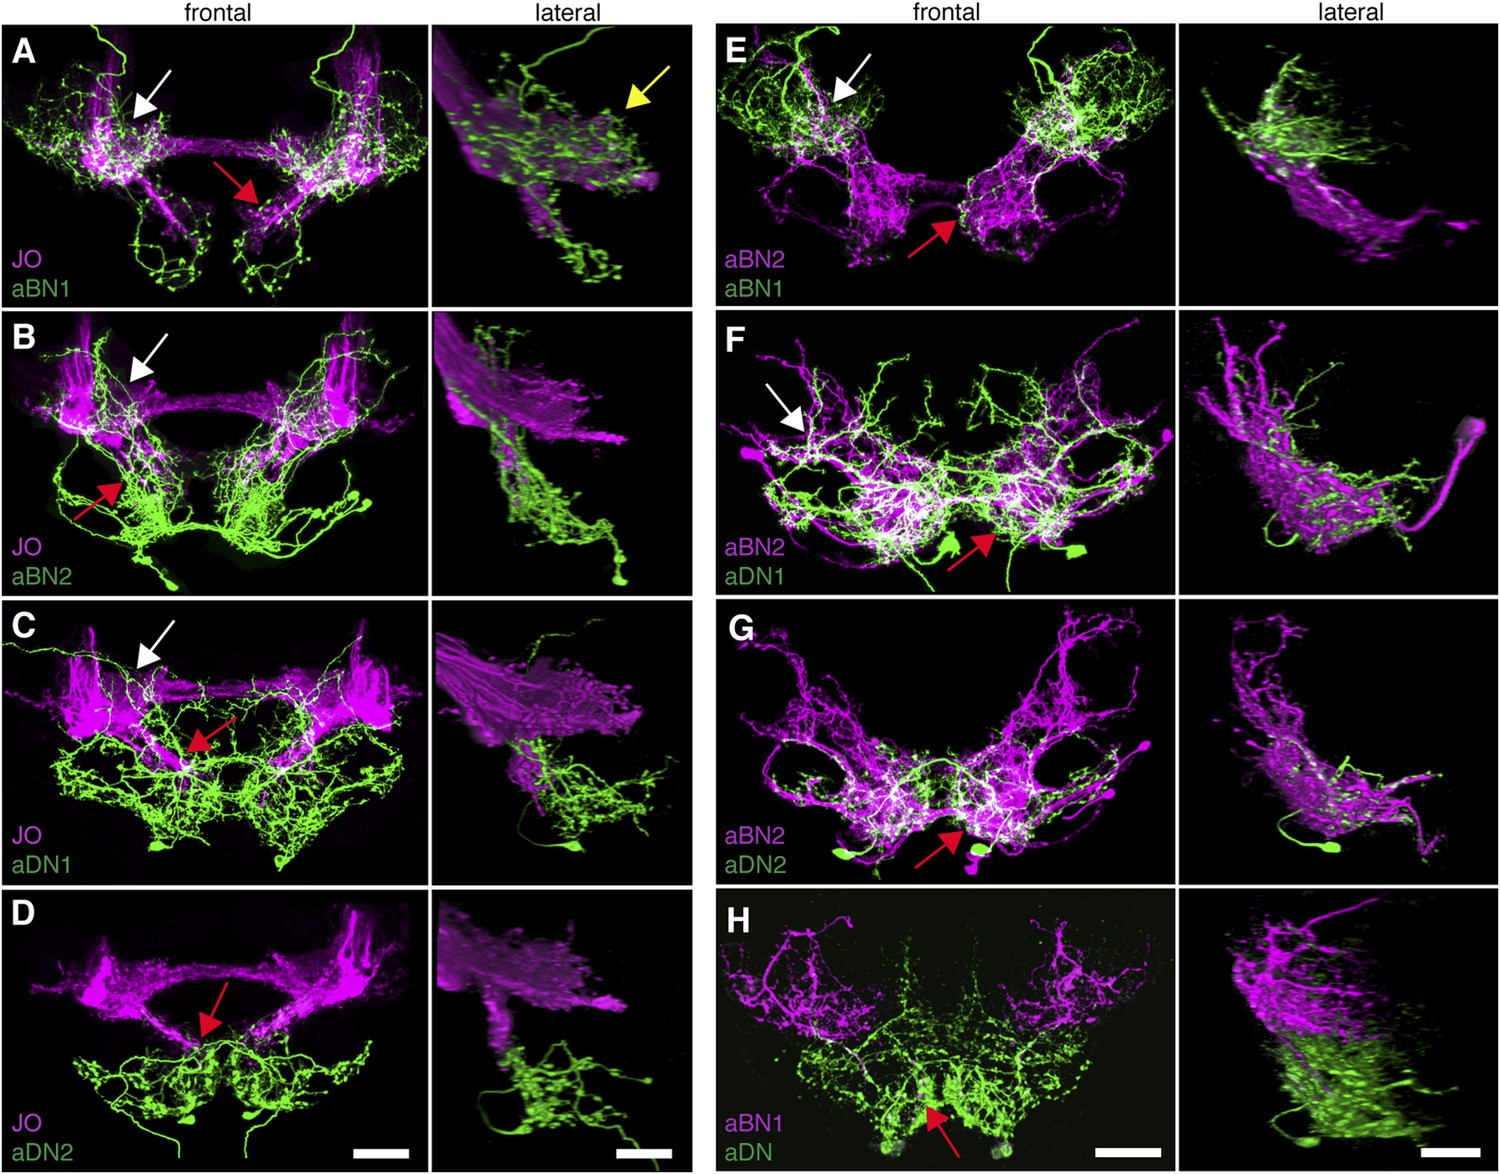
(A–H) Co-expression in neuronal pairs using two binary expression systems (LexA and spGAL4) to express tdTomato or GFP in each neuronal class. Processed maximum intensity projections of frontal and lateral views are shown. See ‘Materials and methods’ about how images were processed (unprocessed images in Figure 5—figure supplement 2). Scale bars, 25 μm. (A–D) Proximity between aJO-LexA targeted sensory projections (magenta) and the following interneuron spGAL4 pairs (green): (A) aBN1-spGAL4-1, (B) aBN2-spGAL4-1, (C) aDN1-spGAL4-1 and (D) aDN2-spGAL4-2. (E–G) Proximity between aBN2-LexA targeted neurons (magenta) and the following interneuron spGAL4 pairs (green): (E) aBN1-spGAL4-1, (F) aDN1-spGAL4-1, (G) aDN2-spGAL4-2. (H) Proximity between aDN-LexA targeted neurons aDN (green) and aBN1-spGAL4-1 targeted neurons (magenta). Overlap between different projections of the LexA and spGAL4-targeted neurons is indicated by different colored arrows: (A–C, E, F) AMMC projections white arrows, (A) posterior SEZ projection (yellow arrow), (B–H) ventral SEZ projections (red arrows).
Figure 5—figure supplement 1

GFP-positive staining indicates reconstitution across synaptic partner (GRASP) staining indicates close proximity of neurons involved in antennal grooming.
(A–H) Expression of different GFP halves (spGFP11 and spGFP1-10) in putative connected neuronal pairs. aJO-LexA drove expression of spGFP11 in the JO neurons and spGFP1-10 expression was driven by the following spGAL4 lines: (A) aBN1-spGAL4-1, (B) aBN2-spGAL4-1, (C) aDN1-spGAL4-1, (D) aDN2-spGAL4-2, or (E) spGAL4 control. Brains were stained with an antibody that recognizes reconstituted GFP (green) (Gordon and Scott, 2009). The neuropil was stained with an anti-bruchpilot antibody (magenta). GRASP where neurons contacted each other. (F–H) Controls where only GFP1-10 was expressed by: (F) aBN1-spGAL4-1 or (G) aBN2-spGAL4-1, or (H) aDN1-spGAL4-1. (I) White box marks the area shown in A–H. Scale bar, 100 μm.
Figure 5—figure supplement 2
Co-staining indicates close proximity of neurons involved in antennal grooming.
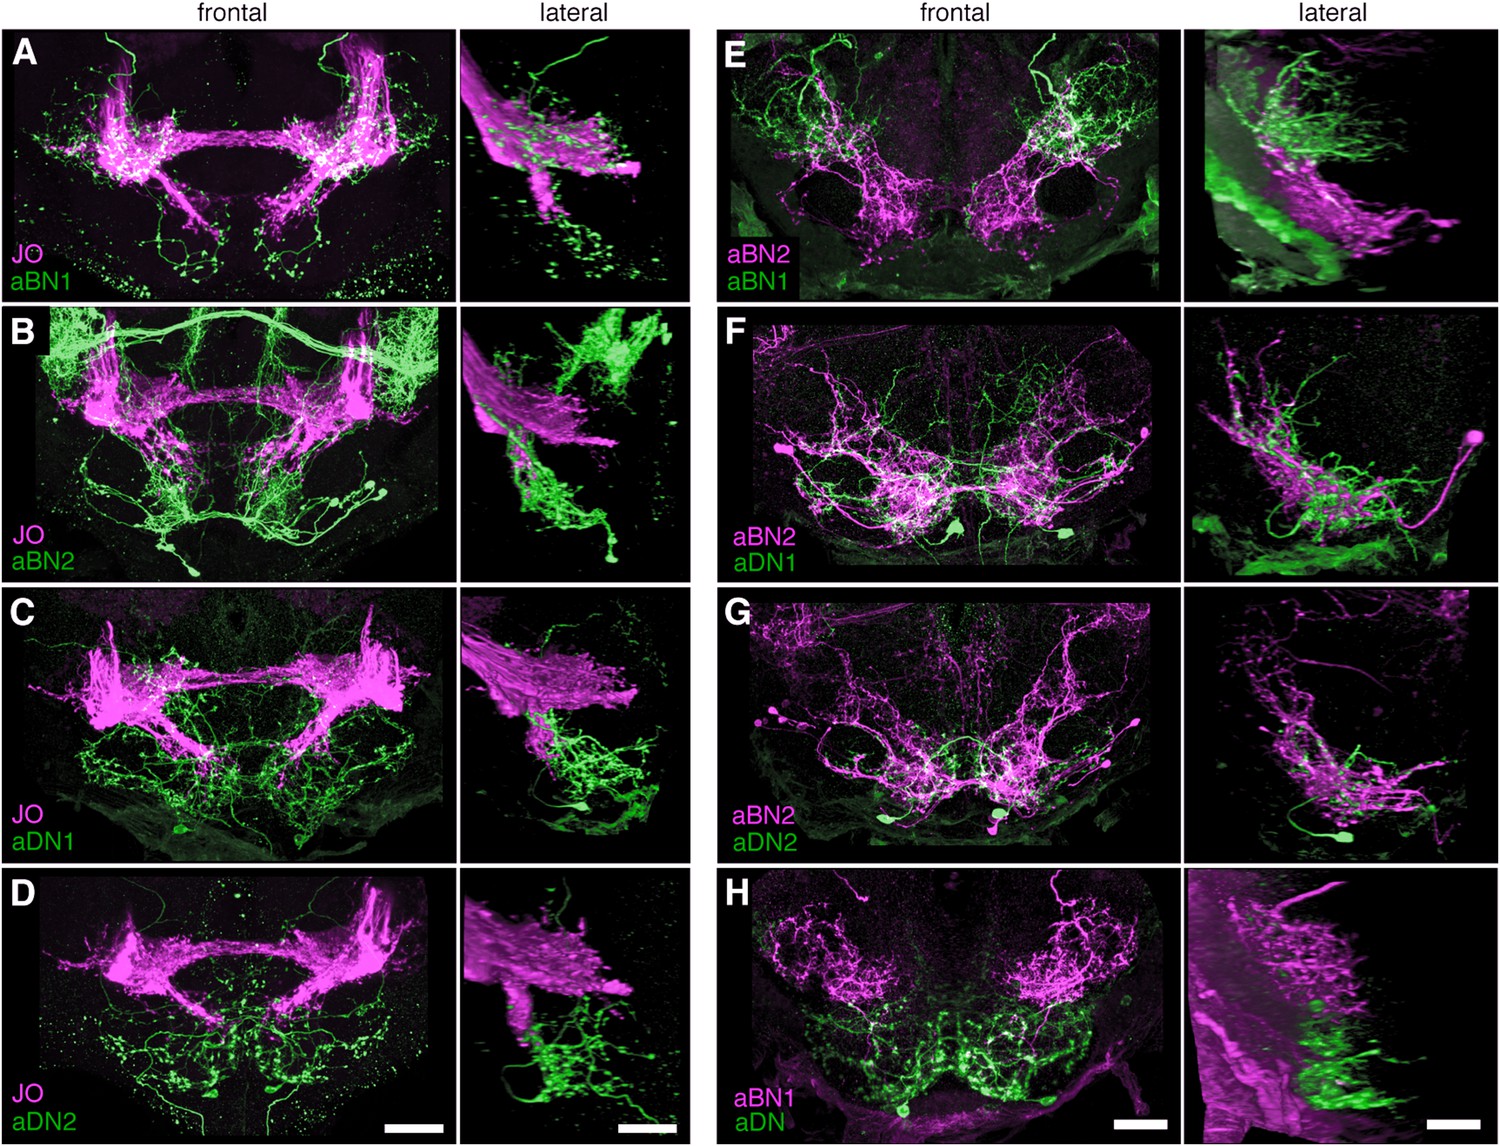
(A–H) Unprocessed maximum intensity projections of co-stained images shown in Figure 5 (see ‘Materials and methods’).
Figure 6 with 3 supplements
Different antennal grooming neurons are functionally connected.
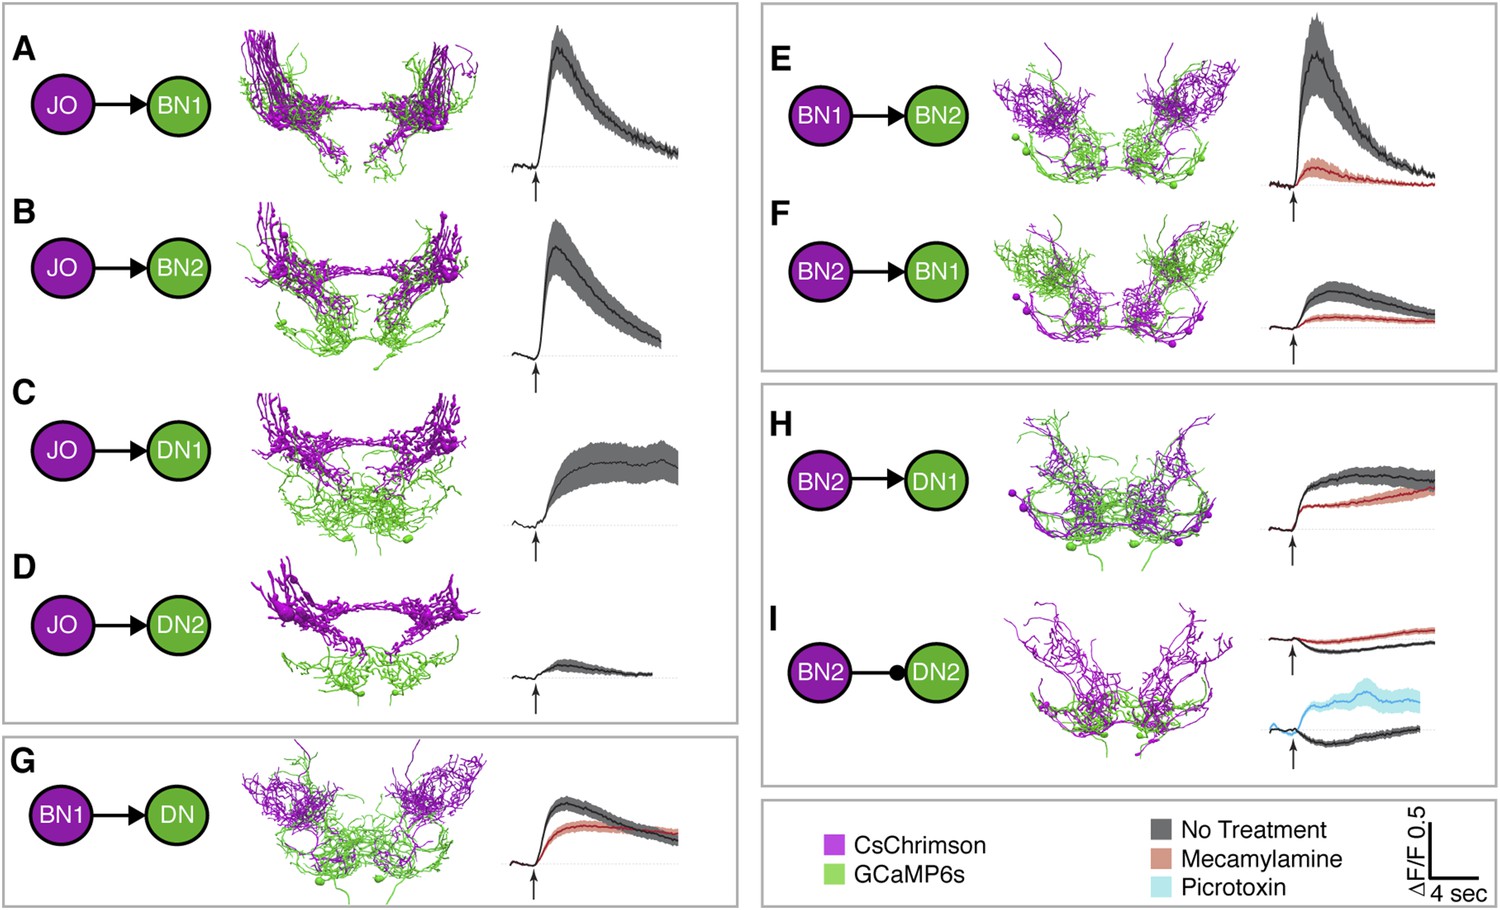
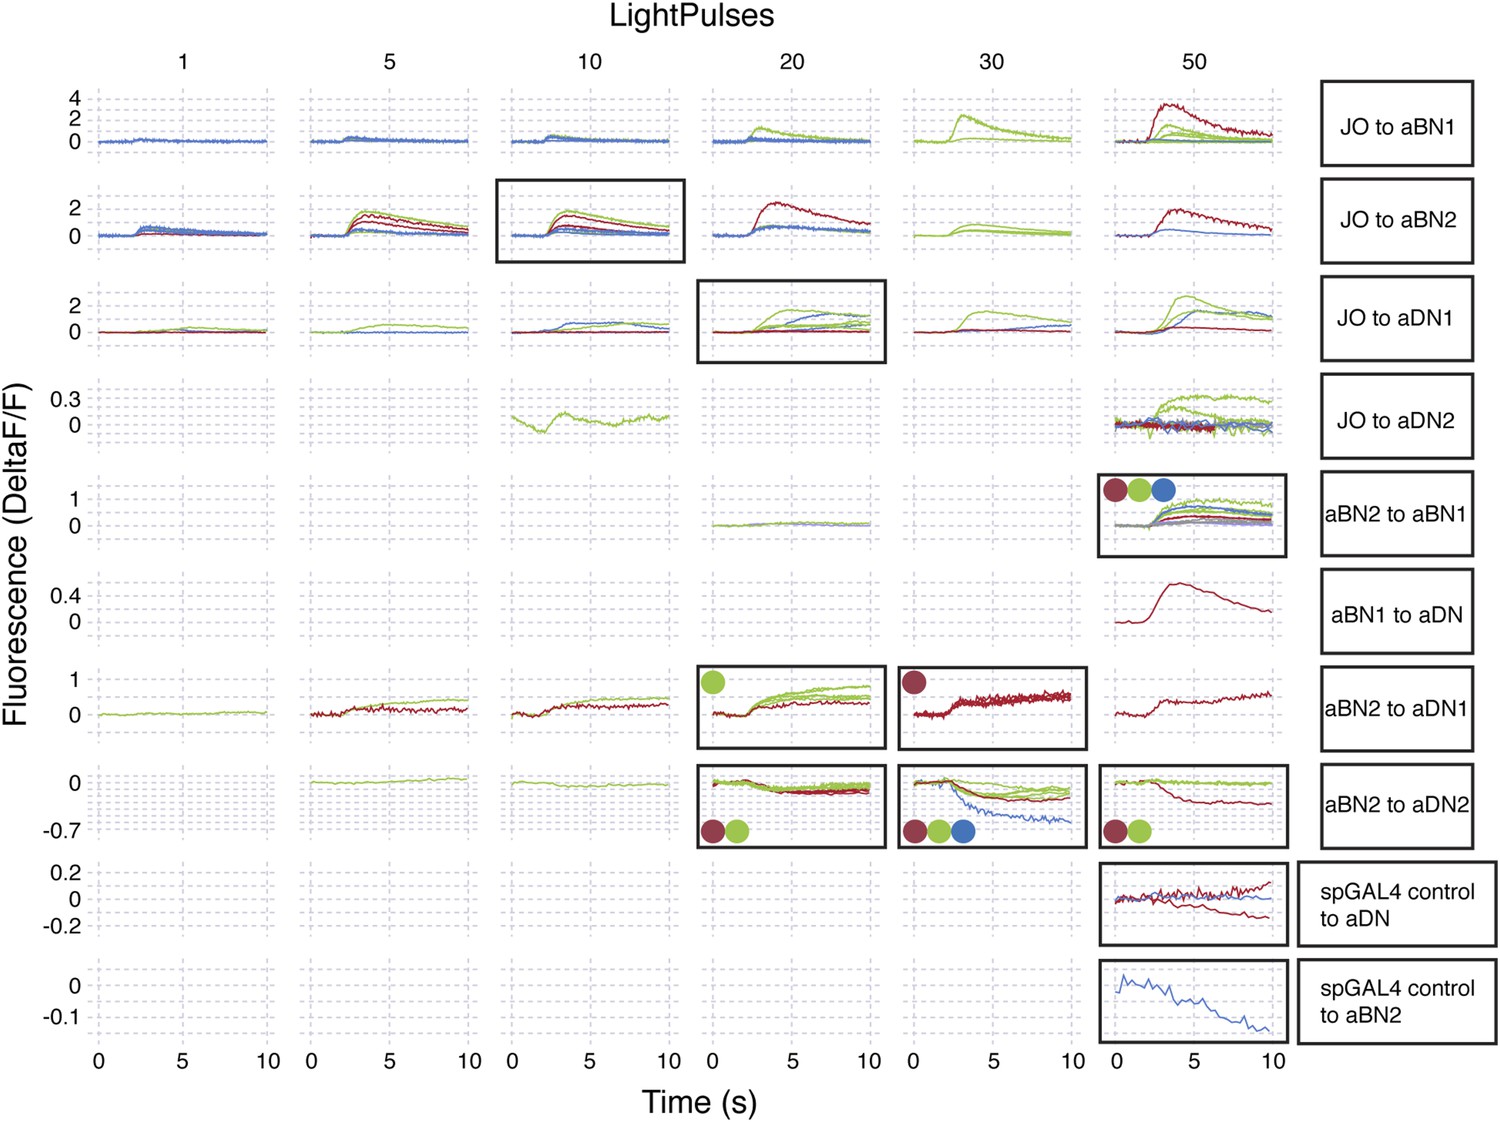
(A–I) Dissected CNSs with different neuronal classes expressing CsChrimson (magenta) were activated with red light while changes in calcium in their putative downstream partners expressing GCaMP6 (green) were imaged (ΔF/F). Each tested neuronal pair is shown using circles and as traced pairs. The direction of the connection and whether it is excitatory or inhibitory is depicted with an arrow (excitatory) or ball and stick (inhibitory). Changes in fluorescence of GCaMP6s of multiple flies under similar stimulus conditions are shown on the right (average ± s.e.m., 3–5 flies tested with 9–21 trials per trace). Arrow below each trace shows when the red light pulse was delivered. Black traces show flies that were imaged without drug treatment, whereas orange and blue traces were imaged while the nervous system was bathed with mecamylamine or picrotoxin respectively. See ‘Materials and methods’, Figure 6—figure supplement 1, Figure 6—figure supplement 2, Figure 6—figure supplement 3, and Supplementary file 2 for detailed ‘Materials and methods’, stimulus conditions, and controls. (A–D) aJO-LexA tested with the following interneuron spGAL4 pairs: (A) aBN1-spGAL4-1, (B) aBN2-spGAL4-1, (C) aDN1-spGAL4-1, and (D) aDN2-spGAL4-2. (E, F) aBN2-LexA tested with aBN1-spGAL4-1. (G) aBN1-spGAL4-1 tested with aDN-LexA. (H, I) aBN2-LexA tested with either (H) aDN1-spGAL4-1 or (I) aDN2-spGAL4-2.
Figure 6—figure supplement 1
Functional connectivity: controls, technical details, and raw data.
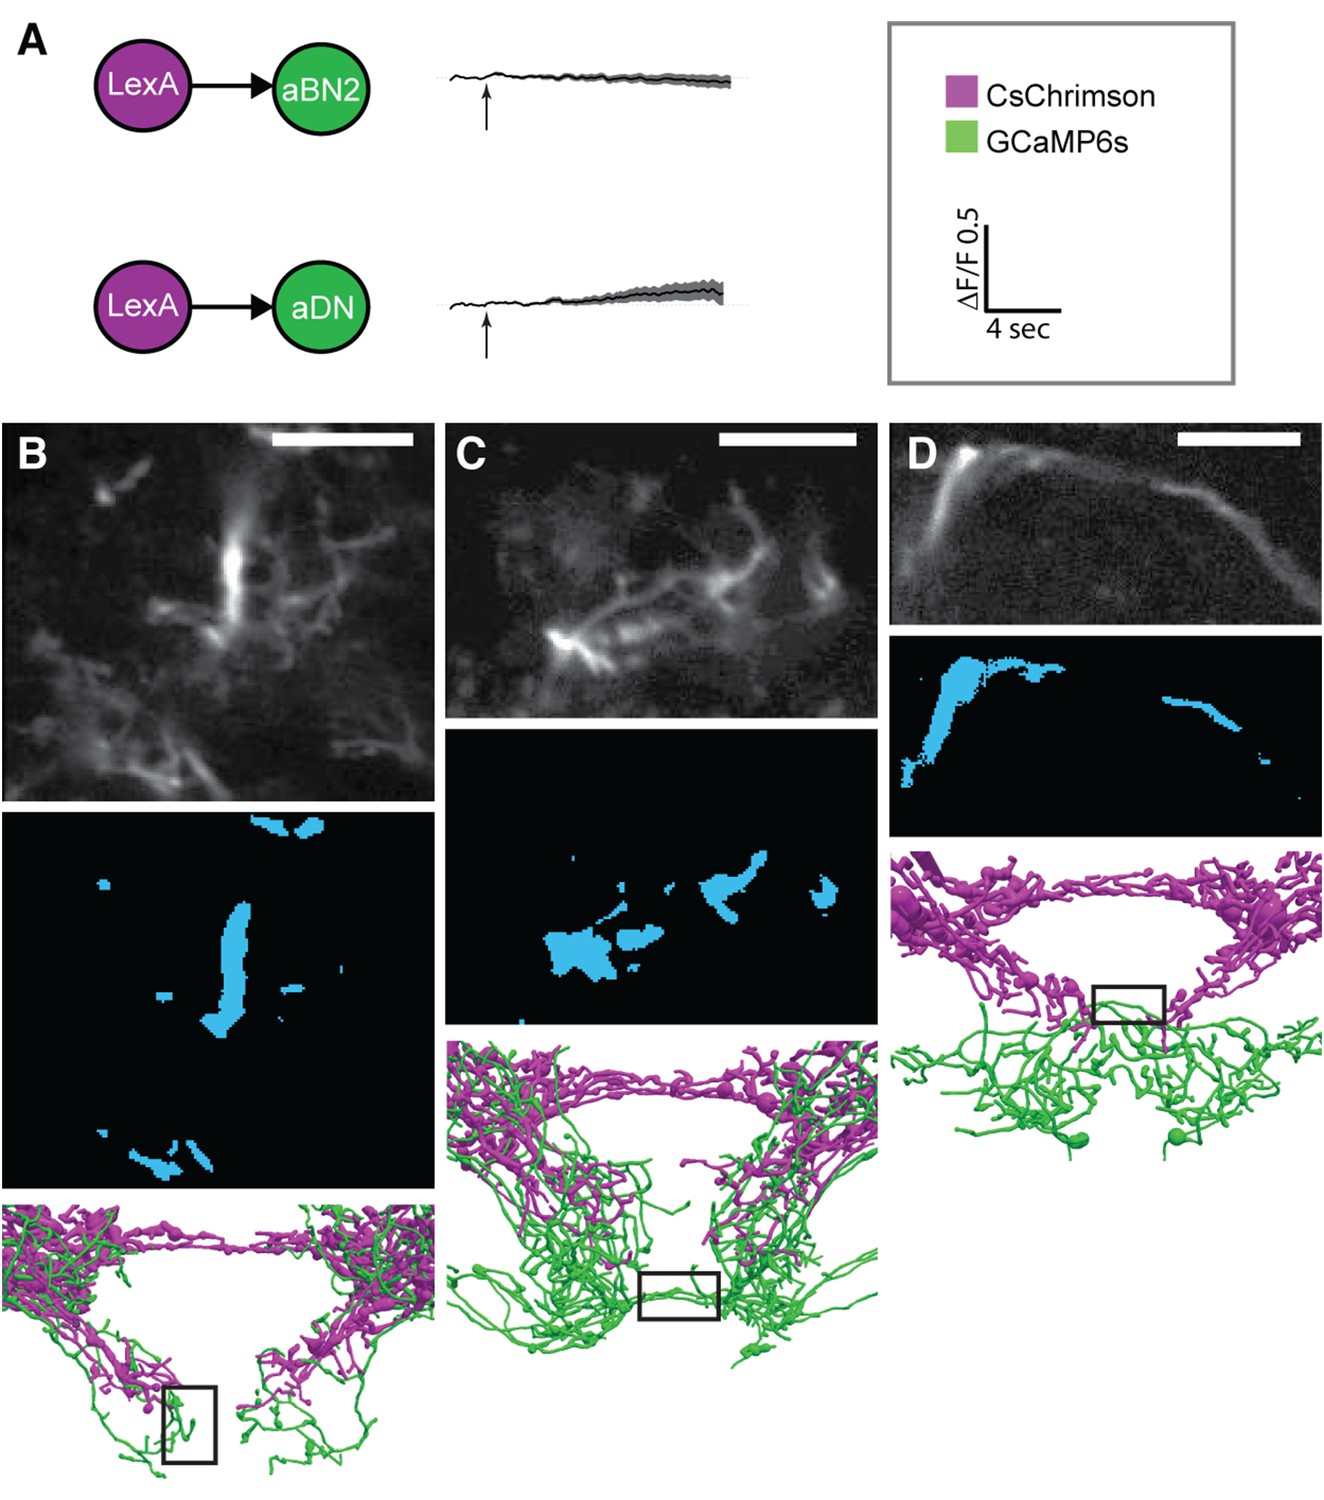
(A) Control experiments for CsChrimson/GCaMP6s activation. LexAop-CsChrimson was crossed with the control LexA driver, and GCaMP6s was expressed with aBN2-spGAL4-1 (top) or aDN2-spGAL4-2 (bottom). Flies were tested and imaging results are displayed as described in Figure 5. Average changes in fluorescence ±s.e.m. of multiple flies. (B–D) Representative examples of the regions imaged for (B) aBN1, (C) aBN2, and (D) aDNs. Top panel: example average projections of an experimental run. Middle panel: regions of interest used for analysis (see ‘Materials and methods’). Lower panel: black rectangles show the approximate positions of the fields of view in each whole pattern. Scale bars, 10 μm.
Figure 6—figure supplement 2

Raw data for functional connectivity experiments (at low intensity red light).
Raw data for experiments shown in Figure 6. All experiments shown were done in the absence of drugs. Red light intensity was set at 50 μW/mm2. Each column corresponds to the number of light pulses delivered, where each light pulse was 2 ms and the interpulse intervals were 18 ms. Each trace shown is the average of four responses recorded at ∼20 s intervals. Each row represents a different genotype and colored traces in a given row correspond to an individual CNS. Multiple runs were often performed for a given CNS and set of conditions (shown by the same colored traces in a row). Black boxes show which conditions were used to generate the average traces displayed in Figure 6. All traces within the black boxes were used to generate traces shown in Figure 6A–D. For Figure 6E–I, colored dots correspond to samples that were used to generate pre-drug treatment average traces and then used for the pharmacology experiments (traces with drugs are not shown). Traces of samples used for mecamylamine experiments are marked using blue, green, red dots, whereas, those for or picrotoxin are marked using black, grey, orange dots.
Figure 6—figure supplement 3
Raw data for functional connectivity experiments (at high intensity red light).
Raw data for experiments shown in Figure 6. All experiments shown were done in the absence of drugs. Red light intensity was set betwen 290 to 700 μW/mm2. Each column corresponds to the number of light pulses delivered, where each light pulse was 2 ms and the interpulse intervals were 18 ms. Each trace shown is the average of four responses recorded at ∼20 s intervals. Each row represents a different genotype and colored traces in a given row correspond to an individual CNS. Multiple runs were sometimes performed for a given CNS and set of conditions (shown by the same colored traces in a row). Black boxes show which conditions were used to generate the average traces displayed in Figure 6. All traces within the black boxes were used to generate traces shown in Figure 6A–D. For Figure 6E–I, colored dots correspond to samples that were used to generate pre-drug treatment average traces and then used for the pharmacology experiments (traces with drugs are not shown). Traces of samples used for mecamylamine experiments are marked using blue, green, red dots, whereas, those for or picrotoxin are marked using black, grey, orange dots.
Figure 7 with 1 supplement

A circuit whose components elicit different antennal grooming durations.
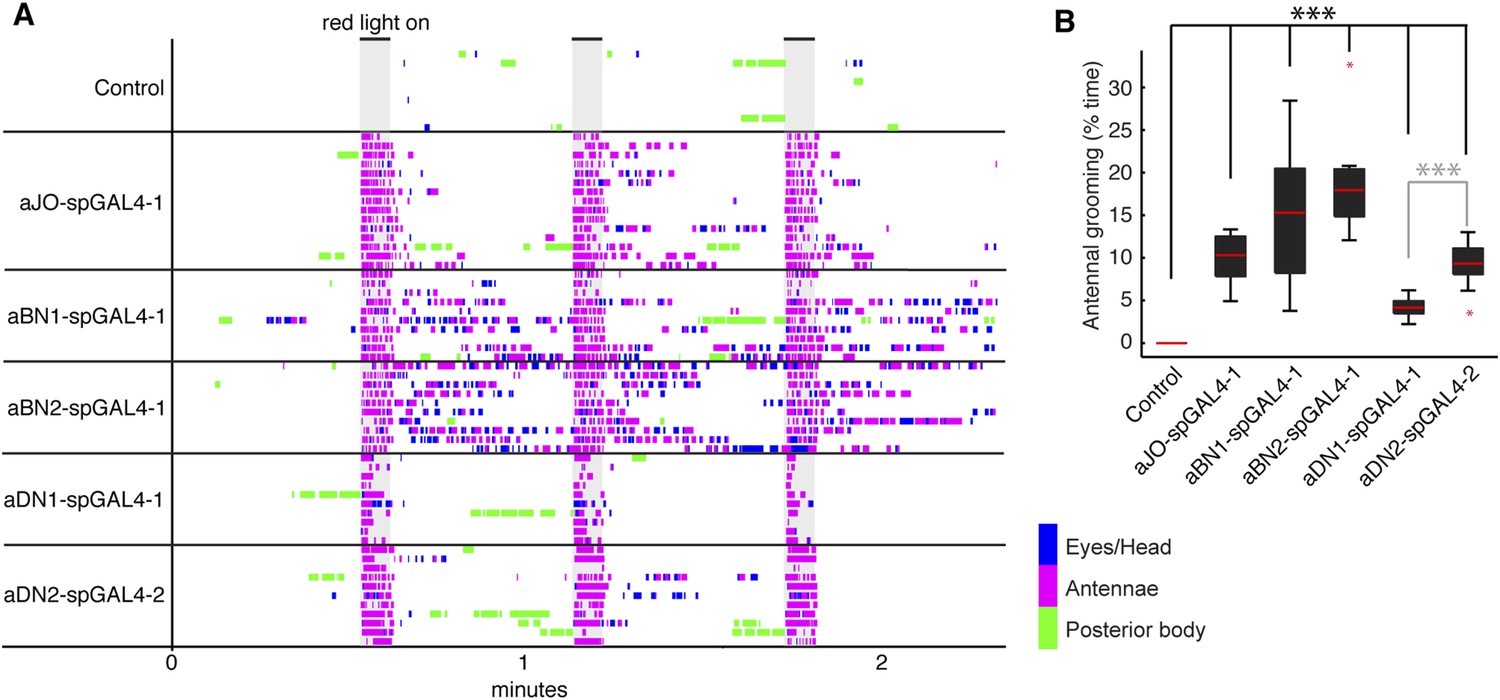
(A) The antennal grooming circuit (lateral view of tracings). Specific colors represent each neuron type shown in B. (B) Wiring diagram of the circuit. Lightning bolt represents mechanical stimulation of the antennae. Arrows represent excitatory cholinergic functional connections and the ball and stick indicates an inhibitory (picrotoxin sensitive) connection from an unidentified inhibitory neuron (IN). Note: JO neurons were previously reported to be cholinergic (Yasuyama and Salvaterra, 1999; Salvaterra and Kitamoto, 2001). Arrow to the gray oval surrounding the aDNs indicates that aBN1 provides excitatory input for aDN, but it is not known for which aDN(s). Gray dashed arrows indicate relatively weak and/or inconsistent connections (JO to aDN2 and aBN2 to aBN1). Text on the left highlights putative circuit connectivity features. Dashed arrow from aDN3 depicts presumed descending command. (C) The different neuronal classes induce distinct grooming responses. Ethograms of manually scored video showing antennal grooming induced with red light sensitive CsChrimson expressed in different spGAL4 pairs (aJO-spGAL4-1, aBN1-spGAL4-1, aBN2-spGAL4-1, aDN1-spGAL4-1, and aDN2-spGAL4-2). Ethograms of individual flies are stacked on top of each other. The gray bars indicate presentation of red light. Colors correspond to the wiring diagram (B) and indicate which neuronal class expressed csChrimson. Control flies did not perform antennal grooming (Figure 7—figure supplement 1). See Video 4, Video 5, and Video 6 for representative examples. (D) Histograms representing the fraction of flies that were performing antennal grooming in C within one-second time bins. (E) The proposed organization of antennal grooming circuitry.
Figure 7—figure supplement 1
CsChrimson activation of different neuronal classes.
(A) Stacked ethograms of grooming movements performed by the spGAL4 pairs indicated expressing CsChrimson (10–15 flies shown for each spGAL4 pair). Gray bars indicate when the red light was on. Colors correspond to grooming movements performed. (B) Percent of total time that each spGAL4 line spent grooming their antennae. Box plots and statistics are described in Figure 1B.
Videos
Video 1
Traced antennal grooming circuit.
Traced and manually aligned neurons are shown in different colors. aJO neurons (blue) project from the second antennal segment into the anterior brain. aBN1 (red) has cell bodies in the dorsal and posterior brain. aBN2 is shown in yellow. aDN1 is shown in green and sends descending projections to the VNS.
Video 2
Computationally aligned antennal grooming circuit.
Computationally aligned neurons are shown in different colors. aJO neurons (blue), aBN1 (red), aBN2 (yellow) and aDN1 (green). The neuropil was stained with anti-bruchpilot (grey). See ‘Materials and methods’ for a description of how the computational alignment and rendering of images were done.
Video 3
Grooming movements performed in response to displacements of the antennae.
The third antennal segments of a control fly were coated with iron powder, and the fly was tethered within the electromagnetic apparatus shown in Figure 4C,D. The infrared light positioned behind the fly shows when the magnetic field was applied to displace the antennae.
Video 4
Grooming in response to red light stimulation of CsChrimson-expressing aBN1 neurons.
CsChrimson was expressed in aBN1 using aBN1-spGAL4-1. The infrared light in the bottom right hand corner shows when the red light was on to activate aBN1. Note that grooming persists upon cessation of the red light.
Video 5
Grooming in response to red light stimulation of CsChrimson-expressing aDN2 neurons.
CsChrimson was expressed in aDN2 using aDN2-spGAL4-2. The infrared light in the bottom right hand corner shows when the red light was on to activate aDN2. Note that grooming does not persist upon cessation of the red light.
Video 6
Grooming in response to red light stimulation of CsChrimson-expressing aJO neurons.
CsChrimson was expressed in the aJO using aJO-spGAL4-1. The infrared light in the bottom right hand corner shows when the red light was on to activate the aJO. Note that grooming persists upon cessation of the red light.
Additional files
-
Supplementary file 1
Enhancer identities used to target different neuronal classes.
- https://doi.org/10.7554/eLife.08758.031
-
Supplementary file 2
Stimulus conditions used for the experiment shown in Figure 6.
- https://doi.org/10.7554/eLife.08758.032
-
Supplementary file 3
Stocks used in this study.
- https://doi.org/10.7554/eLife.08758.033
-
Supplementary file 4
Design plans for the fly electromagnetic stimulation rig.
- https://doi.org/10.7554/eLife.08758.034
Download links
A two-part list of links to download the article, or parts of the article, in various formats.
Downloads (link to download the article as PDF)
Open citations (links to open the citations from this article in various online reference manager services)
Cite this article (links to download the citations from this article in formats compatible with various reference manager tools)
A neural command circuit for grooming movement control
eLife 4:e08758.
https://doi.org/10.7554/eLife.08758


