Thalamic reticular nucleus induces fast and local modulation of arousal state
- Harvard University, United States
- Massachusetts General Hospital, United States
- Massachusetts Institute of Technology, United States
- Harvard Medical School, United States
- New York University, United States
Figures
Figure 1 with 9 supplements
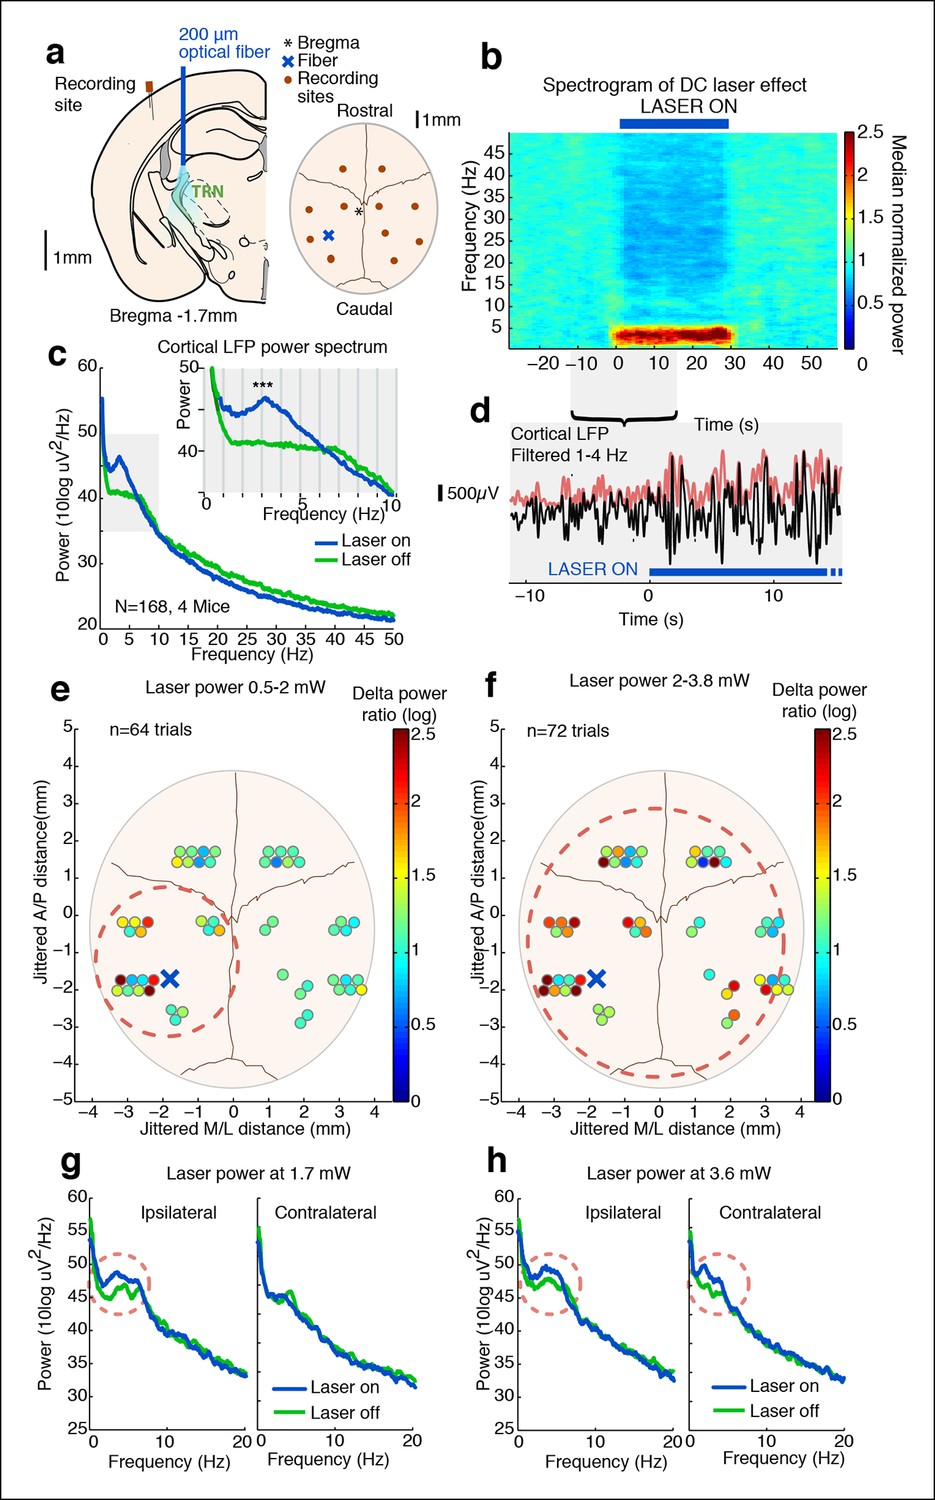
Tonic optogenetic stimulation of thalamic reticular neurons produces local cortical slow waves.
(a) Diagram of surgery: fiber is implanted into left TRN, and stereotrodes are implanted in multiple sites across cortex. (b) Spectrogram showing average effect in ipsilateral somatosensory cortex across 168 trials (4 mice): TRN stimulation causes a rapid increase in delta (1–4 Hz) power that persists throughout the stimulation period. Power is normalized to the 30 s pre-stimulus period. (c) Average spectrum of LFP in somatosensory cortex: during tonic optogenetic activation of TRN, this cortical site demonstrates an increase in delta (1–4 Hz) power and a decrease in beta and gamma (12–50 Hz) power. Gray region shows zoomed-in plot of delta power increase. (d) Example trace from a single trial, showing the LFP filtered between 1–4 Hz (black line), and the instantaneous delta amplitude (red line). (e and f) Circles represent single electrodes, and their color indicates the size of the delta (1–4 Hz) power increase when laser is on (total n = 136 trials, 4 mice, 12– 14 electrodes per mouse). At low powers (<2 mW), slow waves are induced only in electrodes near ipsilateral somatosensory cortex (red dashed circle). At high powers (>2 mW) that activate larger regions of TRN, slow waves appear across multiple cortical areas, including frontal cortex and contralateral cortex (red dashed circle). Distances are jittered so that electrodes from all mice can be displayed in a single schematic. Blue ‘X’ indicates placement of laser fiber. (g) Example spectra from one mouse at low laser power in electrodes ipsilateral and contralateral to the laser fiber (n = 10 trials): slow waves are induced in ipsilateral cortex but not in contralateral cortex. (h) Example spectra from same mouse at high laser power (n = 9 trials): slow waves are generated in both ipsilateral and contralateral cortex.
Figure 1—figure supplement 1
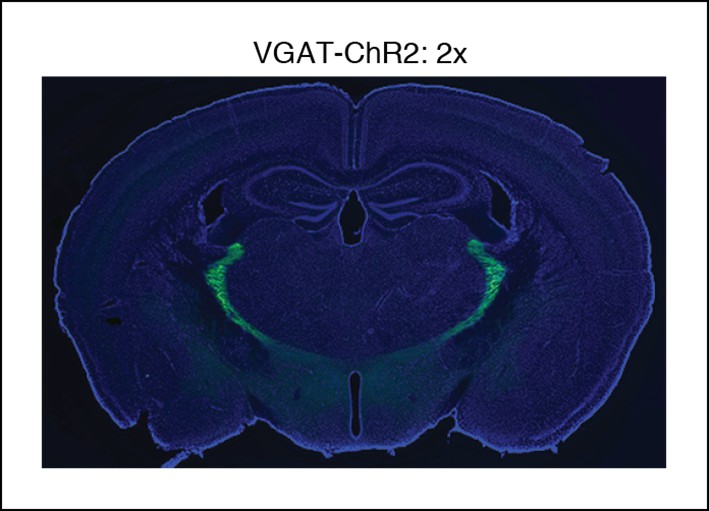
Selective TRN stimulation causes the induction of cortical slow waves.
VGAT-ChR2 mouse histology: blue channel is DAPI, green channel is EYFP, at 2x.
Figure 1—figure supplement 2
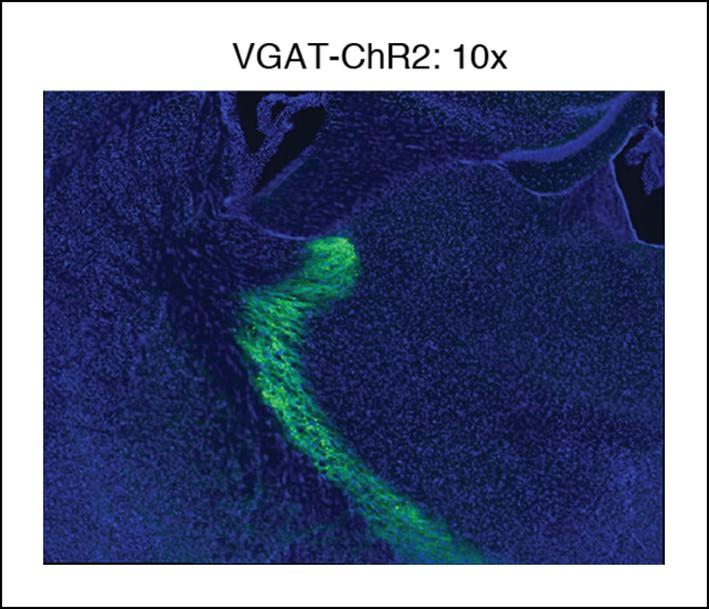
Example of VGAT-ChR2 mouse histology at 10x.
Around the optical fiber, expression is limited to TRN.
Figure 1—figure supplement 3
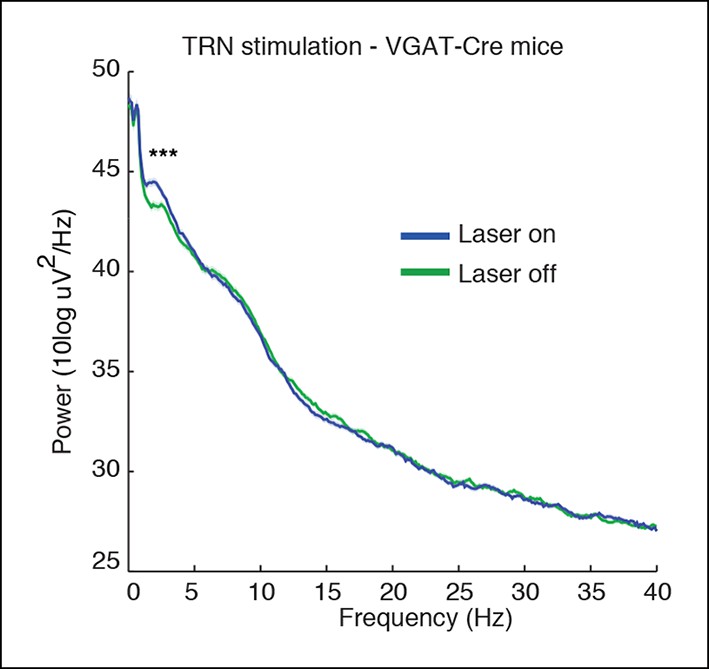
Spectra of cortical LFPs recorded in VGAT-Cre mice expressing ChR2 selectively in TRN through local injections.
These mice also show a TRN-induced selective increase in slow wave power (median = 0.73 dB, CI = [0.47 0.99], n = 370 trials, 3 mice).
Figure 1—figure supplement 4
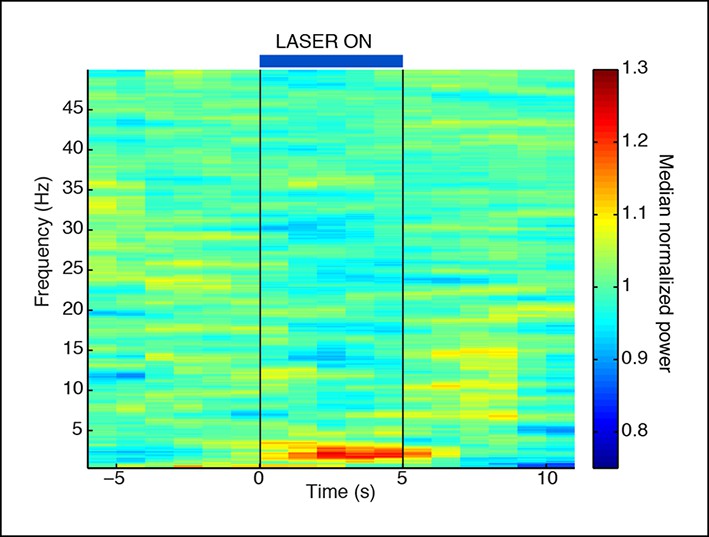
Normalized spectrogram recorded in VGAT-Cre mice expressing ChR2 selectively in TRN through local injections.
These mice also show a TRN-induced selective increase in slow wave power that is locked to laser onset. Spectrogram is normalized to baseline within each frequency band, using same data as in Figure 1—figure supplement 3.
Figure 1—figure supplement 5
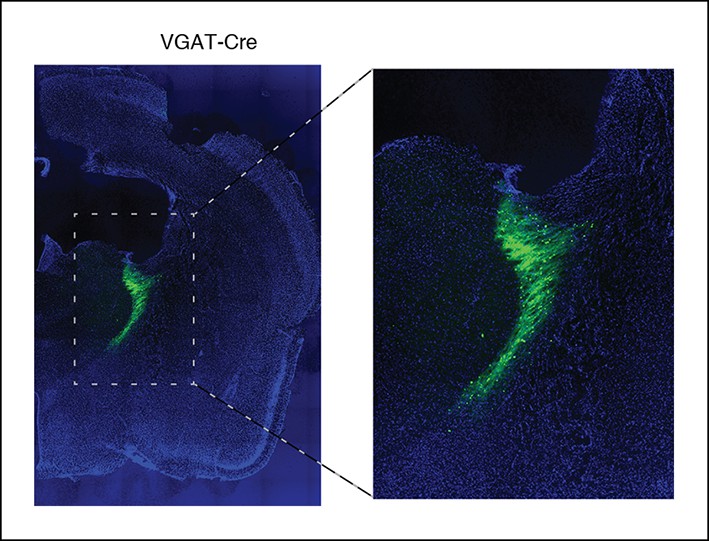
After viral injections, ChR2 expresses selectively in TRN.
Example of histology at 10x, large-scale and zoomed-in, from a VGAT-Cre mouse with ChR2 viral injections. Blue channel is DAPI and green channel is EYFP, showing selective TRN expression.
Figure 1—figure supplement 6
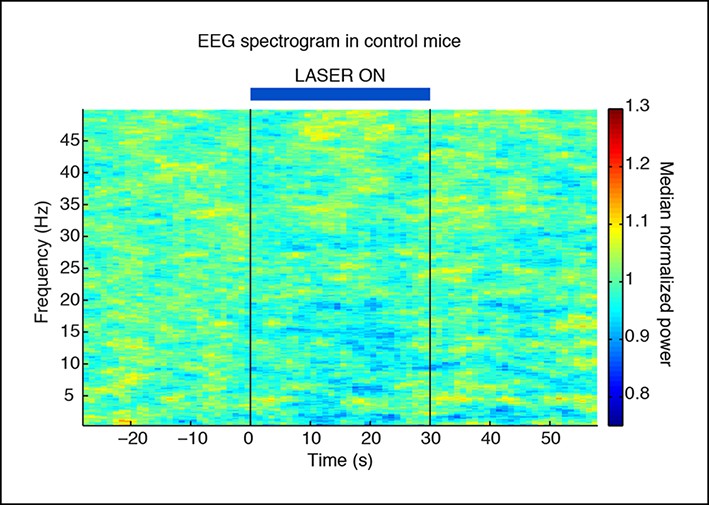
Slow wave induction depends on ChR2 expression.
Control mice that are negative for ChR2 do not exhibit slow waves during laser stimulation (n = 494 trials, 3 mice).
Figure 1—figure supplement 7
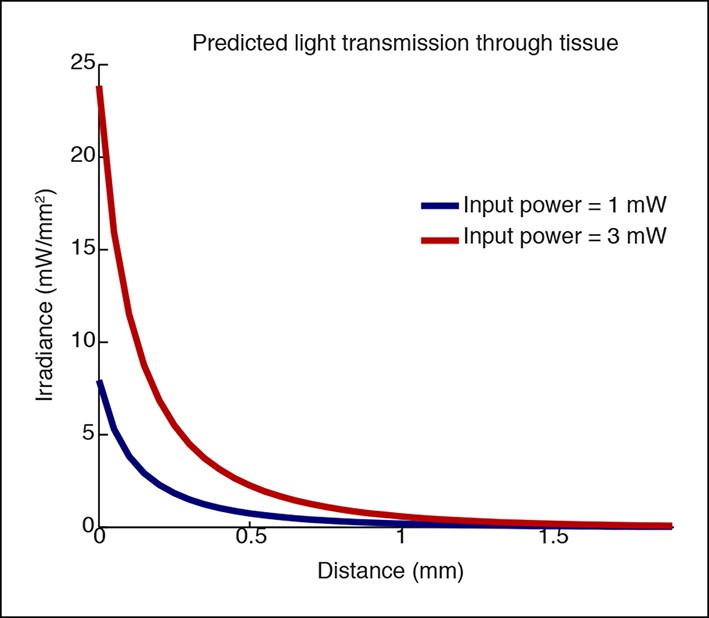
Simulation of light transmission through tissue at different laser powers.
Simulations using Yizhar et al. 2011 to predict irradiance with increasing distance. The higher laser power would stimulate a larger volume of tissue (e.g. if the threshold for stimulation is 1 mW/mm2, 0.4 mm would be stimulated when applying 1mW, and 0.75 mm would be stimulated when applying 3 mW, nearly twice the distance.
Figure 1—figure supplement 8
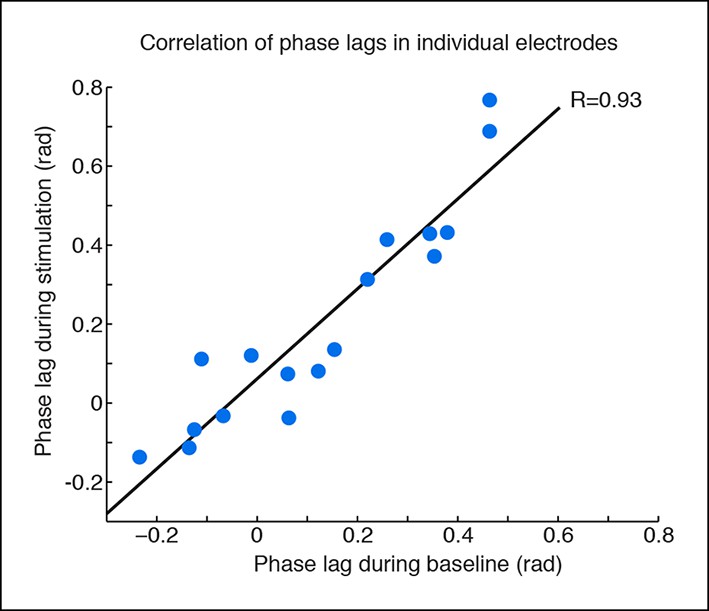
Phase offsets across cortex during TRN stimulation.
Phase offsets are strongly correlated across baseline and stimulation conditions in electrodes with induced slow waves, indicating that the induced slow waves maintain similar phase offsets to the baseline cortical dynamics. Each dot is one electrode, n = 17 electrodes, 4 mice, black line is correlation.
Figure 1—figure supplement 9
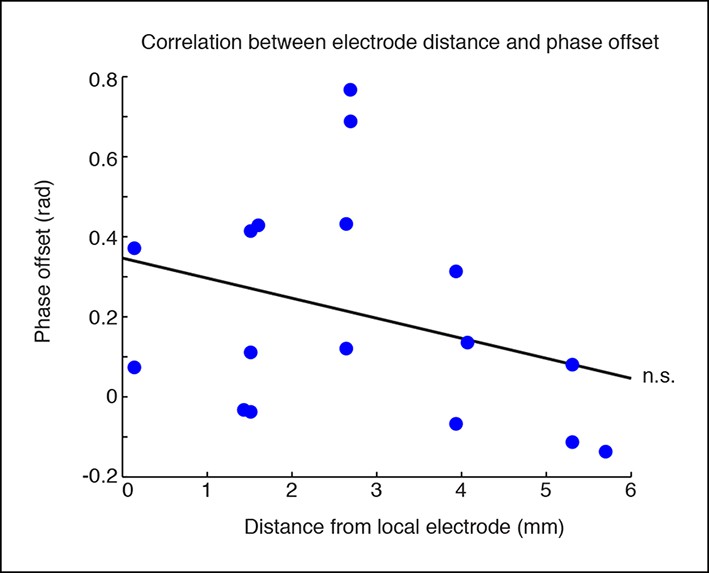
Phase offsets across cortex are not correlated with distance to the electrode.
Phase offsets in cortical electrodes were not correlated with their distance from the electrode local to the stimulation site (R = -0.31, p = 0.22). This would be consistent with local thalamocortical oscillations, but correlations may also be weakened because many regions that are synaptically close are still geometrically distal to the local stimulation site.
Figure 2
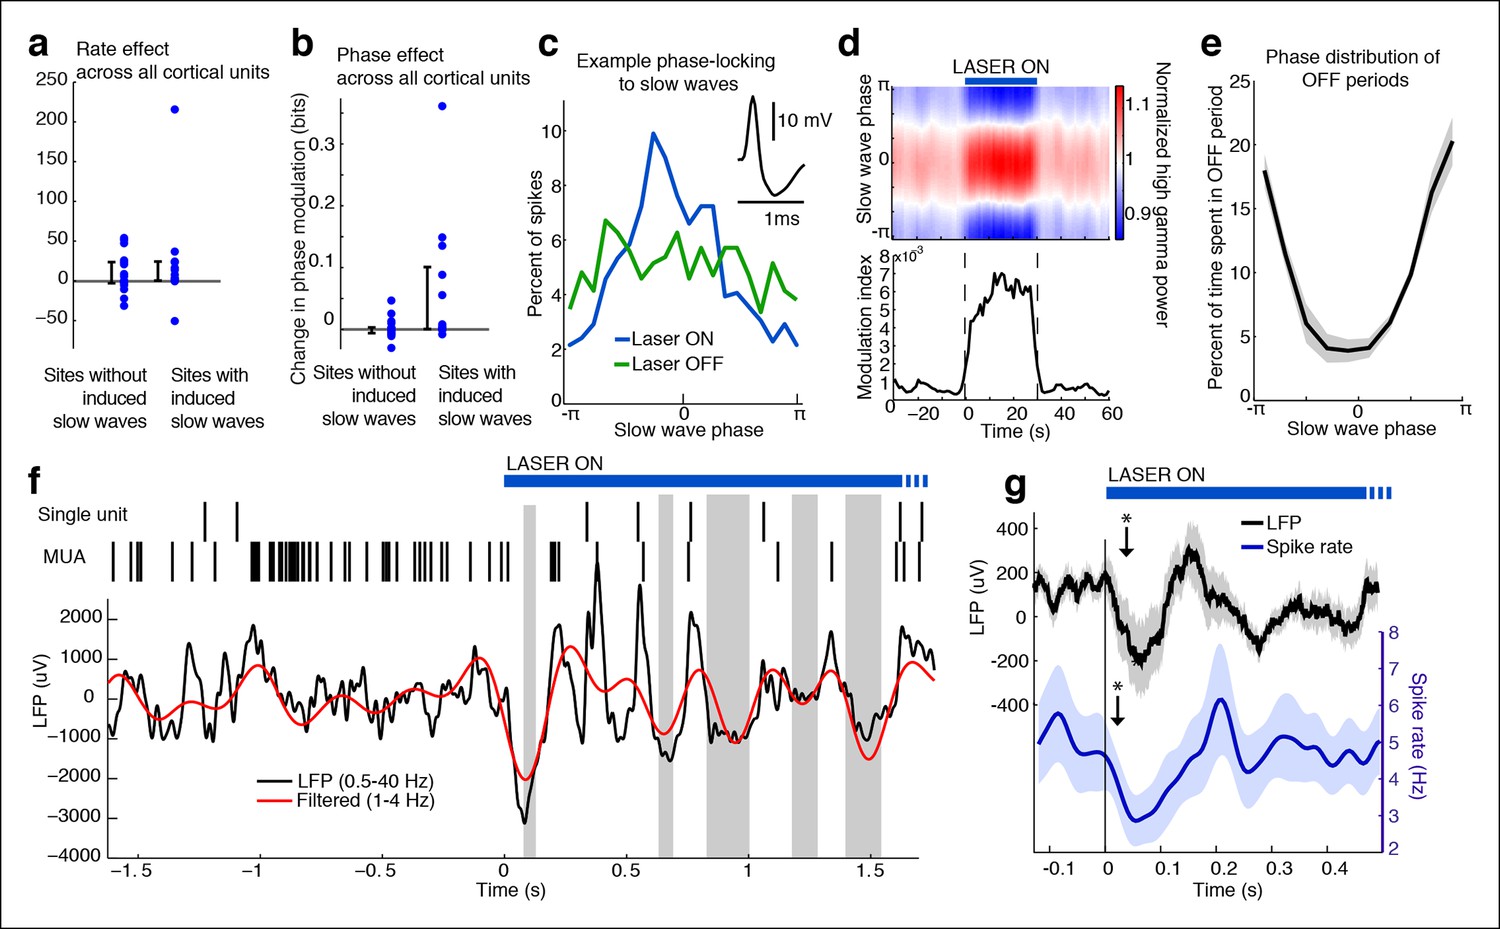
Cortical units undergo OFF periods that are phase-locked to the slow waves during TRN activation.
(a) Rate effect across all cortical units, categorized by strength of delta power increase in that channel. There is no significant change in spike rate for either group. Error bars show interquartile range. (b) Phase-locking effects across all cortical units show that units on channels with induced slow waves become phase-locked to the slow waves during TRN stimulation. Error bars show interquartile range. Each dot is one unit (sites with slow waves: 13 units, 4 mice; sites without slow waves: 18 units, 4 mice). (c) Phase distribution of spikes from an example cortical unit recorded on a channel with a 3.4 dB delta power increase during TRN activation: unit becomes phase-locked to the slow wave. (d) Phase distribution of normalized high gamma (70–100 Hz) power shows that high gamma power becomes rapidly phase-locked to slow waves during TRN stimulation. Gamma power is normalized to have a mean of 1 at each time point, so brightness indicates the strength of phase-locking. (e) Phase distribution of all OFF periods shows that they occur during the trough of the slow waves. (f) Example trace from somatosensory cortex: optogenetic TRN stimulation rapidly induces slow waves that are associated with OFF periods in cortical activity (gray shaded regions mark automatically detected OFF periods). (g) Mean spike rate and LFP locked to laser onset in channels with induced delta: the induced slow wave trough and phase-locked cortical inhibition are observed within 100 ms of laser onset. Stars indicate timing of significant (α = 0.05) decrease in LFP voltage and mean spike rate; the decrease persists throughout the first 100 ms. Triggered LFP and units are averaged across cortical electrodes with a delta power increase (n = 14 channels, 4 mice), shaded region is std. err.
Figure 3 with 1 supplement
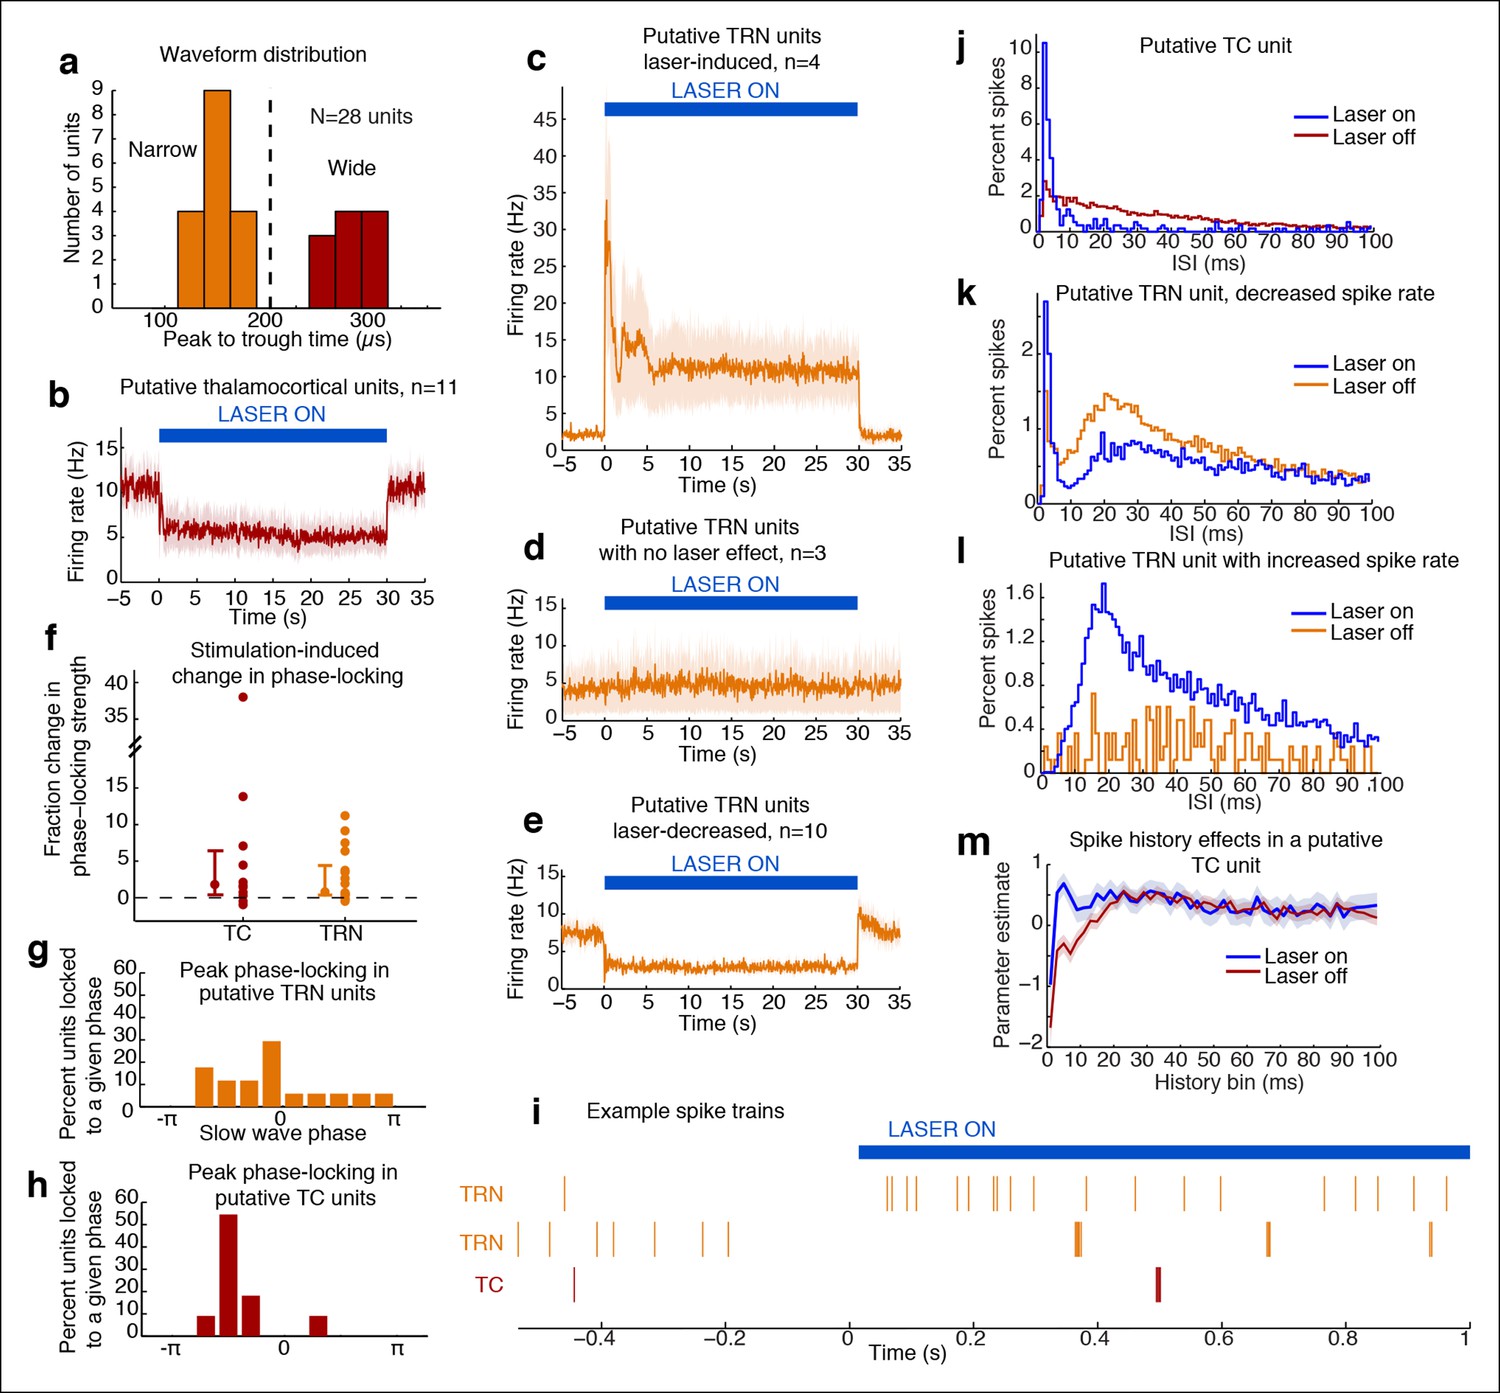
Optical stimulation strongly activates a subset of TRN neurons and induces periodic suppression of thalamic firing.
(a) Histogram of waveform parameters from single units recorded in freely behaving mice show a bimodal distribution of peak-to-trough time across subcortical units (n = 28 units, 5 mice). Units with peak-to-trough times under 200 μs were categorized as Narrow (putative TRN), and units over 200 μs were categorized as Wide (putative thalamocortical [TC]). (b) Putative thalamocortical (Wide) units consistently decrease their firing rates during laser stimulation. Mean firing rate in 500 ms bins, shaded region is std. err. across units. (c–e) Heterogeneous firing rates in TRN during stimulation: 4 units strongly increase their firing rates, whereas 10 units decrease their firing rates. The modulation in firing rate is strongly time-locked to laser onset and offset. Shaded regions are std. err. across units. (f) Phase-locking effects across all subcortical units show that most become phase-locked to the slow waves during TRN stimulation. Circles mark the change in phase-locking for each unit; error bars show median change with 25th and 75th quartiles. (g) The phase distribution of putative TRN neurons is broad, with different neurons exhibiting different preferred phases. (h) Peak phase-locking values of putative TC neurons show a tight distribution (Kurtosis = 3.99, n = 11 units), indicating that nearly all putative TC neurons show similar phase-locking to the LFP. Putative TC phase-locking is more consistent across units than putative TRN phase-locking (in b; Kurtosis = 0.24, n = 17 units, group difference = 3.74, significant at α = 0.05 from bootstrap resampling). (i) Example spike rasters around laser onset from 3 single units. Units were not recorded simultaneously; each raster is an independent example. (j–l) Example ISI histograms in single units. (m) Example of parameter estimates from generalized linear model for one unit shows the contribution of recent (<10 ms) spike history increases during stimulation. Shaded regions are std. err.
Figure 3—figure supplement 1
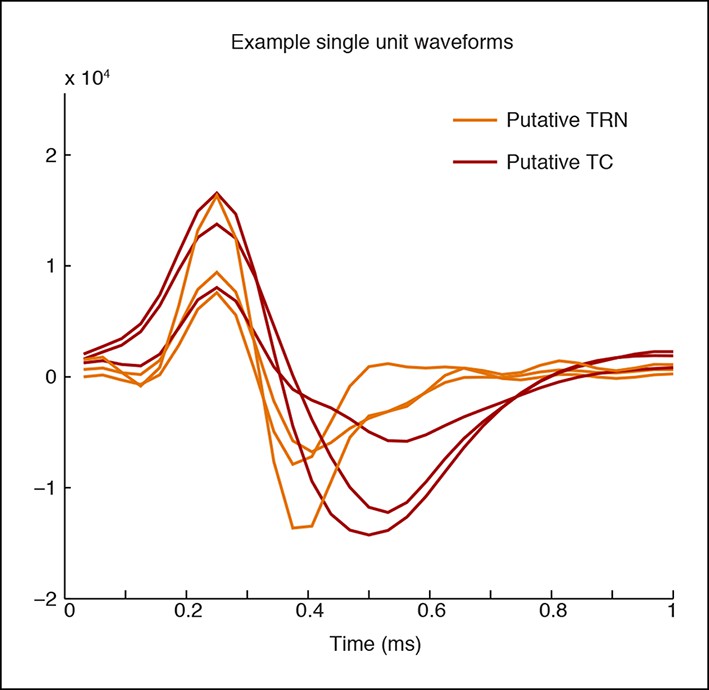
Example waveforms for putative TC and TRN neurons.
A representative set of waveform shapes is presented. The putative TRN units have a narrower trough than the putative TC units.
Figure 4 with 6 supplements
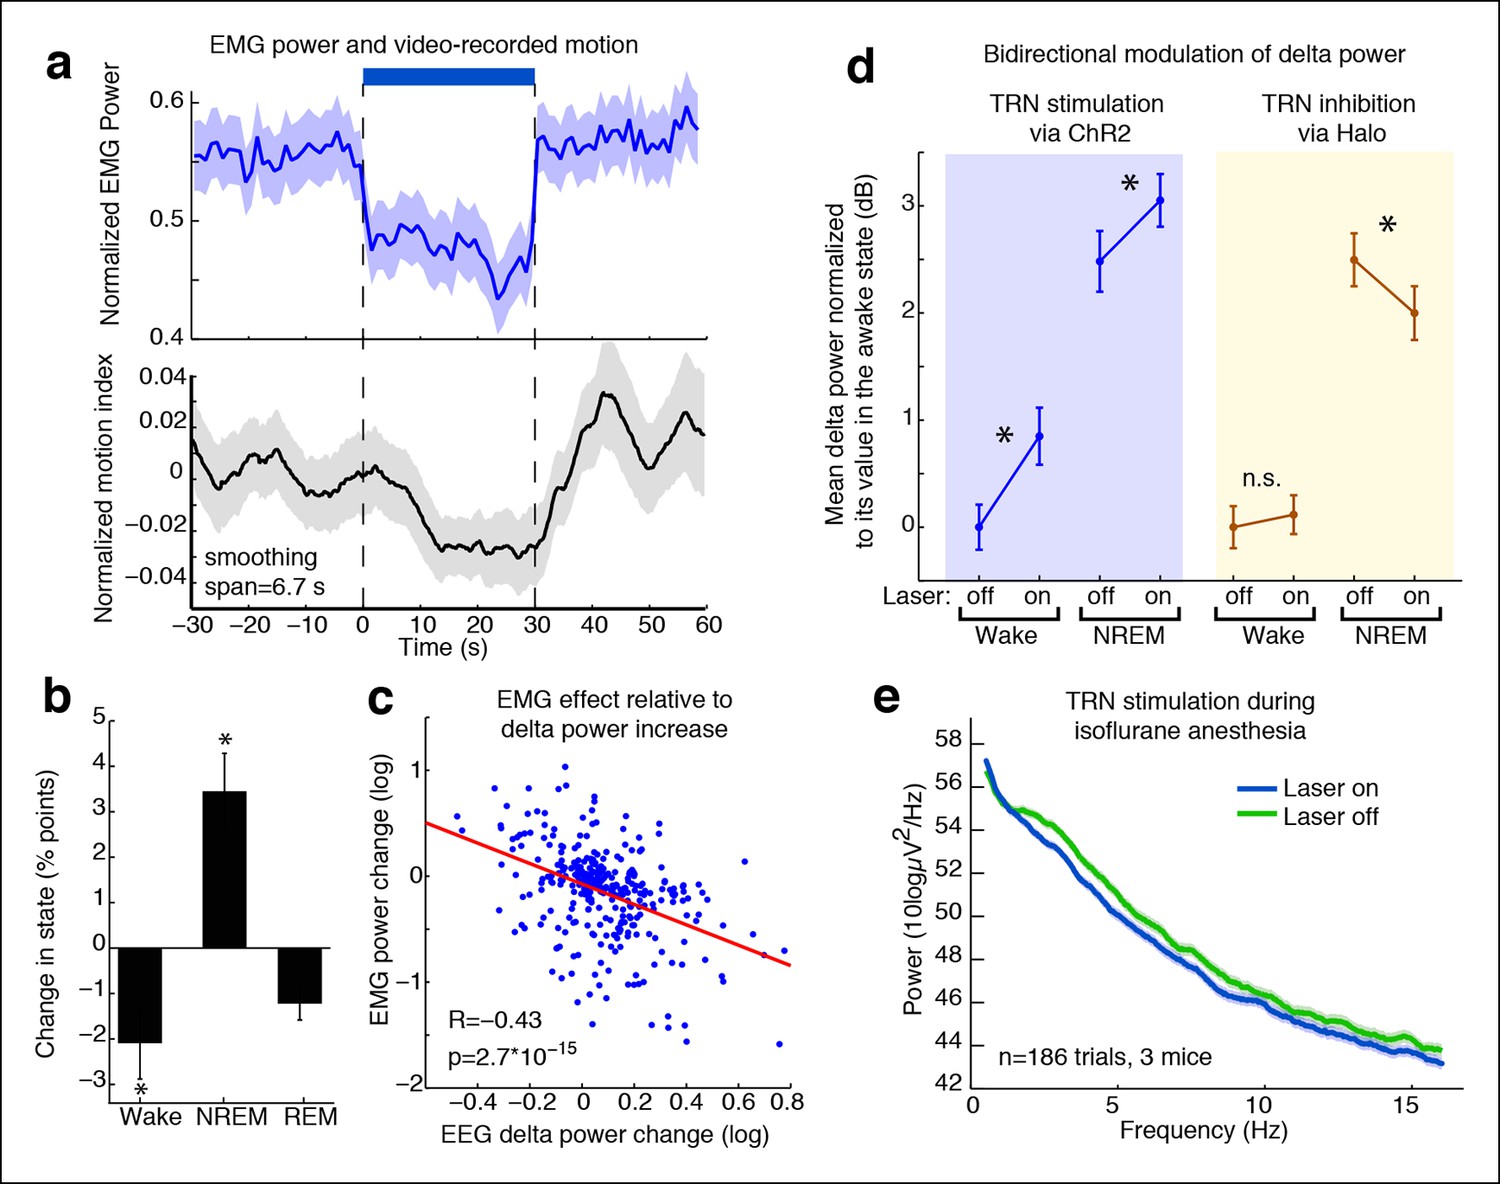
TRN modulates arousal state in a bidirectional and state-dependent manner.
(a) Top panel: Mean EMG power locked to laser onset shows that EMG power decreases significantly during unilateral TRN stimulation in freely behaving mice (n = 315 trials, 8 sessions, 2 mice). Bottom panel: Mean smoothed motion (6.67 s moving average) detected in video: animals’ motion decreases significantly during optogenetic stimulation (n = 421 trials, 7 mice). (b) Mean change in arousal state during TRN activation: mice spend significantly more time in non-REM sleep and significantly less time in the awake state (n = 560 trials, 3 mice). Stars indicate significant effects at α = 0.05. (c) Individual trial correlation shows that the decrease in EMG power is correlated with the TRN-induced increase in EEG delta power (n = 315 trials, 2 mice). (d) Delta power increases in VGAT-Cre mice expressing ChR2 during TRN stimulation, whether awake or in NREM at time of stimulation. In VGAT-Cre mice expressing halorhodopsin, TRN inhibition has no effect in awake mice, whereas it decreases the delta power that is present in sleeping mice. N = 3 mice expressing ChR2 (160 wake trials; 192 NREM trials), n = 3 mice expressing Halo (459 wake trials; 211 NREM trials), stim. duration = 5 s. All recordings were in freely behaving mice. Dots show mean power +/- std. err; stars indicate a significant effect of the laser on the median power, computed with the Wilcoxon signed-rank test. (e) Cortical recordings in VGAT-ChR2 mice (n = 186 trials, 3 mice). During isoflurane anesthesia, the slow waves appear to be saturated and are not increased by TRN stimulation. Instead, broadband power decreases, suggesting a shift in dynamics that favours the inactivated state.
Figure 4—figure supplement 1
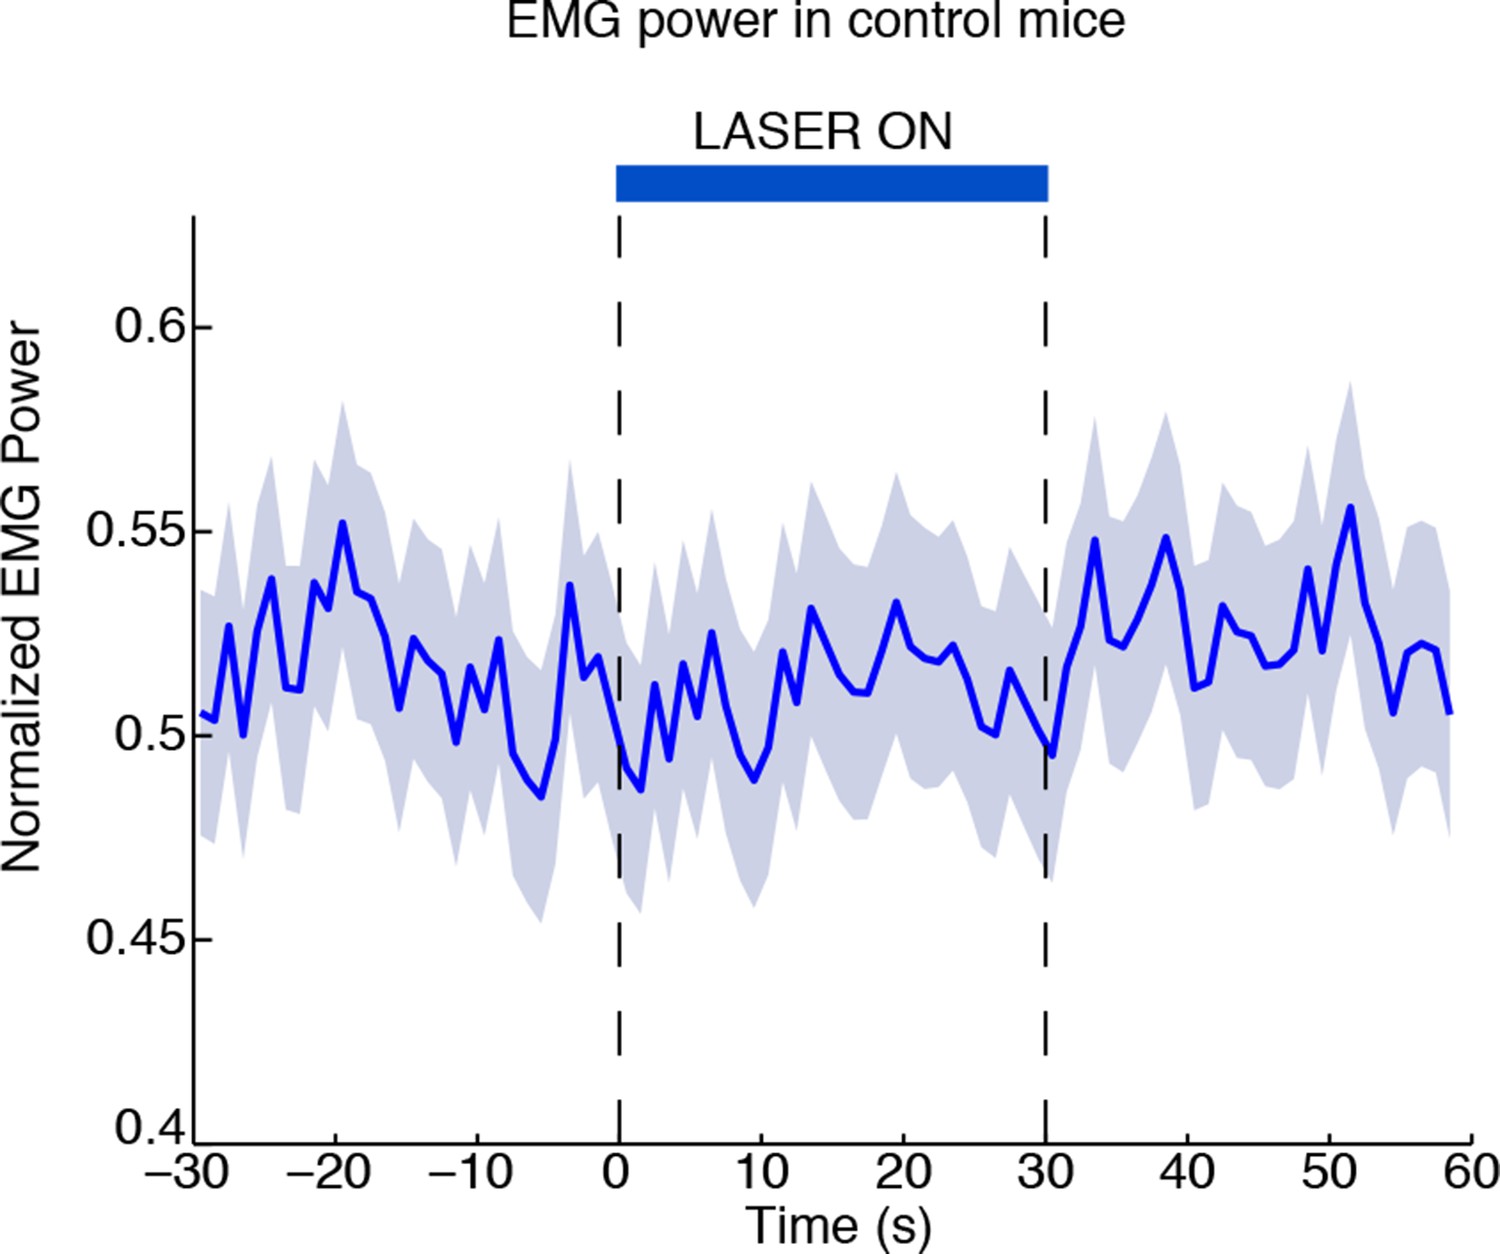
Laser-induced behavioural decreases in arousal depend on ChR2 expression.
EMG power does not decrease during laser stimulation in control mice that are negative for ChR2, confirming that the behavioral effect is not due to a nonspecific effect of light (n = 494 trials, 3 mice).
Figure 4—figure supplement 2

Halorhodopsin expresses in TRN.
Example of histology at 10x, large-scale and zoomed-in, from a VGAT-Cre mouse with NpHR viral injections. Blue channel is DAPI and green channel is EYFP, showing selective TRN expression.
Figure 4—figure supplement 3
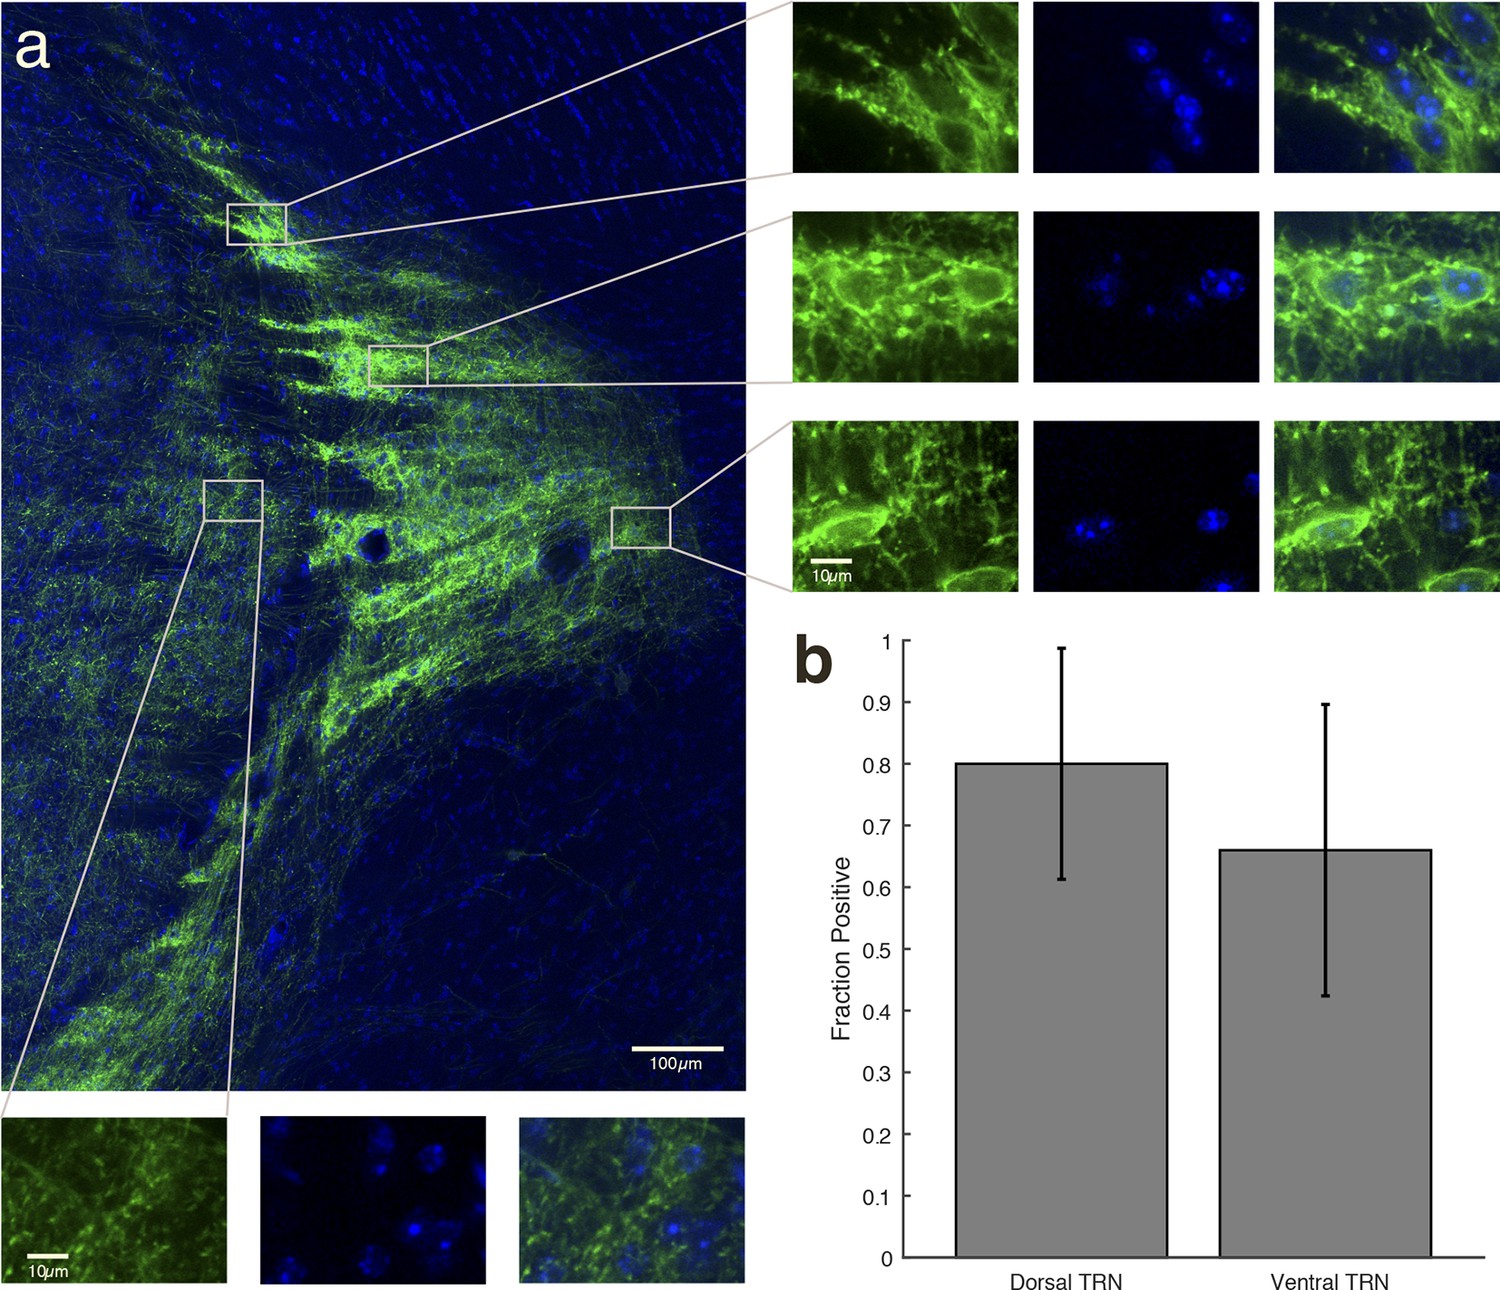
Halorhodopsin expresses in most cell bodies within the locally injected region of TRN, and not in thalamic cell bodies outside TRN.
(a) Higher-resolution image of expression within TRN in a VGAT-Cre mouse with NpHR viral injections. The striped fluorescence pattern is due to the anatomical structure of TRN, which is a netlike, reticulated structure. Dense rings of fluorescence appear around the TRN cell bodies. Right panels: Zoomed-in images demonstrate that TRN neuronal cell bodies are encircled by bright fluorescence from membrane-bound EYFP, indicating NpHR expression. Bottom panels: Zoomed-in images in thalamus demonstrate that expression is only in projections from TRN, and is not in the thalamic cell bodies (no ring of fluorescence surrounds the cells). () Cell counting in dorsal and ventral TRN shows that the majority of cells in both regions were positive for EYFP expression. Error bars are 95% confidence intervals.
Figure 4—figure supplement 4

TRN stimulation further increases cortical neuronal phase modulation during isoflurane anesthesia.
Phase-locking effects across all cortical units during isoflurane anesthesia: units become significantly more modulated by slow waves when TRN is activated. Error bars are st. dev, (n = 15 units, 4 mice).
Figure 4—figure supplement 5
Example of state-dependent increases in cortical phase-locking during isoflurane anesthesia.
TRN activation in an awake mouse causes a cortical single unit to become phase-locked to the induced slow waves. When the mouse is under isoflurane anesthesia, the cortical unit is already phase-locked to slow waves at baseline, and TRN activation causes the phase-locking to become even sharper, with some phases associated with complete suppression of firing.
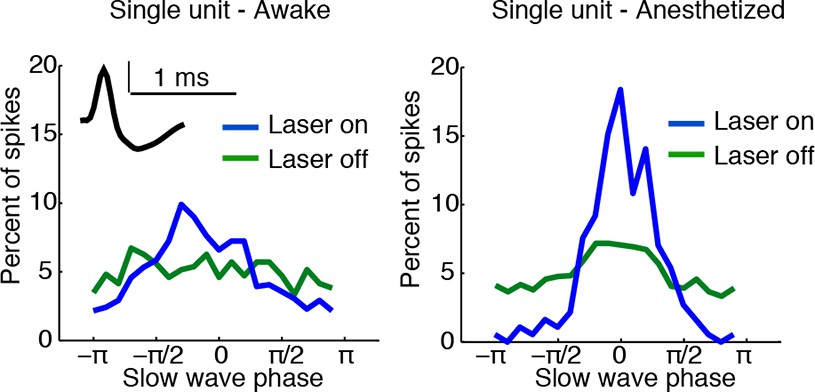
Figure 4—figure supplement 6
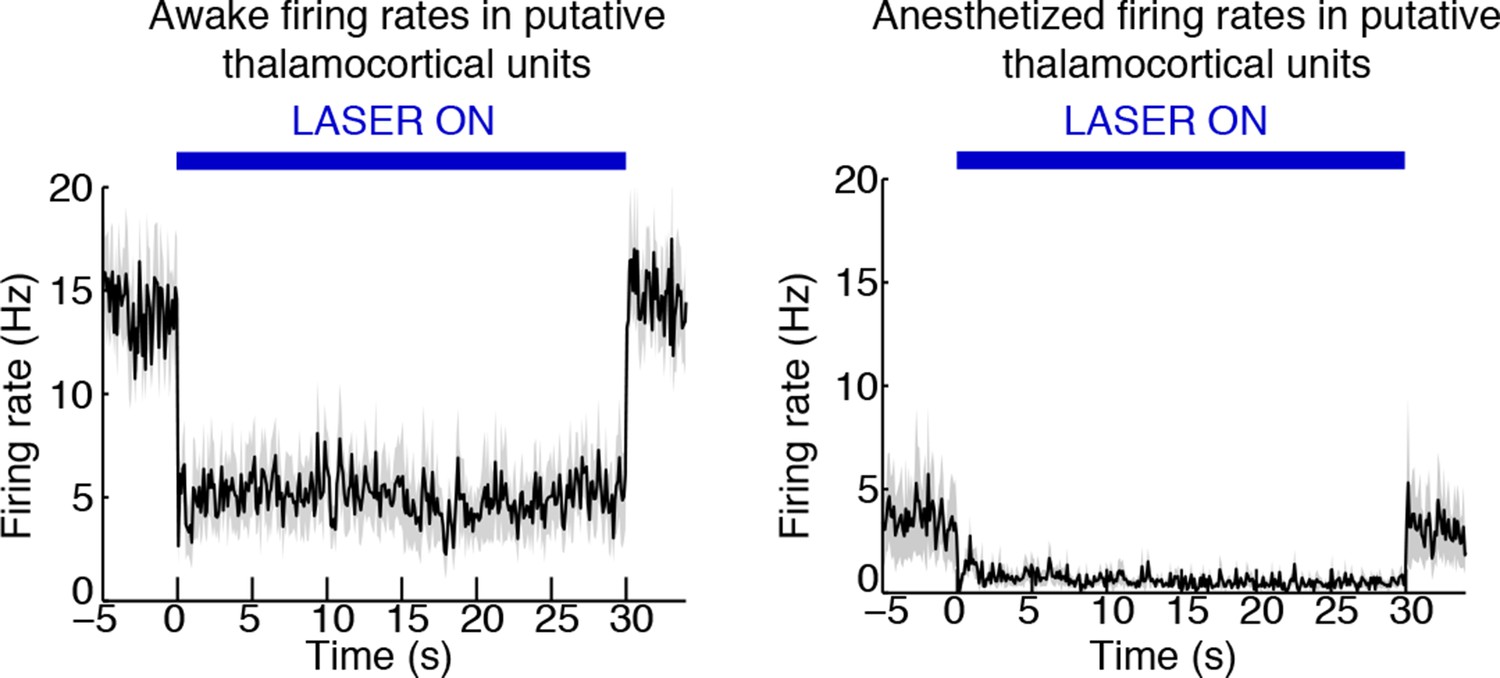
TRN stimulation deepens thalamic neuronal suppression during isoflurane anesthesia.
Putative thalamic units in the awake mouse are inhibited during TRN stimulation. Putative thalamic units in the anesthetized mouse have a baseline firing rate slightly lower than the awake, TRN-stimulated mouse. TRN stimulation induces an even larger suppression of thalamic activity.
Videos
Video 1
Laser stimulation in a mouse expressing NpHR during NREM sleep.
The mouse maintains NREM sleep during the stimulation and the light alone does not cause visible behavioural changes.
Download links
A two-part list of links to download the article, or parts of the article, in various formats.
Downloads (link to download the article as PDF)
Open citations (links to open the citations from this article in various online reference manager services)
Cite this article (links to download the citations from this article in formats compatible with various reference manager tools)
Thalamic reticular nucleus induces fast and local modulation of arousal state
eLife 4:e08760.
https://doi.org/10.7554/eLife.08760


