An oxygen-insensitive Hif-3α isoform inhibits Wnt signaling by destabilizing the nuclear β-catenin complex
- University of Michigan, United States
- Ocean University of China, China
Figures
Figure 1 with 1 supplement
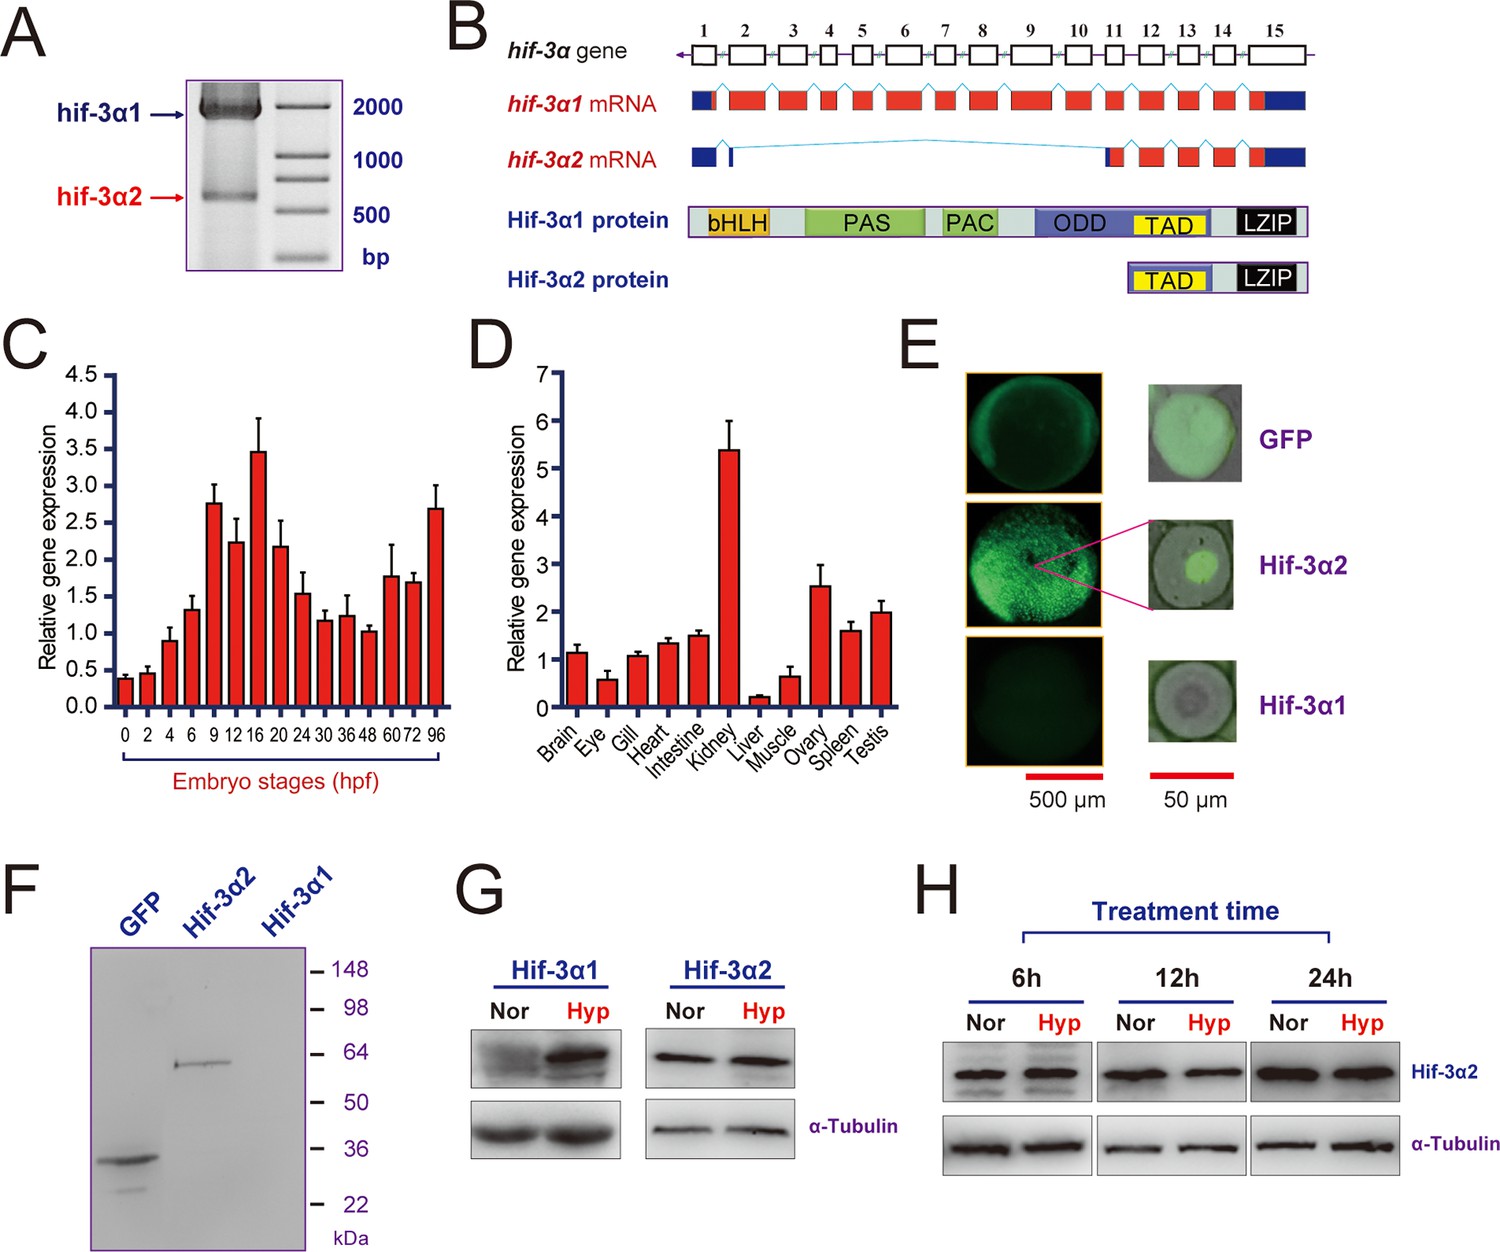
Hif-3α2 is an oxygen-insensitive Hif-3α isoform resulting from alternative splicing.
(A) Hif-3α isoform 1 (Hif-3α1) and isoform 2 (Hif-3α2) mRNA expression. RNA isolated from zebrafish embryos was analyzed by RT-PCR. (B) Schematic illustration of the hif-3α gene (top), Hif-3α1 and Hif-3α2 mRNAs (middle), and proteins (bottom). (C,D) Hif-3α2 expression in early development (C) and in adult tissues (D). The Hif-3α2 mRNA levels were measured by qRT-PCR and normalized by β-actin levels. Values are means +S.E. (n = 3). (E,F) Hif-3α1-EGFP but not Hif-3α2-EGFP is degraded under normoxia in vivo. Capped mRNA encoding EGFP, Hif-3α1-EGFP, and Hif-3α2-EGFP was injected into zebrafish embryos. The embryos were raised to 6 hpf under normoxia and observed under fluorescence microscopy (E) or analyzed by Western blotting using an anti-GFP antibody (F). (G) 6-hpf wild-type embryos were transferred to hypoxic (Hyp) or normoxic water (Nor) for 24 hr and analyzed by Western blotting using a specific Hif-3α antibody. (H) Adult fish were subjected to hypoxia treatments for the indicated time period and analyzed by Western blotting.
Figure 1—figure supplement 1
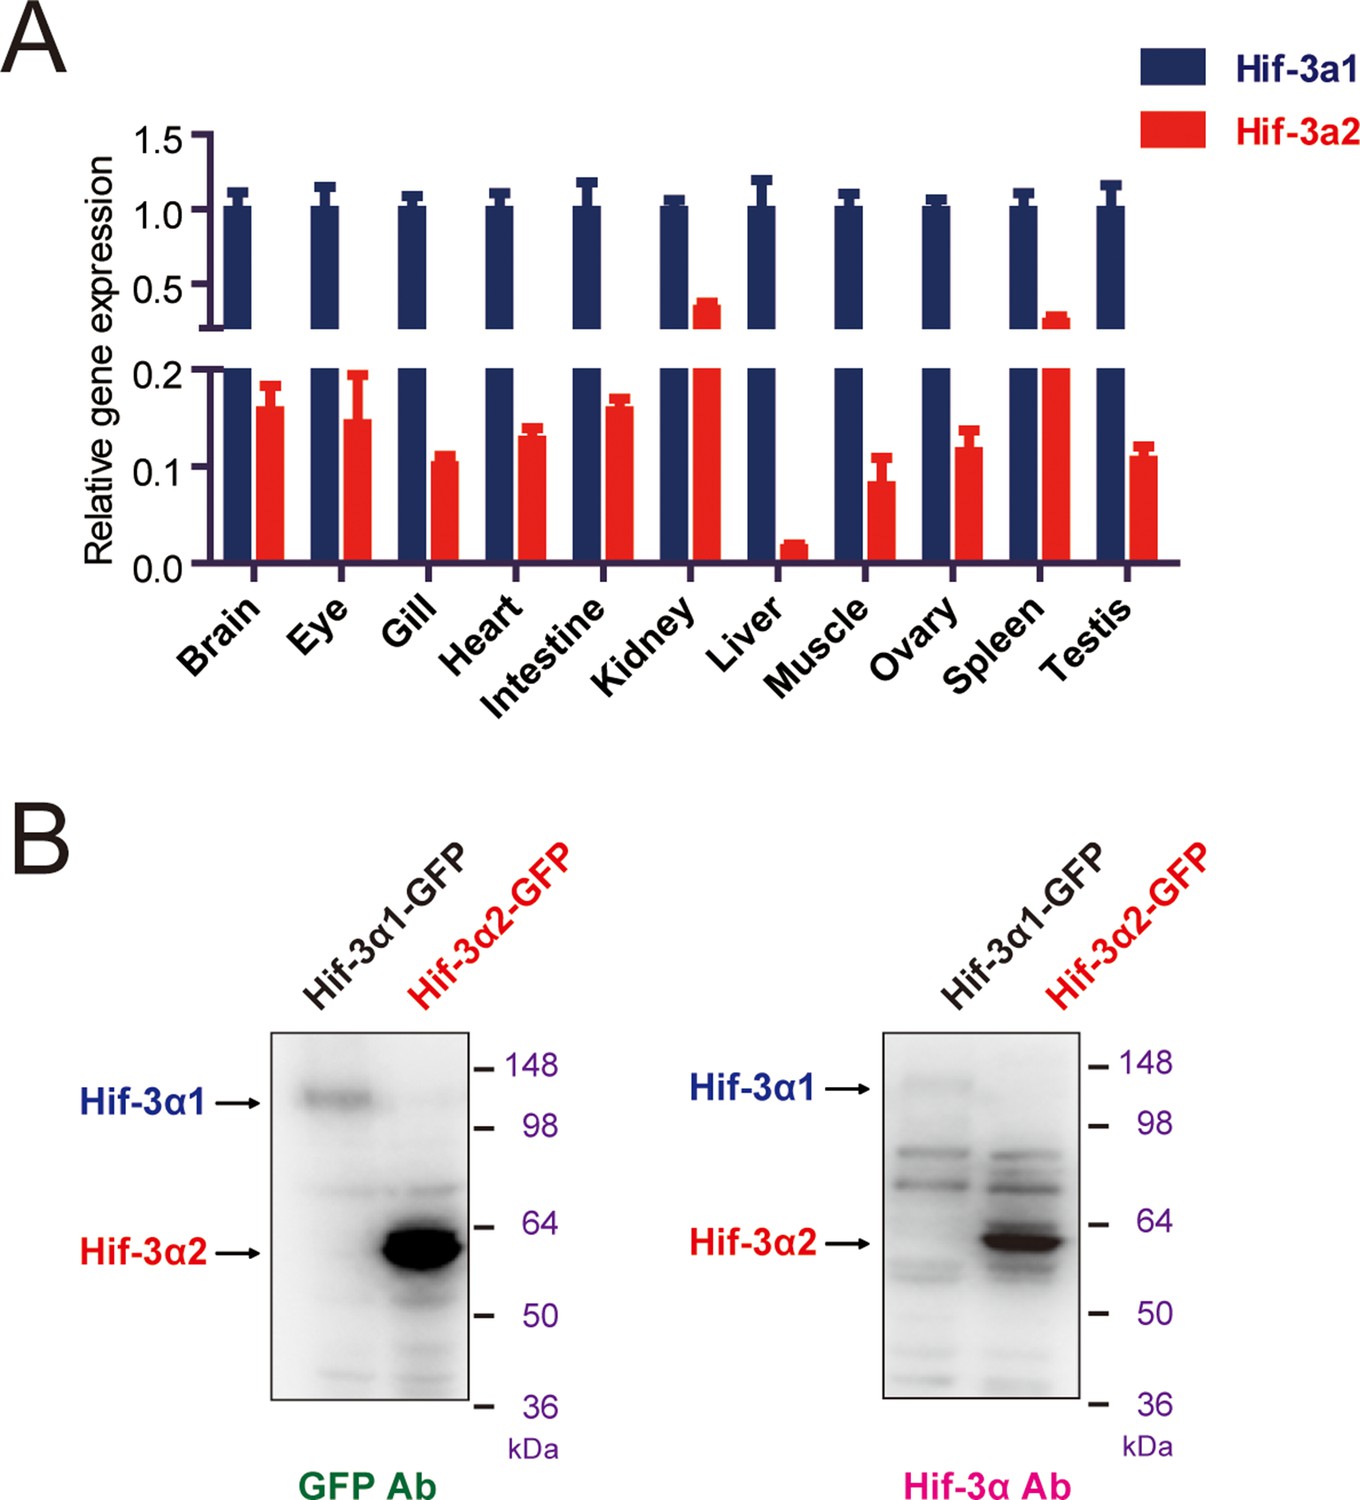
Hif-3α mRNA expression in adult and antibody validation.
(A) Relative Hif-3α1 and Hif-3α2 mRNA levels in the indicated adult tissues. (B) The Hif-3α antibody recognizes both Hif-3α1 and Hif-3α2. HEK293T cells were transfected with pCS2-Hif-3α1-EGFP or pCS2-Hif-3α2-EGFP. Twenty-four hours after the transfection, cells were lysed and subjected to Western blotting analysis using a GFP antibody (left) or the Hif-3α antibody (right). Note: The Hif-3α1-EGFP levels were much lower due to its oxygen-dependent degradation.
Figure 2 with 1 supplement
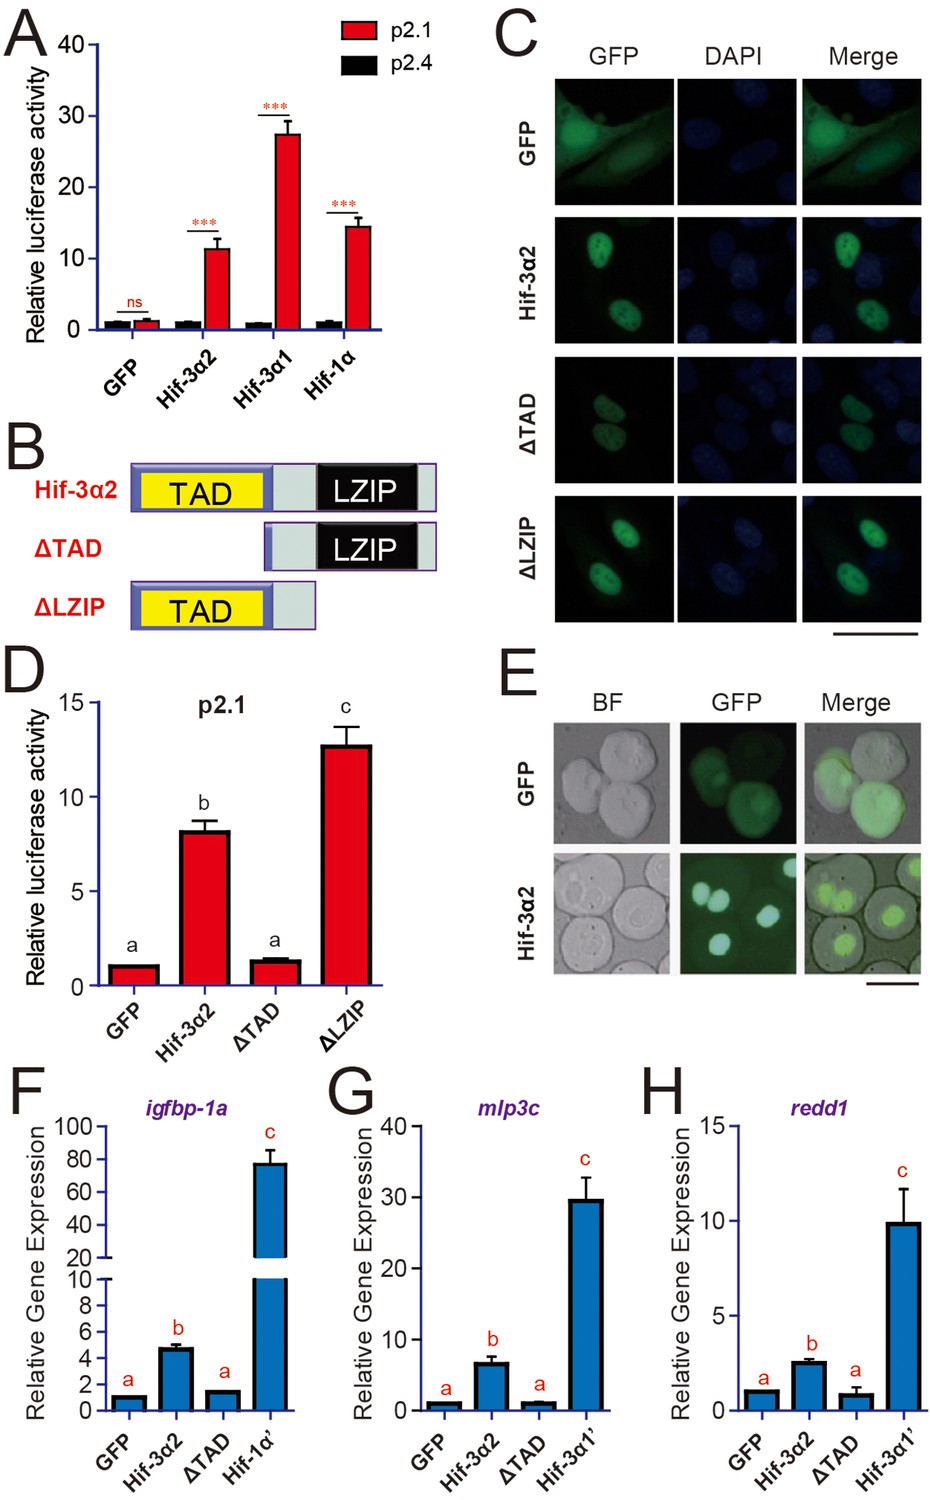
Hif-3α2 is a nuclear protein and has HRE-dependent transcriptional activity.
(A) HRE-dependent transcriptional activity. HEK293 cells were transfected with the indicated plasmid together with 100 ng p2.1 (red) or p2.4 plasmid (black). The results are normalized and expressed as fold change over the GFP p2.4 group. Values are means + S.E. (n = 3). ***p < 0.001. (B) Schematic diagram of the Hif-3α2 truncation mutants tested. (C) U2OS cells were transfected with the constructs shown in (B). The GFP signal was visualized 24 hr after transfection (left panels). Cells were counterstained with DAPI (middle panels). Merged views are shown in the right panels. Scale bar = 50 μm. (D) HRE-dependent transcriptional activity of Hif-3α2 mutants. Values are means + S.E. (n = 3). Groups labeled with different letters are significantly different from each other (P < 0.05). (E) Nuclear localization of Hif-3α2-EGFP in zebrafish embryo cells. Embryos injected with EGFP (600 pg) or Hif-3α2-EGFP capped mRNA (600 pg) were raised to 6 hpf under normoxia. The cells were dispersed and observed under bright field (BF) and GFP fluorescence microscopy. Scale bar = 50 μm. (F–H) Effects of Hif-3α2 (600 pg), Hif-3α1’ (stabilized Hif-3α1, 800 pg), and Hif-1α’ (stabilized Hif-1α, 800 pg) on endogenous gene expression. Embryos injected with the indicated capped mRNA were raised to 12 hpf under normoxia. The mRNA levels of the indicated genes were determined by qRT-PCR and normalized by the β-actin levels. Values are means + S.E. (n = 3). Groups labeled with different letters are significantly different from each other (P < 0.05).
Figure 2—figure supplement 1

Hif-3α2's transcriptional activity differs from that of Hif-1α and Hif-3α1.
(A) Western blotting results showing the successful expression of Hif-3α2 and its mutants. (B) HeLa cells were transfected with the indicated plasmid together with 100 ng p2.1 (red) or p2.4 (black). The results are normalized and expressed as fold changes over the GFP p2.4 group. n = 3. ***p < 0.001, ns, not significant. (C–E) Embryos injected with the indicated capped mRNA were raised to 12 hpf under normoxia. The mRNA levels of vegfAb (C), zp3v2 (D), and sqrdl (E) mRNA were determined and presented as described in Figure 2.
Figure 3 with 1 supplement
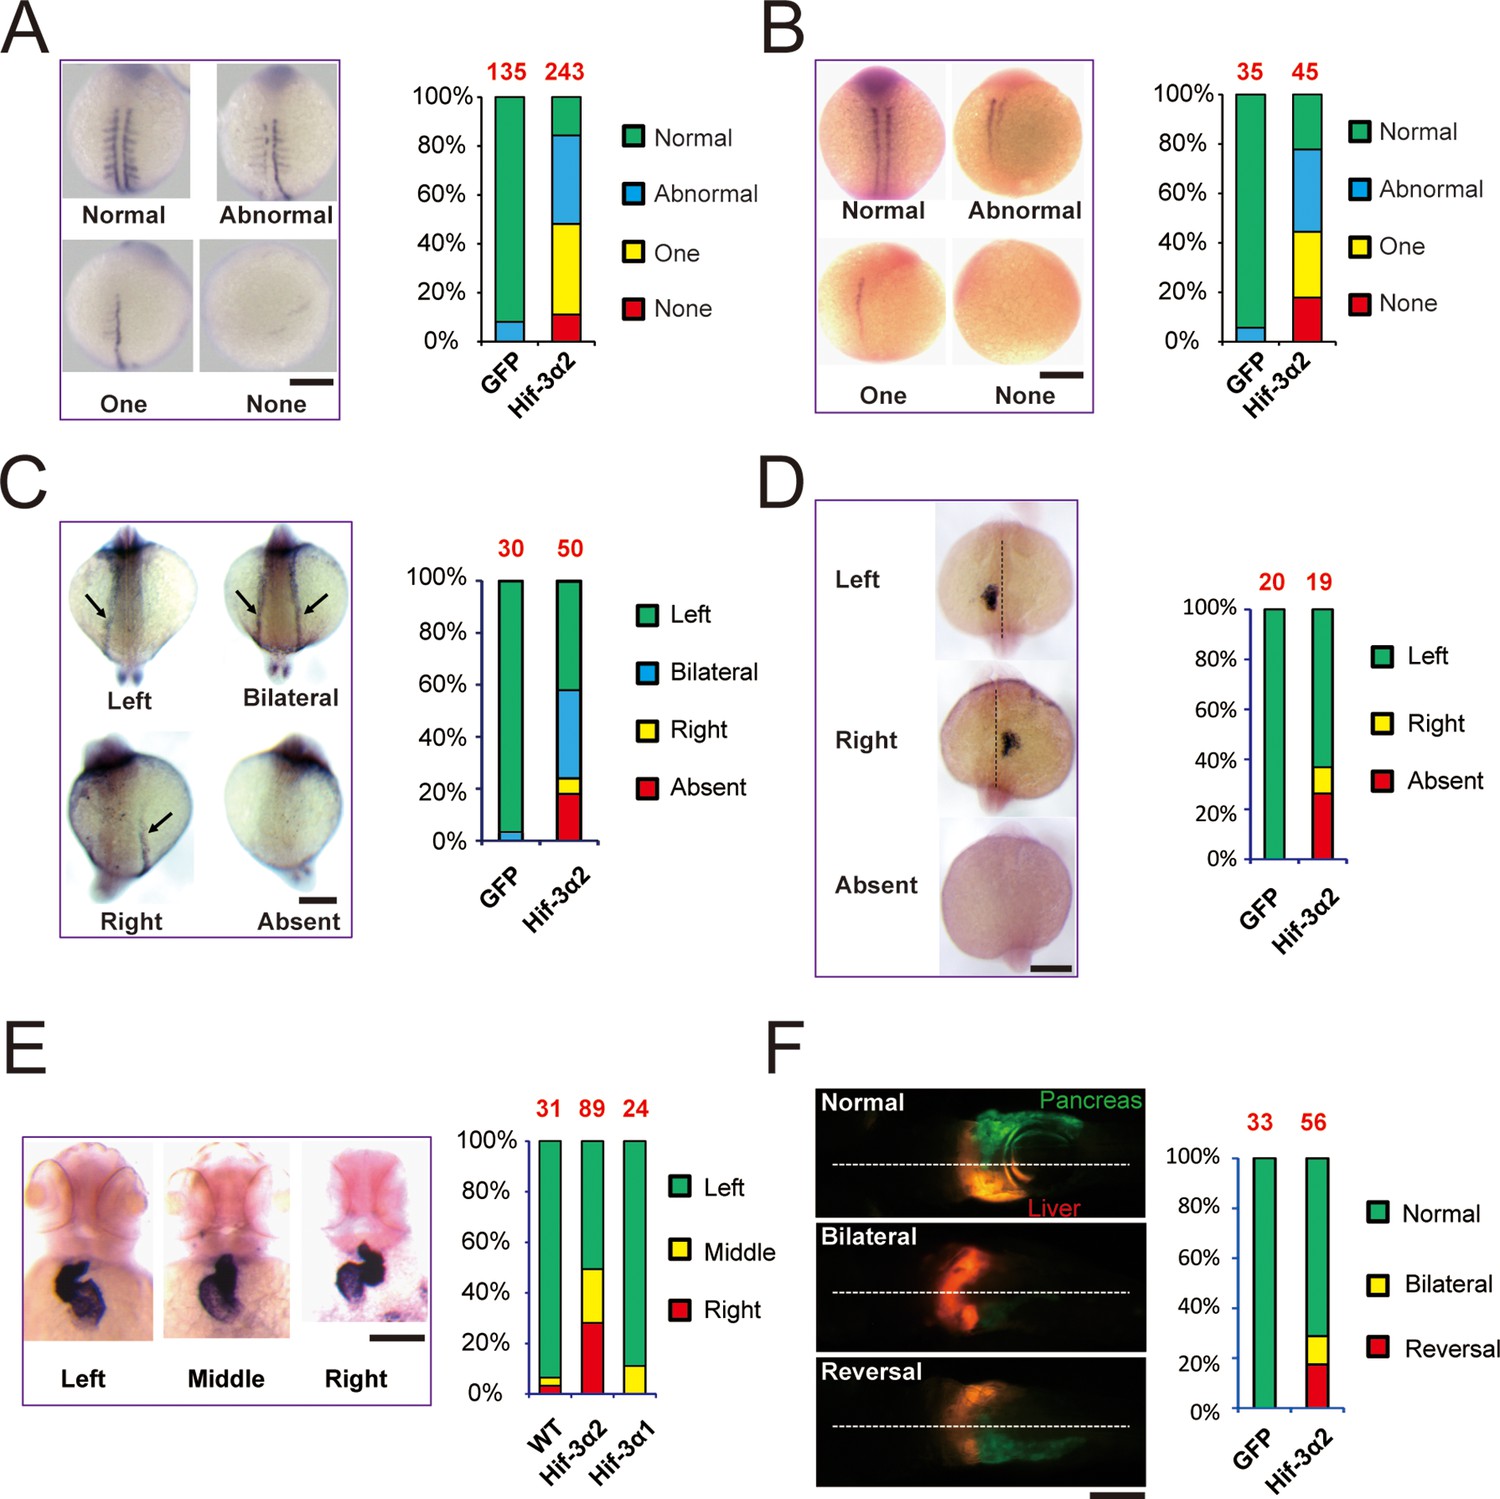
Forced expression of Hif-3α2 causes LR asymmetry defects.
Embryos injected with GFP or Hif-3α2 capped mRNA (600 pg) were raised and analyzed by in situ hybridization. (A,B) Somite development was visualized by myod1 (A) and myog (B) mRNA expression at 12–14 hpf. The embryos were scored based on the criteria shown in the left panel. The quantification results are shown in the right. The total embryo number is shown on the top of each column. (C) Altered expression of spaw (C) mRNA at 18 hpf and lft2 mRNA (D) at 20 hpf. (E) The cardiac tube looping was visualized by cmlc2 mRNA expression at 48 hpf. Representative views are shown in the left panel. The quantification results are shown in the right panel. Hif-3α1 (stabilized Hif-3α1, 800 pg) injected embryos were used as controls. (F) Changes in liver and pancreas location. Hif-3α2 capped mRNA was injected into LiPan transgenic embryos. Liver (red) and pancreas (green) location was examined at 96 hpf.
Figure 3—figure supplement 1
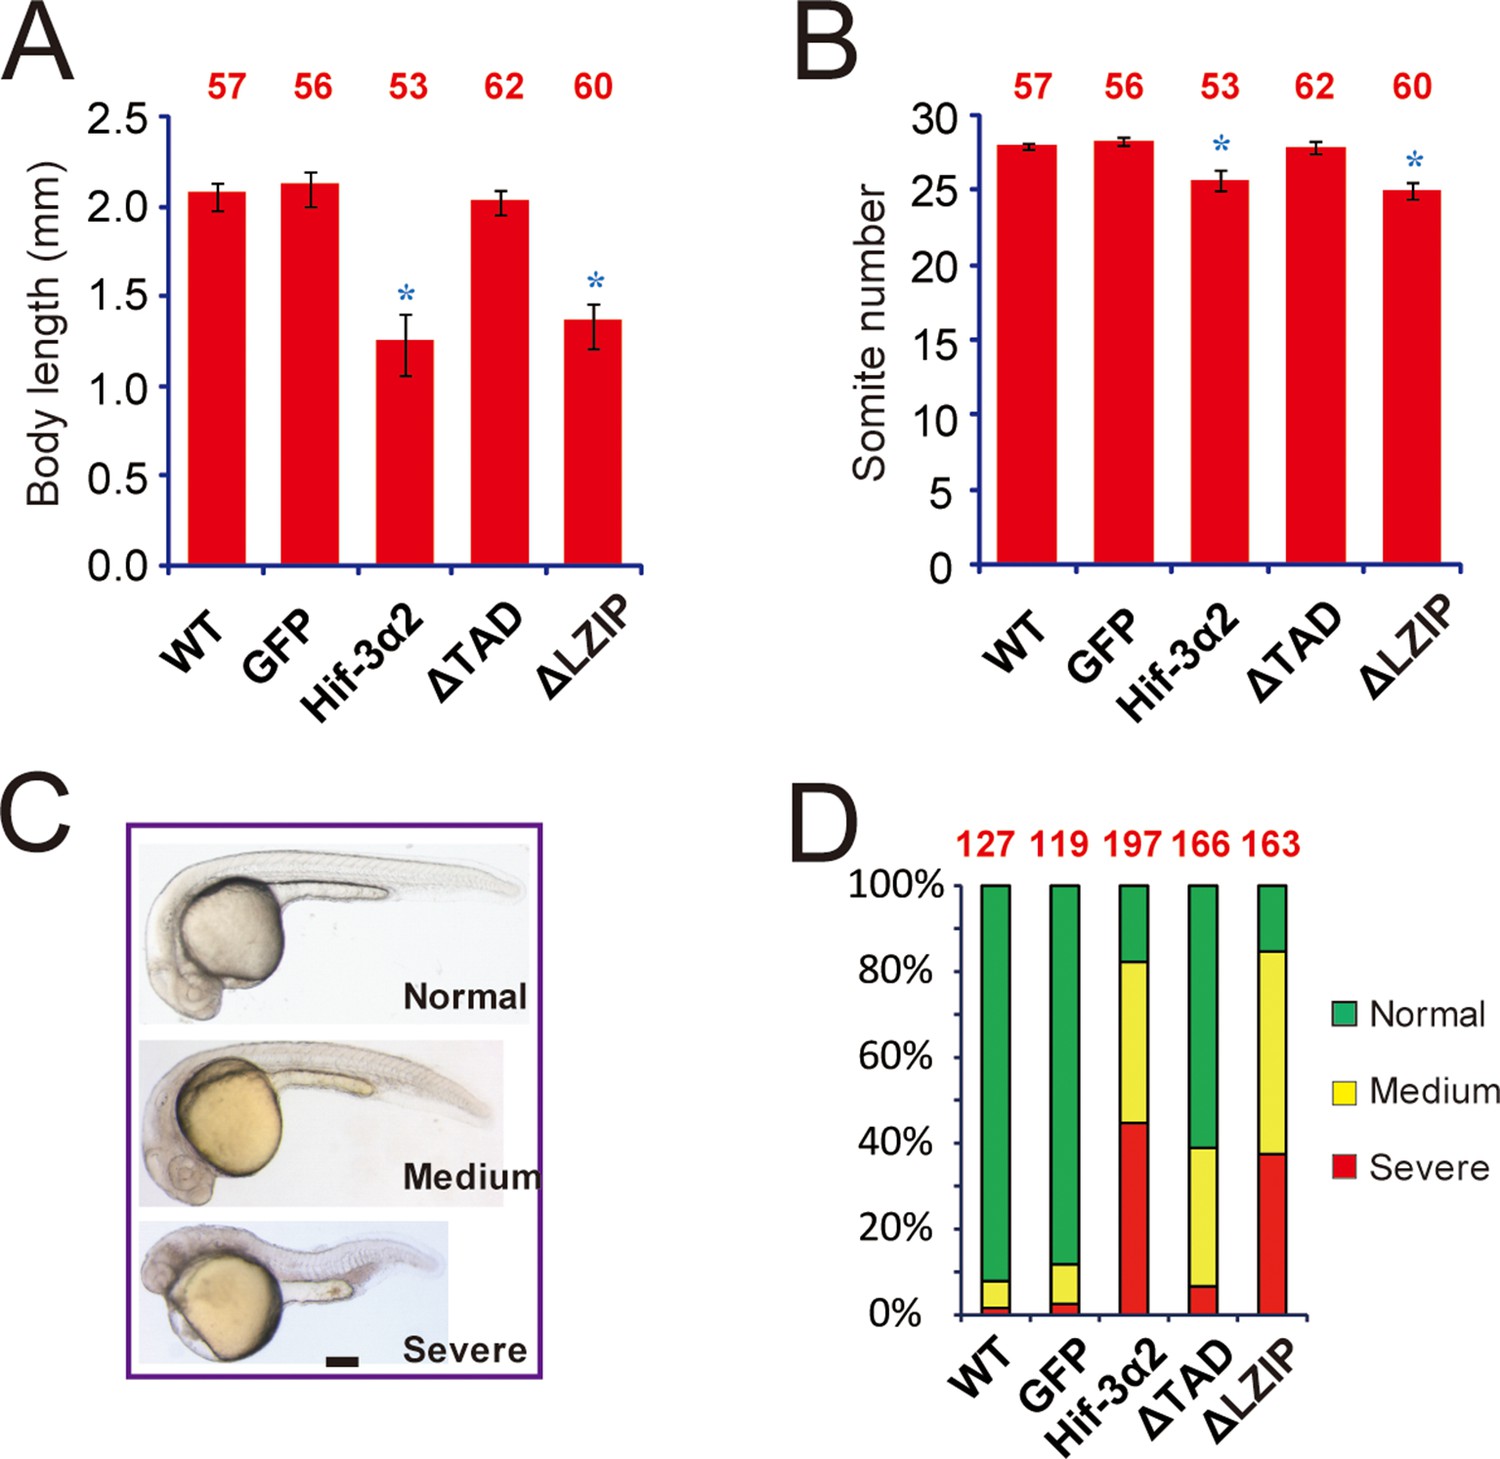
Forced expression of Hif-3α2 slows down embryonic growth and developmental timing and causes morphological abnormality.
Body length (A) and somite number (B) of the embryos injected with the indicated capped mRNA (600 pg) were measured at 24 hpf and are shown. The total embryo number is shown at the top of each column. (C,D) Embryos were scored based on the morphological criteria shown in (C). The percentage of embryos in each category is shown in (D). The total number of embryos analyzed is shown at the top of each column.
Figure 4 with 2 supplements
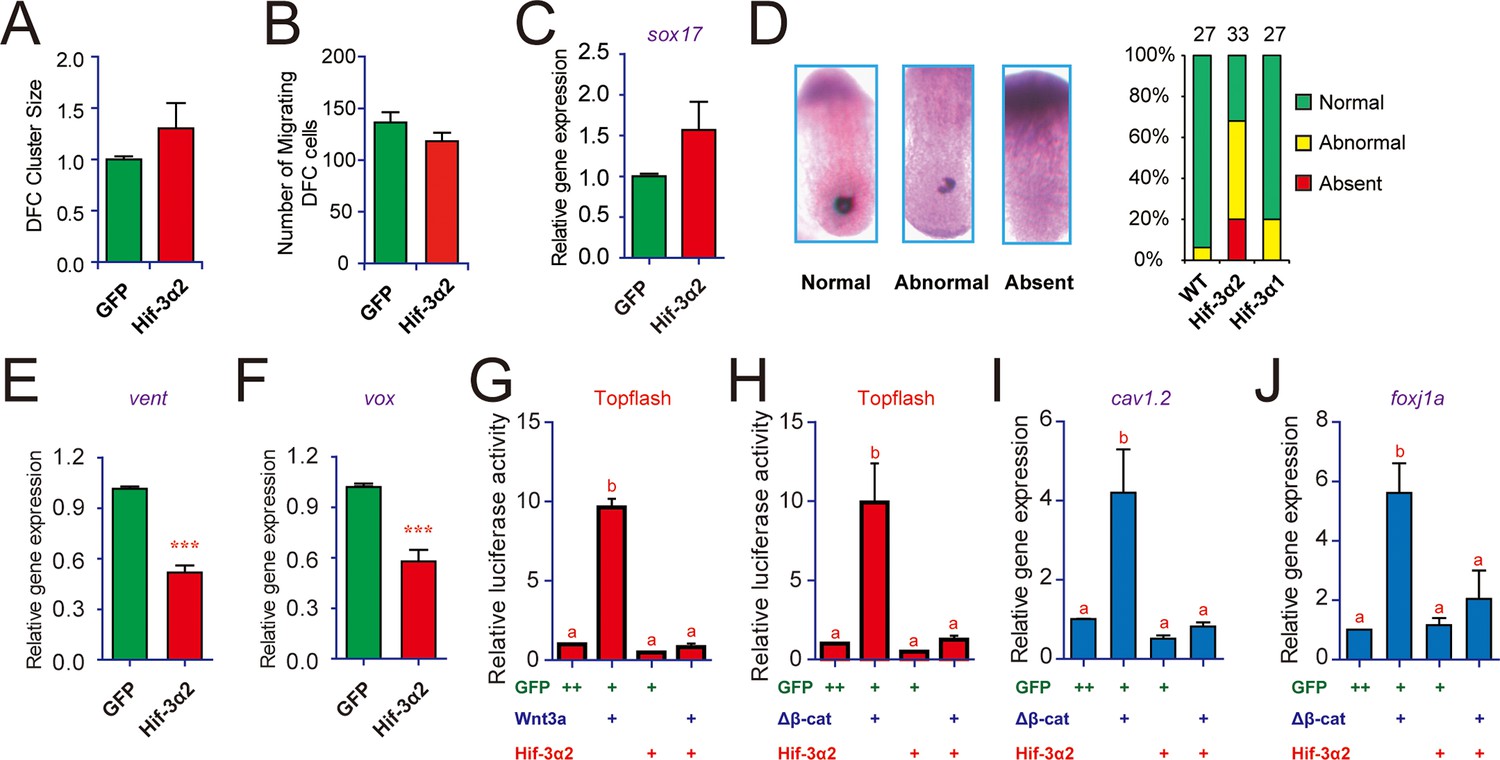
Forced expression of Hif-3α2 impairs Kupffer's vesicle (KV) development and inhibits Wnt/β-catenin signaling.
(A,B) Lack of effect on dorsal forerunner cell (DFC) development. The DFC cluster size (A) was determined by measuring sox17 mRNA expression domain in the Hif-3α2 mRNA injected embryos at 8 hpf (n = 22) using ImageJ. The values were normalized by those of the GFP mRNA injected embryos (n = 19). The number of migrating DFCs were quantified and shown in (B). (C) The sox17 mRNA levels were determined by qRT-PCR and normalized by the β-actin levels. Values are means +S.E. (n = 3). No significant difference is detected. (D) Effects on KV development. KV was visualized by charon mRNA expression at 12 hpf. The embryos were scored based on the criteria shown in the left panel. The quantification results are shown in the right. (E,F) Effects on Wnt target gene expression. Embryos injected with the indicated mRNA were raised to 9 hpf and vent (E) and vox (F) mRNA levels were determined by qRT-PCR and normalized to the β-actin levels. Values are means + S.E. (n = 3). ***p < 0.001. (G,H) Inhibition of Wnt3a (G) and β-cateninΔN (H) activity. Embryos injected with Topflash plasmid DNA (90 pg) together with the 30 pg Wnt3a or 100 pg β-cateninΔN and 600 pg Hif-3α2 capped mRNA were raised to 9 hpf and luciferase activity was measured. Values are means + S.E. (n = 3). Groups labeled with different letters are significantly different from each other (P < 0.05). (I,J) Inhibition of β-cateninΔN-induced cav1.2 (I) and foxj1a (J) expression.qRT-PCR was performed and analyzed as described above.
Figure 4—figure supplement 1
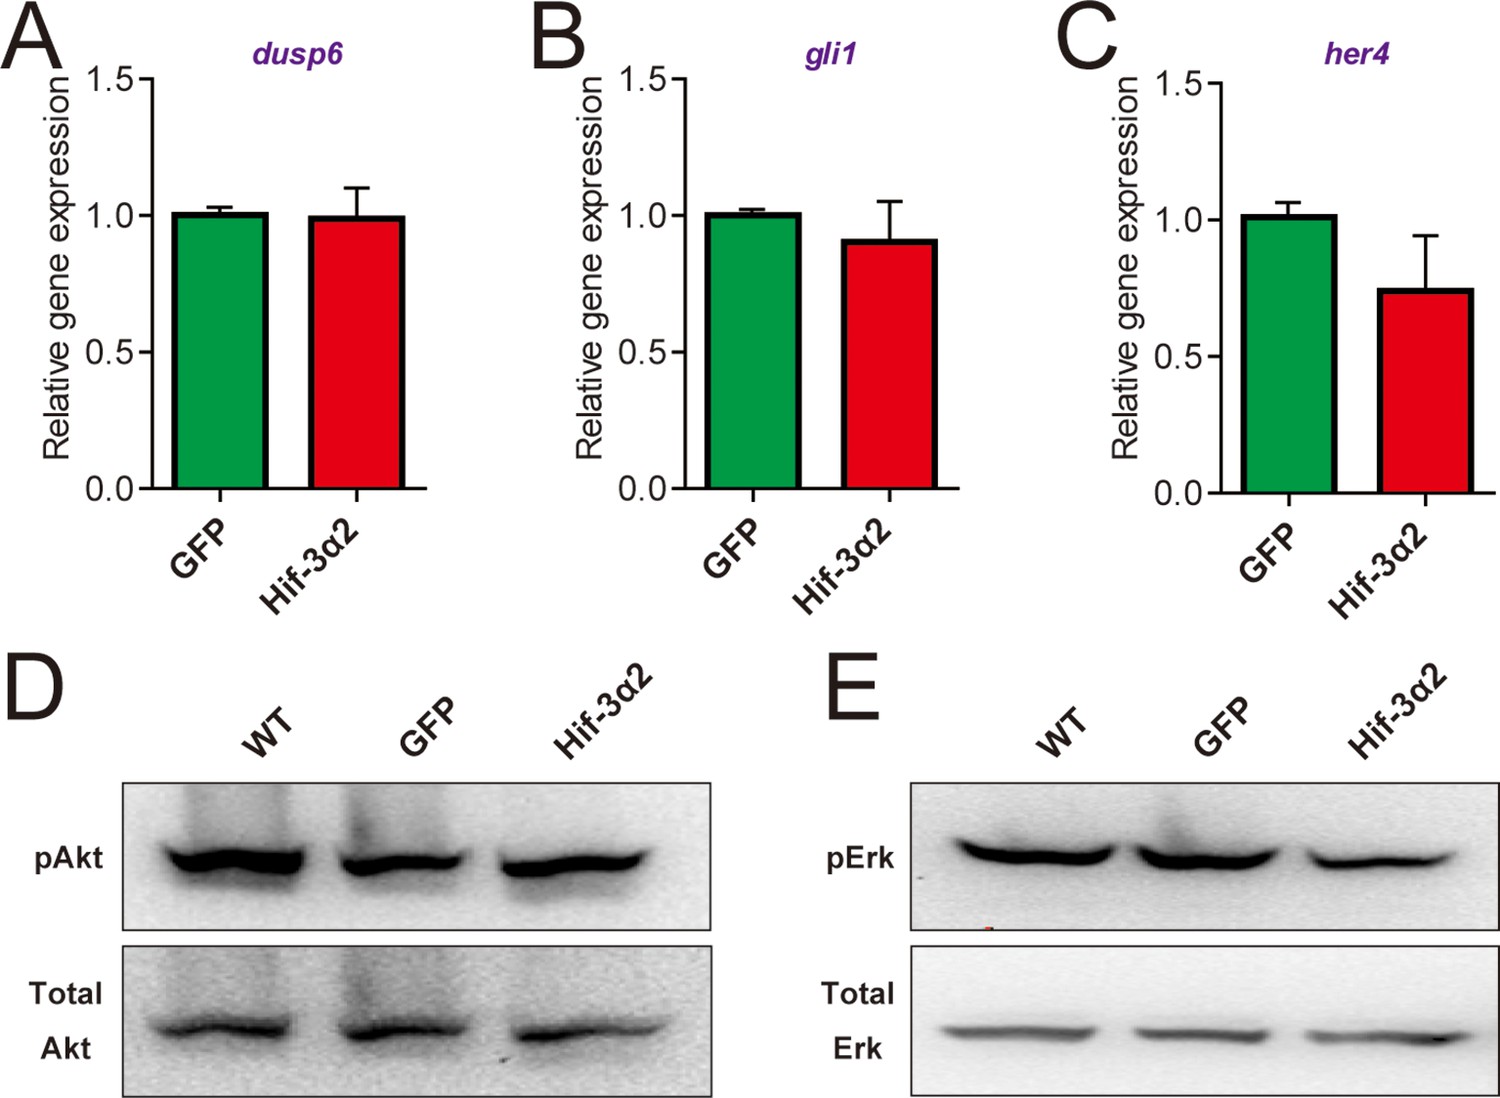
Forced expression of Hif-3α2 does not change Fgf, Hedgehog, Notch, Akt, and Erk signaling.
(A-C) Embryos injected with the indicated capped mRNA (600 pg) were raised to 12 hpf in normoxic water. The mRNA levels of the Fgf target gene dusp6 (A), Hedgehog target gene gli1 (B), and Notch target gene her4 (C) were determined by qRT-PCR and normalized by the β-actin levels. n = 3. (D,E). Some of the embryos were subjected to Western blotting using antibodies for phospho- and total Akt (D) and Erk (E).
Figure 4—figure supplement 2

Effects of Hif-3α2, Hif-3α1' (a stabilized Hif-3α1), and Hif-1α' (a stabilized Hif-1α) on Wnt3a- (A) and β-cateninΔN-induced (B) Topflash activity.
Embryos injected with 90 pg Topflash plasmid DNA together with the indicated capped mRNA (600 or 800 pg) were raised to 9 hpf in normoxic water and luciferase activity was measured. Values are means +S.E. (n = 3). *, **, and ***p < 0.05, 0.01 and 0.001. ns, not significant. (C) Hif-3α2 overexpression antagonizes Wnt3a and β-cateninΔN actions. Zebrafish embryos were injected with the indicated capped mRNA. They were raised and photographed at 12 hpf.
Figure 5 with 2 supplements
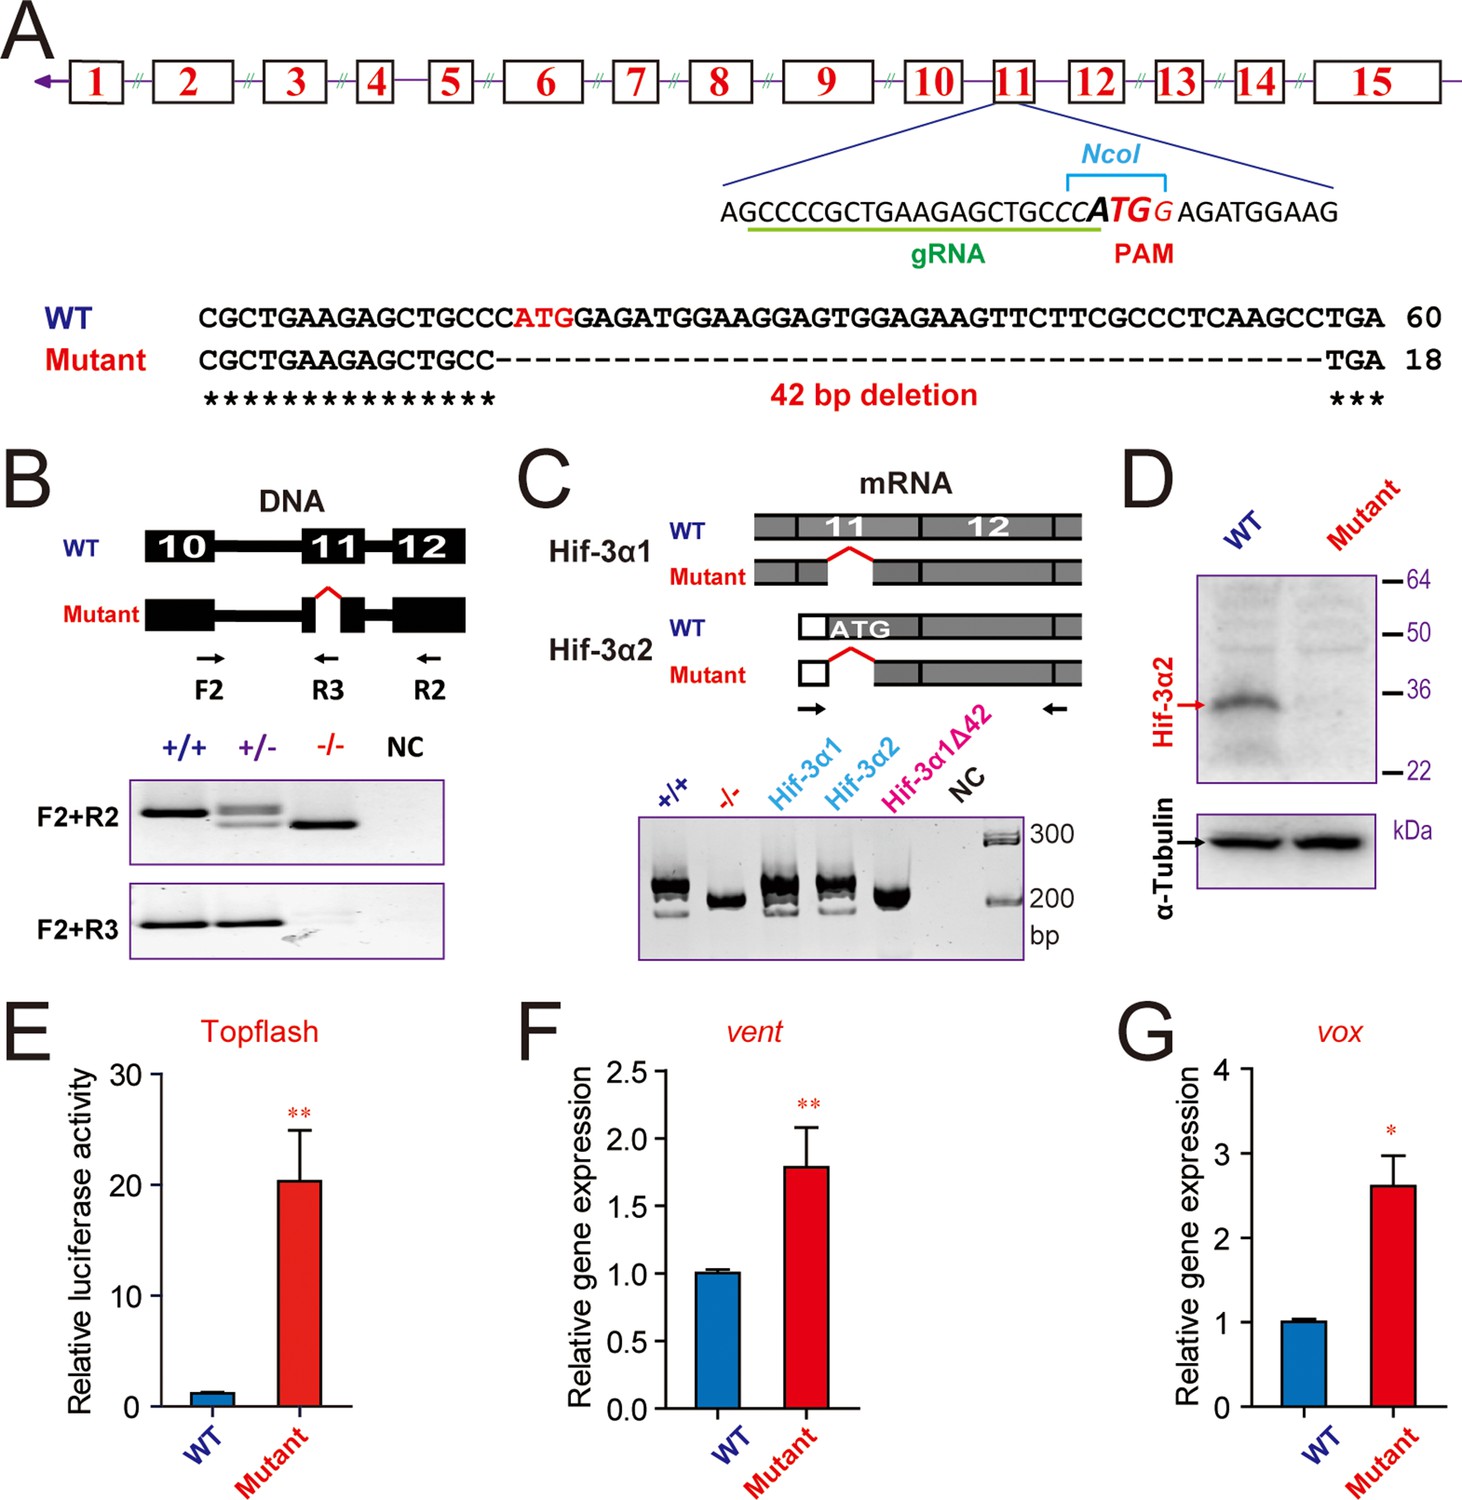
CRISPR/Cas9-mediated deletion of Hif-3α2 increases Wnt/β-catenin signaling.
(A) Top: Design of the gRNA used to target the Hif-3α2 ATG site (bold letters) in exon 11. The gRNA targeting sequence is underlined (green). The PAM motif is labeled in red, and the NcoI digestion site is indicated in italic letters. Bottom: Sequencing results of the hif-3α locus in the wild type and homozygous mutant fish. (B) Top: Location of the 42 bp deletion and PCR primers used for genotyping. Middle and Bottom: Genotyping results using two PCR-based assays. Water was used as negative control (NC). (C) The expression of Hif-3α1 mRNA expression is not affected. Top: PCR primers used for detecting Hif-3α2 and Hif-3α1 mRNAs. Bottom left panel: RT-PCR results. This primer set amplified Hif-3α2 and Hif-3α1 mRNAs in the wild type (+/+) and Hif-3α1 mRNA (albeit smaller size) in the hif-3αΔ42 mutant (-/-) embryos. Cloned Hif-3α1, Hif-3α2, and Hif-3α1Δ42 DNA were used as controls. (D) Western blotting results indicating the ablation of Hif-3α2 protein in the hif-3αΔ42 mutant embryos. 24 hpf hif-3αΔ42 mutant embryos and wild-type siblings were analyzed. (E) Elevated Wnt/β-catenin signaling activity. Wild-type and hif-3αΔ42 mutant embryos were injected with 90 pg Topflash plasmid DNA and luciferase activity was measured at 9 hpf. (F,G) The mRNA levels of vent (F) vox (G) were measured in mutant embryos at 9 hpf and presented as relative values to the wild type controls. Values are means +S.E. (n = 3). * and **p < 0.05 and 0.01.
Figure 5—figure supplement 1
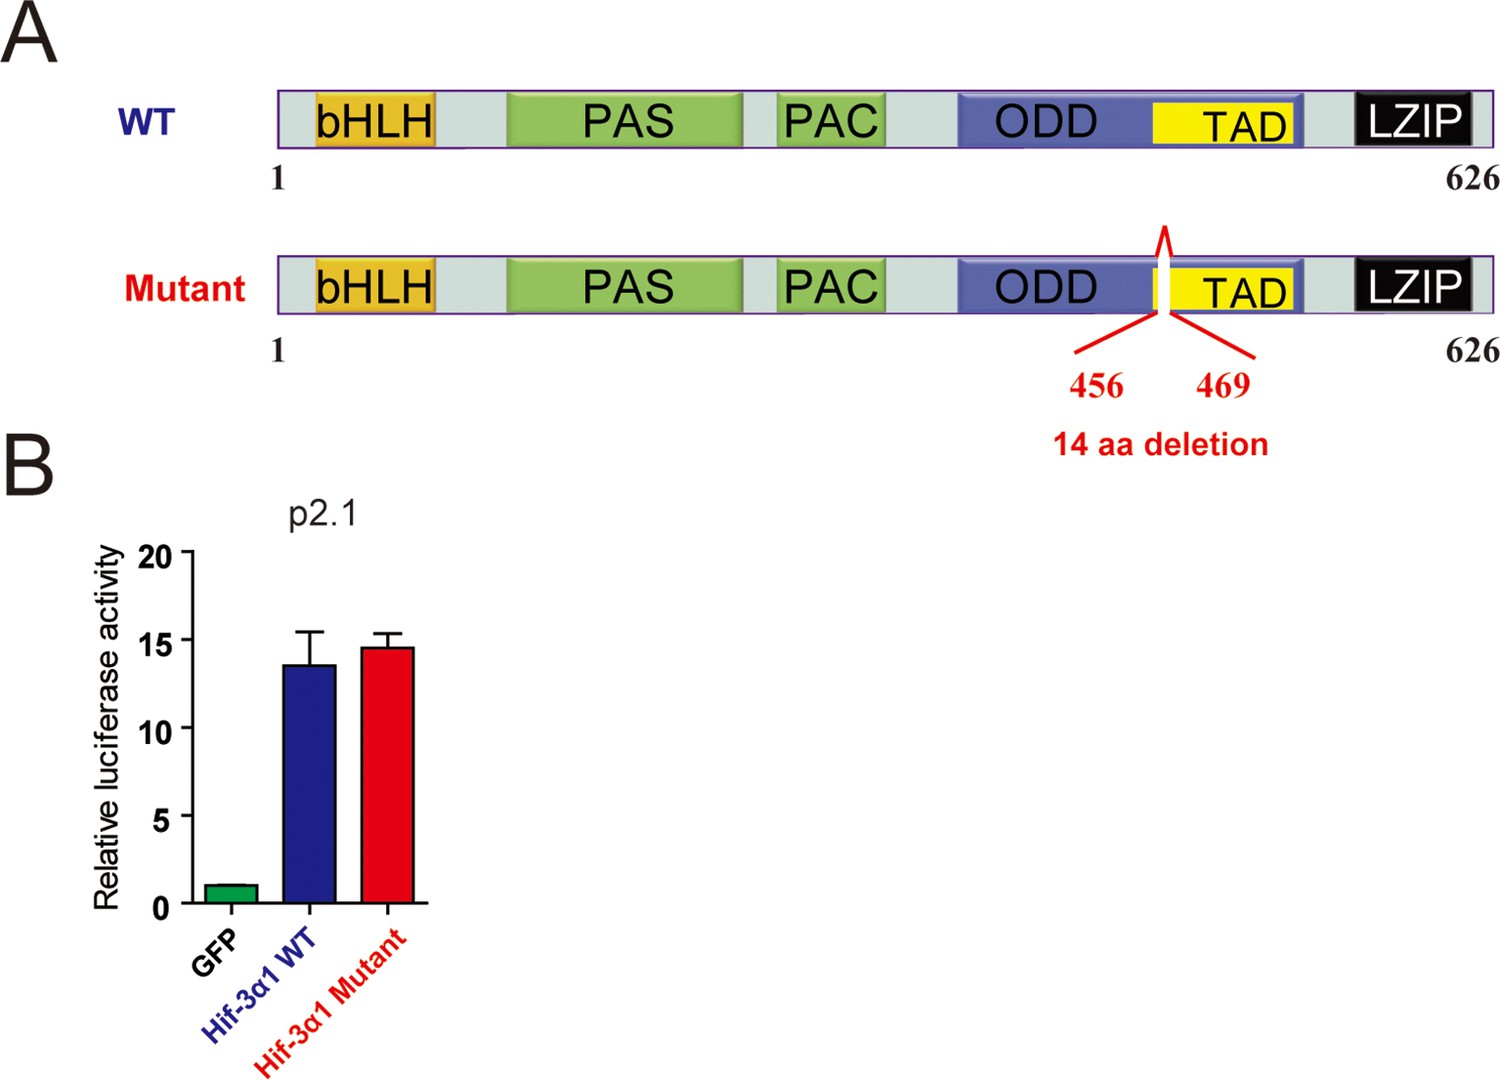
The 14-amino acid deletion does not alter HIF-3α1 transcriptional activity.
(A) hif-3αΔ42 mutation results in a 14 amino acid deletion in Hif-3α1. The Hif-3α1 cDNA was cloned from hif-3αΔ42 mutant embryos and sequenced. The location of the deletion is shown. (B) HEK293 cells were transfected with the indicated plasmid together with p2.1. The results are normalized and expressed as fold change over the GFP group. No significant difference was detected.
Figure 5—figure supplement 2
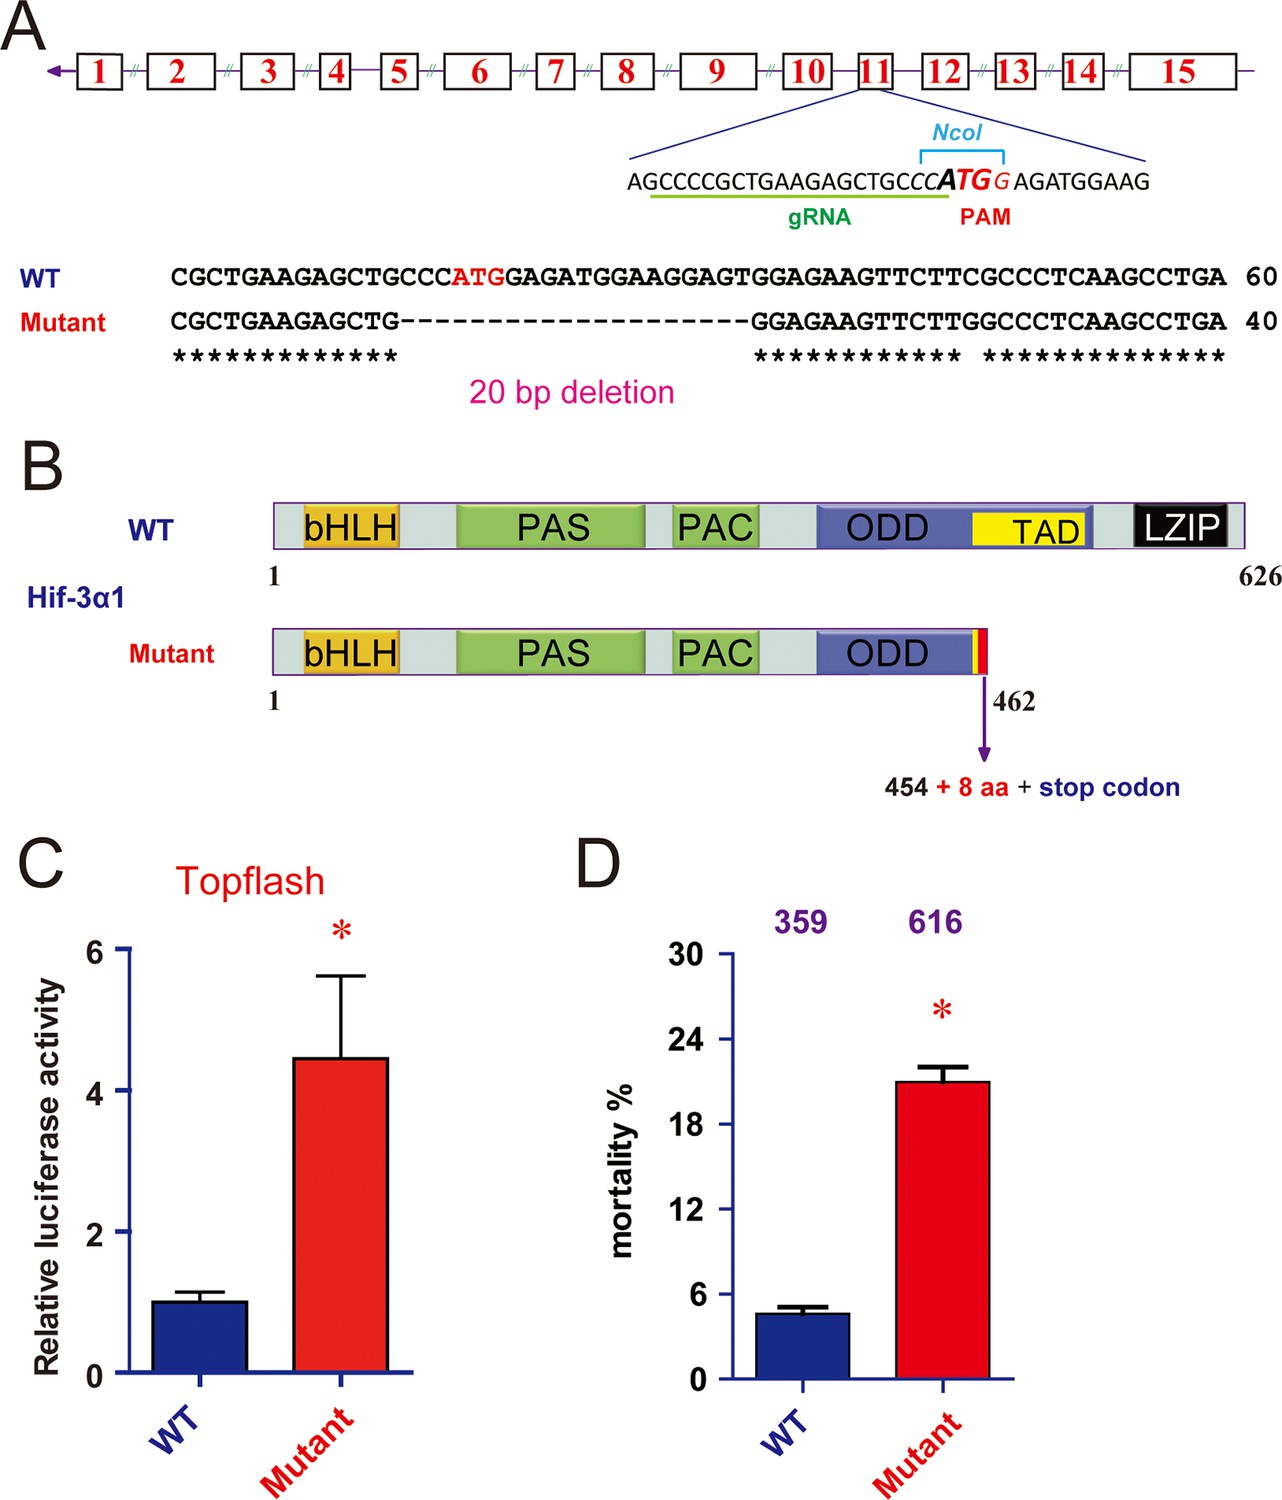
CRISPR/Cas9-mediated mutation of Hif-3α1/2 increases Wnt/β-catenin signaling.
(A) Top: Design of the gRNA. Bottom: Sequencing results of the hif-3α locus in the wild type and homozygous mutant fish. (B) Hif-3α1Δ20 protein structure. (C) Wild-type and hif-3αΔ20 mutant embryos were injected with 90 pg Topflash plasmid DNA and luciferase activity was measured at 9 hpf. *p < 0.05. (D) Mortality of wild-type and hif-3αΔ20 mutant embryos. The number of dead embryo was determined at 9 hpf and is shown as percentage of total embryos. The total embryo number is shown on the top of each column.
Figure 6 with 1 supplement

Genetic deletion of Hif-3α2 increases embryo mortality and transient Wnt/β-catenin signaling phenotype.
(A) Increased embryo mortality. Wild-type and F3 homozygous hif-3αΔ42 mutant embryos were raised under normoxia. The number of dead embryo was determined at 9 hpf and is shown as percentage of total embryos. The total embryo number is shown on the top of each column. (B) Morphology of the surviving embryos at 24 hpf. The total embryo number is shown on the top of each column. (C,D) The cardiac tube looping (C) and somite development (D) were examined and quantified at 48 and 12–14 hpf. (E-H) Expression of flh and pax2.a mRNA in wide type and hif-3αΔ42 mutant embryos at 6 hpf (E,G) and 10 hpf (F,H). The frequency of embryos with the indicated expression patterns is shown at the bottom of each panel. Scale bar = 200 μm.
Figure 6—figure supplement 1
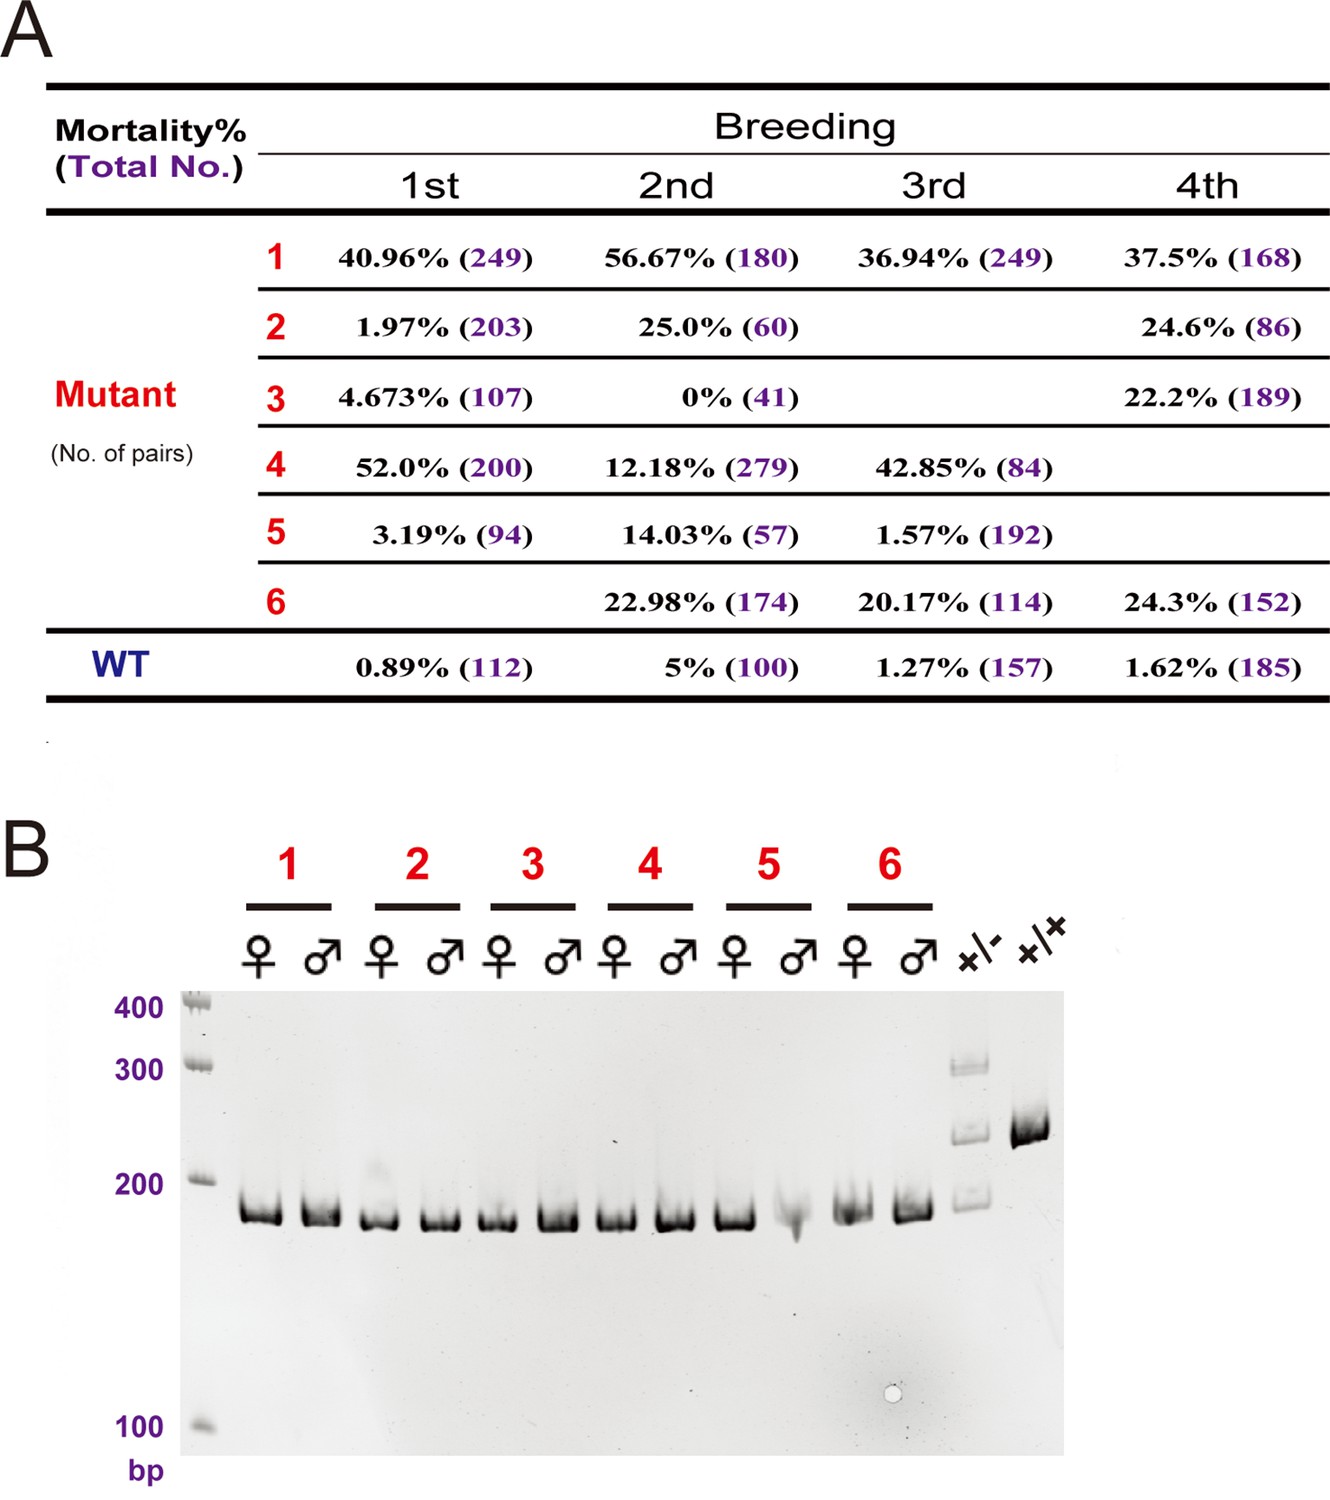
The hif-3αΔ42 line had higher mortality rate.
(A) Embryo mortality rates. Six pairs of hif-3αΔ42 mutant fish were bred 4 times and the number of embryos and the mortality rate (%) were determined at 9 hpf and are shown. (B) Genotyping results of the 6 pairs of mutant fish used in (A). Wild type (+/+) and heterozygous fish (+/-) were used as controls.
Figure 7 with 1 supplement
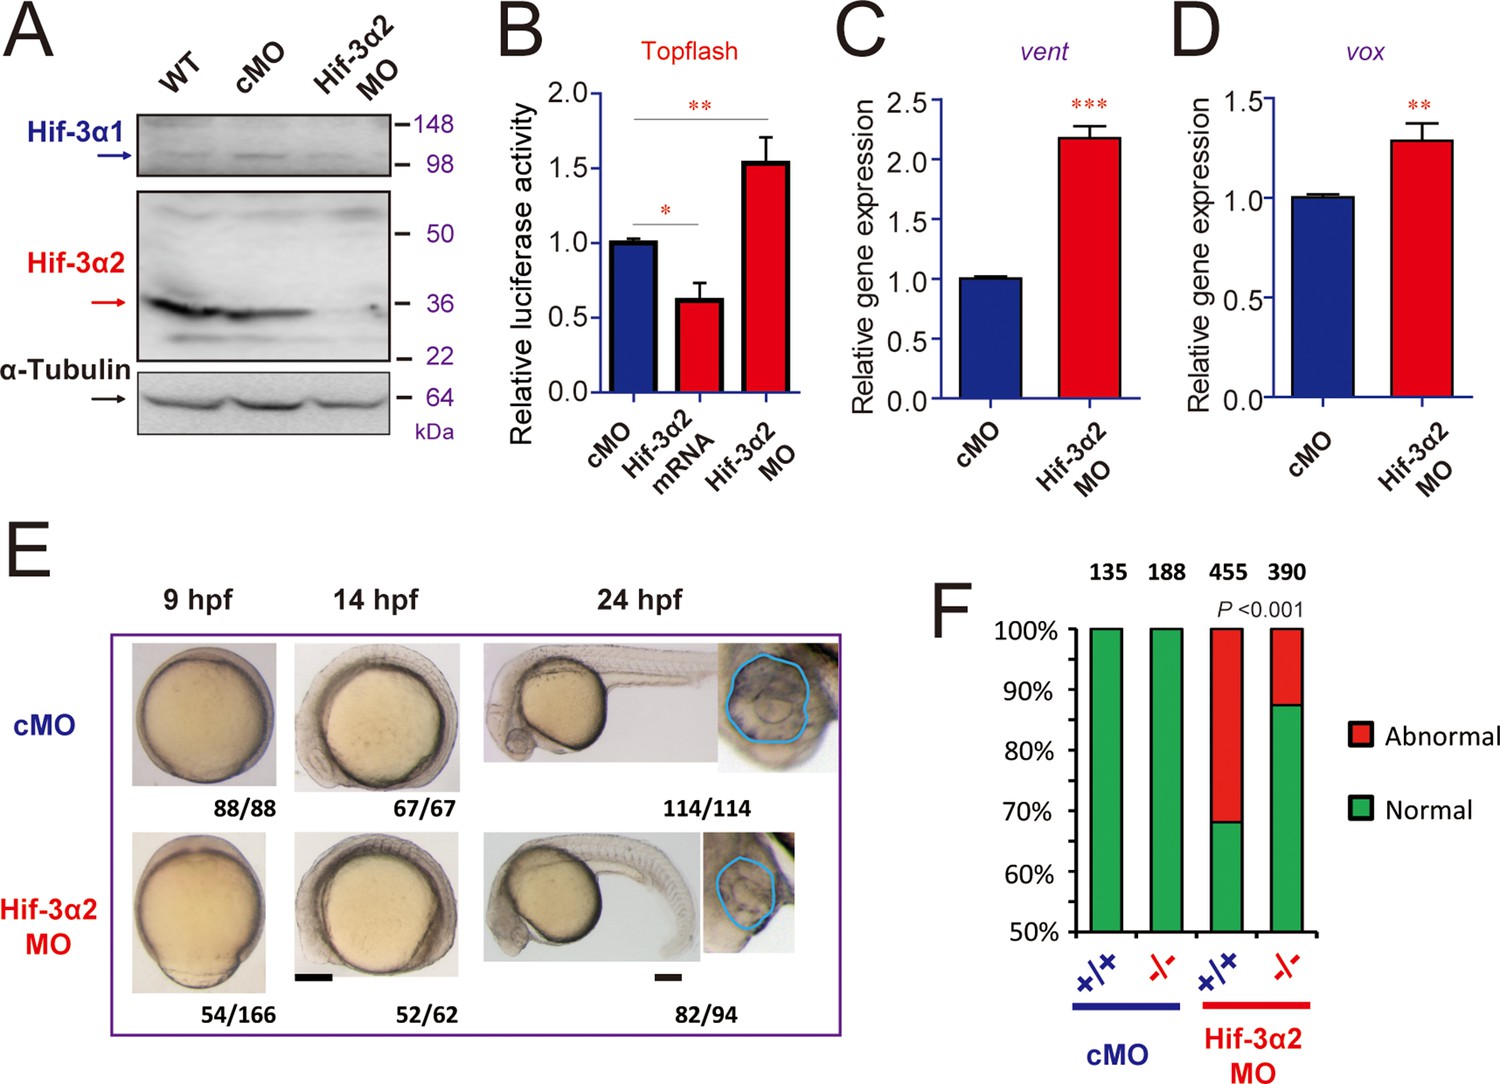
Hif-3α2 knockdown leads to Wnt/β-catenin signaling phenotypes.
(A) Wild type (WT), control MO (cMO), and Hif-3α2 targeting MO (Hif-3α2 MO)-injected embryos were raised to 24 hpf in normoxic water. They were lysed and subjected to Western blotting. (B) Wild-type embryos injected with Topflash plasmid DNA together with the indicated capped mRNA or MO were raised to 9 hpf and the luciferase activity was measured. Values are means + S.E. (n = 3). * and **p < 0.05 and 0.01. (C,D) Embryos injected with the indicated MOs were raised to 9 hpf and vent (C) and vox (D) mRNA levels were determined and presented as described above. (E) Phenotypes. The frequency of embryos with the indicated phenotypes is shown at the bottom of each panel. Scale bar = 200 μm. (F) hif-3αΔ42 mutant embryos are less sensitive to Hif-3α2 MO. Control MO or Hif-3α2 MO were injected into wild type (+/+) or F3 homozygous hif-3αΔ42 mutant embryos (-/-). The frequency of embryos with the abnormal phenotype (E) at 9 hpf was determined and shown. Total embryo number is shown on the top of each column. P value of Chi analysis is shown.
Figure 7—figure supplement 1

Hif-3α2 targeting MO design and verification.
(A) Design of the Hif-3α2 targeting MO. (B) Injection of Hif-3α2 MO does not alter Hif-3α1 mRNA expression. (C) Injection of Hif-3α2 MO does not significantly affect p53 mRNA expression at 3 ng per embryo but it does so at higher doses. p53 mRNA levels were measured in 24 hpf were determined and presented as described above. Values are means +S.E. (n = 3). Groups labeled with different letters are significantly different from each other (P < 0.05).
Figure 8
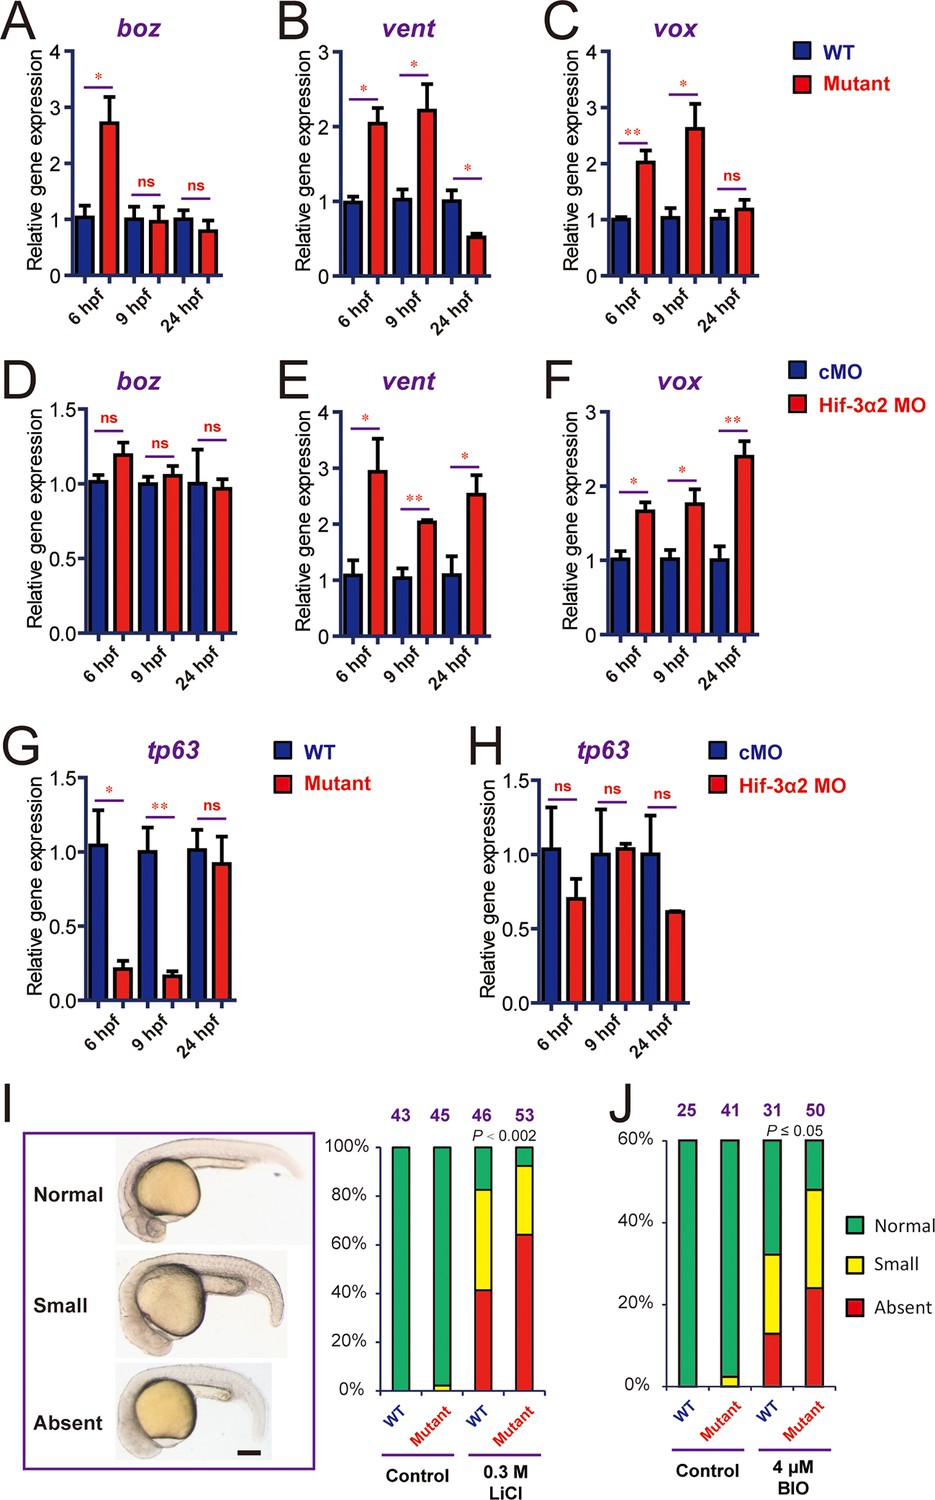
Genetic deletion but not knockdown of Hif-3α2 result in dynamic and compensatory changes in the expression of Wnt/β-catenin and BMP target genes.
(A-C) Expression of boz (A), vent (B), and vox (C) in hif-3αΔ42 mutant embryos at the indicated stages. (D-F) Expression of boz (D), vent (E), and vox (F) in morphants at the indicated stages. (G,H) Expression of tp63 in hif-3αΔ42 mutant embryos (G) and morphants (H) at the indicated stages. In all above, the mRNA levels of the indicated genes were measure and presented as described above. Values are means +S.E. (n = 3). * and **p < 0.05 and P < 0.01. (I,J) Treatment of wild type and hif-3αΔ42 mutant embryos with LiCl (0.3 mM) and BIO (4 μM) results in no eyes or small eyes phenotypes. Representative views are shown in the left panel and quantification results are shown in the right panel. The total embryo number is shown on the top. P value of Chi analysis is shown.
Figure 9 with 3 supplements
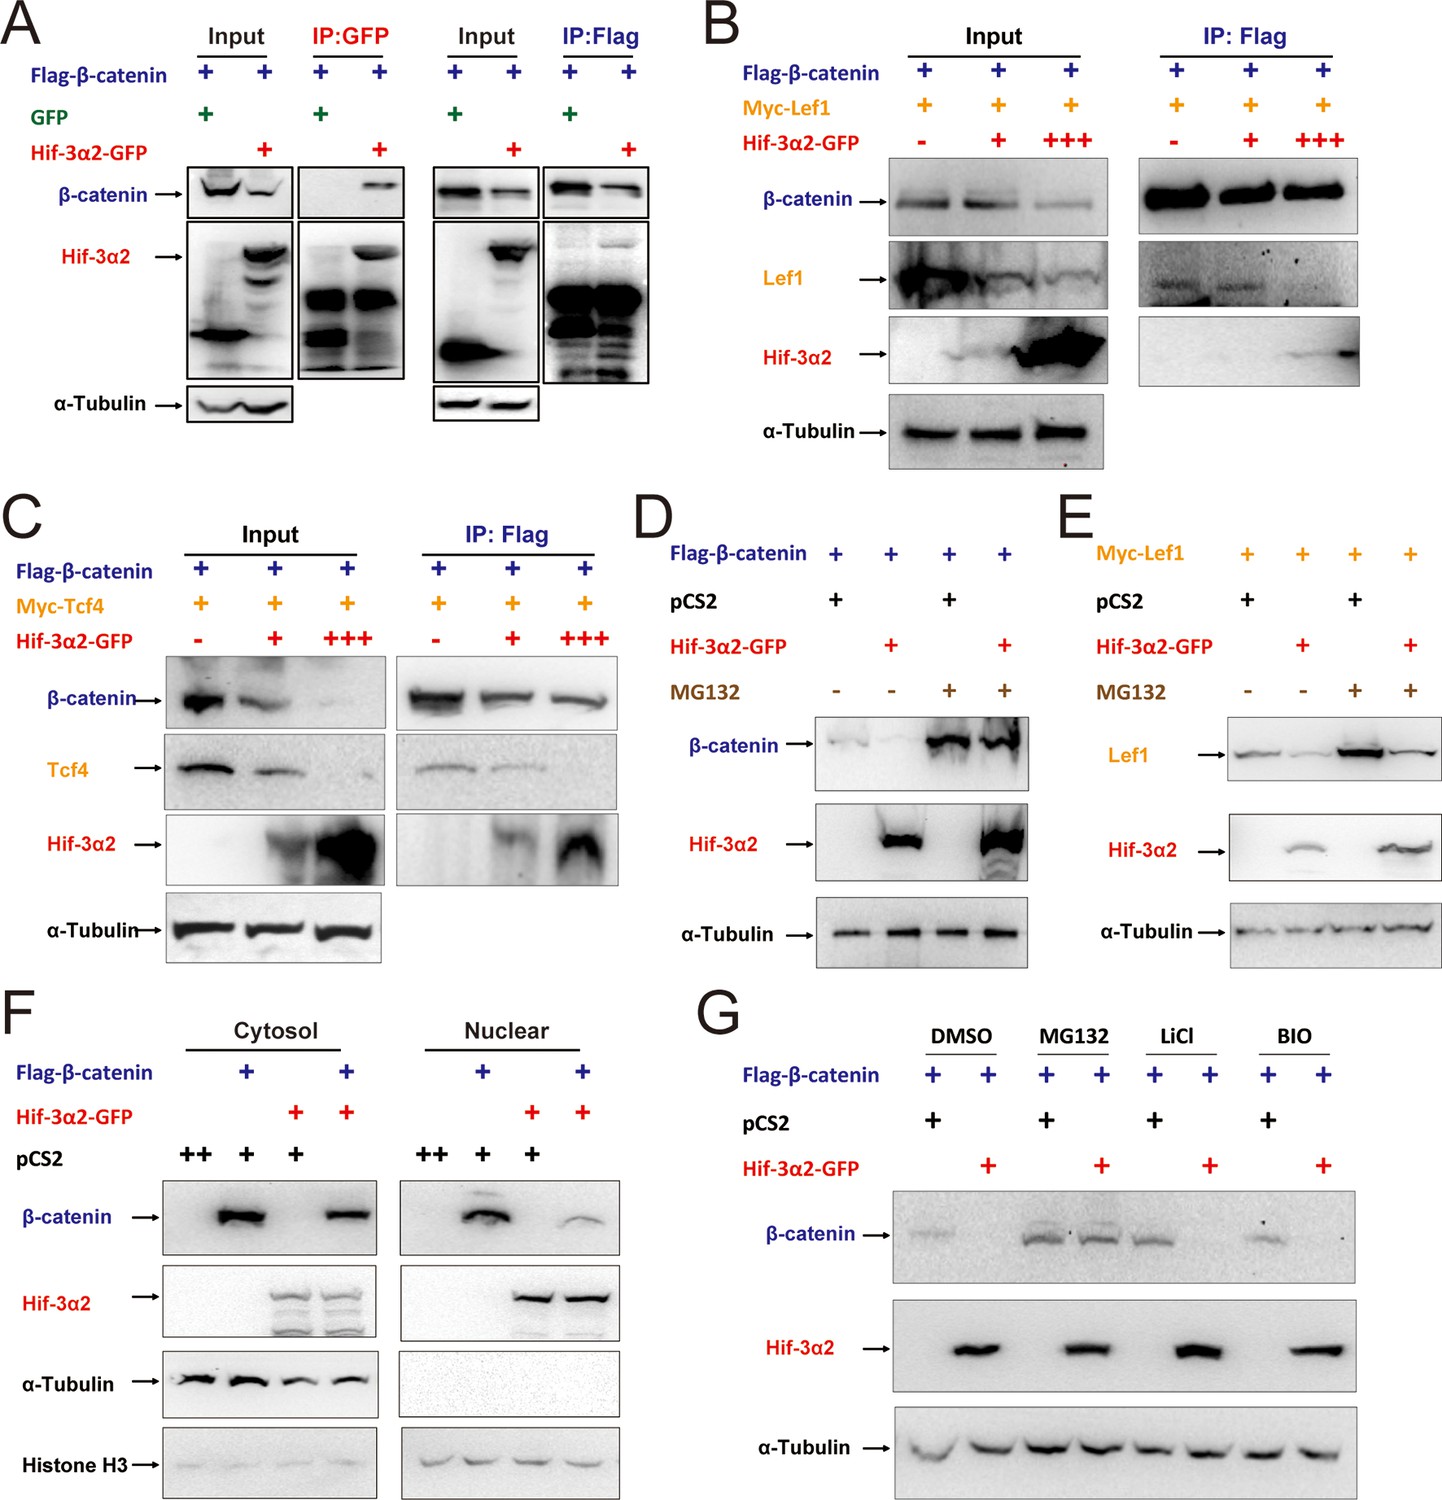
Hif-3α2 binds to β-catenin and destabilizes the nuclear β-catenin complex.
(A) Co-IP experiment. HEK 293T cells were co-transfected with the indicated plasmids. 24 hr later, the cells were lysed and subjected to IP with an anti-GFP (left panel) or anti-Flag antibody (right panel) followed by immunoblotting using the indicated antibodies. (B,C) Dose-dependent effects of Hif-3α2 in reducing the β-catenin-Left1 complex (B) and β-catenin-Tcf4 complex (C). HEK 293T cells were co-transfected with the indicated plasmids. + and +++ indicate 1 and 3 μg DNA. 24 hr later, the cells were lysed and subjected to IP followed by Western blotting. (D) Hif-3α2 promotes β-catenin degradation. HEK 293T cells were co-transfected with the indicated plasmids. 24 hr after transfection, the cells were treated with MG132 (10 μM) for 12 hr and analyzed by Western blotting. (E) Hif-3α2 increases Lef1 degradation. HEK 293T cells transfected with the indicated plasmids. 24 hr after transfection, the cells were treated with MG132 (10 μM) for 12 hr and analyzed by Western blotting. (F) Hif-3α2 decreases nuclear β-catenin levels. HEK 293T cells transfected with the indicated plasmids were fractionated into nuclear and cytosolic fractions and analyzed by Western blotting. + and ++, indicate 1 and 2 μg DNA used. α-Tubulin and Histone H3 were measured as cytosolic and nuclear protein markers. (G) Lack of effects of GSKβ inhibitors. HEK293T cells were co-transfected with the indicated plasmids. 24 hr after transfection, the cells were treated with 6-bromoindirubin-3'-xime (BIO, 100 nM), LiCl (10 mM), or MG132 (10 μM) for 12 hr and lysed. The cell lysates were analyzed.
Figure 9—figure supplement 1
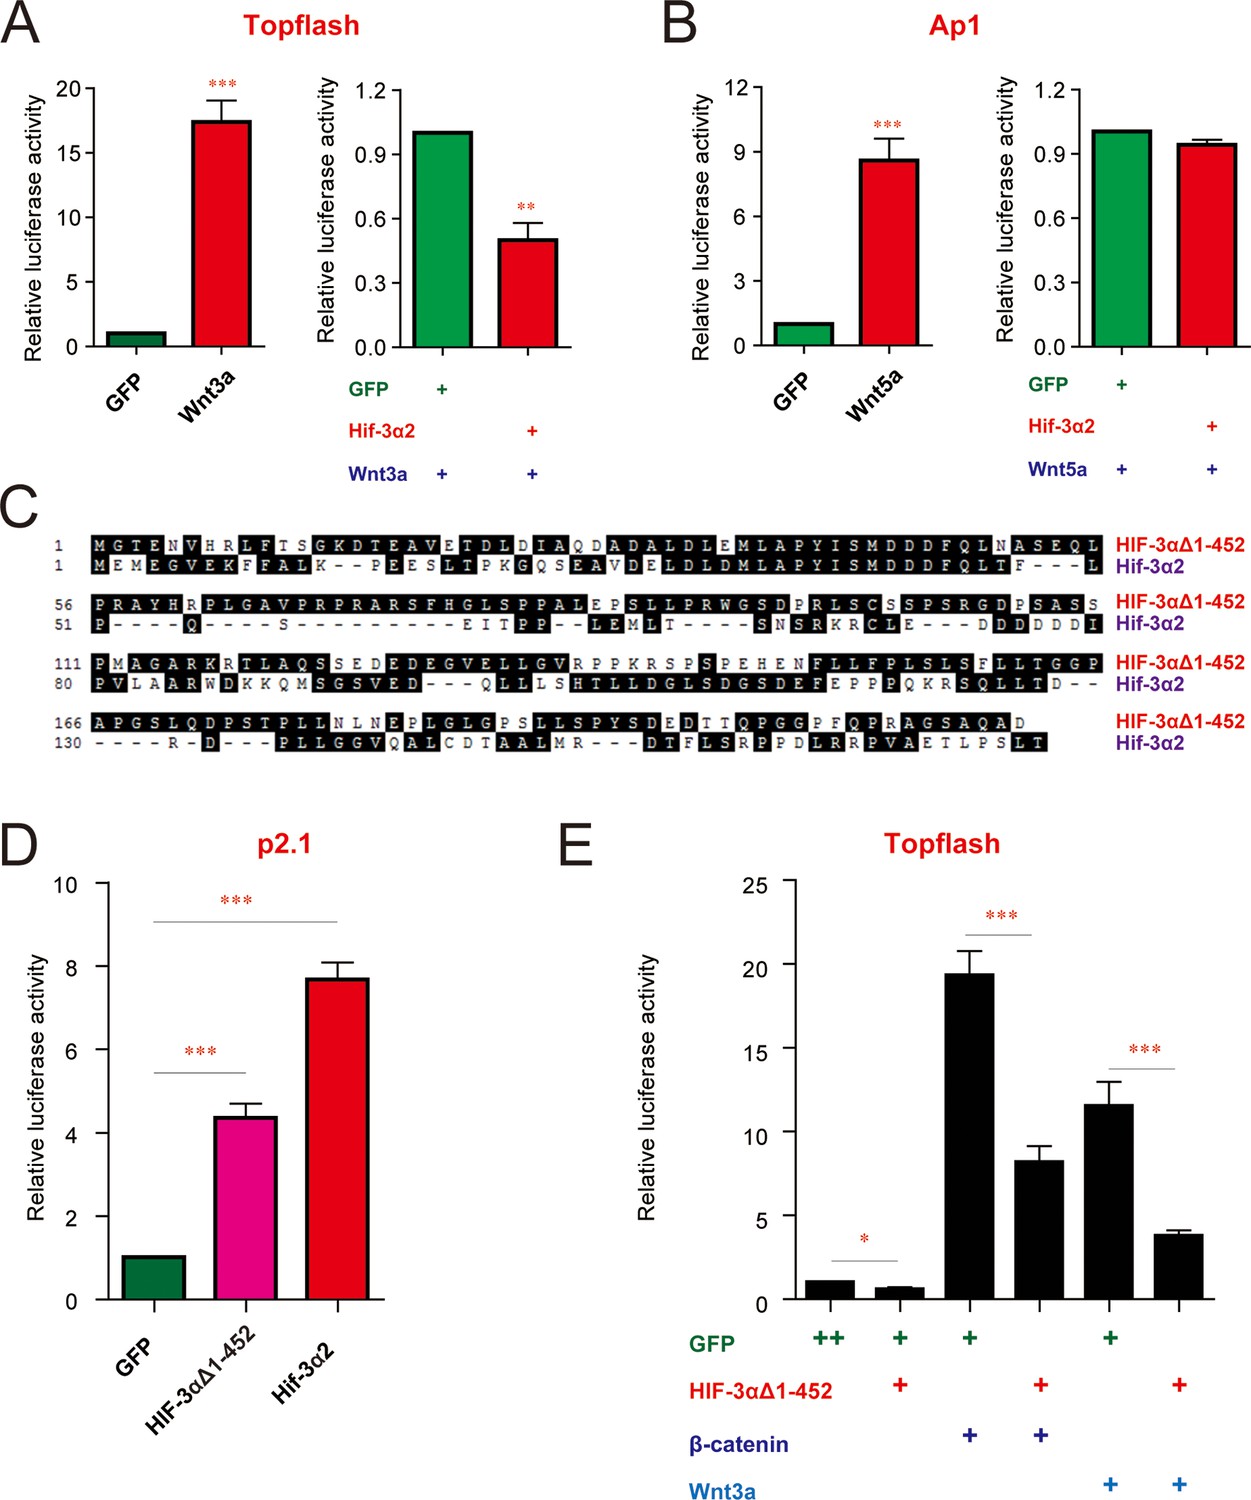
The HER-dependent transcriptional activity and Wnt/β-catenin inhibitory activity are conserved in human cells.
(A,B) Hif-3α2 inhibits the canonical but not non-canonical Wnt signaling pathway in human cells. HEK293T cells were transfected with 100 ng Topflash reporter (A) or Ap1 reporter (B) plasmid together with the indicated plasmids. 24 hr after the transfection, luciferase activity was measured and the results are normalized and expressed as fold change over the control group. Values are means +S.E. (n = 3). ** and ***p < 0.01 and 0.001. (C) Sequence alignment of zebrafish Hif-3α2 and the human HIF-3α9 C-terminal region. (D,E) The HRE-dependent transcriptional activity (D) and β-catenin inhibitory activities (E) of the human HIF-3α9Δ1–452. In (D), HEK293T cells were transfected with the indicated plasmid together with 100 ng p2.1 DNA. In (E), HEK293T cells were transfected with 100 ng Topflash DNA together with the indicated plasmids. 24 hr after the transfection, luciferase activity was measured and the results are normalized and expressed as fold change over the GFP group. Values are means +S.E. (n = 3). ***p < 0.001.
Figure 9—figure supplement 2
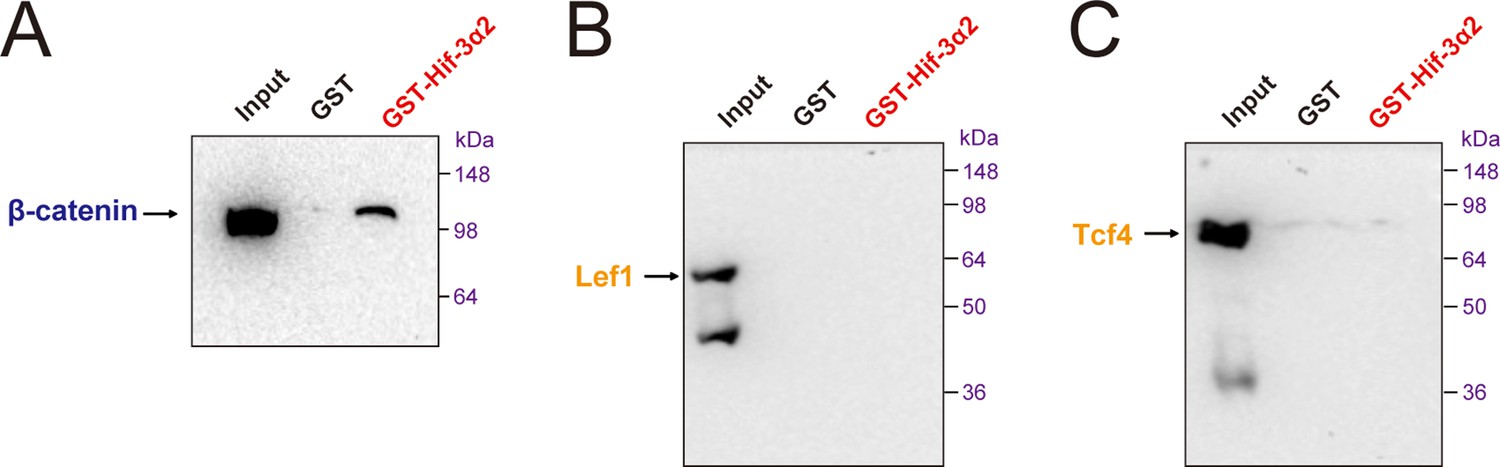
Hif-3α2 binds to β-catenin but not Lef1 or Tcf4 directly.
Purified GST or GST-Hif-3α2 bound to glutathione-Sepharose beads was incubated with lysates of HEK293T cells transfected with β-catenin (A), Lef1 (B), and Tcf4 (C). The beads were washed and the eluent was analyzed by Western blotting.
Figure 9—figure supplement 3
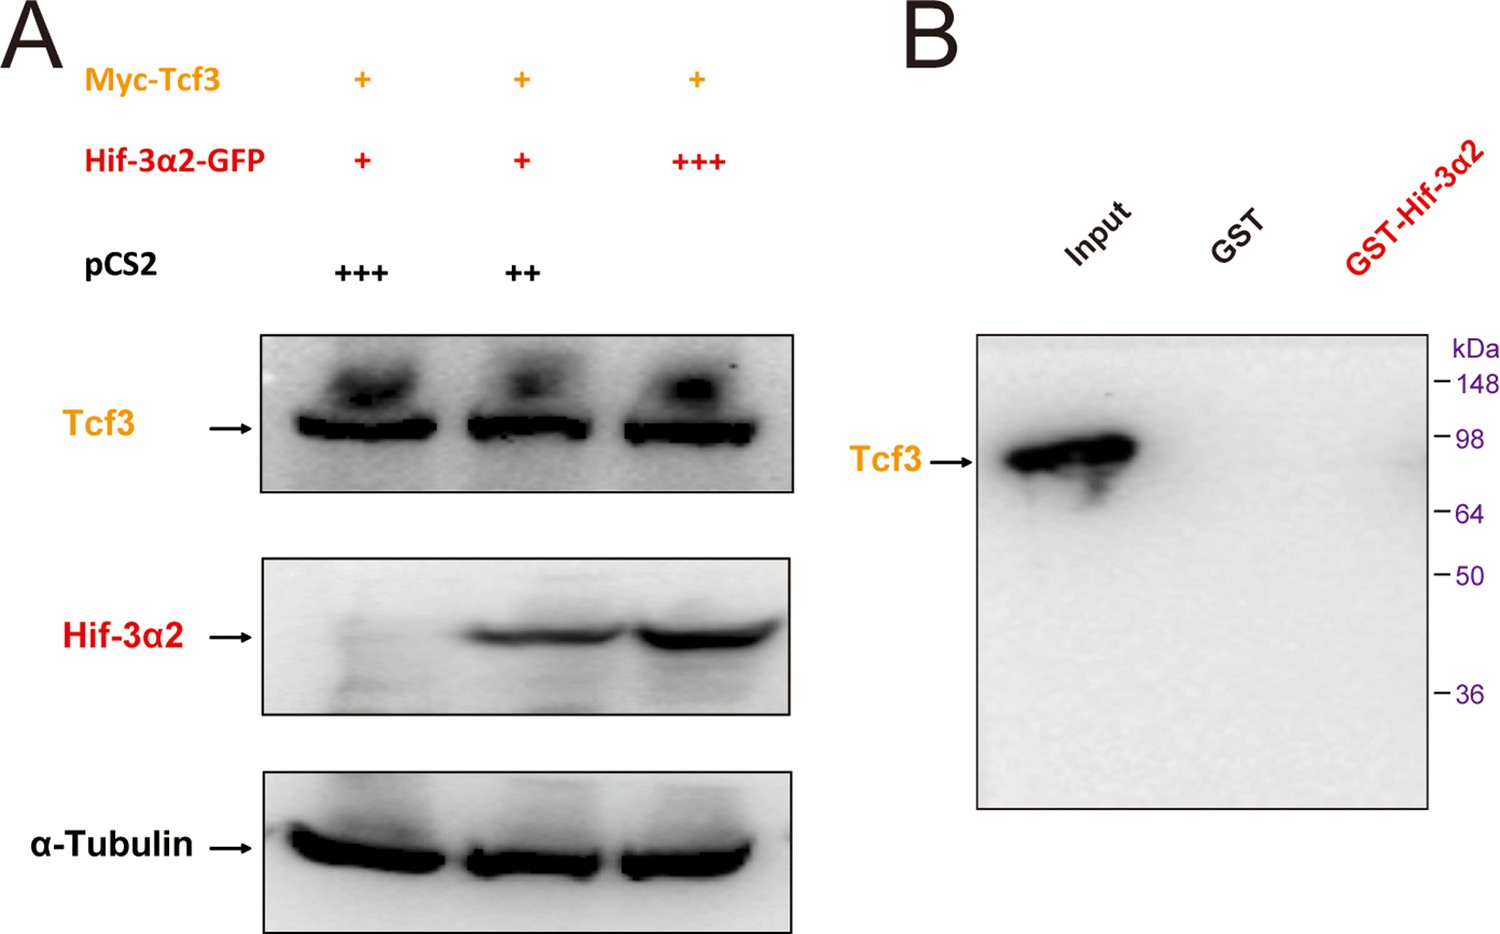
Hif-3α2 dose not affect Tcf3 stability.
(A) HEK 293T cells were co-transfected with the indicated plasmids at the indicated levels. +, ++, and +++ indicate 1, 2, and 3 μg DNA. 24 hr after transfection, the cell lysates were analyzed by Western blotting. (C) Purified GST or GST-Hif-3α2 bound to glutathione-SepharoseTM beads was incubated with HEK293T cell lysates transfected with Tcf3. The beads were washed and the eluent was analyzed by Western blotting.
Figure 10 with 2 supplements
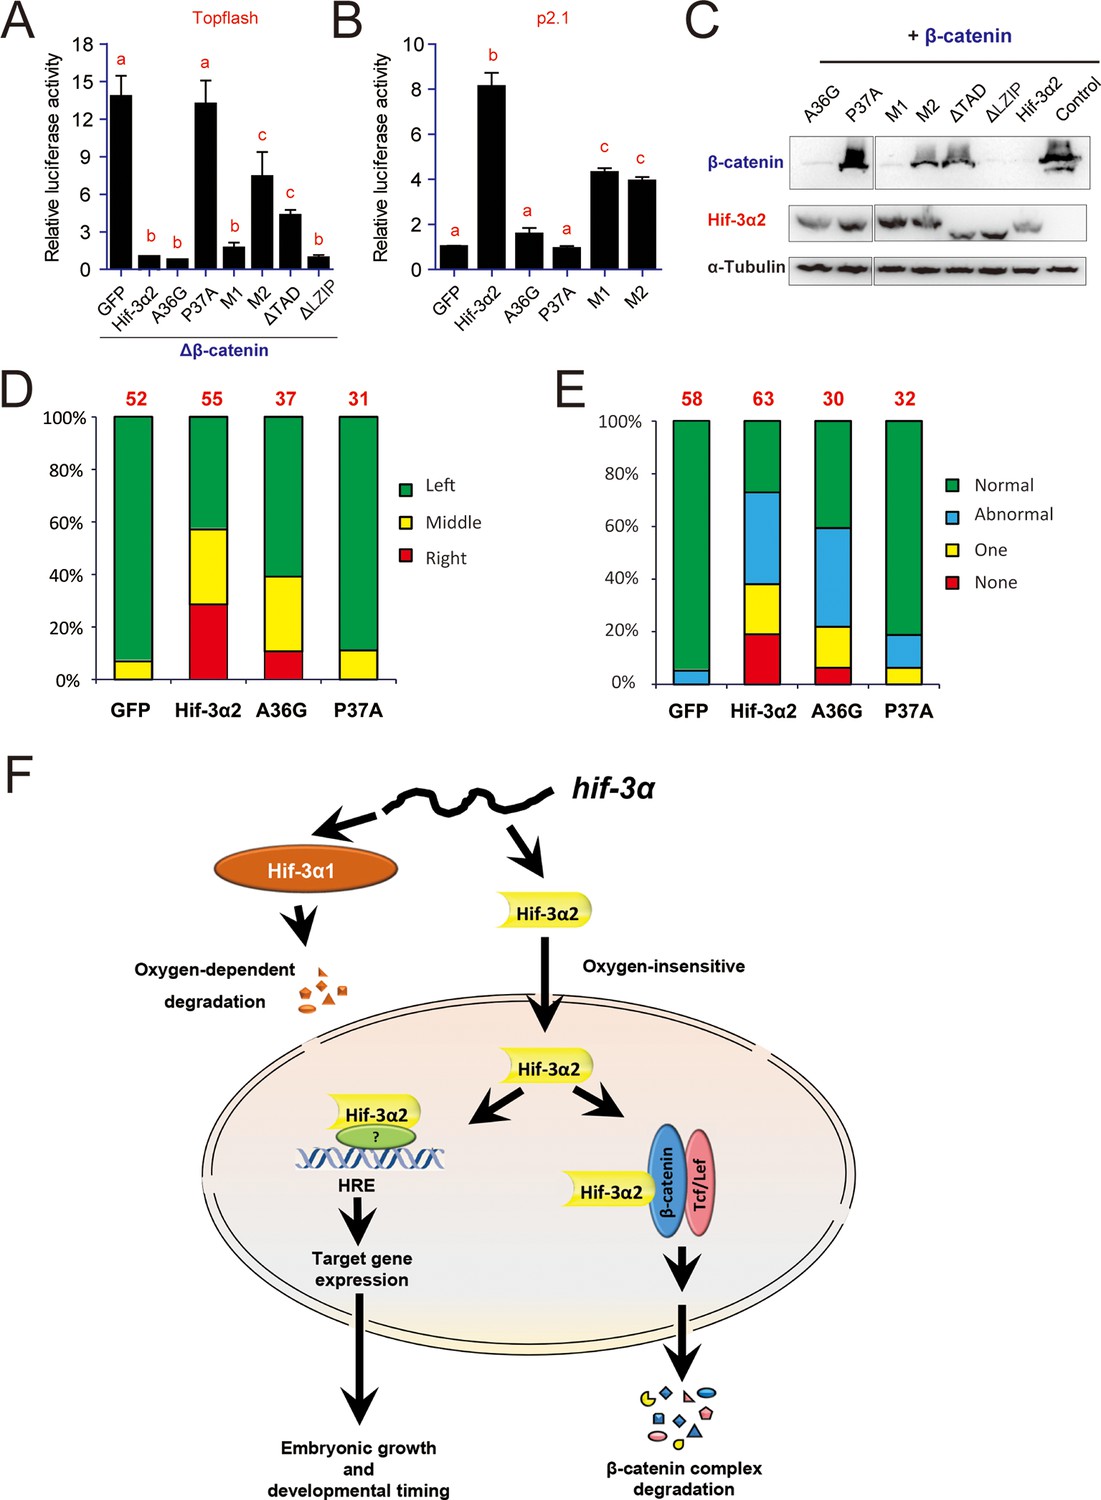
Hif-3α2 regulates LR asymmetry by destabilizing β-catenin independently of its transcriptional activity.
(A) Inhibition of β-catenin-induced Topflash reporter activity. Zebrafish embryos were injected with 90 pg Topflash plasmid DNA together with capped mRNA (600 pg) of the indicated Hif-3α2 mutants (Figure 10—figure supplement 1 for mutant details). Luciferase activity was measured at 9 hpf. Values are means +S.E. (n = 3). Groups labeled with different letters are significantly different from each other (P < 0.05). (B) HRE-dependent transcriptional activities of the indicated Hif-3α2 mutants. HEK293 cells were transfected with the indicated plasmid together with p2.1. The results are normalized and expressed as fold change over the GFP group and presented as described above. (C) Effects of Hif-3α2 mutants on β-catenin stability. HEK 293T cells were co-transfected with Flag-tagged β-catenin and the indicated Hif-3α2 mutants. The cell lysates were analyzed by Western blotting. (D,E) Effects of the indicated Hif-3α2 mutants on heart looping (D) and somite development (E). Embryos injected with the indicated capped mRNA were analyzed and scored as described in Figure 3. (F) Oxygen-dependent and -independent action of Hif-3α. The hif-3α gene gives rise to Hif-3α1 (the full-length protein) and Hif-3α2 (a short spliced variant). Hif-3α1 is an oxygen-dependent transcription factor. It is rapidly degraded under normoxia. Under hypoxia, Hif-3α1 is stabilized and regulates the expression of many target genes, which in turn slow down growth and developmental timing (Zhang et al., 2014). Hif-3α2 is insensitive to oxygen tension. Hif-3α2 regulates target gene expression in an HRE-dependent manner under both normoxia and hypoxia. It is unclear whether Hif-3α2 can form a dimer with HIFβ. Hif-3α2 also binds to β-catenin and destabilizes the nuclear β-catenin complex. This Wnt signaling inhibitory action is independent of its HRE-dependent transcriptional activity.
Figure 10—figure supplement 1
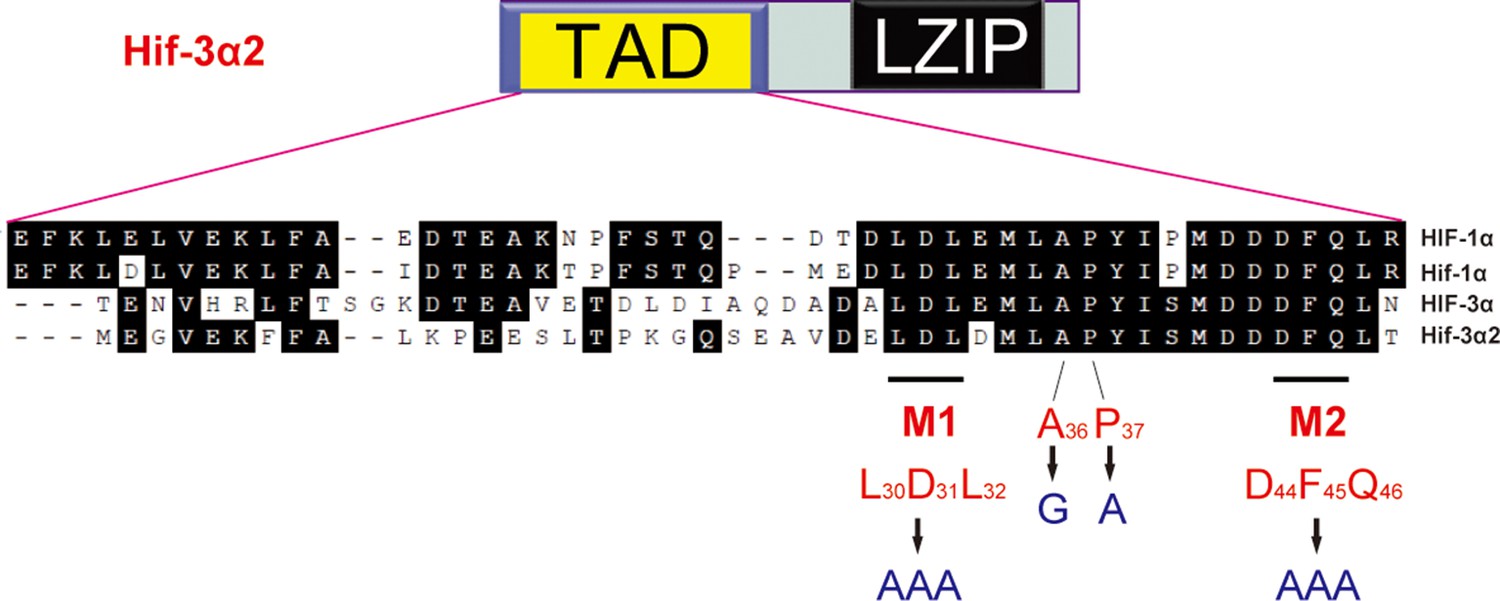
Sequence comparison of the TAD in the indicated human and zebrafish HIF/Hif proteins.
The Hif-3α2 point mutants engineered are shown.
Figure 10—figure supplement 2
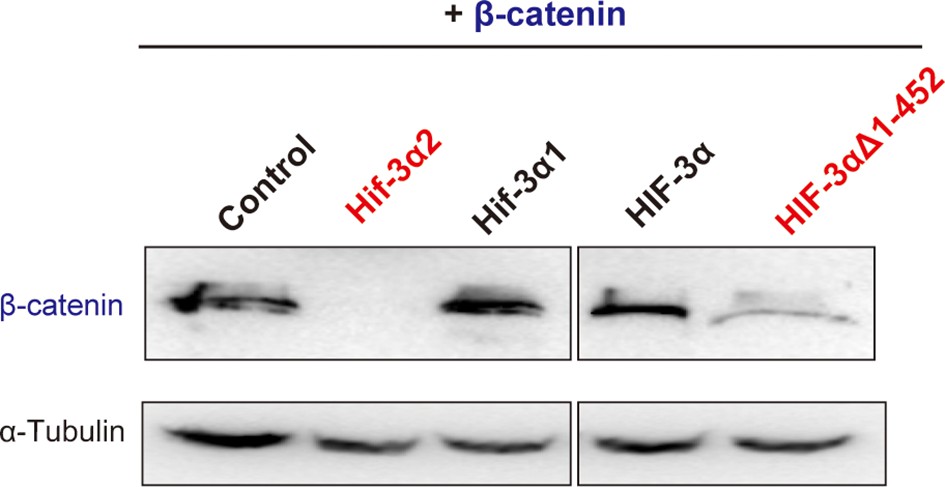
Effects of full-length human HIF-3α9, its N-terminal deletion mutant, zebrafish Hif-3α1, and Hif-3α2 on β-catenin stability.
HEK293T cells were co-transfected with Flag-tagged β-catenin and the indicated plasmid. The cell lysates were analyzed by Western blotting.
Additional files
-
Supplementary file 1
PCR primers used in this study.
- https://doi.org/10.7554/eLife.08996.027
Download links
A two-part list of links to download the article, or parts of the article, in various formats.
Downloads (link to download the article as PDF)
Open citations (links to open the citations from this article in various online reference manager services)
Cite this article (links to download the citations from this article in formats compatible with various reference manager tools)
An oxygen-insensitive Hif-3α isoform inhibits Wnt signaling by destabilizing the nuclear β-catenin complex
eLife 5:e08996.
https://doi.org/10.7554/eLife.08996


