Ebola virus disease in the Democratic Republic of the Congo, 1976-2014
- Public Health England, United Kingdom
- University College London, United Kingdom
- Direction de lutte contre la maladie, Democratic Republic of the Congo
- London School of Hygiene and Tropical Medicine, United Kingdom
- Institut National de Recherche Biomédicale, Democratic Republic of the Congo
Figures
Figure 1
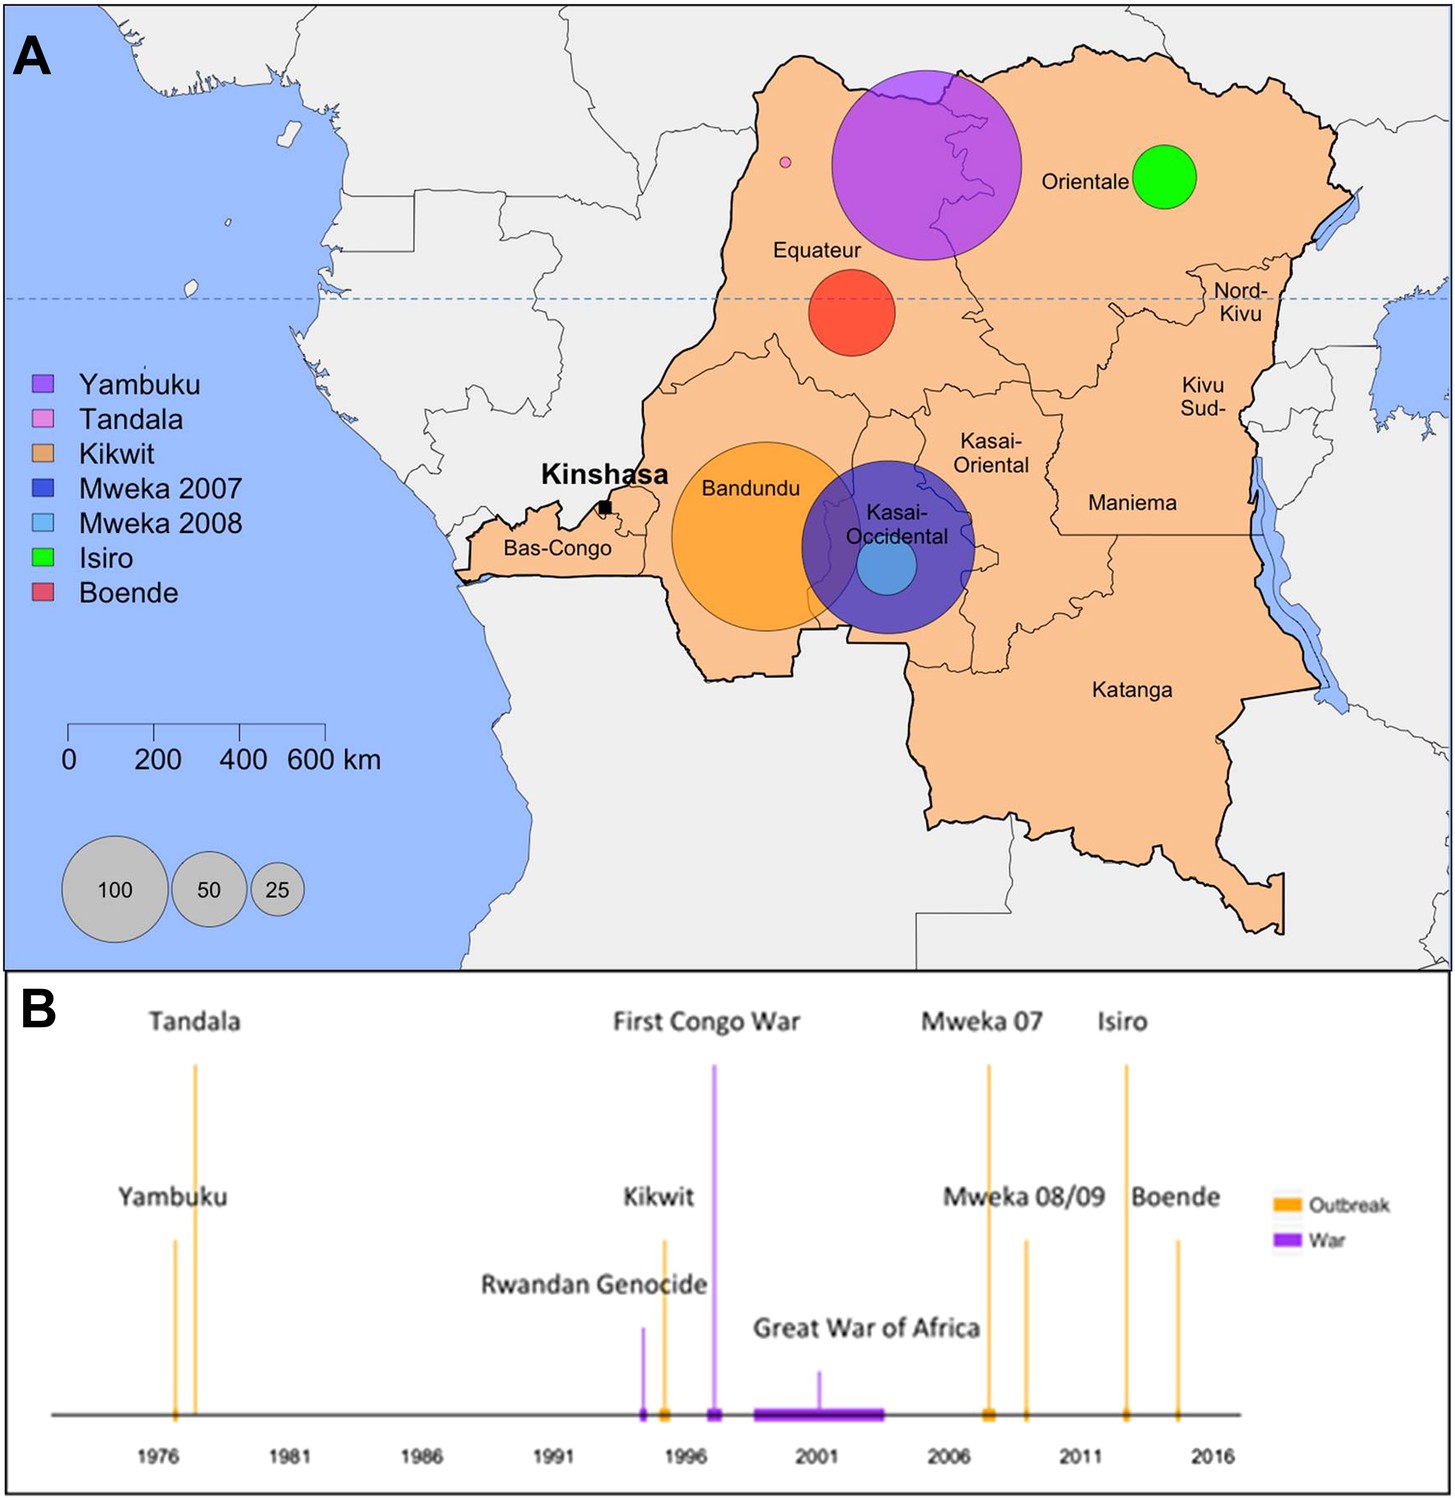
Map and historical timeline of the EVD outbreaks in the DRC.
(A) Map of the Democratic Republic of the Congo (DRC) where the area of the circles are proportional to the number of cases (probable and confirmed) per outbreak. (B) The outbreaks (in orange) and relevant wars (in purple) are positioned in time.
Figure 2
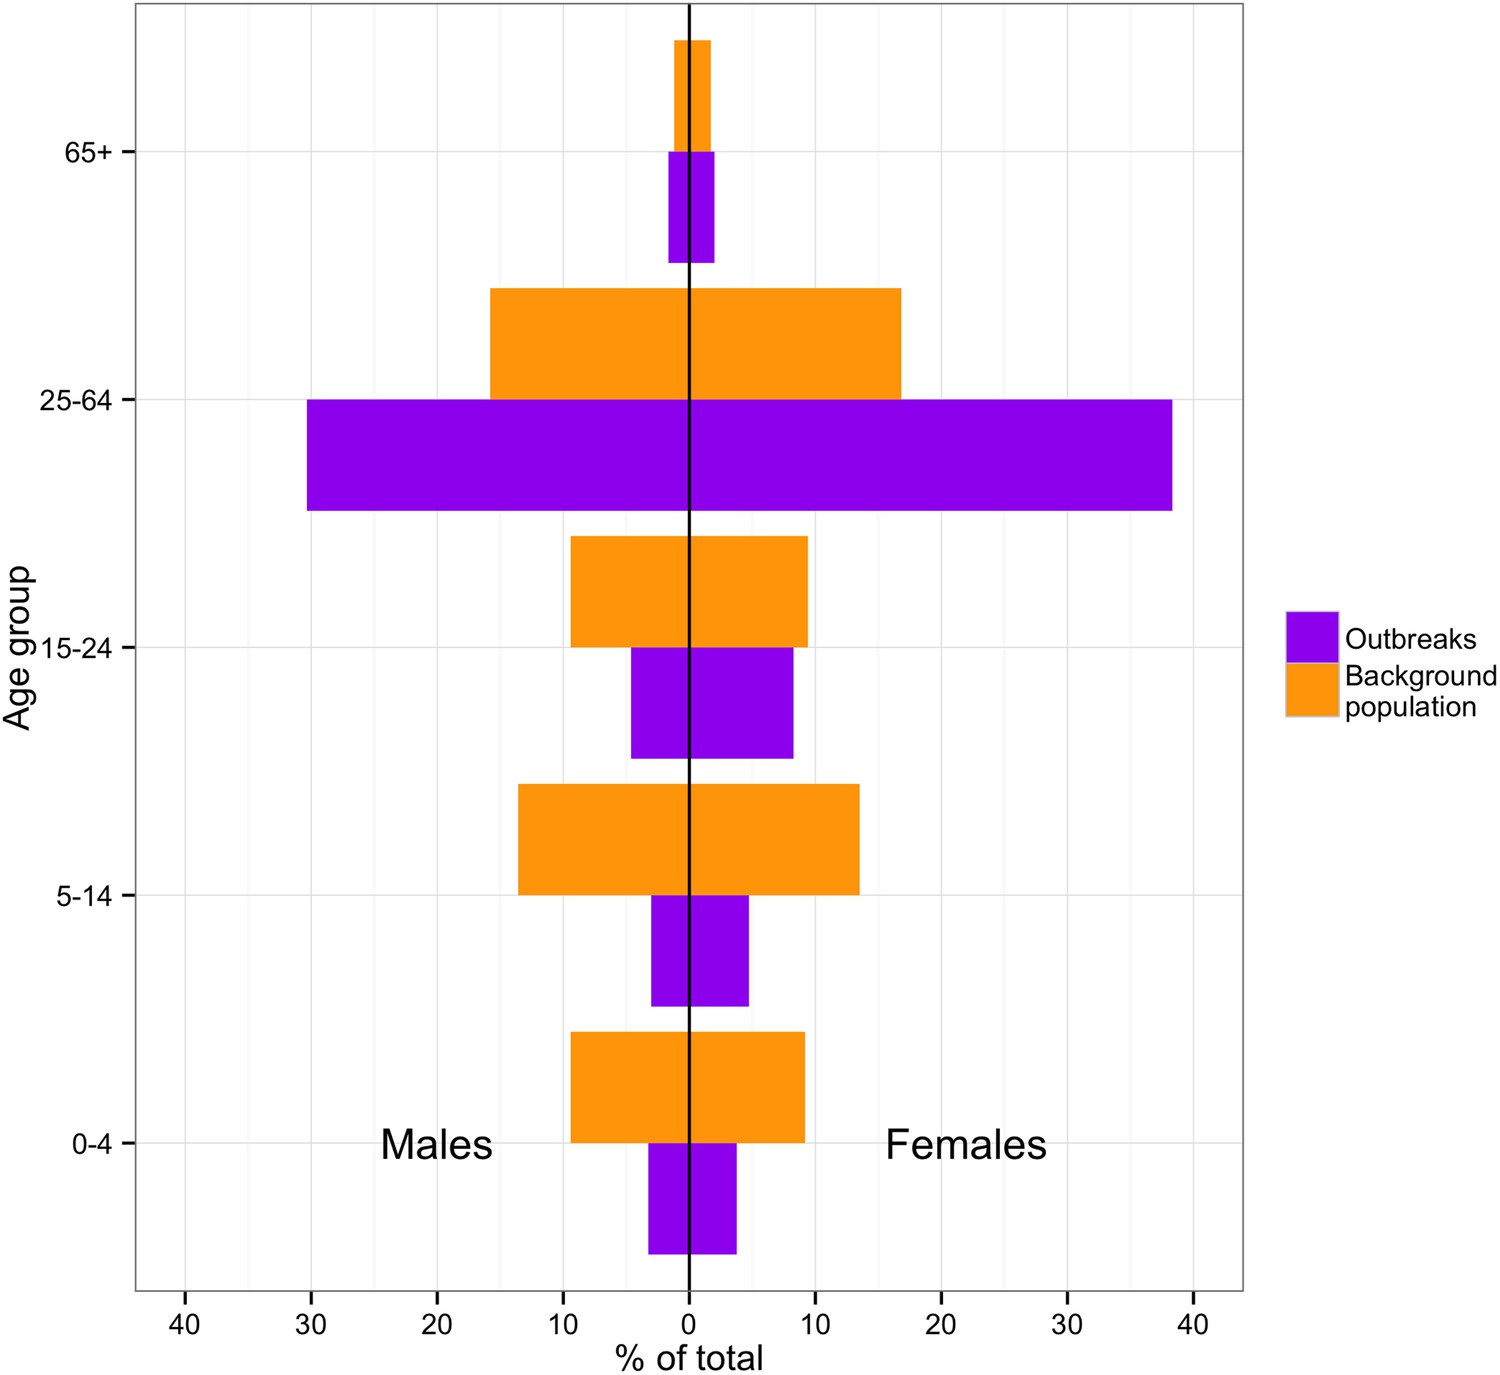
Incidence of cases by age and sex in the DRC outbreaks in comparison to the demographics of the national 1975–2010 population.
https://doi.org/10.7554/eLife.09015.006
Figure 3
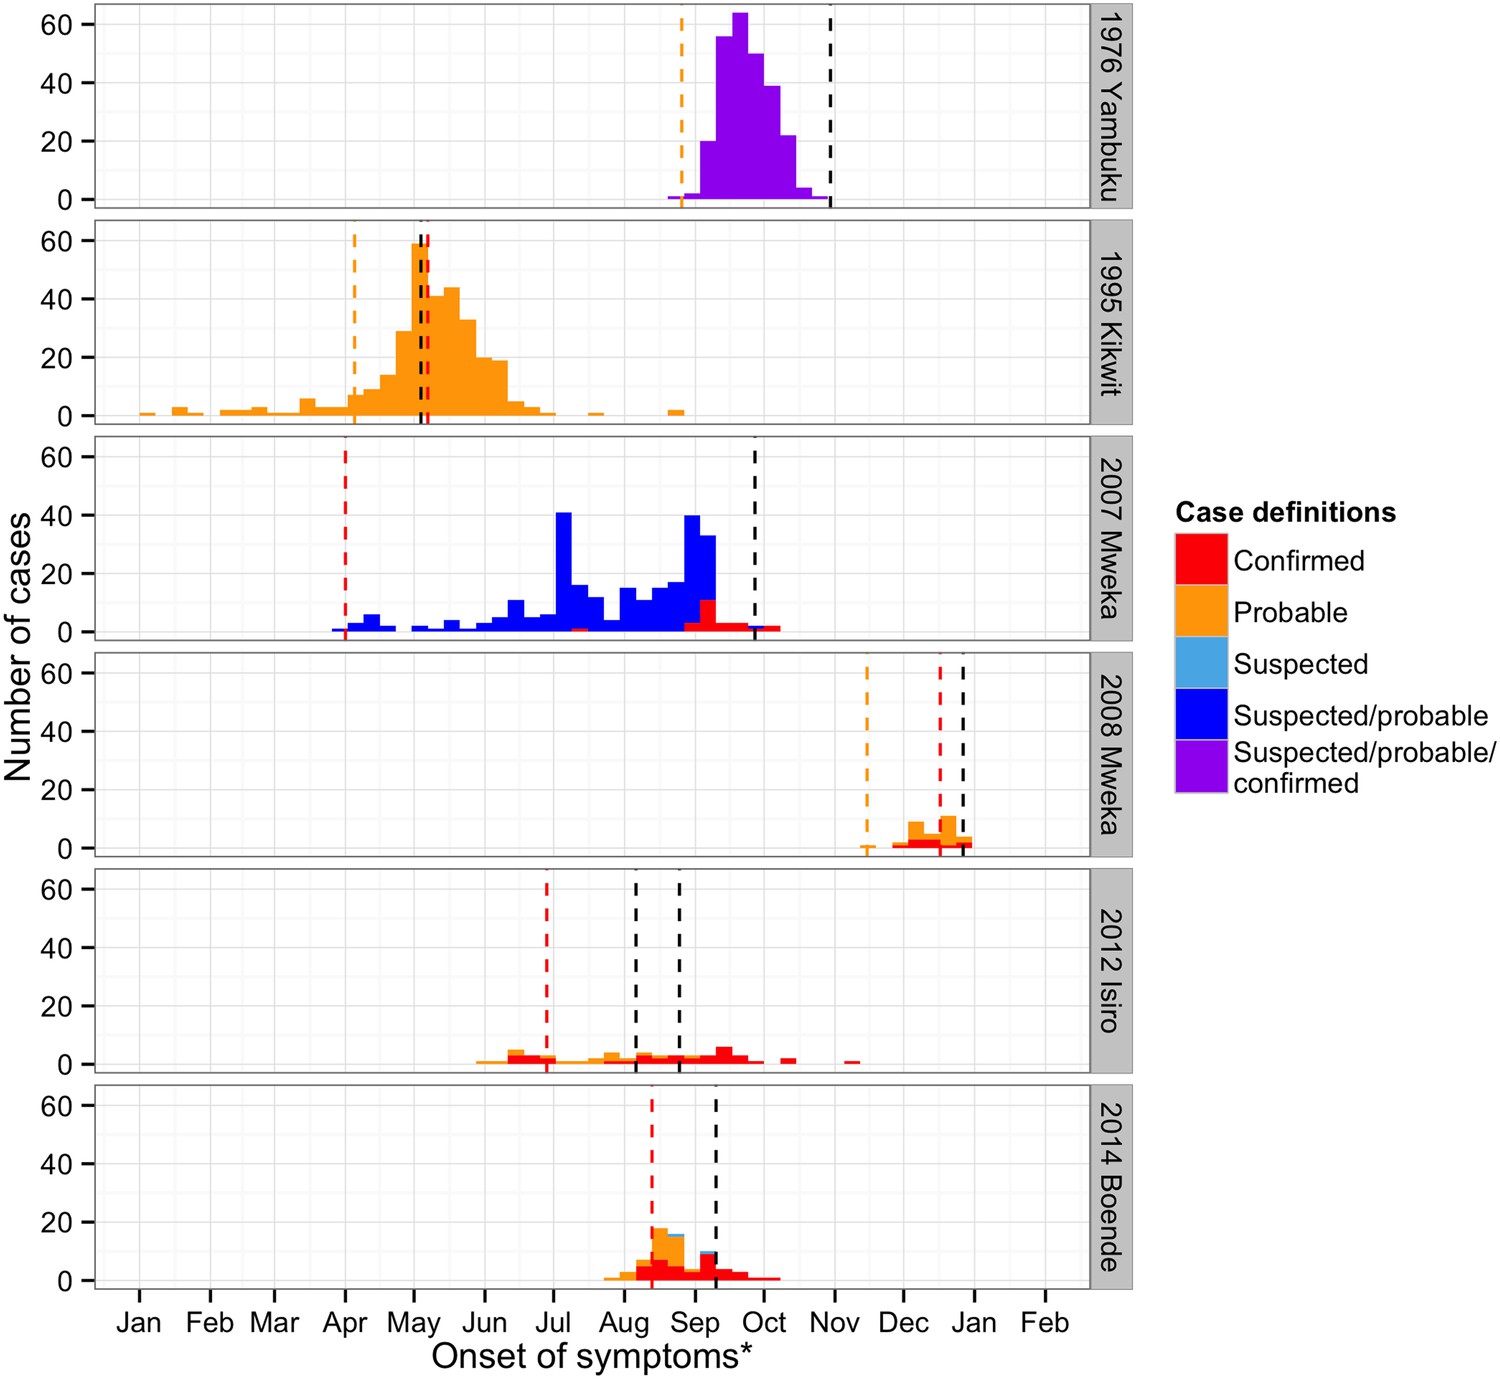
Time course of the EVD outbreaks in DRC.
Confirmed cases are plotted in red, probable cases in orange, suspected in light blue, cases that were either suspected or probable cases in dark blue, and cases for whom the definition was unknown in purple. The dashed lines represent important events that occurred during the outbreaks (in orange, the first records of the disease, in red, the first notifications, and in black, important interventions carried out). For Yambuku, this was the closure of Yambuku Mission Hospital; for Kikwit, the closure of all hospitals, health centres, and laboratories in the area; for Mweka 2007, the opening of two mobile laboratories; for Mweka 2008, the opening of the first isolation centre; for Isiro, first the opening of the isolation centre and later the opening of the laboratory; and for Boende, the opening of the first isolation centre. Notification dates were when the cases were first notified to the Direction de Lutte contre la Maladie (DLM).
Figure 4
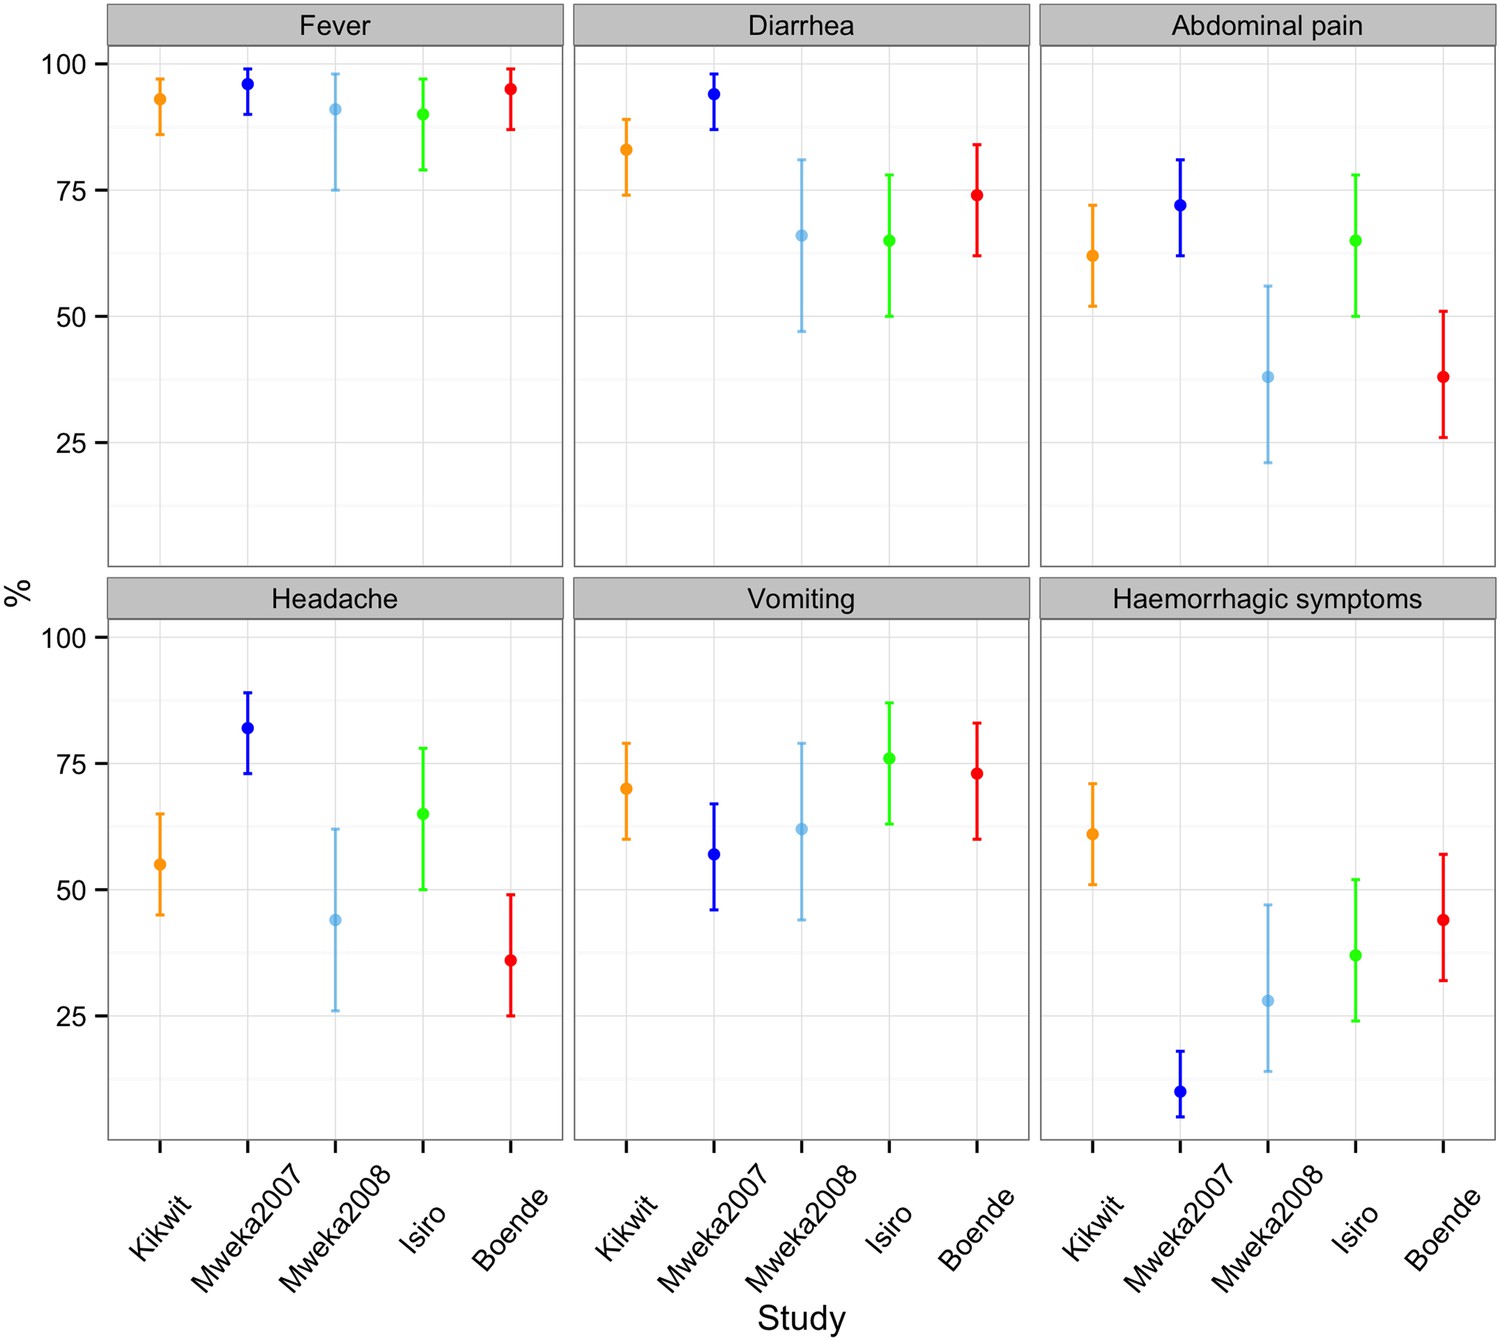
Percentage of probable and confirmed cases with abdominal pain, diarrhoea, fever, haemorrhagic symptoms, headache, and vomiting.
These were calculated by dividing the number of probable and confirmed cases with symptoms by the number of probable and confirmed cases with symptoms, no symptoms, and blanks for cases for who the presence or absence of at least one symptom was reported. Note that the majority of cases in the Mweka 2007 outbreak were diagnosed a posteriori using recorded symptoms.
Figure 5 with 2 supplements

Evolving case-fatality ratios with time after the start of the outbreak.
Monthly point estimates are presented with 95% binomial confidence intervals. The dashed horizontal line indicates the average case-fatality ratio (CFR) during each outbreak. The vertical dashed lines represent important events that occurred during the outbreaks (in red, the first notifications, and in black, important interventions carried out). For Yambuku, this was the closure of Yambuku Mission Hospital; for Kikwit, the closure of all hospitals, health centres, and laboratories; for Mweka 2007, the opening of two mobile laboratories; for Mweka 2008, the opening of the first isolation centre; for Isiro, first the opening of the isolation centre and later the opening of the laboratory; and for Boende, the opening of the first isolation centre. Notification dates were when the cases were first notified to the DLM.
Figure 5—figure supplement 1
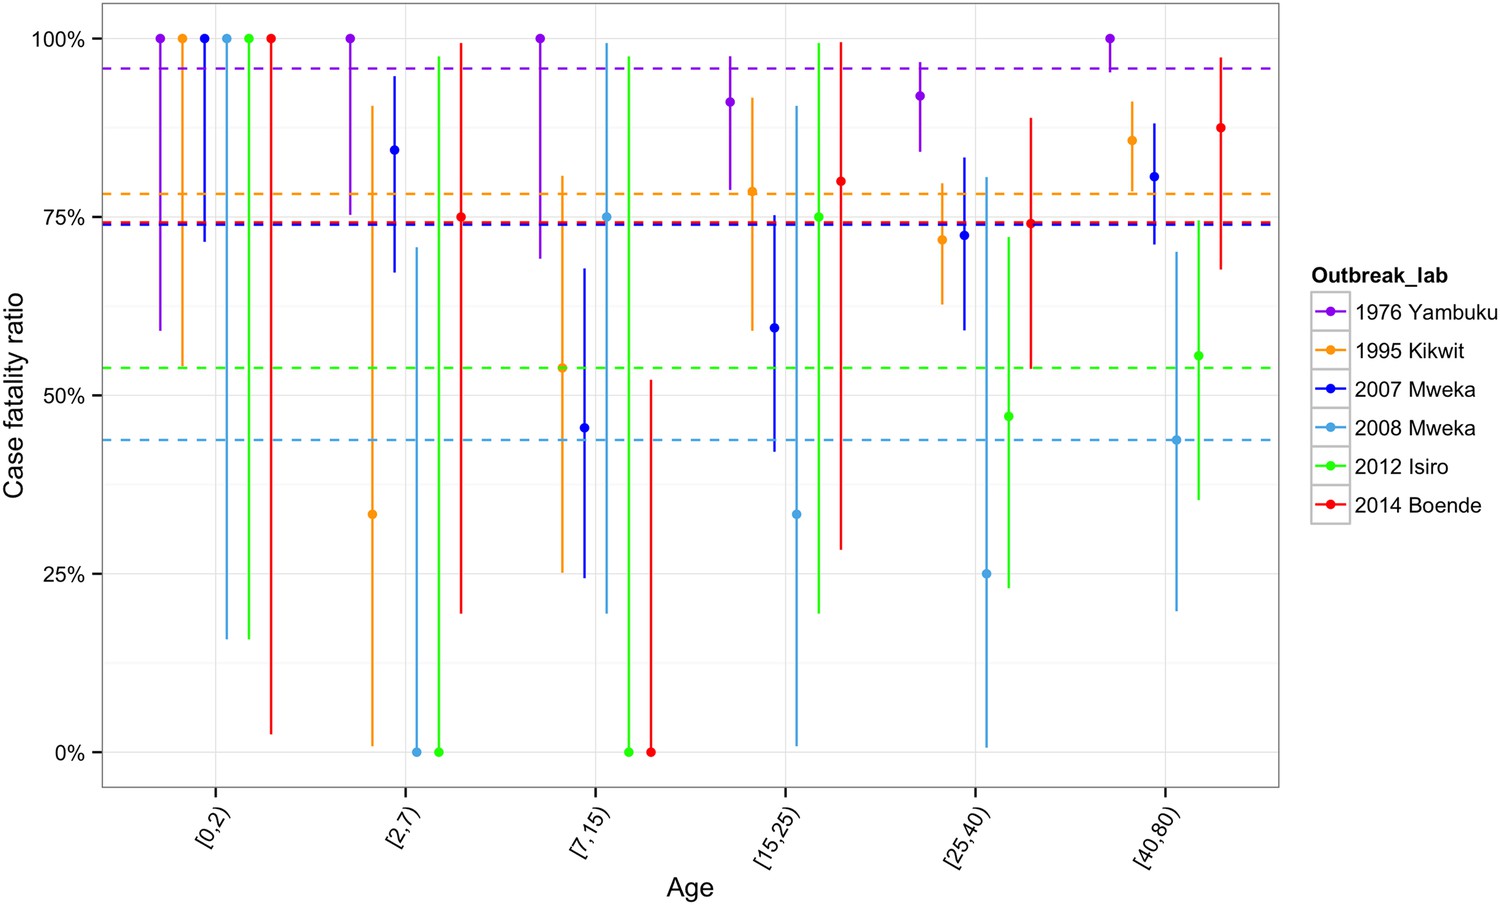
CFR by age groups for each outbreak.
https://doi.org/10.7554/eLife.09015.010
Figure 5—figure supplement 2
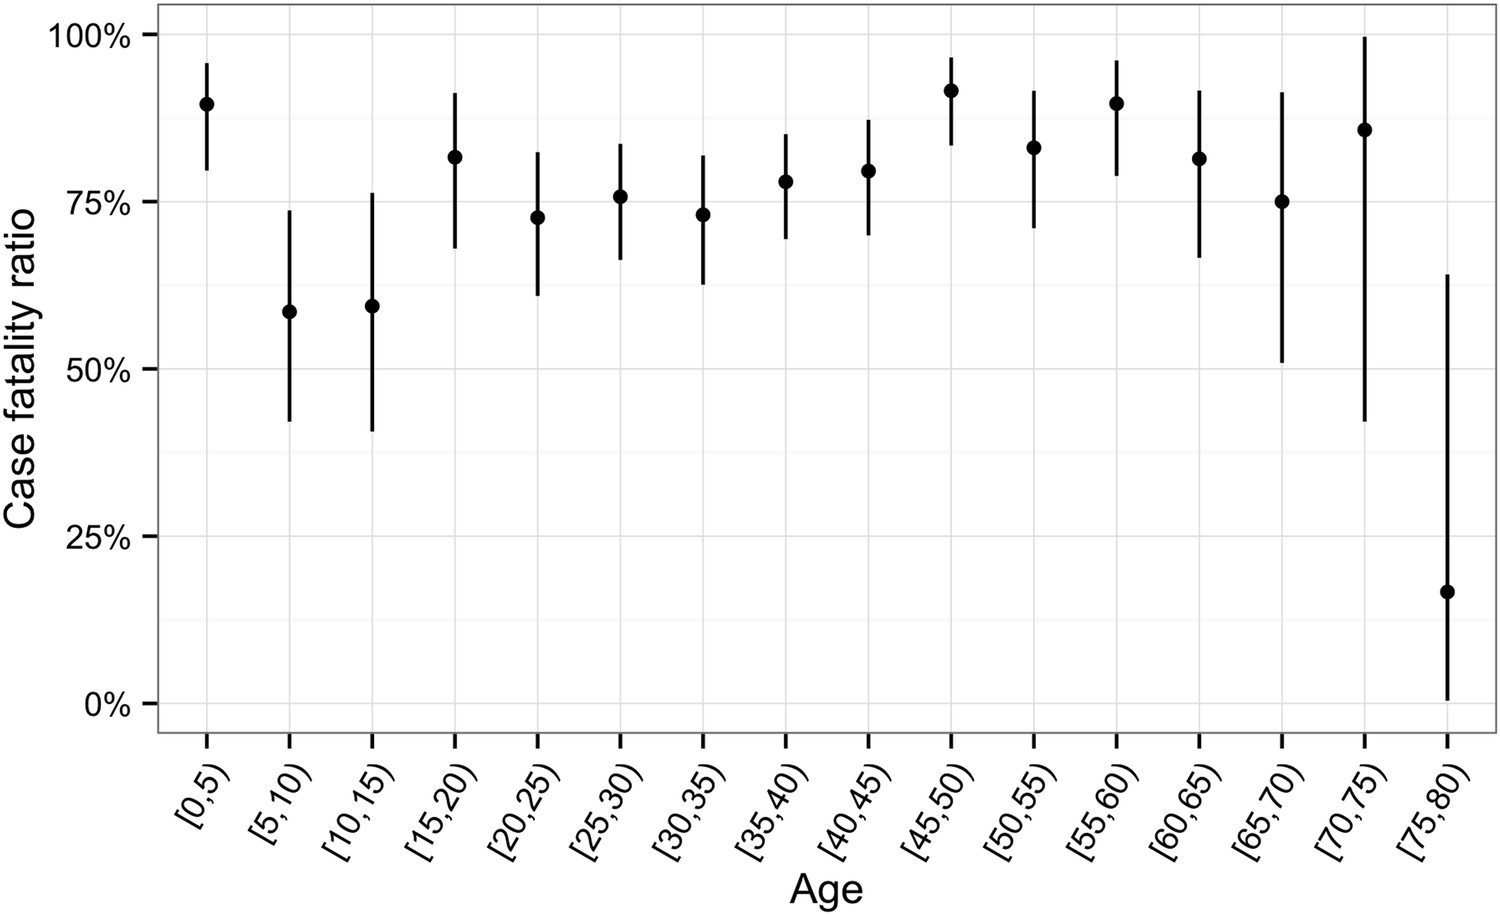
Aggregated CFRs for all outbreaks by age group.
https://doi.org/10.7554/eLife.09015.011
Figure 6
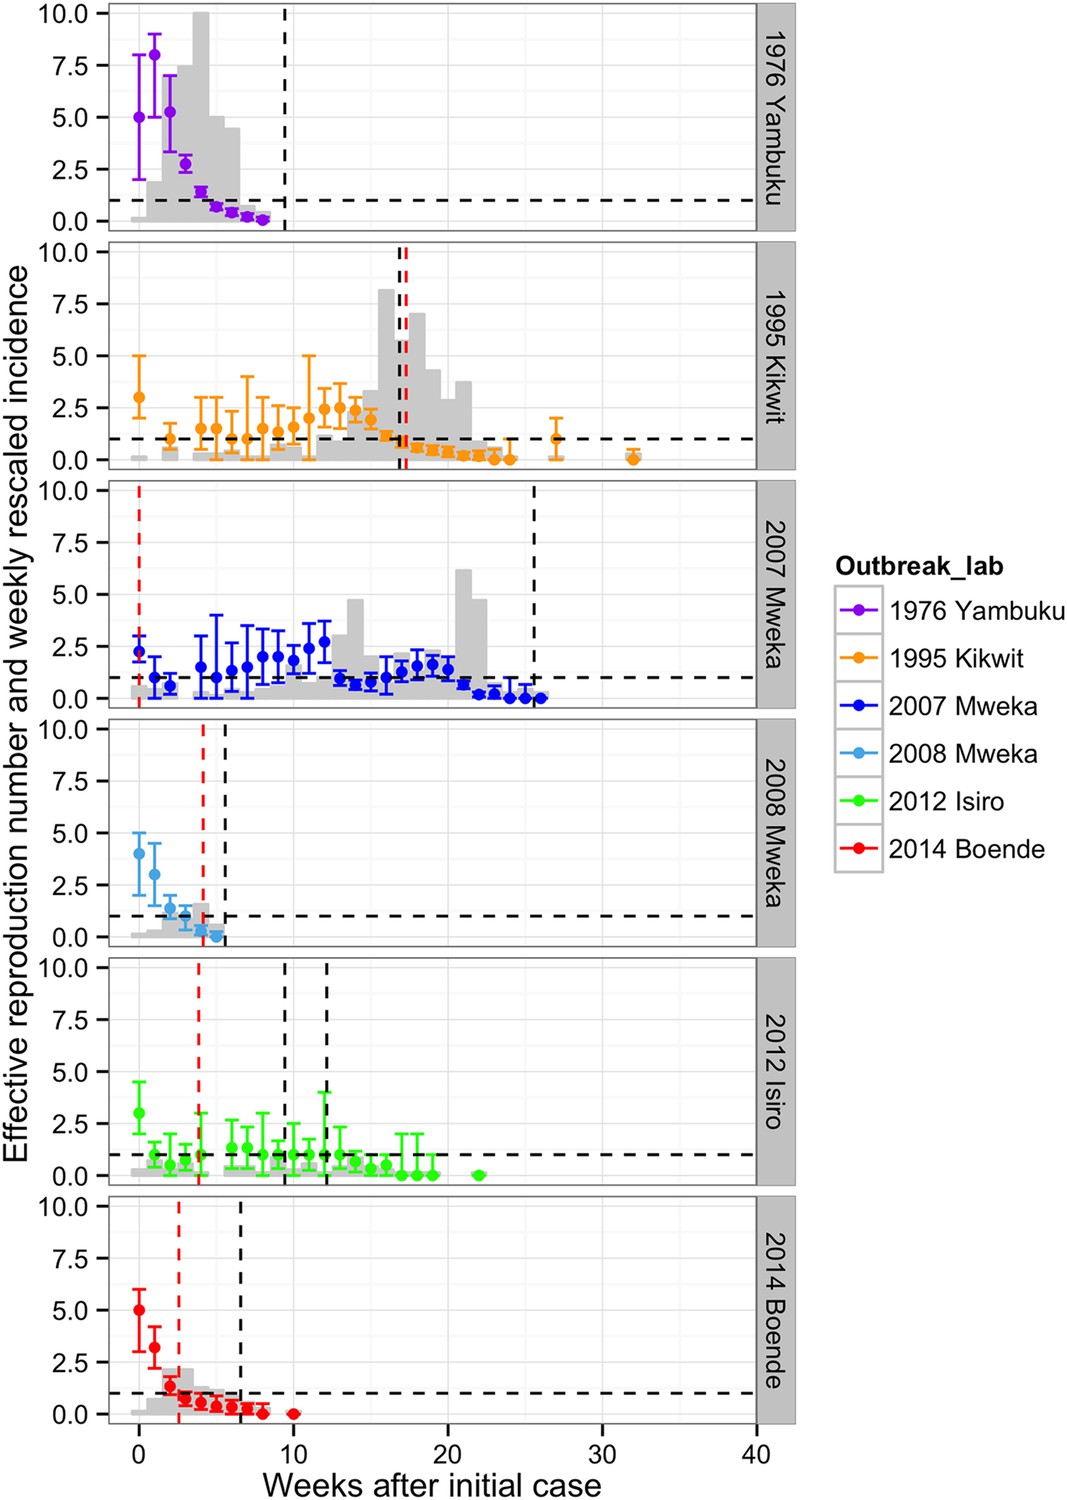
Evolving effective reproduction numbers with time after the start of the outbreak and adjusted weekly incidence.
Weekly point estimates of the effective reproduction numbers are presented with 95% confidence intervals. The dashed horizontal line indicates the threshold R = 1. The vertical dashed lines represent important events that occurred during the outbreaks (in red, the first notifications, and in black, important interventions carried out). For Yambuku, this was the closure of Yambuku Mission Hospital; for Kikwit, the closure of all hospitals, health centres, and laboratories; for Mweka 2007, the opening of two mobile laboratories; for Mweka 2008, the opening of the first isolation centre; for Isiro, first the opening of the isolation centre and later the opening of the laboratory; and for Boende, the opening of the first isolation centre. The light grey bars represent the weekly incidence of Ebola virus disease (EVD) (omitting suspected cases) rescaled by dividing by seven.
Figure 7
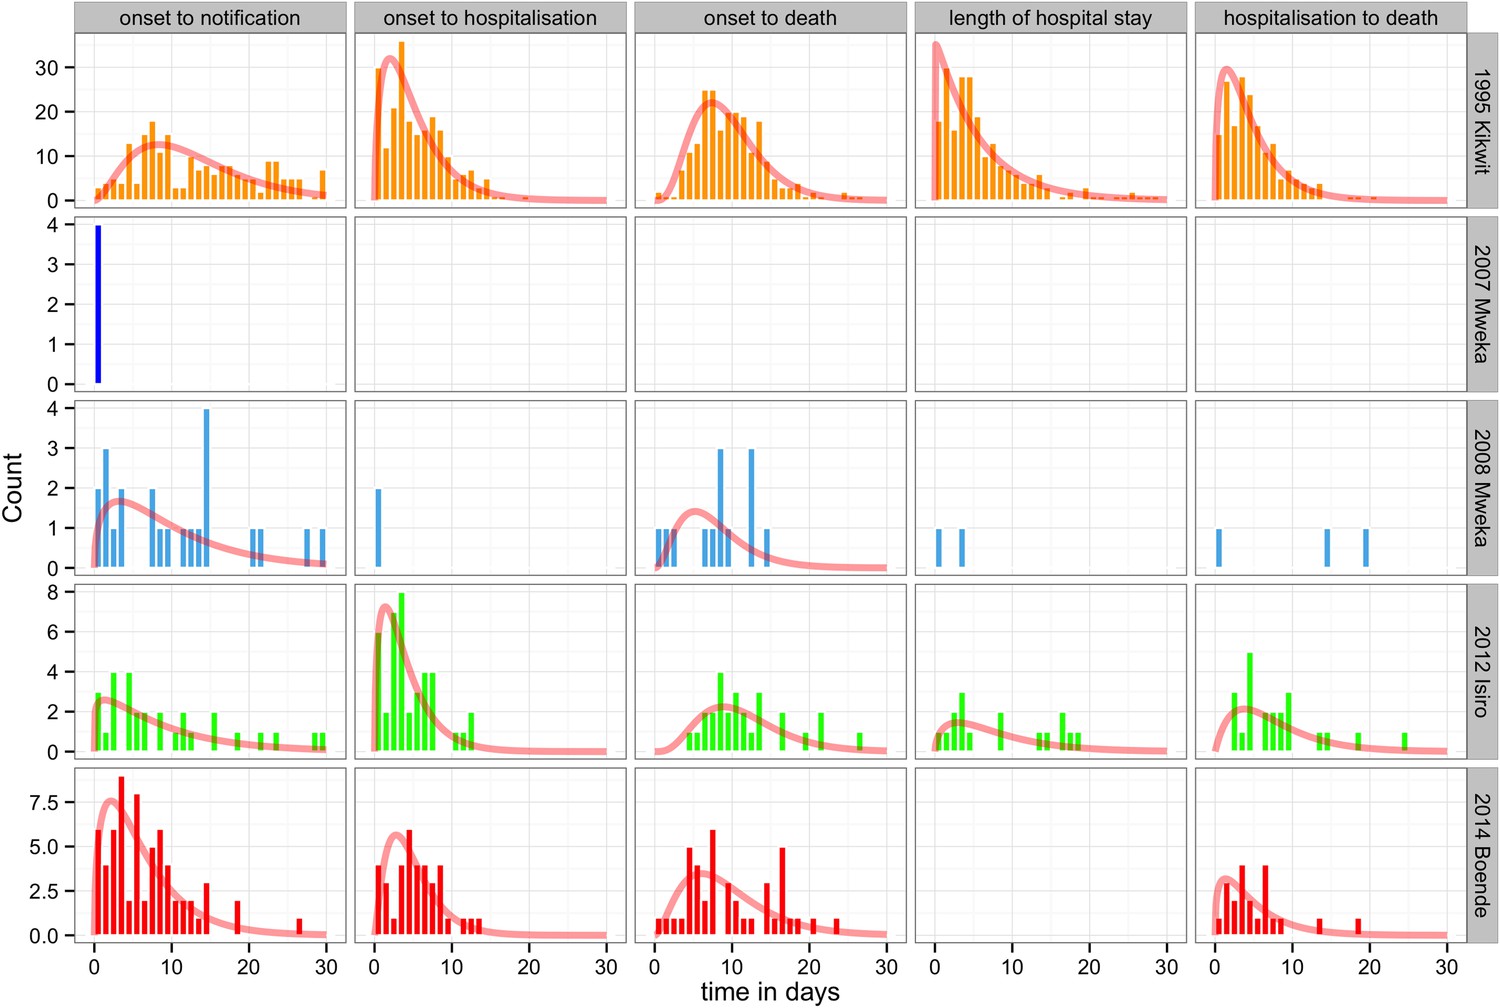
Delay distributions for the EVD outbreaks in the DRC.
The bars represent the observed frequency distributions of the delay from onset of symptoms to notification, onset of symptoms to hospitalisation, onset of symptoms to death, length of hospitalisation, and date of hospitalisation to death. Delays were censored at 30 days. The red line represents the respective fit of a gamma distribution.
Tables
Table 1
Main characteristics of the outbreaks
| Yambuku | Tandala | Kikwit | Mweka 07 | Mweka 08/09 | Isiro | Boende | |
|---|---|---|---|---|---|---|---|
| Ecosystem | Tropical rain forest | Rainforest/savannah | Urban/peri-urban | Forested savannah | Forested savannah | Tropical area of savannah scattered with gallery forests | Tropical rainforest |
| Inhabitants | Small villages <500 residents | Small village | Villages and city of 200,000 | 170,000 | 170,000 | 700,000 exposed | 250,000 in Boende but most cases living in small villages |
| Start | Aug-76 | Jun-76 | Jan-95 | Apr-07 | Nov-08 | Jun-12 | Aug-12 |
| End | Oct-76 | Jun-76 | Jun-95 | Oct-07 | Jan-09 | Nov-12 | Oct-12 |
| Healthcare facility involved in history | Yambuku Catholic Mission Hospital | – | Kikwit II Maternity Unit and Kikwit General Hospital | – | Kaluamba health centre, injections clandestine nurse from Kaluamba | Chemin de Fer des Uélé clinic (Isiro), Isiro General Reference Hospital | Antenatal care in her village, Miracle centre in Isaka, Lokolia health centre |
| Index case detected? | No | No | Possible: charcoal maker who worked in the forest | No | No | No | No |
Table 2
Distribution of cases and deaths by type and overall case-fatality ratios per outbreak
| Yambuku (1976) | Kikwit (1995) | Mweka (2007) | Mweka (2008/9) | Isiro (2012) | Boende (2014) | All outbreaks | |
|---|---|---|---|---|---|---|---|
| Cases (n) | |||||||
| Suspected | – | – | – | – | 0 | 2 | 2 |
| Probable | – | 317 | – | 22 | 16 | 28 | 383 |
| Confirmed | – | – | 24 | 10 | 36 | 38 | 108 |
| Total | 318* | 317 | 264 | 32 | 52 | 68 | 733 |
| Deaths (n) | |||||||
| Suspected | – | – | – | – | 0 | 0 | 0 |
| Probable | – | – | – | 12 | 15 | 28 | 55 |
| Confirmed | – | – | 17 | 2 | 13 | 21 | 53 |
| Total | 280* | 248 | 187 | 14 | 28 | 49 | 526 |
| Case-fatality ratio | |||||||
| (%, 95% CI) | 88* | 78 (73–83) | 74 (68–79) | 44 (26–62) | 54 (39–68) | 74 (62–84) | 79 (76–82) |
| Sex | |||||||
| (% Female, 95% CI) | 59 (53–65) | 54 (48–59) | 55 (48–61) | 72 (53–86) | 77 (63–87) | 53 (40–65) | 57 (54–60) |
-
Where the distinction between probable, confirmed, and suspected cases was available, the case-fatality ratio and % female were calculated with only probable and confirmed cases. Only cases for which outcomes were reported were included in the case-fatality ratio denominator.
-
*
The values presented in this table for Yambuku were taken from the literature, as our data are a subset of the total cases during the outbreak (262/318).
Table 3
Odds of dying from EVD
| OR | 2.50% | 97.50% | |
|---|---|---|---|
| Outbreak Isiro 2012 | 0.89 | 0.31 | 2.59 |
| Outbreak Kikwit 1995 | 5.44 | 1.43 | 21.87 |
| Age [0, 5) | 1.12 | 0.23 | 6.63 |
| Age [5, 15) | 0.2 | 0.05 | 0.7 |
| Months since first case | 0.69 | 0.48 | 0.97 |
| Delay onset to hospitalisation | 1.11 | 1.02 | 1.21 |
-
EVD, Ebola virus disease.
-
Estimated through binomial regression with age group and year of outbreak as factorial covariates and the number of months since the start of the outbreak and the delay from symptom onset to hospitalisation as continuous covariates.
Table 4
Odds of dying from EVD
| Covariates | OR | 2.50% | 97.50% |
|---|---|---|---|
| Outbreak Isiro 2012 | 0.67 | 0.29 | 1.55 |
| Outbreak Kikwit 1995 | 4.63 | 1.96 | 10.94 |
| Outbreak Mweka 2007 | 3.83 | 1.61 | 9.18 |
| Outbreak Mweka 2008 | 0.25 | 0.1 | 0.63 |
| Outbreak Yambuku 1976 | 7.11 | 3.13 | 16.75 |
| Age [0, 5) | 2.49 | 1.12 | 6.34 |
| Age [5, 15) | 0.36 | 0.21 | 0.63 |
| Months since first case | 0.65 | 0.54 | 0.77 |
-
EVD, Ebola virus disease.
-
Estimated through binomial regression with age group and year of outbreak as factorial covariates and the number of months since the start of the outbreak as continuous covariate.
Table 5
Mean values and standard deviations corresponding to the delay distributions
| Outbreak | Delay | Mean | SD |
|---|---|---|---|
| 1995 Kikwit | Onset to notification | 12.91 | 7.72 |
| 1995 Kikwit | Onset to hospitalisation | 5.02 | 3.91 |
| 1995 Kikwit | Onset to death | 9.47 | 4.44 |
| 1995 Kikwit | Length of hospital stay | 5.72 | 5.67 |
| 1995 Kikwit | Hospitalisation to death | 4.5 | 3.69 |
| 2007 Mweka | Onset to notification | 0 | 0 |
| 2008 Mweka | Onset to notification | 10.04 | 8.47 |
| 2008 Mweka | Onset to hospitalisation | 0 | 0 |
| 2008 Mweka | Onset to death | 7.62 | 4.44 |
| 2008 Mweka | Length of hospital stay | 1.5 | 2.12 |
| 2008 Mweka | Hospitalisation to death | 11 | 9.85 |
| 2012 Isiro | Onset to notification | 8.83 | 8.29 |
| 2012 Isiro | Onset to hospitalisation | 4 | 3.27 |
| 2012 Isiro | Onset to death | 11.37 | 5.41 |
| 2012 Isiro | Length of hospital stay | 8 | 6.56 |
| 2012 Isiro | Hospitalisation to death | 7.59 | 5.52 |
| 2014 Boende | Onset to notification | 6.23 | 5.08 |
| 2014 Boende | Onset to hospitalisation | 4.95 | 3.32 |
| 2014 Boende | Onset to death | 9.39 | 5.67 |
| 2014 Boende | Hospitalisation to death | 4.86 | 4.23 |
-
Delays distributions (delay from onset of symptoms to notification, onset of symptoms to hospitalisation, onset of symptoms to death, length of hospitalisation and date of hospitalisation to death).
Additional files
-
Supplementary file 1
Aggregated line list for all outbreaks in the Democratic Republic of the Congo.
- https://doi.org/10.7554/eLife.09015.017
-
Supplementary file 2
Repository of the interventions carried out during all outbreaks in the Democratic Republic of the Congo.
- https://doi.org/10.7554/eLife.09015.018
Download links
A two-part list of links to download the article, or parts of the article, in various formats.
Downloads (link to download the article as PDF)
Open citations (links to open the citations from this article in various online reference manager services)
Cite this article (links to download the citations from this article in formats compatible with various reference manager tools)
Ebola virus disease in the Democratic Republic of the Congo, 1976-2014
eLife 4:e09015.
https://doi.org/10.7554/eLife.09015


