AMPA receptor mediated synaptic excitation drives state-dependent bursting in Purkinje neurons of zebrafish larvae
- National Centre for Biological Sciences, India
Figures
Figure 1
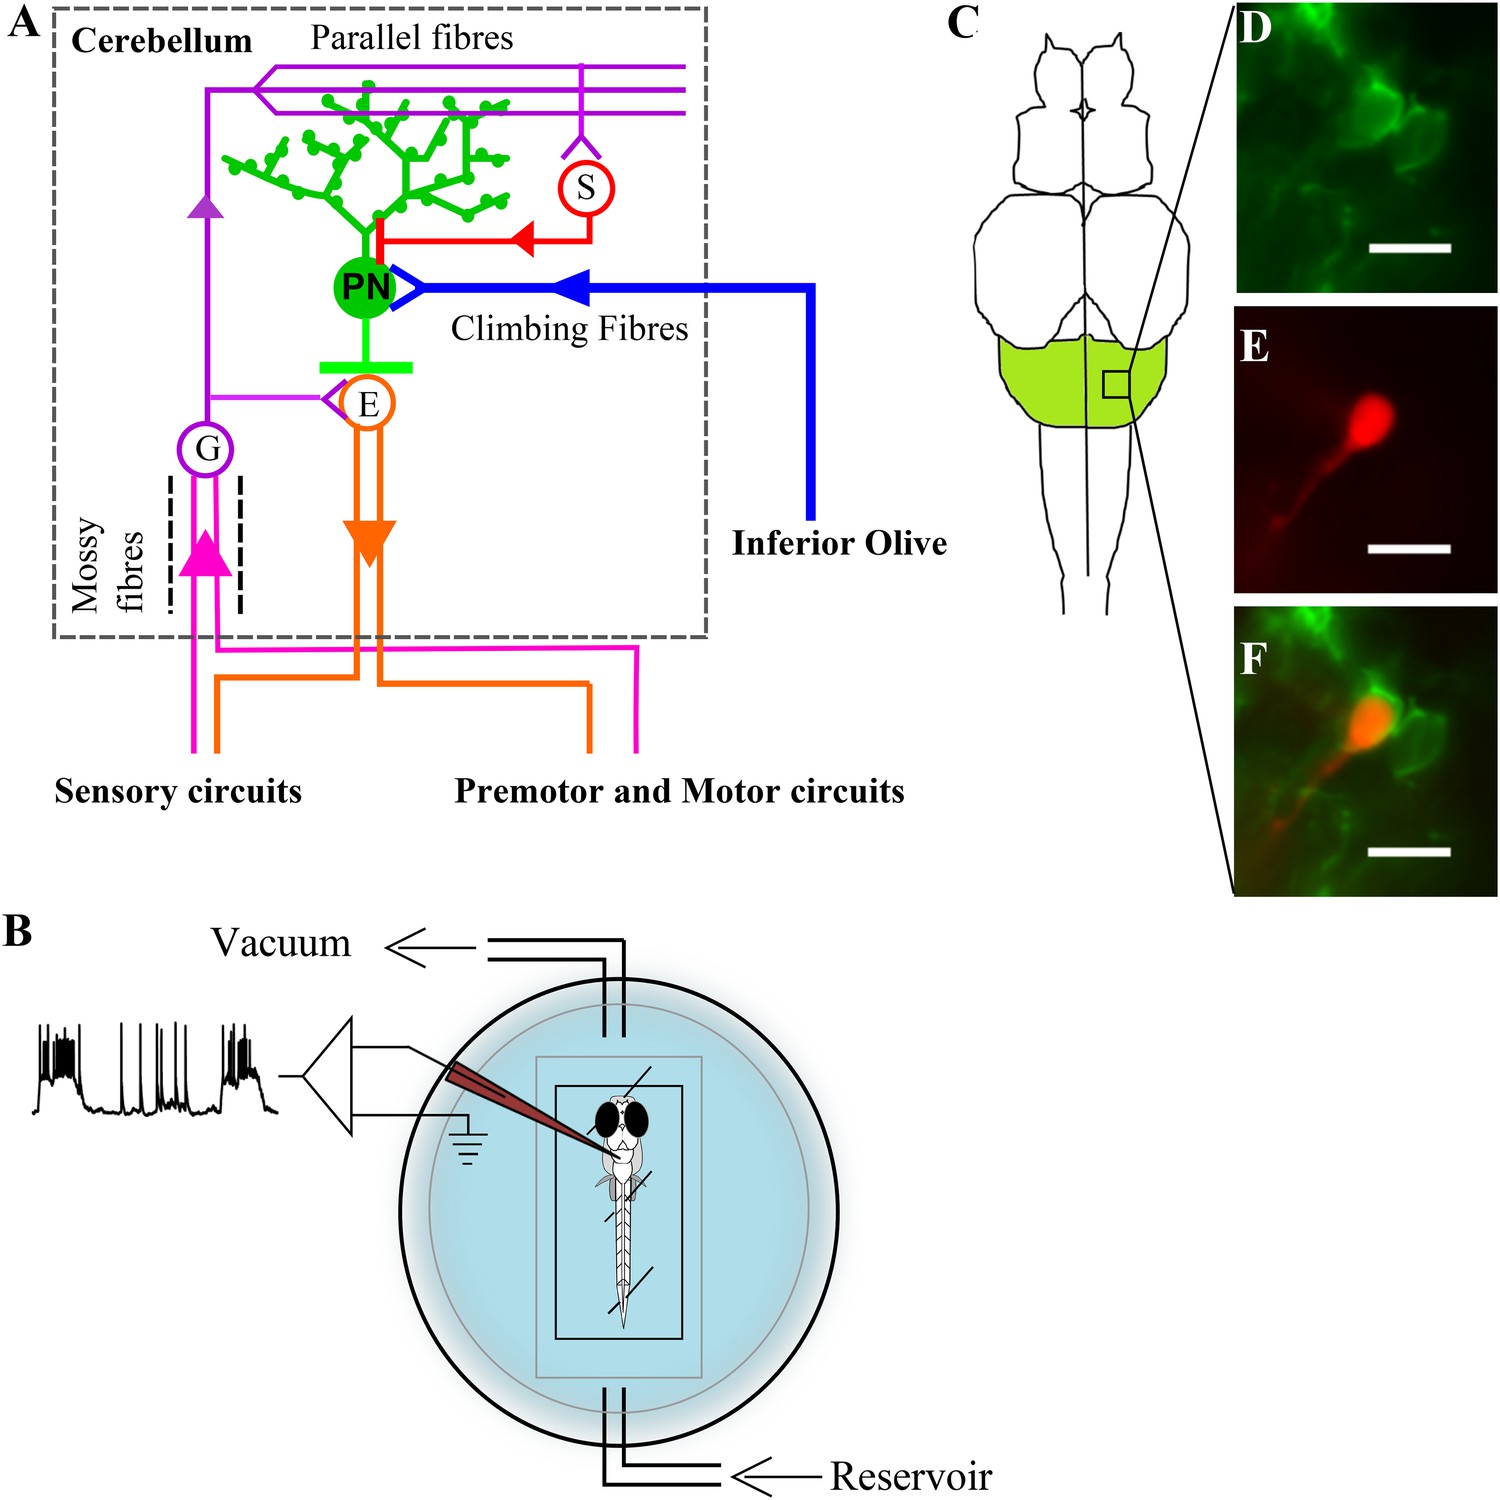
Zebrafish cerebellar circuitry and experimental preparation.
(A) Schematic of the cerebellar circuitry in zebrafish. PN: Purkinje neuron; E: Eurydendroid cell; G: Granule cell; S: Stellate cell. (B) Schematic of the set up for in vivo whole cell recordings in unanesthetized zebrafish larvae. (C) Schematic of the zebrafish larval brain with the cerebellum in green. (D) Mosaic expression of aldoca:gap43-Venus in Purkinje neurons. (E) Patched cell shown filled with sulphorhodamine. (F) Co-localization of sulphorhodamine filled cell with membrane-targeted Venus expression. Scale bar = 10 μm.
Figure 2
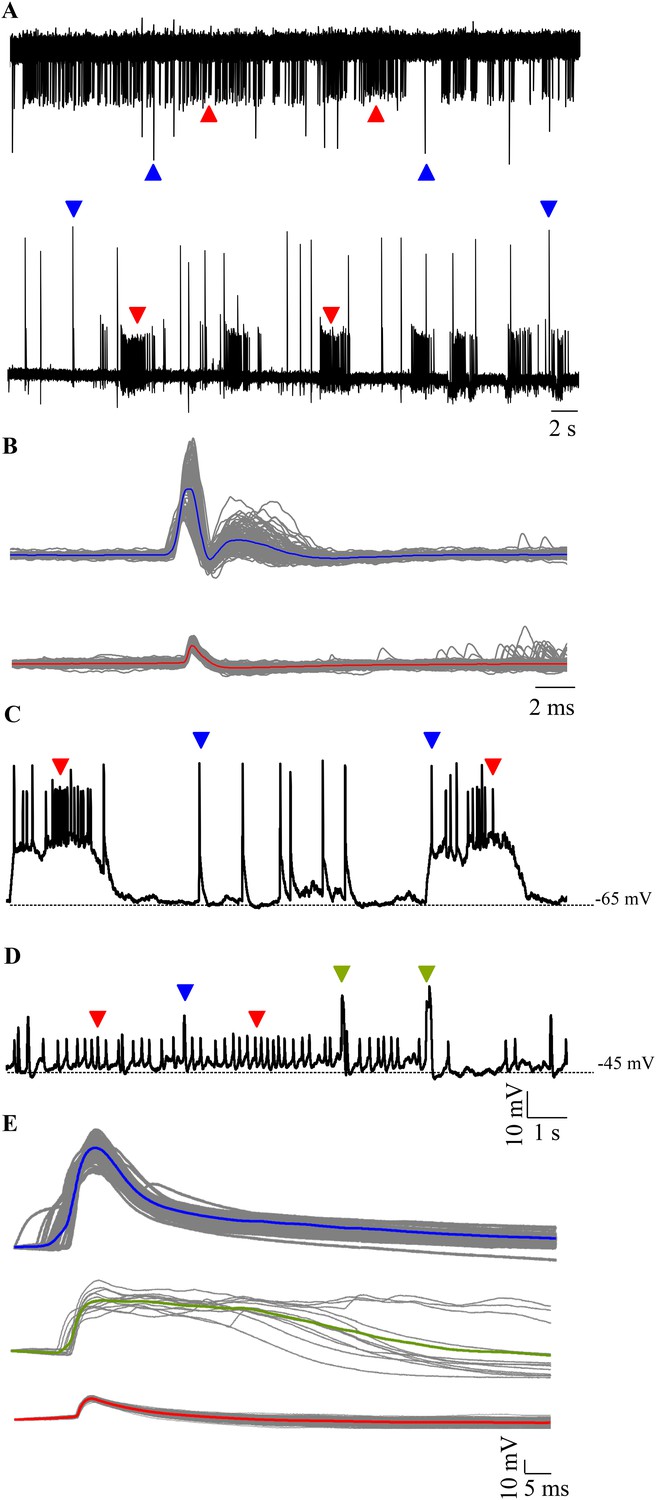
Spontaneous activity in Purkinje neurons.
(A) Representative traces of loose patch recording from a Purkinje neuron at 7 dpf showing tonic (top trace) and bursting (bottom trace) activity patterns. Small amplitude events (red arrowheads) interspersed with large amplitude events (blue arrowheads) can be seen. (B) Superimposed events of large amplitude (blue) and small amplitude (red) events from one cell showing the mean in the respective colour (N = 6 cells). (C–E) Intracellularly, Purkinje neurons show three types of events. Current clamp recordings of spontaneous activity at −65 mV (C) and −45 mV (D) showing large amplitude events (blue arrowheads, C, D), small amplitude narrow spikes (red arrowheads, C, D) and broad spikes (green arrowheads, D). (E) Superimposed events from one cell with mean shown in the respective colour for each type of event.
Figure 3 with 2 supplements
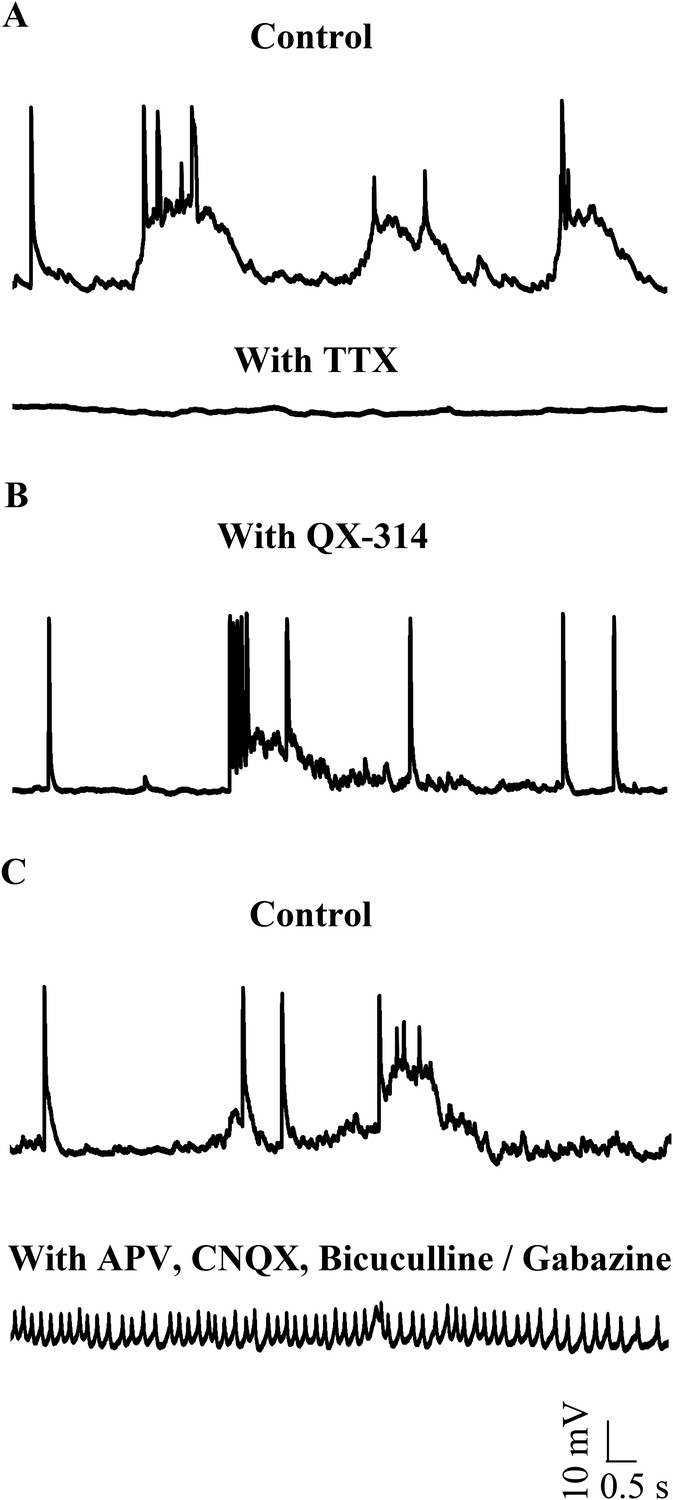
Small events are sodium dependent action potentials.
(A) Tetrodotoxin (TTX) abolishes sodium action potentials in Purkinje neurons (N = 3 cells). Representative trace from one cell in the absence (top trace) and presence (bottom trace) of 1 μM TTX. This cell rested at −60 mV. (B) QX-314 also abolishes sodium action potentials (N = 5 cells). Representative trace from one cell showing absence of sodium spikes. This cell rested at −53 mV. (C) Narrow sodium action potentials occur even in the presence of synaptic receptor blockers (N = 5 cells). Representative trace from one cell in the absence (top trace) and presence (bottom trace) of APV, CNQX and Bicuculline or Gabazine. This cell rested at −42 mV.
Figure 3—figure supplement 1
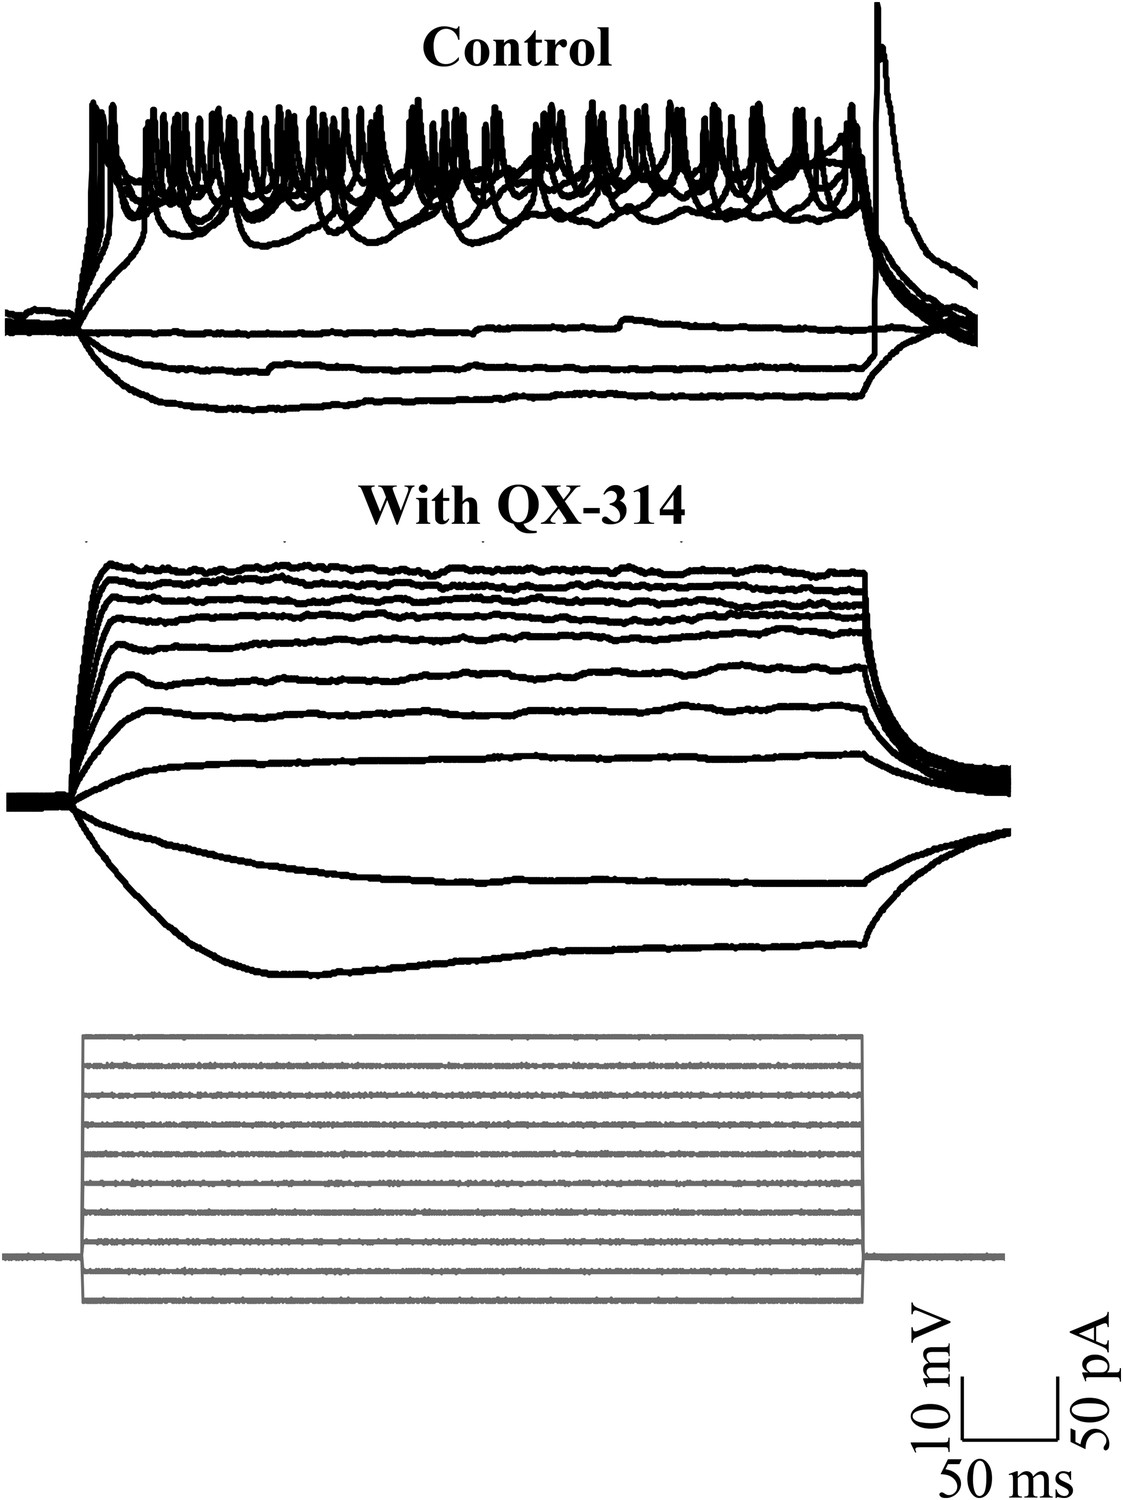
Sodium action potentials are recruited during depolarizing current injections (N = 5 cells in each condition).
Representative traces showing cellular response to the current injection protocol (grey, bottom panel) in control (top panel) and in the presence of QX-314 (middle panel). The cell in control rested at −52 mV and the cell in QX-314 rested at −53 mV.
Figure 3—figure supplement 2
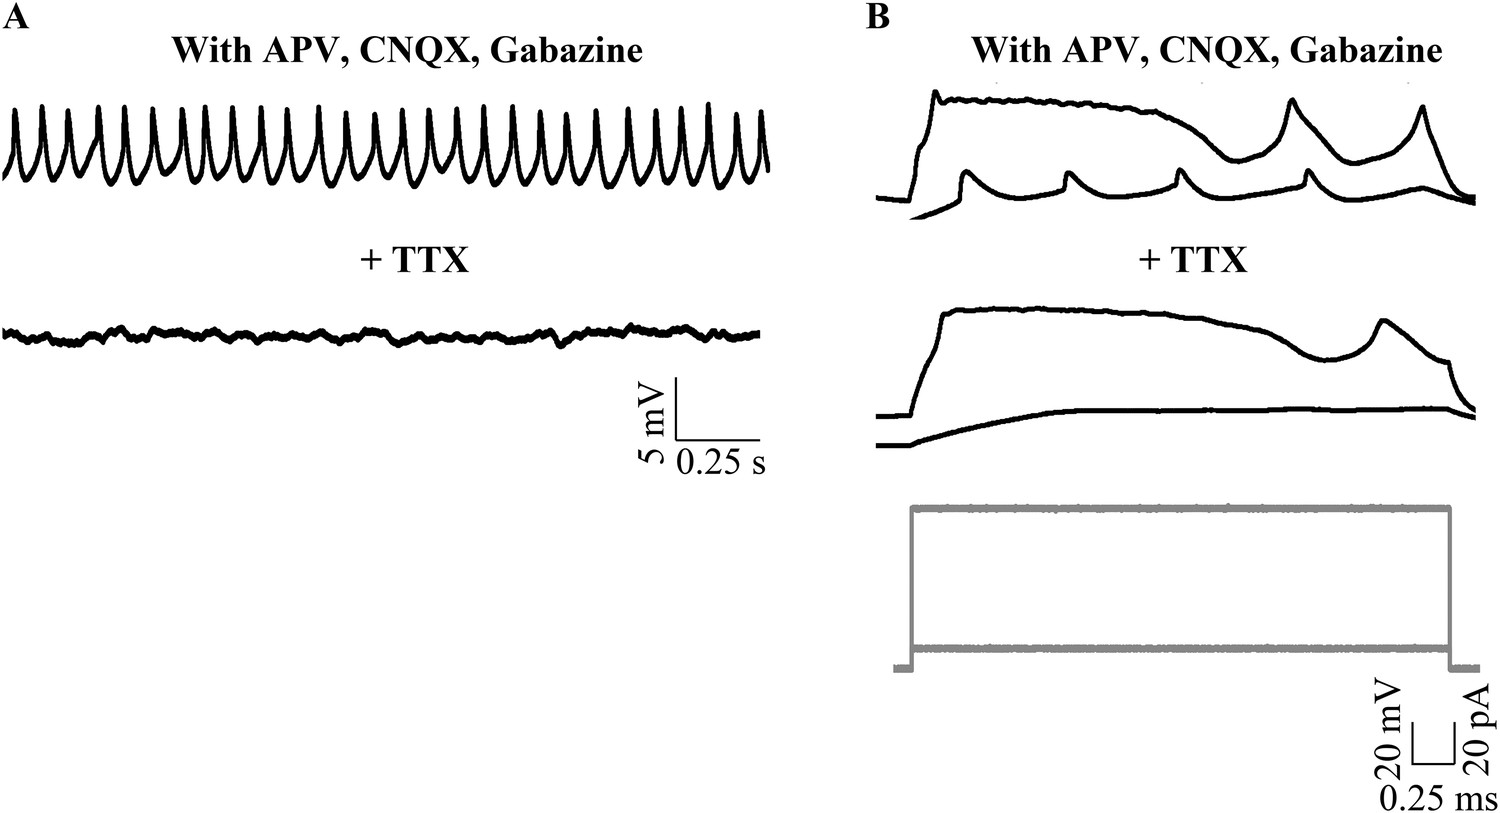
Narrow spikes observed in the presence of synaptic receptor blockers are abolished by TTX.
(A) Representative traces from the same cell showing narrow spikes in the presence of synaptic receptor blockers (top trace) that are abolished with bath application of TTX (bottom trace). (B) Cellular response to current injection protocol (grey, bottom panel) showing both narrow and broad spikes being recruited in the presence of synaptic receptor blockers (top panel). Narrow spikes and not broad spikes are abolished by bath application of TTX (middle panel). This cell rested at −40 mV.
Figure 4
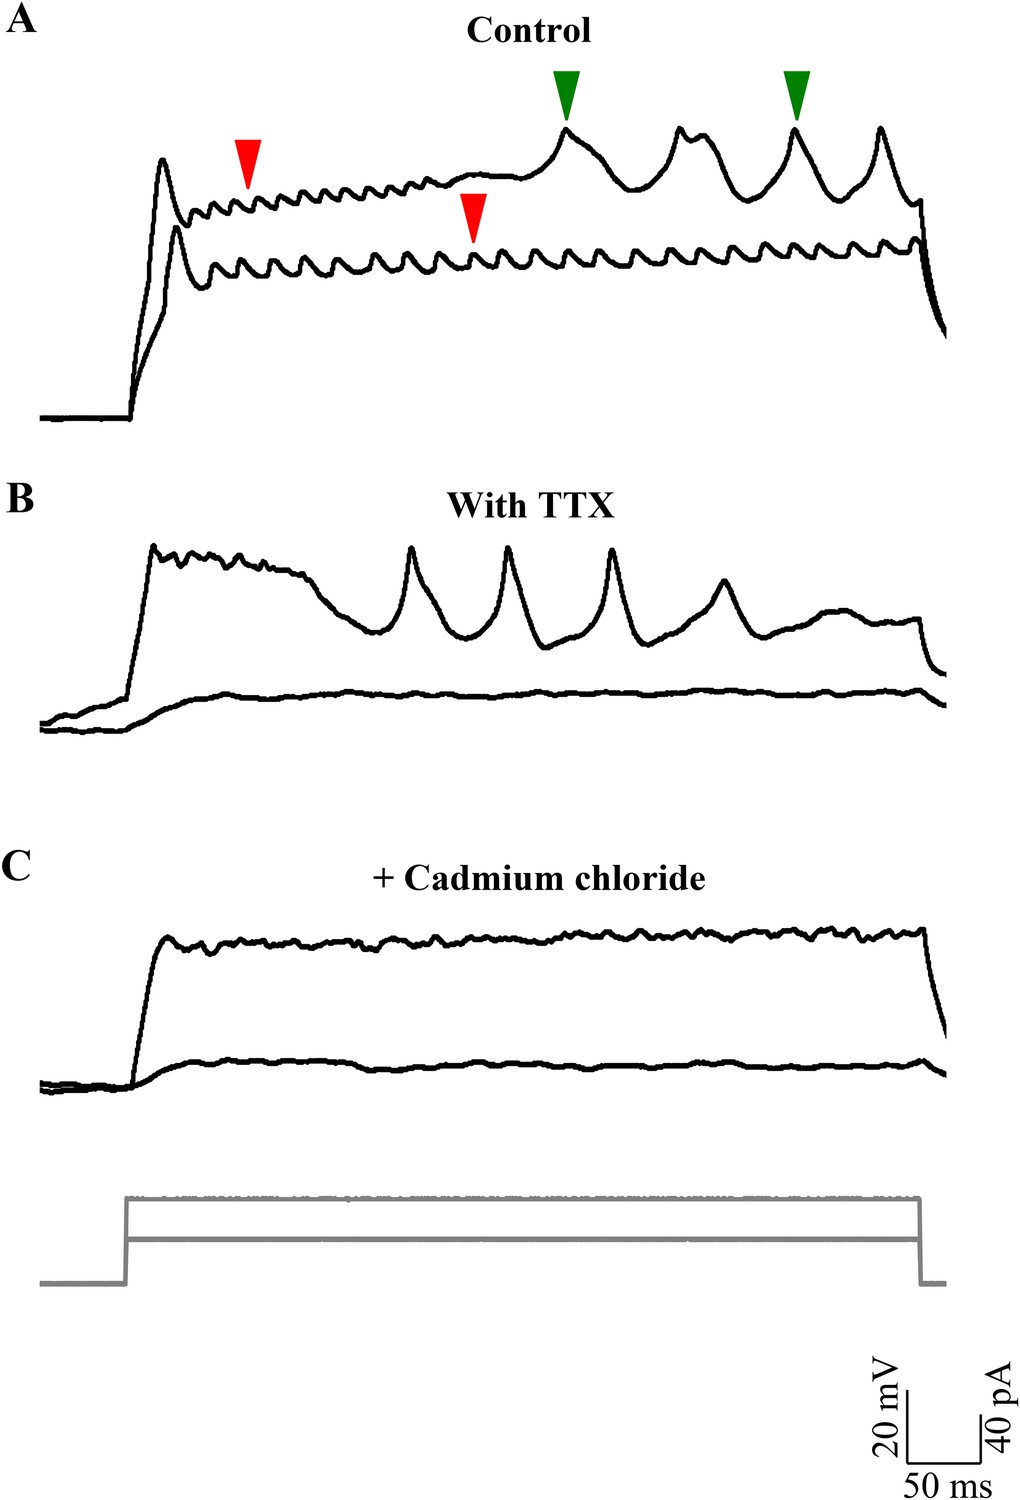
Broad events are calcium spikes.
(A) Calcium spikes have higher rheobase than sodium spikes (N = 8 cells). Representative trace of current clamp recordings of cellular response from one cell to current injections (grey, bottom panel) showing calcium spikes (green arrowheads) being recruited at higher level of depolarization than sodium spikes (red arrowheads). (B) Representative traces of current clamp recordings from another cell in TTX to the same current injection protocol as in A. (C) Responses shown by the same cell as in B after 200 µM cadmium chloride was added to the bath (N = 4 cells).
Figure 5 with 2 supplements
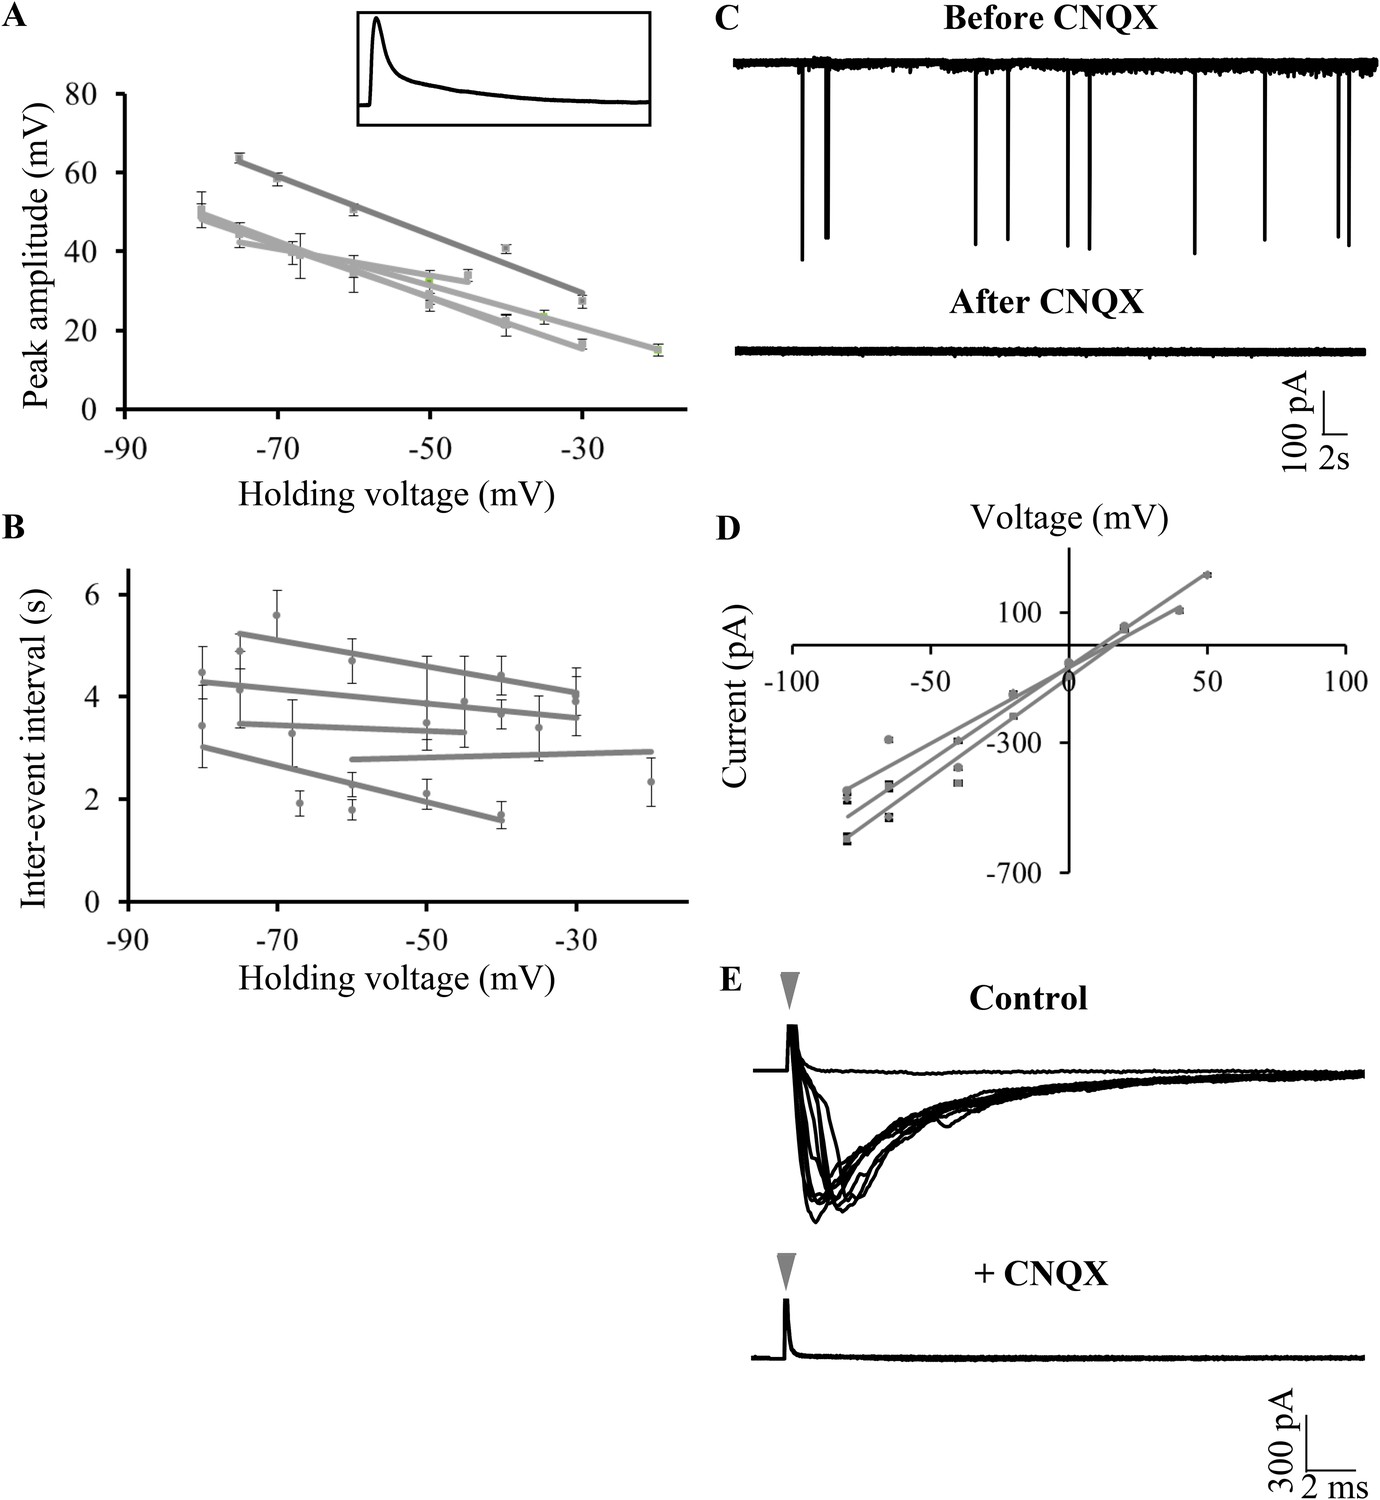
Large amplitude events are climbing fiber (CF) EPSPs mediated by AMPARs.
(A) Mean peak amplitude of large amplitude events as a function of the holding potential. Inset: Expanded trace of a single large amplitude event to illustrate the slow kinetics and large amplitude. Inset x-axis: 400 ms; y-axis: 47 mV. (B) Mean inter-event interval as a function of holding potential. Error bars indicate standard error of mean in A and B (N = 5 cells). (C) Representative trace of a Purkinje neuron recorded in voltage clamp mode at −65 mV before and after application of CNQX. (D) Current-voltage relation of CF EPSCs (N = 3 cells). (E) Representative trace showing all-or-none EPSCs upon stimulation of CFs in the presence of APV and Gabazine (top trace; N = 7 cells). Stimulation at 500 μA resulted in either transmission failure (flat line) or EPSCs of similar amplitudes. In the same cell, all-or-none EPSCs were abolished by the addition of CNQX (bottom trace; N = 5 cells). Grey arrowhead shows stimulus artifact.
Figure 5—figure supplement 1
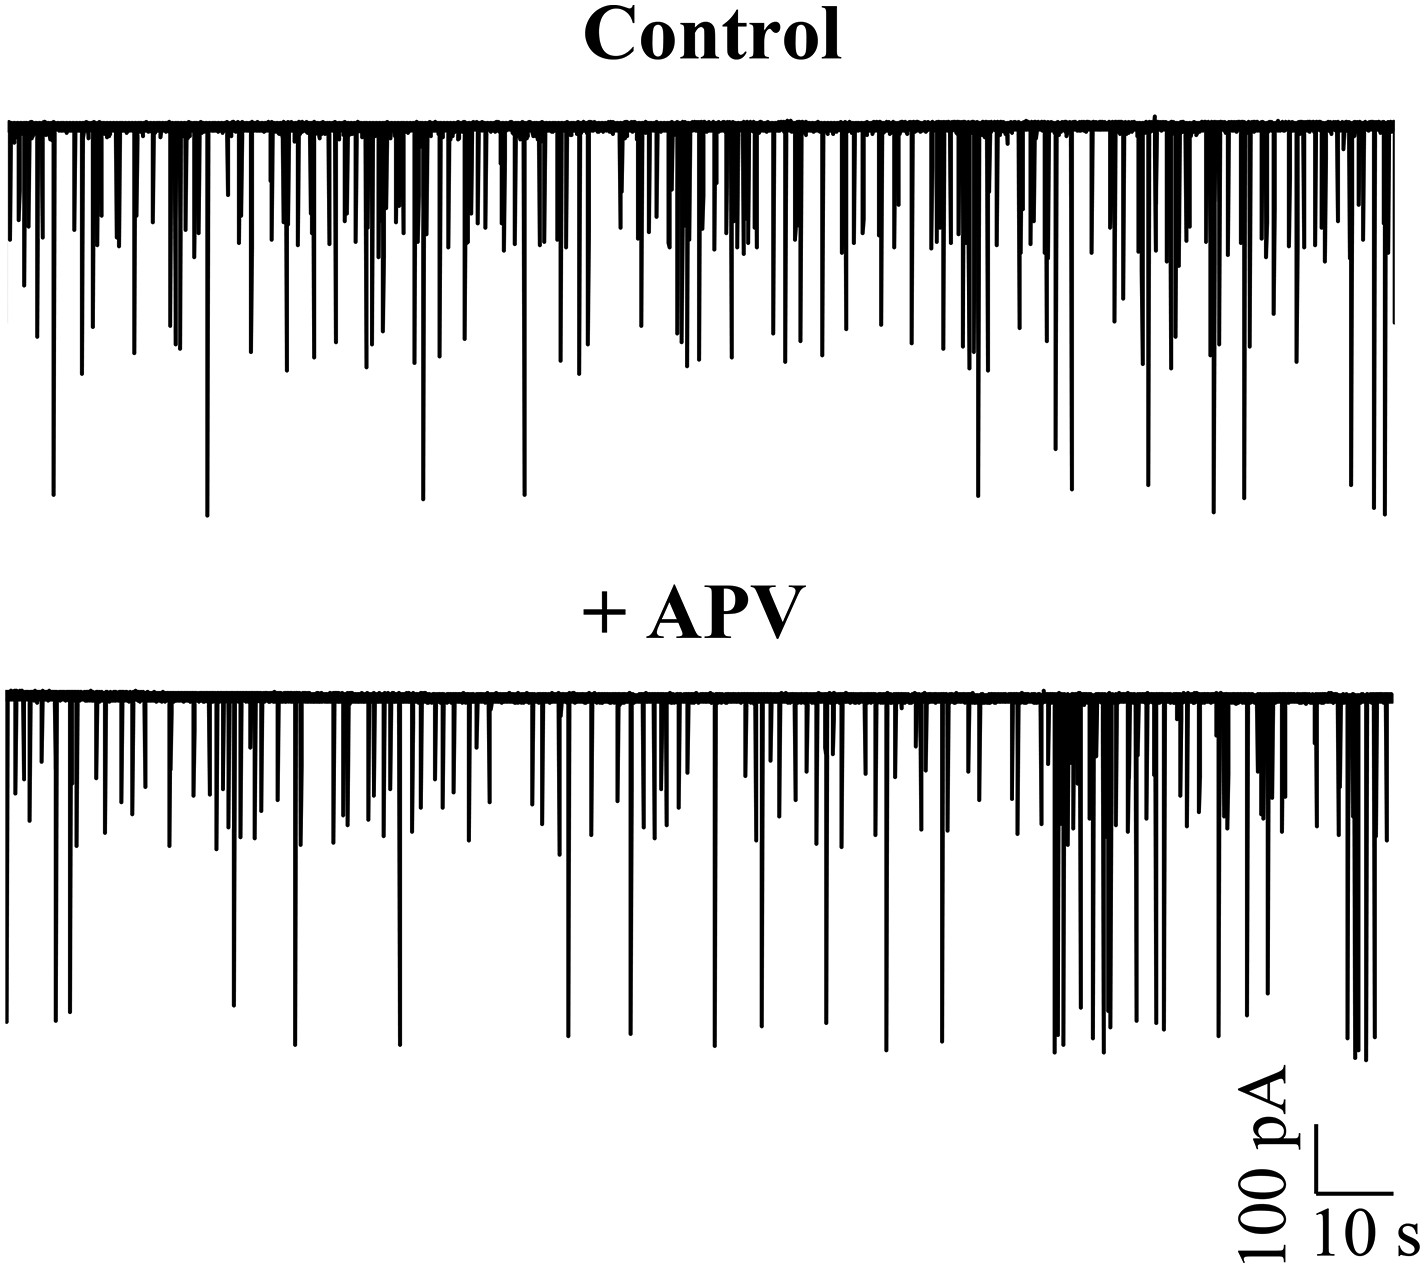
Large amplitude events do not require activation of NMDA receptors.
Representative trace of a Purkinje neuron recorded in voltage clamp mode at −65 mV in the absence (top trace) and presence of APV (N = 5 cells).
Figure 5—figure supplement 2
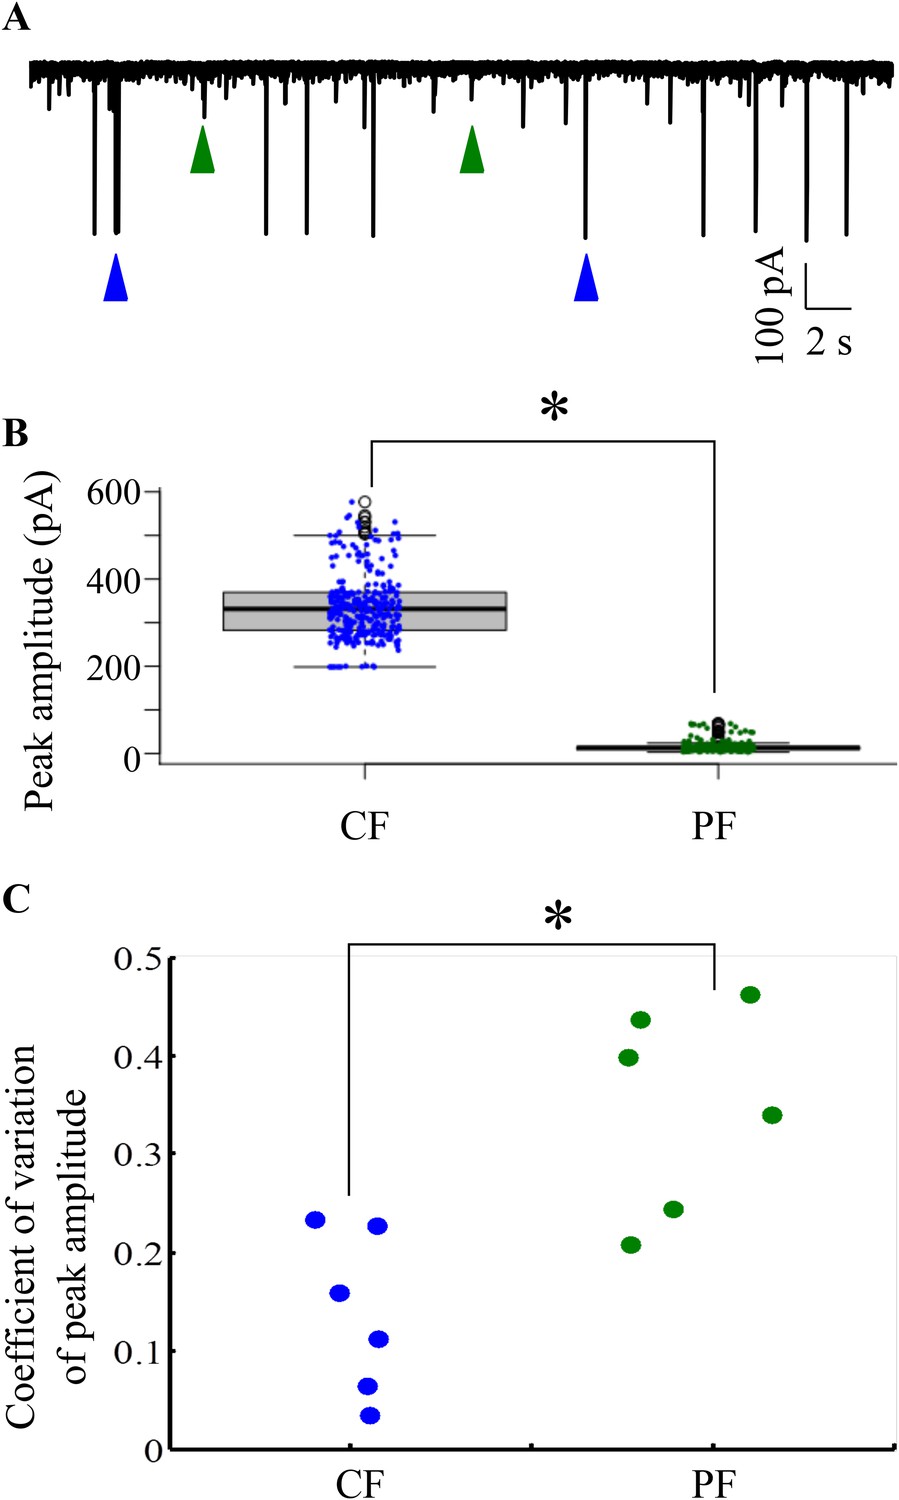
CF and PF glutamatergic synaptic inputs are clearly distinguishable.
(A) Representative trace from one cell held at −65 mV showing large amplitude (blue arrowheads) and small amplitude (green arrowheads) EPSCs. (B) Box plot showing distribution of peak amplitudes of large amplitude, CF and small amplitude parallel fiber (PF) EPSCs. Solid black line indicates median values and shaded grey boxes show inter-quartile ranges. (C) Coeffecient of variation (CV) of peak amplitudes of CF and PF EPSCs (N = 6 cells).
Figure 6
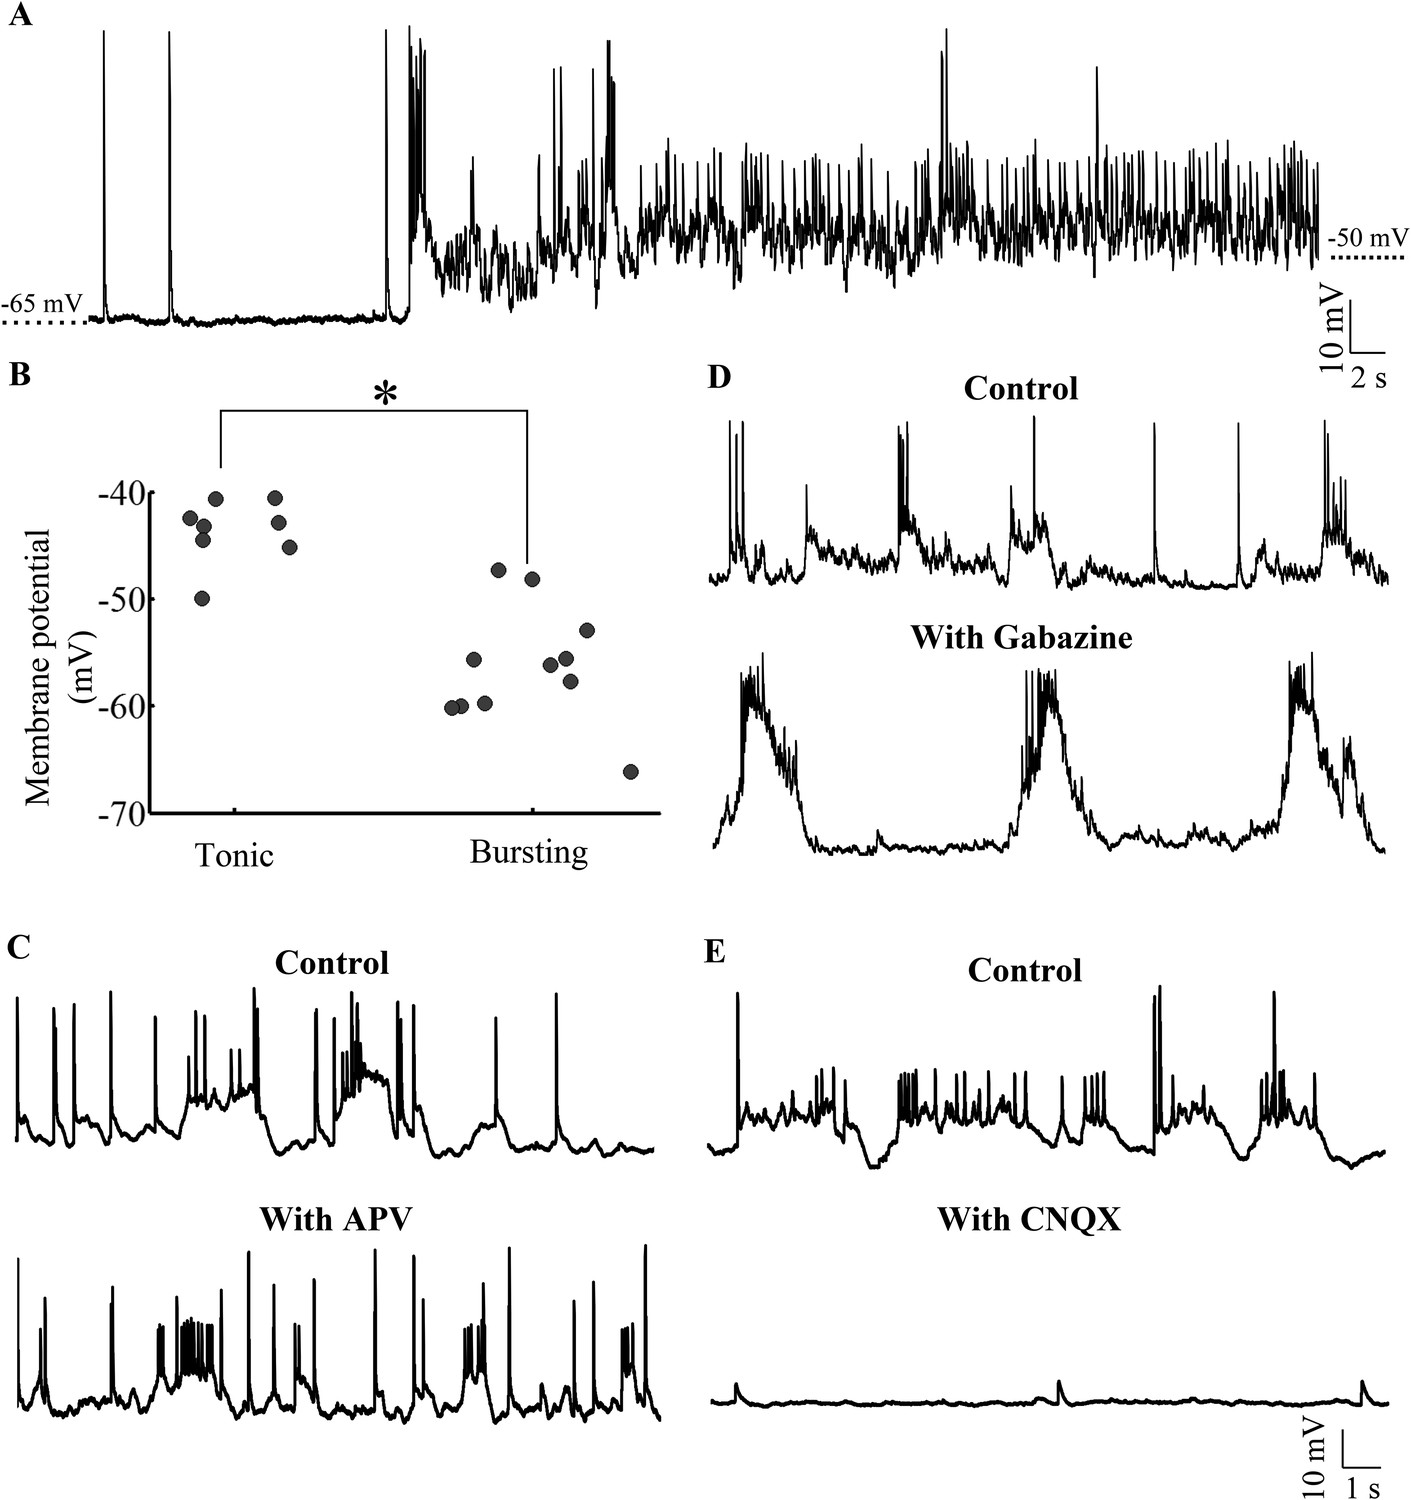
Purkinje neurons toggle between bursting and tonic states as a function of membrane potential and AMPAR-mediated synaptic input.
(A) Representative trace of a bursting cell (bursts not shown) which rested at −65 mV spontaneously depolarizing and spiking tonically. (B) Scatter plot of membrane potential of cells in tonic vs bursting modes showing that tonic modes occur at more depolarized potentials than bursting mode (N = 8 cells for tonic mode and 11 cells for bursting mode). (C) Representative trace of a cell in the absence (top trace) and presence (bottom trace) of APV. This cell rested at −58 mV (N = 6 cells). (D) Representative trace of a cell in the absence (top trace) and presence (bottom trace) of Gabazine. This cell rested at −57 mV (N = 10 cells). (E) Representative trace of a cell in the absence (top trace) and presence (bottom trace) of CNQX. This cell rested at −60 mV (N = 12 cells).
Figure 7
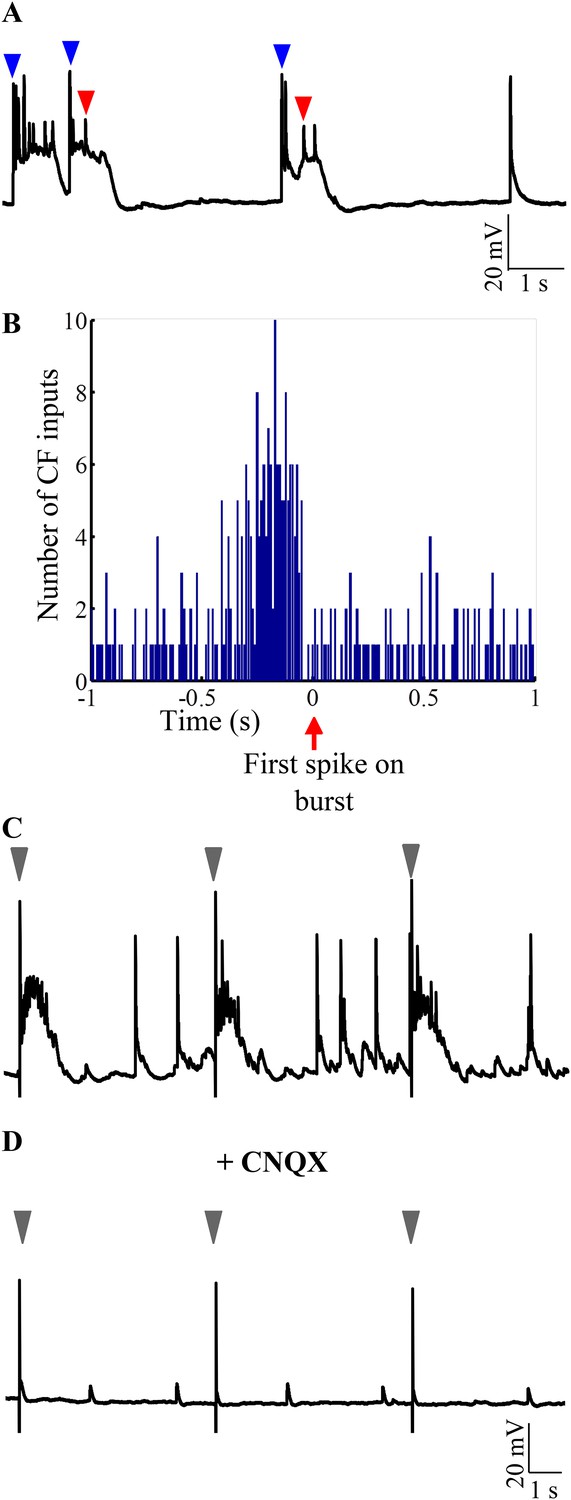
Bursting is triggered by AMPAR-mediated olivary synaptic inputs.
(A) Representative trace showing CF EPSPs (blue arrowheads) occurring near burst onset as defined by the first sodium spike (red arrowhead). (B) Peri-event time histogram showing CF EPSPs clustered before the start of bursts. For every burst onset as defined by the first sodium spike, the number of CF EPSPs within a 10 s window was calculated in bins of 10 ms. This was repeated for five cells and the results pooled. Only a 2 s window around burst onset is shown for greater clarity. (C) Representative trace showing that stimulation of CF triggers bursts. The stimulus intensity was set in voltage clamp mode at a value that did not yield any failures (N = 5 cells). (D) Same cell after CNQX was added to the bath solution. Grey arrowheads indicate stimulus artifacts in C and D.
Figure 8
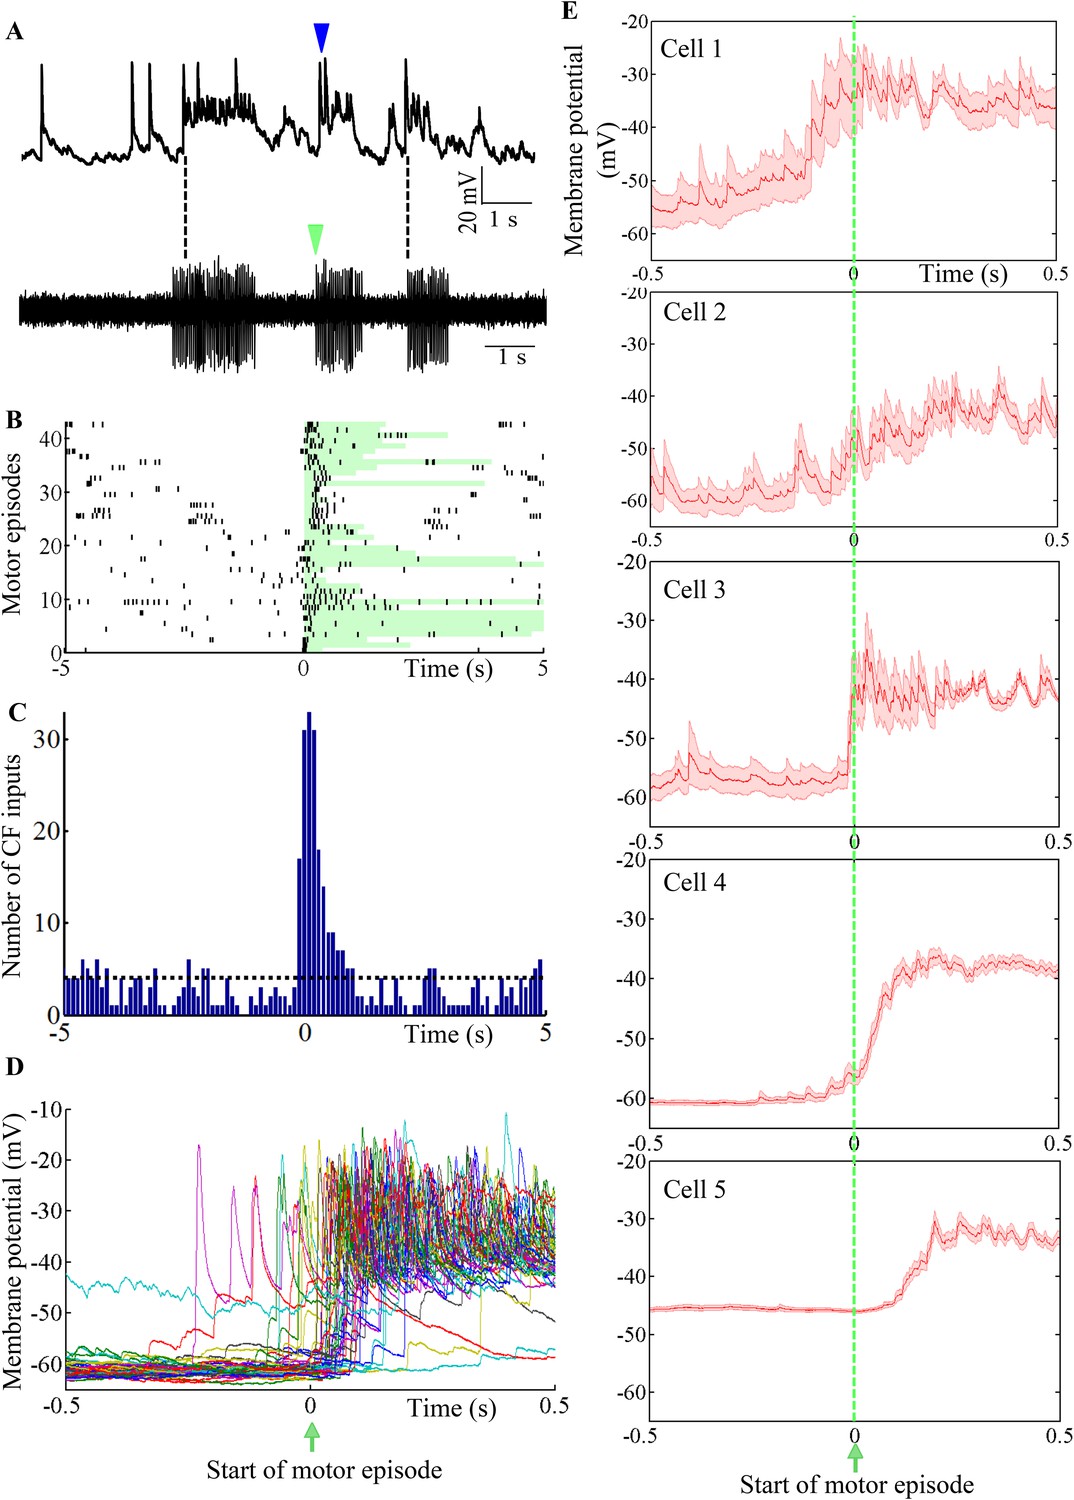
Purkinje neuron bursts are timed to occur with motor neuron bursts.
(A) Representative trace showing intracellular recording from a Purkinje neuron (top trace) and suction electrode recording from axial myotomes (bottom trace). Purkinje neuron bursts (blue arrowhead) occur together with initiation of motor episodes (green arrowheads). (B) Raster plot of CF inputs (black bars) in a 10 s window around the start of motor episodes (0 on x-axis). The duration of each motor episode is shown as a pale green bar. The plot shows data from 43 motor episodes arranged on the y-axis. CF-EPSPs from 5 Purkinje neurons were plotted. (C) Peri-event time histogram showing CF inputs clustered at the beginning of the motor episode (0 on x-axis). For every motor episode, the number of CF inputs within a 10 s window was calculated in bins of 100 ms. This was repeated for five cells and the results pooled. The dashed line indicates the average CF number per bin. (D) Voltage traces from a Purkinje neuron in a 1 s window around the start of motor episodes (0 on x-axis). 38 traces have been aligned and overlaid by placing the respective motor episode initiation at 0 s. (E) Same plot as in D for each of 5 Purkinje neurons. However, average membrane potential (red line) and standard error of mean (pink shaded region) are shown instead. Cell 4 is the same as the one shown in D.
Figure 9
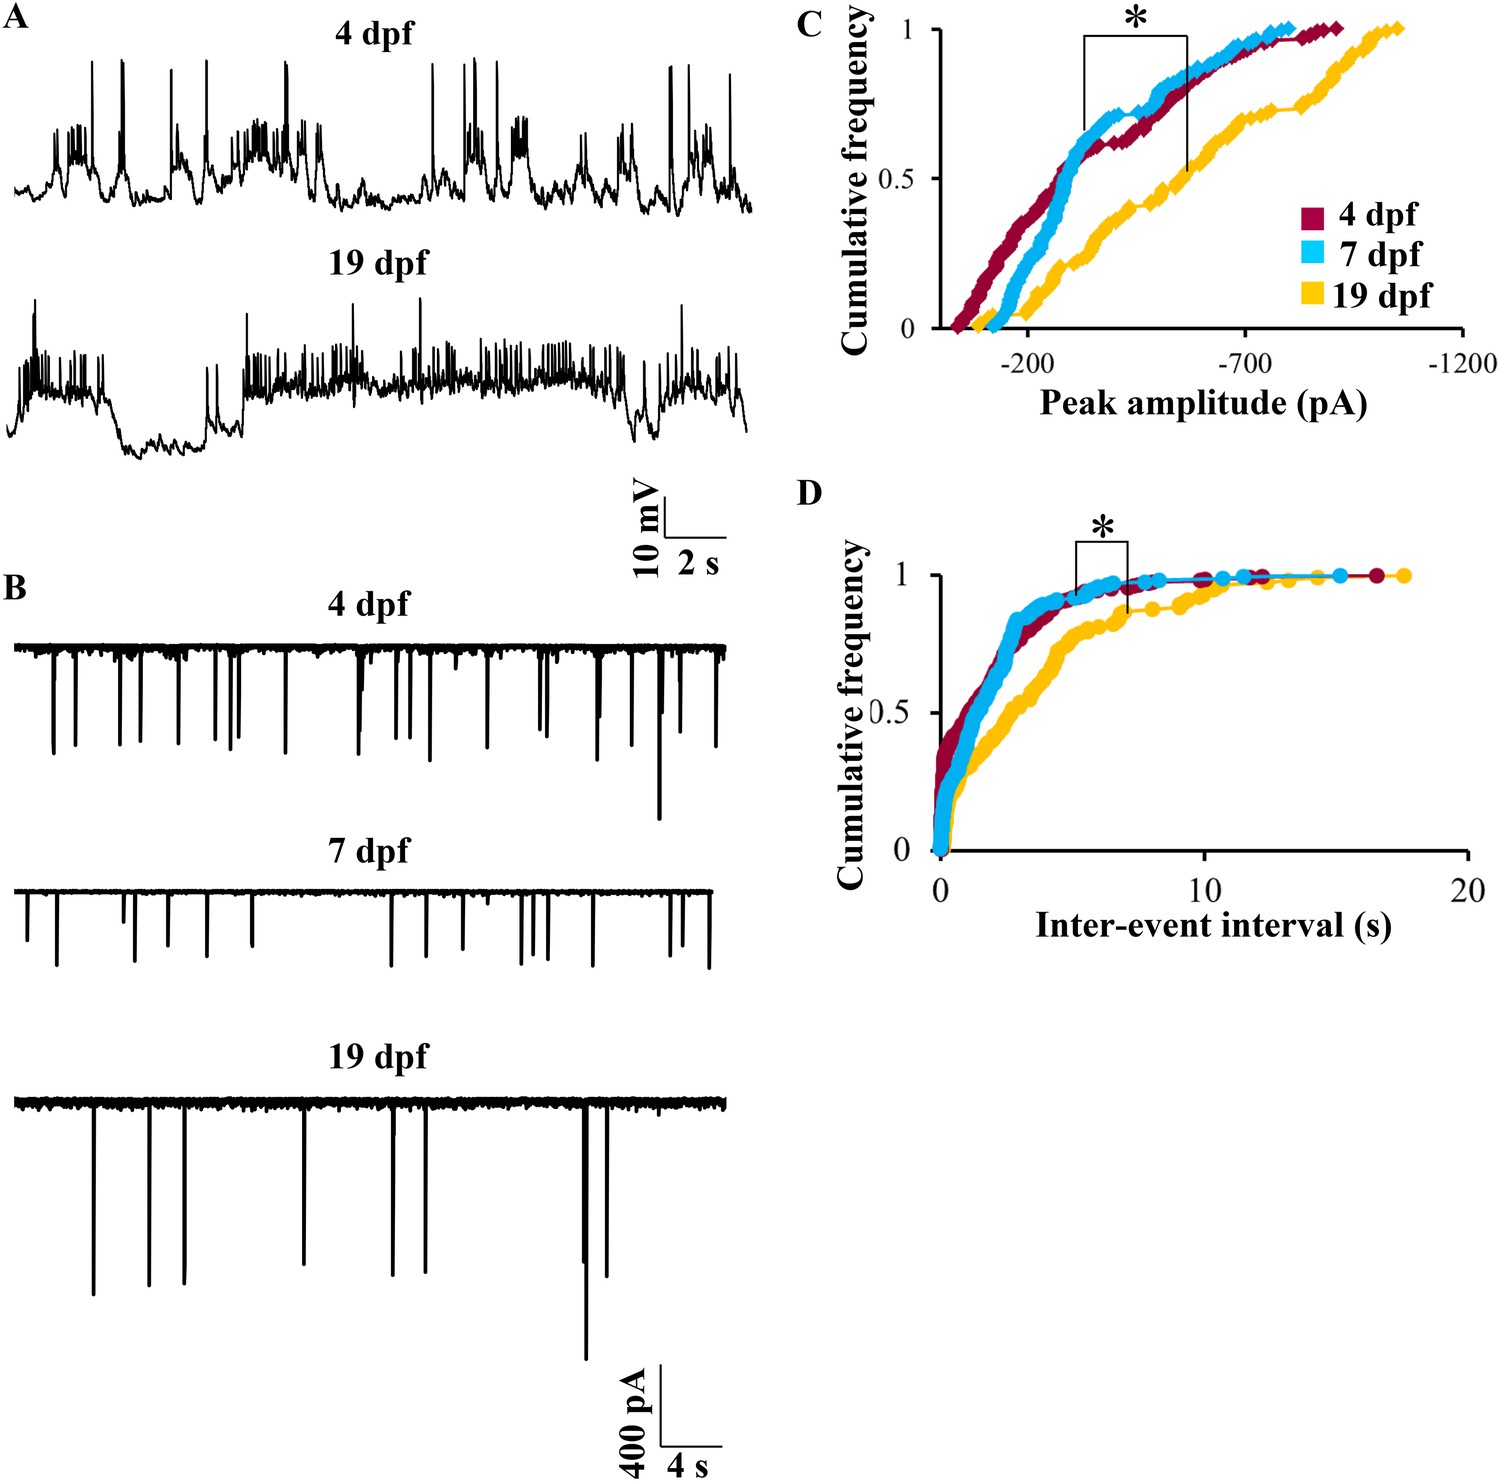
Bistability in Purkinje neurons appears soon after they are specified, but CF EPSC frequency is developmentally regulated.
(A) Representative trace of bursting at 4 dpf (top trace) and at 19 dpf (bottom trace). (B) Representative traces of CF inputs at three developmental stages: 4, 7 and 19 dpf. (C) Cumulative frequency of the peak amplitudes of CF EPSCs at −65 mV in the three stages of development. (D) Cumulative frequency of inter-event interval in the three stages. The three distributions were compared using Kruskal Wallis test with a significance level of 5% followed by Tukeys post hoc analysis for pairwise comparison of means. N = 9 cells at 4 dpf; 6 cells at 7 dpf and 10 cells at 19 dpf.
Tables
Table 1
Summary of properties of narrow spikes, broad spikes and large amplitude events observed in Purkinje neurons at 7 dpf (N = 13 cells)
| Narrow spikes (bursts, 1152 events) | Narrow spikes (tonic, 997 events) | Large amplitude events (758 events) | Broad spikes (79 events) | |
|---|---|---|---|---|
| Peak amplitude (mV) | 15.9 ± 0.17 | 11 ± 0.09 | 51.2 ± 0.25 | 32.8 ± 0.6 |
| Frequency (Hz) | 34.8 ± 4.5 | 11.7 ± 1.1 | 1.5 ± 0.07 | 5.6 ± 3.8 |
| Full width at half max. amp (ms) | 7.7 ± 0.1 | 11.4 ± 0.1 | 15.8 ± 0.3 | 64.7 ± 5.4 |
| Rise time, 10–90% (ms) | 3.1 ± 0.1 | 3.6 ± 0.1 | 2.2 ± 0.04 | 6.5 ± 1.2 |
-
Table 1—source data 1
Amplitudes and kinetics of the three types of spontaneous events.
- https://doi.org/10.7554/eLife.09158.006
Download links
A two-part list of links to download the article, or parts of the article, in various formats.
Downloads (link to download the article as PDF)
Open citations (links to open the citations from this article in various online reference manager services)
Cite this article (links to download the citations from this article in formats compatible with various reference manager tools)
AMPA receptor mediated synaptic excitation drives state-dependent bursting in Purkinje neurons of zebrafish larvae
eLife 4:e09158.
https://doi.org/10.7554/eLife.09158


