Plasmon resonance and the imaging of metal-impregnated neurons with the laser scanning confocal microscope
- Agnes Scott College, United States
- University of Minnesota, United States
Figures
Figure 1
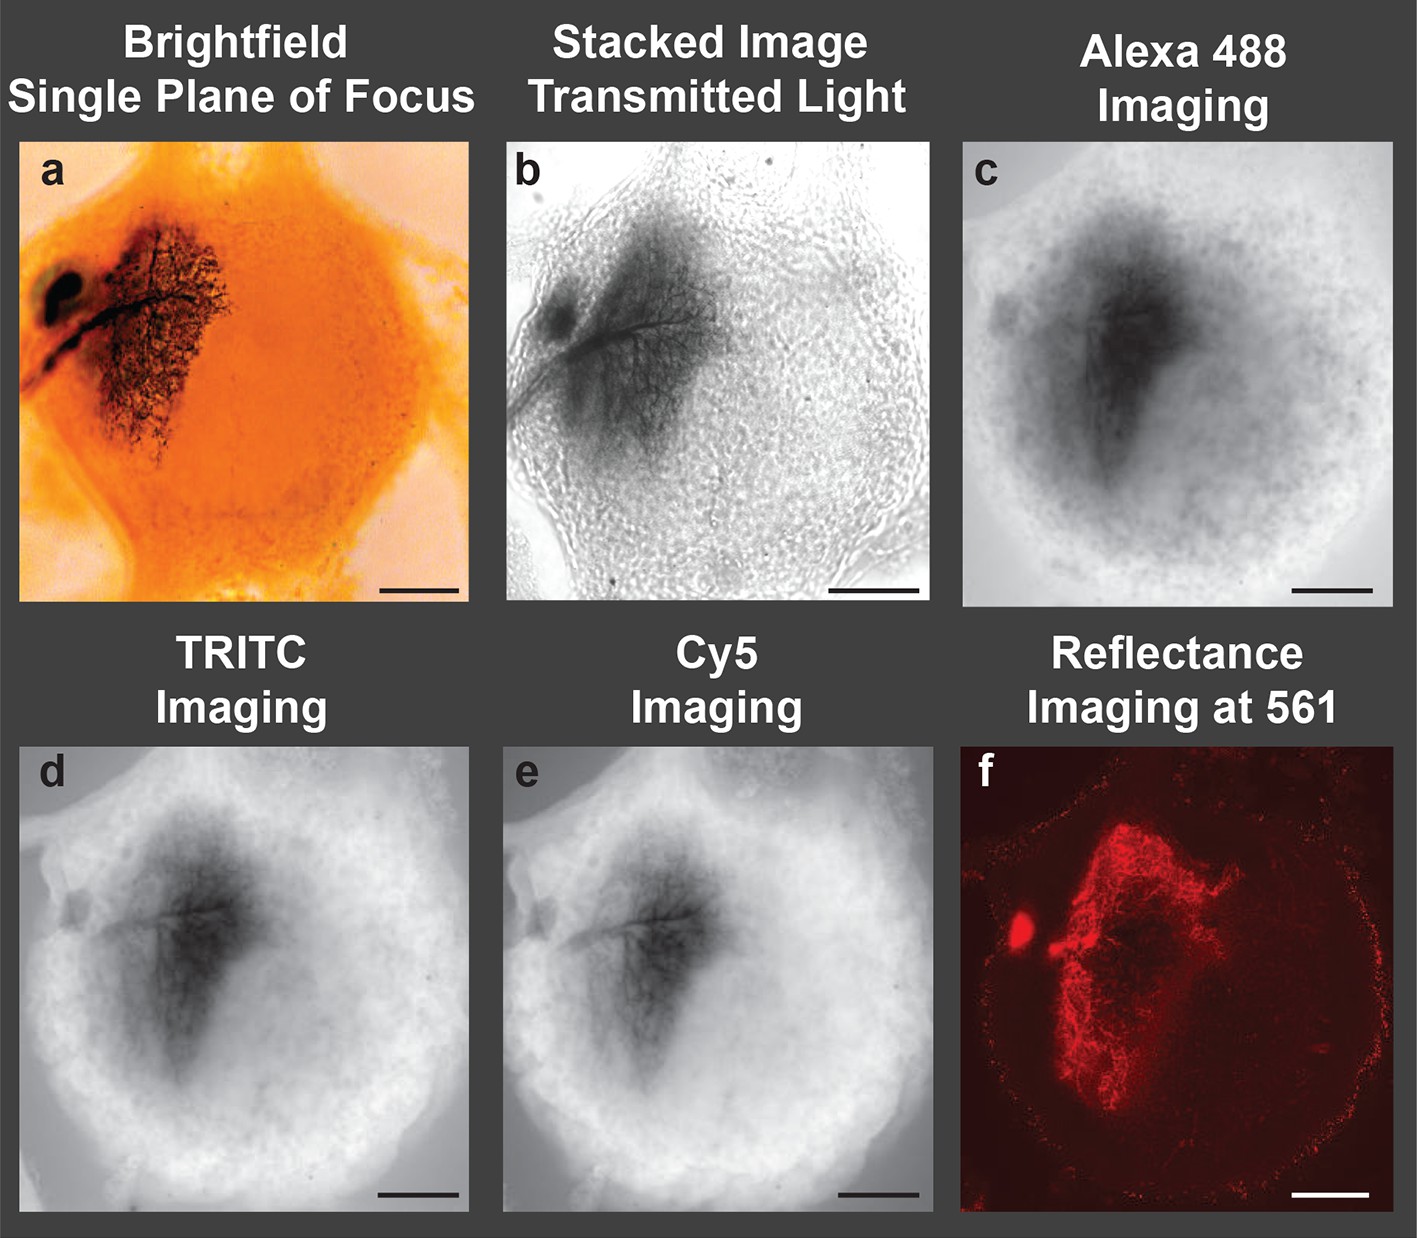
Image of a cobalt-filled, silver-intensified motoneuron, viewed with traditional microscopic imaging methods.
View of an insect (grasshopper) ganglion containing a motoneuron labeled by retrograde transport of cobaltous chloride, which was placed in a well surrounding a transected lateral nerve. The cobalt-filled motoneuron subsequently received a deposition of silver using the Timm’s silver intensification method Tyrer and Bell, 1974. All images presented here were taken using a 10× objective lens. (a) Brightfield image of the cobalt-filled silver-intensified motoneuon. (b) Stacked transmitted-light images acquired using the Nikon A1 spectral confocal microscope. (c-e) Confocal images obtained using appropriate settings for imaging specific fluorescent dyes; excitation and detection wavelengths were optimized for the specific fluorophore under consideration (listed in caption). (c) Alexa Fluor 488 setting: Sample was excited with a 40 mW argon multiline laser at 488 nm and emission was detected at 525/50 nm (center wavelength/bandwidth (FWHM)). (d) TRITC setting: Sample was excited with a 40 mW 561-nm diode laser and emission was detcted at 595/50 nm. (e) Cy5 setting: Sample was excited with a 10 mW 638 nm diode laser and emison was detected at 700/75 nm. (f) Imaging in the reflectance mode. Poor-quality images were obtained when the motoneuron was excited with a 561-nm laser line, and the emission was detected in a region over the same wavelength (using a notch filter). Only a portion of the neuronal arbors was visible and in focus. Scale bars = 100 µm.
Figure 2 with 1 supplement
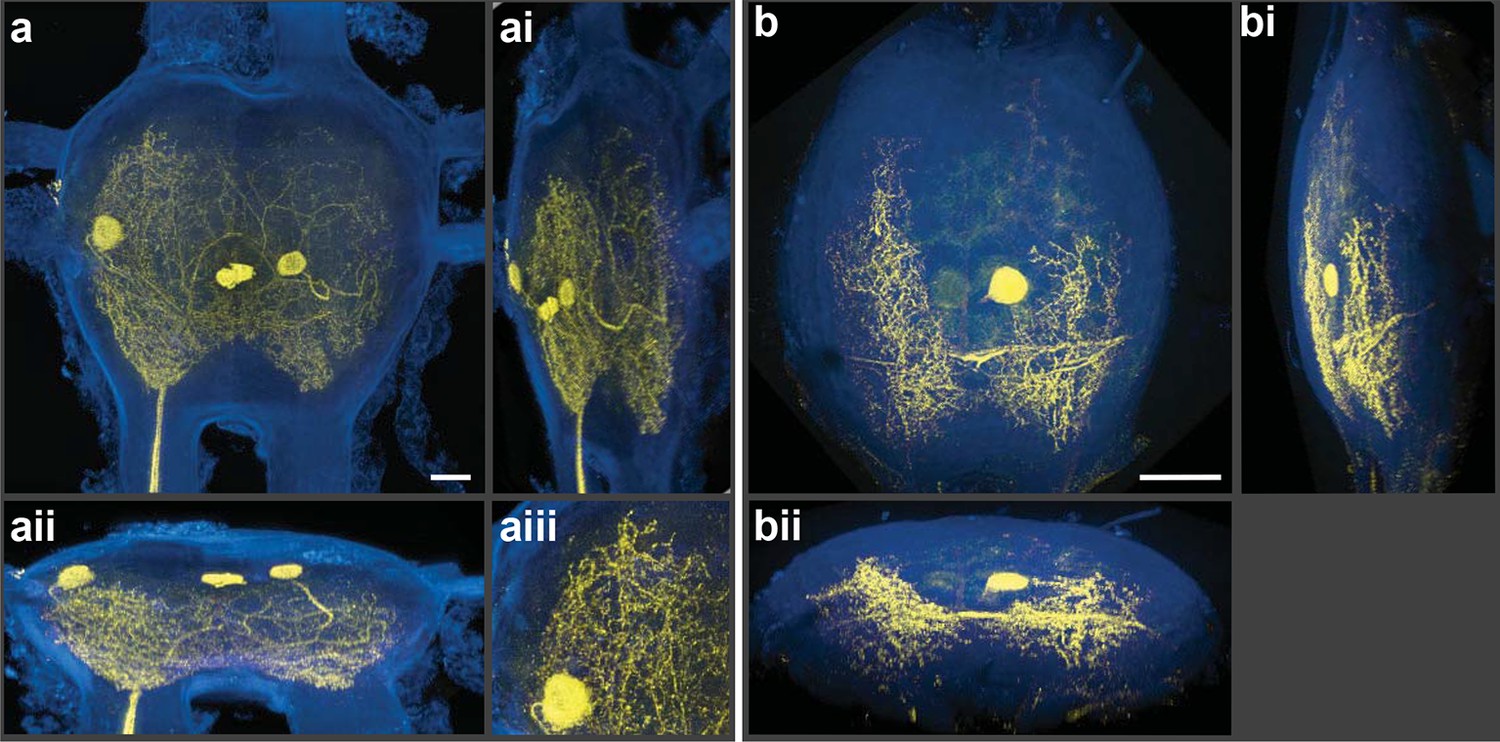
Silver-impregnated motoneurons imaged with the new protocol and the LSCM.
Cobalt-backfilled and silver-intensified neurons, within two different insect ganglia, imaged with the LSCM. Images include selected regions of interest (i.e. somata and neural processes); signal from the ganglion’s perineurial sheath was removed (in FIJI). For additional information on image processing and the optical removal of the sheath, see the ‘Materials and methods’ and Figure 2—figure supplement 1. (a-aiii) For these images, a 561-nm excitation laser line was used and the photic emission was obtained from 490–530 nm. (ai, aii) Rotations of the neuronal image revealed the three-dimensional cytoarchitectual features of the neuronal arbors in both the lateral and dorsal-ventral planes. (aiii) A higher magnification of the left-side region of the ganglion (at 9 o’clock) highlights the level of detail observed among the fine branches visible using our new protocol. (b-bii) A different insect ganglion, showing a single cobalt-filled and silver intensified motoneuron. (b) Fine morphological details of an insect motoneuron and its ramifying branches are shown here. Laser excitation and emission collection were the same as in (a). Note that the neurite connecting the soma to its branches was not visible due to loss of tracer not image capture. (bi, bii) Lateral and dorsal-ventral rotations, respectively, demonstrating the ability of cells to be rendered in three-dimensions for analysis of arbor patterning. Scale bars = 100 µm. See video of neuronal rotations in the supplementary data section. LSCM: Laser scanning confocal microscope.
Figure 2—figure supplement 1
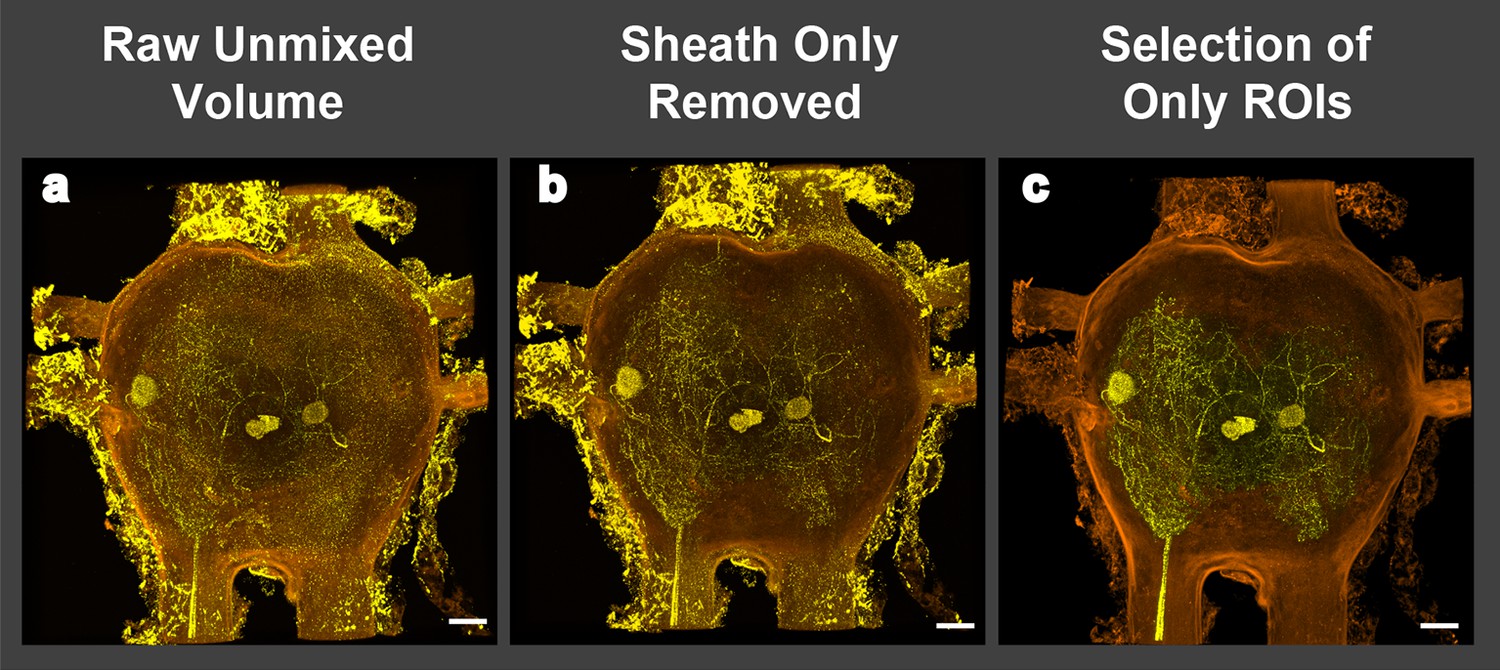
Image processing of volume renderings and removal of perineurial sheath.
(a) Raw image resulting from blind unmixing of spectral data. (b) Image of rendering after perineurial sheath is removed in FIJI. Note that signal from outside of ganglion obscures motoneuron branches in 3D and orthogonal views. (c) Image of rendering containing only signal from selected regions of interest (ROI). Scale bars = 100 µm
Figure 3
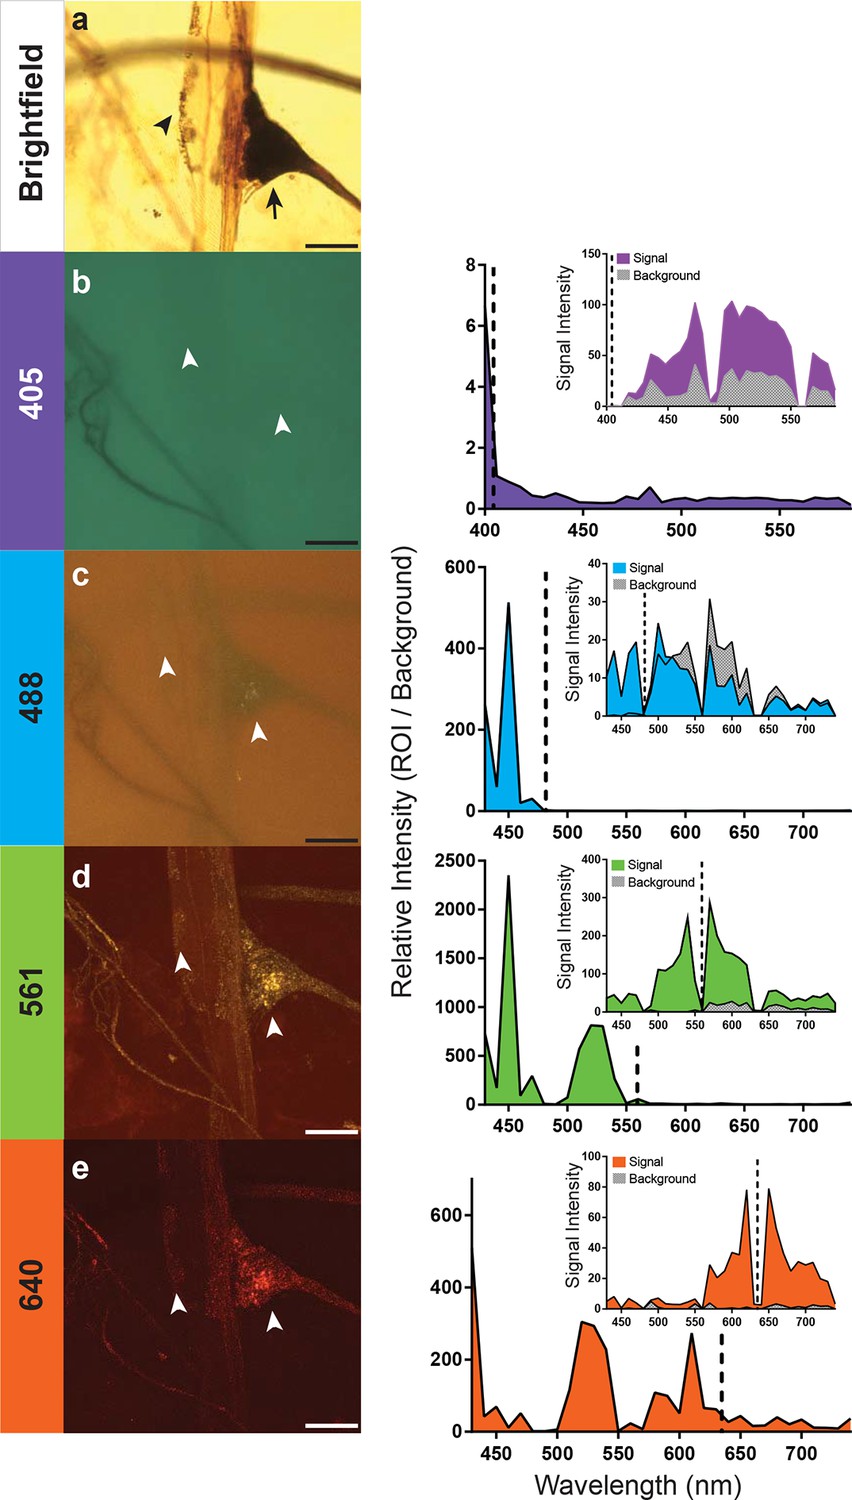
Optimal excitation and emission wavelengths to image silver-impregnated cells with the LSCM.
Multiple images of a cobalt-filled silver-intensified stretch receptor organ, from a hawkmoth, were compared across different laser excitation wavelengths using the LSCM and compared to a brightfield image. (a) Standard brightfield image of the insect stretch receptor organ in the abdomen. The arrow points to the cell body of the sensory neuron, which is attached to a modified muscle fiber; the arrowhead points to efferent motor terminals that regulate the tension of the fiber. Other silver-impregnated fine nerves are out of focus in the background. (b-e) An excitation laser line of 405 nm (b), 488 nm (c), 561 nm (d), or 640 nm (e) was used to determine optimal wavelengths to obtain best signal-to-noise ratio images. Emissions are plotted to the right and color coded with neuronal image. With the 405 laser line, light was collected from 400 nm to 590 nm in 6 nm bins; this entire spectrum was used to generate the image depicted (b). The other images (c-e) were formed by collecting the spectrum from 430–740 nm (in 10 nm bins). The associated graphs indicate the signal-to-noise ratio calculated by determining the ratio of the intensity of emitted signal from a region of interest (ROI) divided by the intensity of the background. Insets within the graphs indicate the raw intensity values for the signal (black) and background (gray). In each trace the excitation laser wavelength is indicated as a vertical dashed line. Note that at the 561-nm laser excitation, the image quality is best. The nucleus of the stretch receptor is visible as are the efferent terminals on the muscle-like fiber; the previously out-of-focus fine nerve fibers are now in focus. Scale bars = 100 µm.
Figure 4
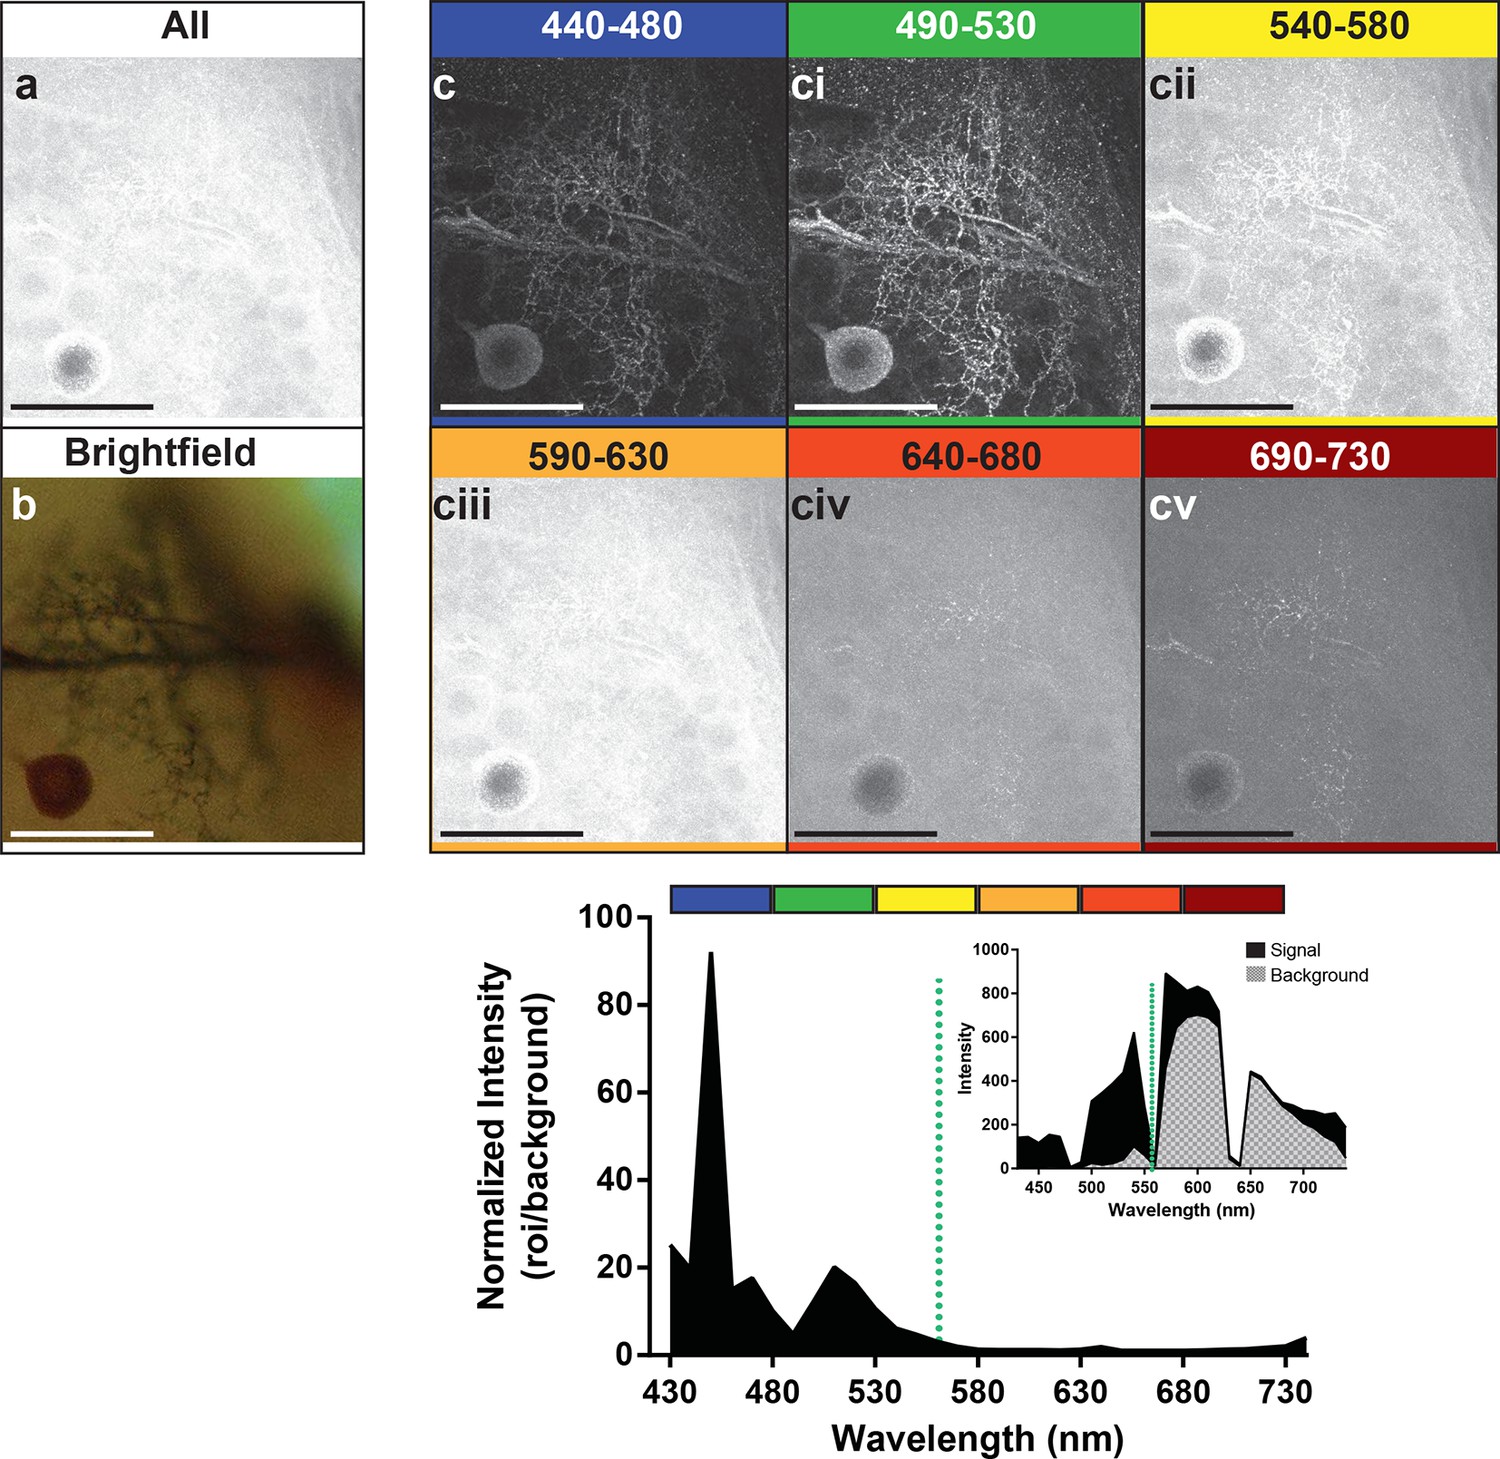
Optimal collection wavelengths to image silver-impregnated cells with the LSCM.
Cobalt-filled and silver-intensified single insect motoneuron was imaged over a variety of different emission wavelengths (i.e. that which was collected). (a) Insect ganglion preparation imaged with a 561-nm excitation laser line and photic output collected over the full spectral range (430–750 nm). Note that only the soma is faintly visible. (b) Same cell imaged under standard brightfield conditions, where the cell body and numerous fine branches were now visible, but deeper branches were out of focus. (c-cv) Collected emissions from the 561-nm excited samples were parsed into 40 nm bandwidths. Clearly, the optimal ranges for signal maximization were in the shortest wavelengths, approximately 440–530 nm (see c). These same data are also shown graphically below the images, highlighting the strongly enhanced contrast of the signal at optimal wavelengths. It is noteworthy that at 440–480 nm the signal is relatively low (see inset), thus photic collection at 490–530 nm appears to be more optimal for image quality. Scale bars = 100 µm.
Figure 5
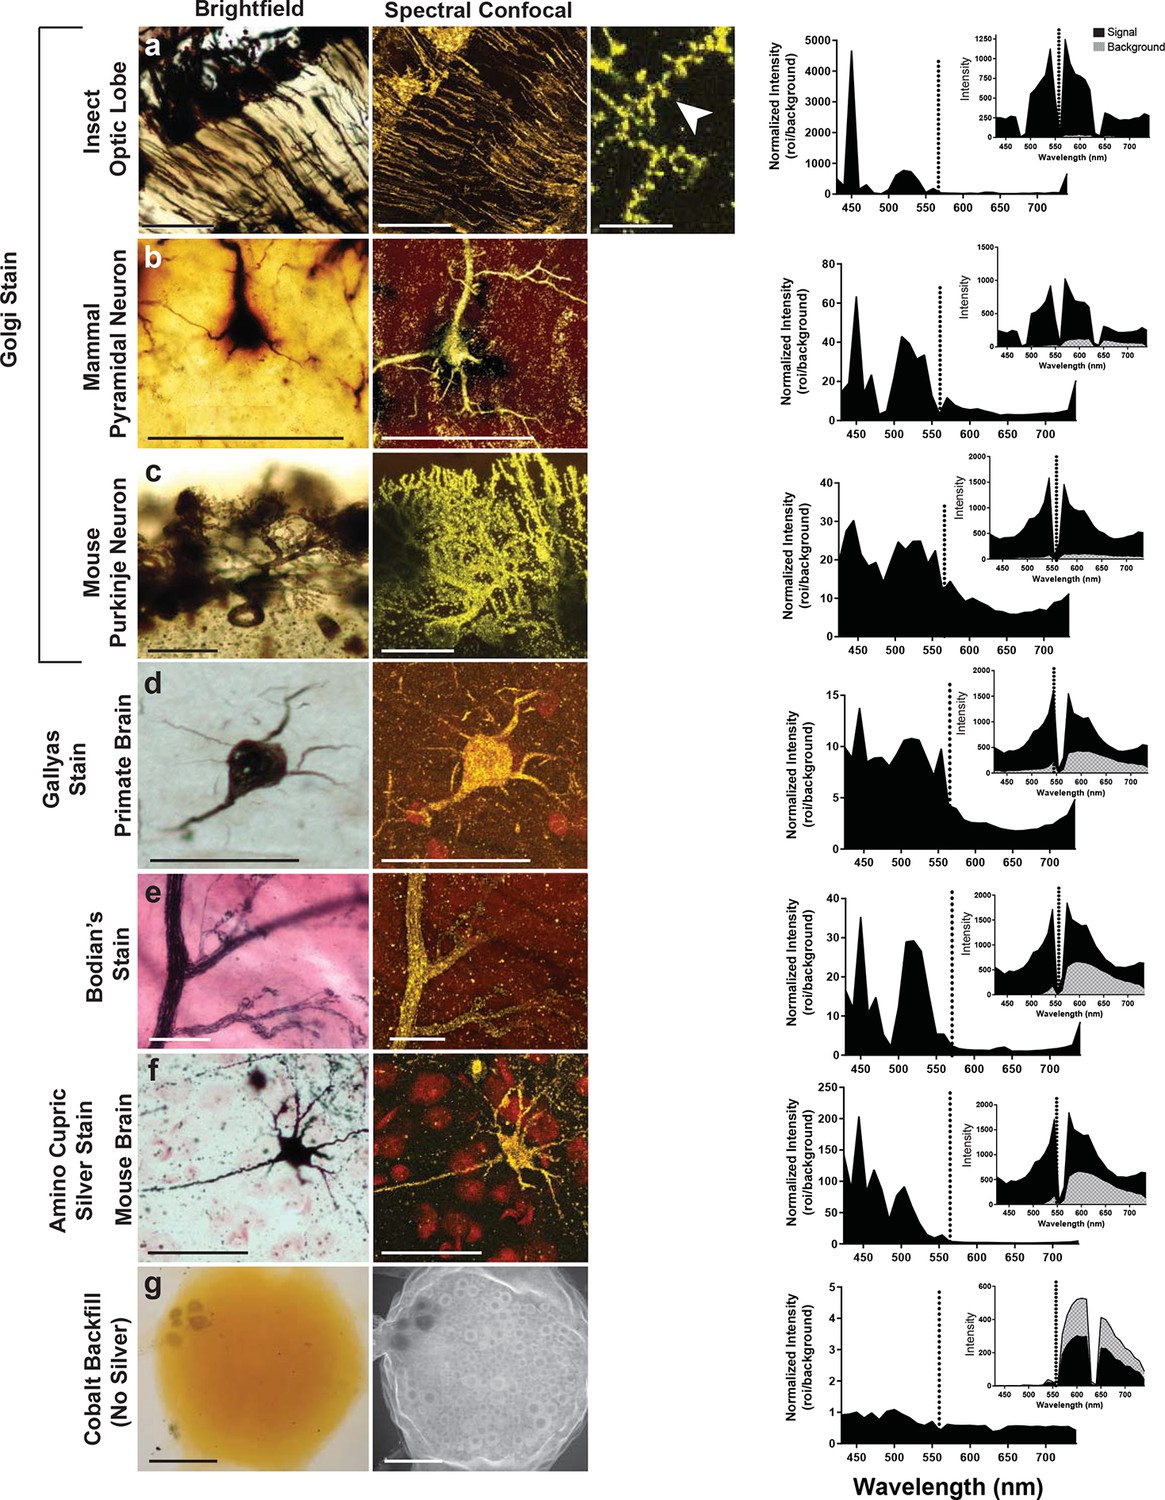
Examination of various metal-based stained neurons, across species, imaged with the LSCM.
(a-f) Silver- and gold-impregnated tissues were imaged using standard brightfield microscopy (left) and compared to LSCM images excited with a 561-nm laser line (right). Normalized intensity graphs (signal to noise ratio) are shown to the right of each confocal image. Insets provide the raw intensity data for the detected signal (black) and detected background noise (gray). The dashed line indicates the wavelength of the excitation laser line that was used (561 nm). Preparations were as follows: (a) Golgi stain of a honeybee optic lobe. Note the presence of what appear to be dendritic spines (arrowhead); (b) mammalian pyramidal neuron; (c) mouse Purkinje neuron; (d) Gallyas stain of a monkey brain; (e) Bodian’s stain of a mammalian motor end plate; (f) amino-cupric-silver stain of a mouse brain. In (g), insect neurons were backfilled with cobalt but not subsequently silver intensified. Without silver, the emission intensity profile is flat and the confocal image shows only faint arbor-free somata. Scale bars = 100 µm except for one bar in the far-right confocal image in (a) bar = 25 µm.
Videos
Video 1
Volume rendering of silver-impregnated locust motoneurons.
Cobalt-filled and silver-intensified neurons within an insect ganglion. Image was processed as described in the ‘Materials and methods’. Imaris software was used to generate a volume rendering and the video was exported as an AVI file. Handbrake software was used to convert the video to MP4 format. Video depicts same motoneurons as presented in Figure 2a.
Download links
A two-part list of links to download the article, or parts of the article, in various formats.
Downloads (link to download the article as PDF)
Open citations (links to open the citations from this article in various online reference manager services)
Cite this article (links to download the citations from this article in formats compatible with various reference manager tools)
Plasmon resonance and the imaging of metal-impregnated neurons with the laser scanning confocal microscope
eLife 4:e09388.
https://doi.org/10.7554/eLife.09388


