An internal promoter underlies the difference in disease severity between N- and C-terminal truncation mutations of Titin in zebrafish
- University of California, San Francisco, United States
- University of North Carolina at Chapel Hill, United States
- Brigham Young University, United States
- University of Zurich, Switzerland
- University of California, United States
- California Institute for Quantitative Biosciences, United States
Figures
Figure 1 with 1 supplement
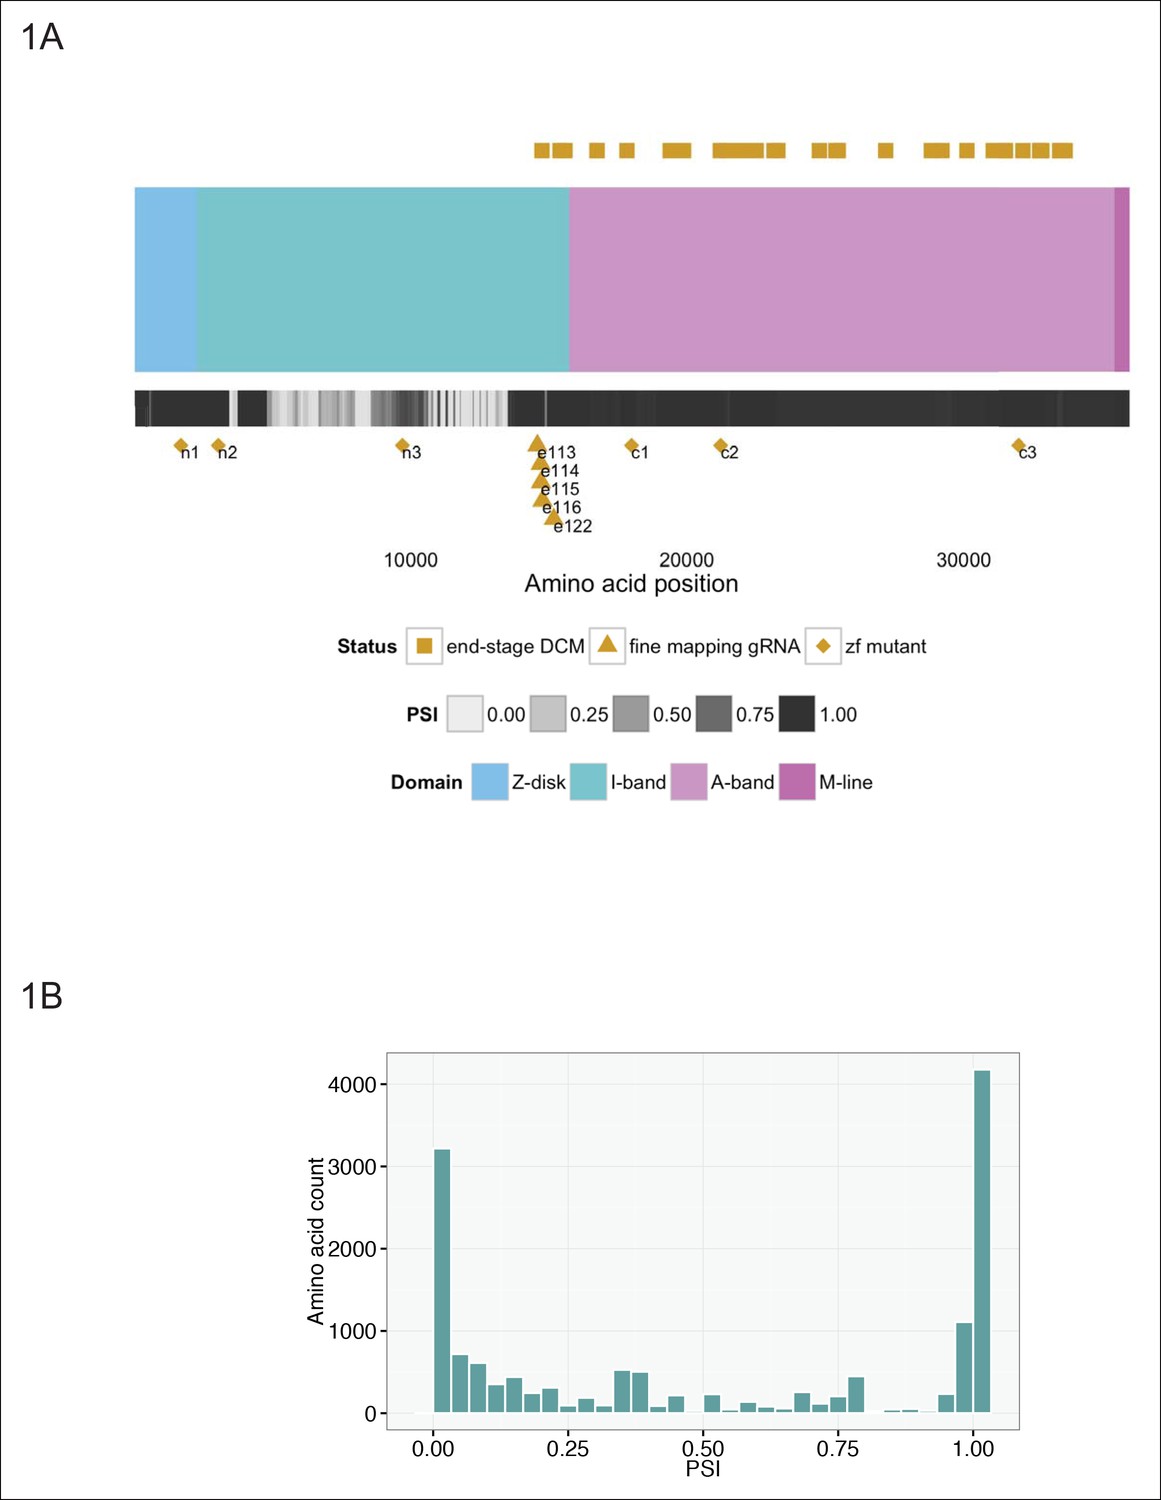
Generation of six stable zebrafish lines with truncating mutations in ttna, the zebrafish orthologue of TTN, using CRISPR/Cas9 technology.
(A) Schematic of the TTN meta-transcript (Ensembl ID ENST00000589042), including all known exons with the exception of the Novex-3 exon, which is exclusive to the Novex-3 isoform (Ensembl ID ENST00000360870). Sarcomeric regions are denoted by different colors. A heatmap of PSI values computed from RNA-Seq data of two DCM hearts is shown below the cartoon representation of the transcript. Above the schematic, amino acid positions of truncating mutations of TTN in end stage dilated cardiomyopathy identified in a prior study (Roberts et al., 2015) are highlighted (gold squares). We restricted our representation to nonsense, frameshift or canonical splice-site mutations and did not include predicted disruptions of putative splice enhancers. A truncating mutation mapping to the Novex-3 exon is not shown. Below the schematic, the corresponding human amino acid positions of zebrafish exons disrupted through CRISPR/Cas9 technology in our work are depicted, including six stable mutant lines (n1, n2, n3, c1, c2, c3, gold diamonds) and individual exons targeted by high dose guide RNA/Cas9 injection (gold triangles). (B) Many of the exons not mutated in end-stage DCM are constitutive (i.e. show minimal alternative splicing). Histogram representing the PSI frequency distribution for TTN amino acids N-terminal to amino acid 14,760, which is the most N-terminal amino acid in which a definitive truncation mutation is found in an end-stage DCM patient. The median PSI value was computed for each TTN exon using RNA-Seq datasets from hearts of two patients with DCM (GEO Accession GSM1380722, GSM1380723).
Figure 1—figure supplement 1
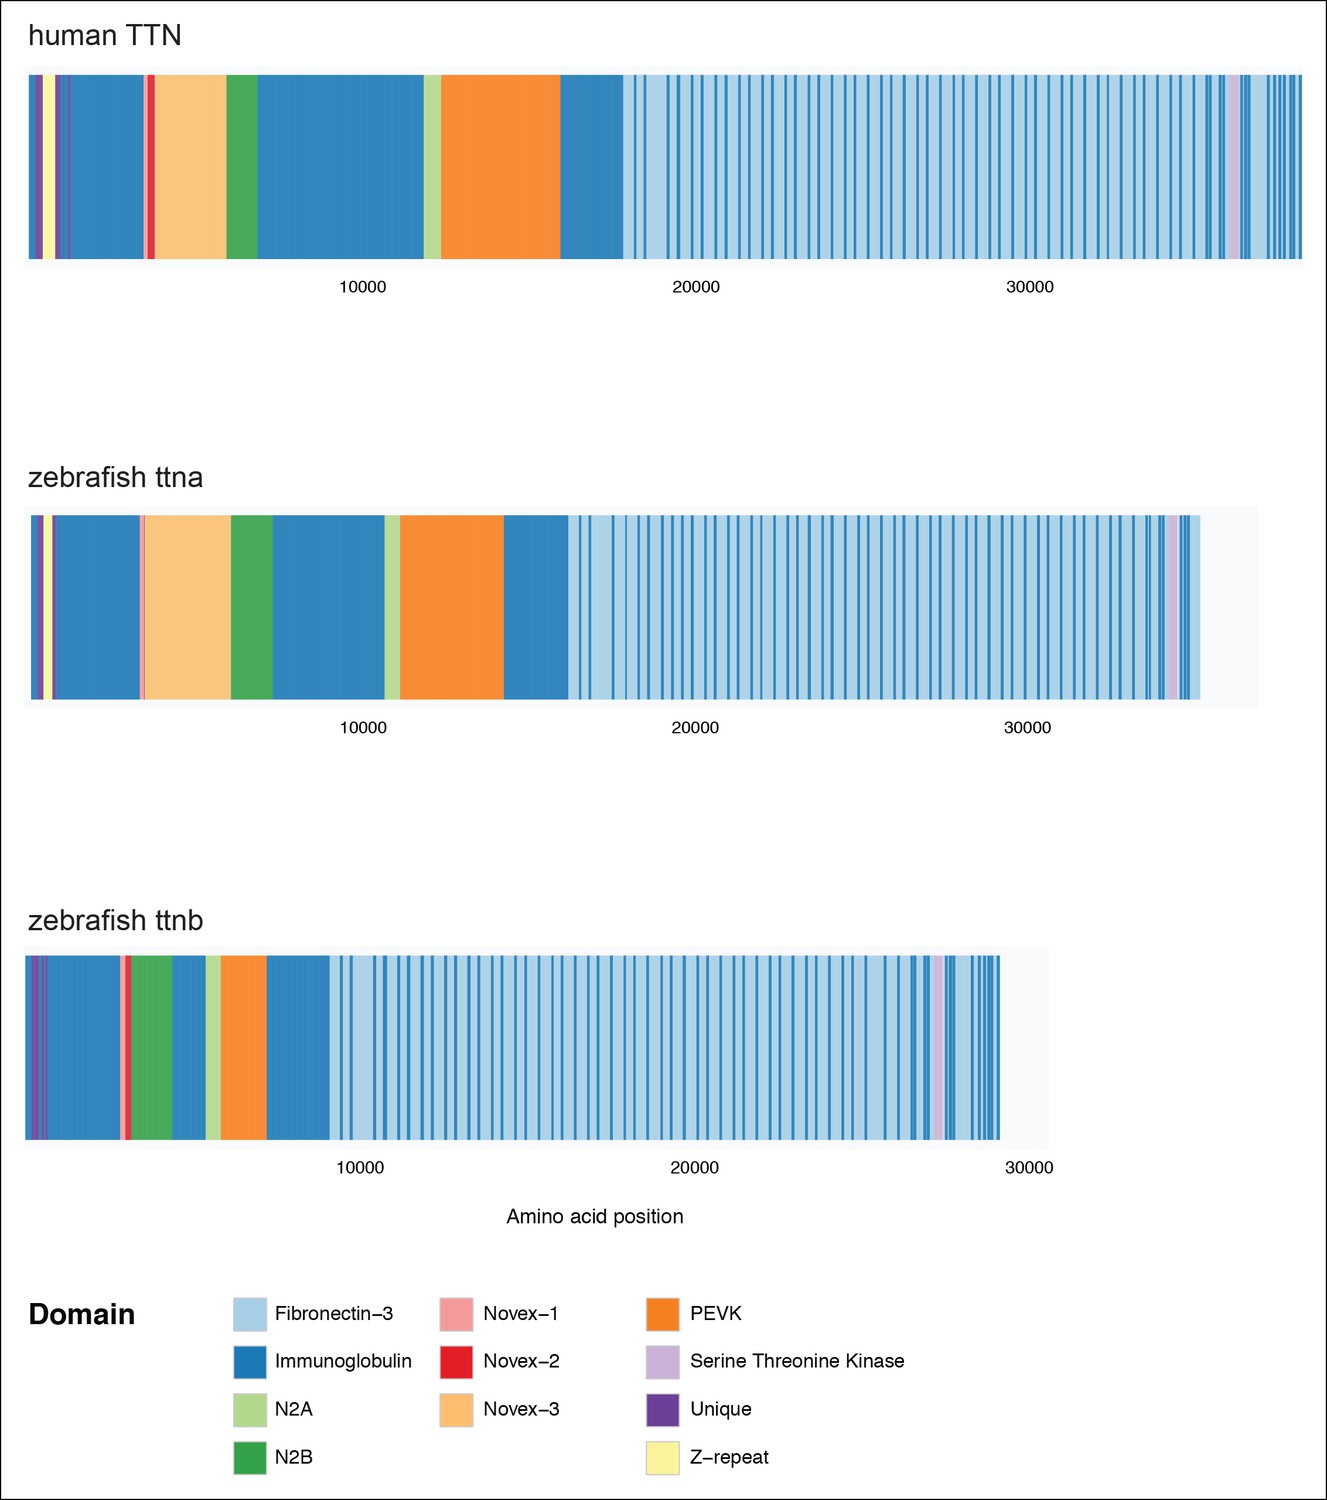
Domain organization of human TTN (top), zebrafish ttna (middle) and zebrafish ttnb (bottom).
In each case a meta-transcript is shown, which includes all possible exons.
Figure 2

C-terminal ttna truncations result in a severe skeletal muscle phenotype while N-terminal truncations are indistinguishable from wild-type.
Fixed heart (A) and skeletal muscle (B) samples of 72 hpf ttnawt/wt, ttnan/n and ttnac/c mutant embryos were analyzed by immunostaining for α–actinin, which highlights Z-disc architecture. The cardiac sarcomere was disarrayed in all mutants. However, in skeletal muscle ttnac/c mutants demonstrated severe sarcomeric disarray while ttnan/n mutants retained sarcomeric architecture. Scale bar: 10 uμm. (C) All targeted TTN exons are constitutive (i.e. not alternatively spliced) in both cardiac and skeletal muscle. PSI values computed for each mutated exon using RNA-Seq data for dissected hearts and trunk skeletal muscle for various mutant genotypes at 72 hpf. Wild-type fish were analyzed at both 72 hpf and adulthood. Analysis was limited to samples with a sufficient number of exon-exon junction reads to accurately estimate PSI (Pervouchine et al., 2013). (D) Nonsense-mediated decay reduces mutant transcript levels to ∼20–25% of wild-type, but does not vary substantially across mutations. Targeted RNA-Seq was used to determine the ratio of reads derived from the mutant allele vs. the wild-type allele in ttnan/wtand ttnac/wt heterozygote mutants, which serves as an estimate of nonsense-mediated decay efficiency.
Figure 3
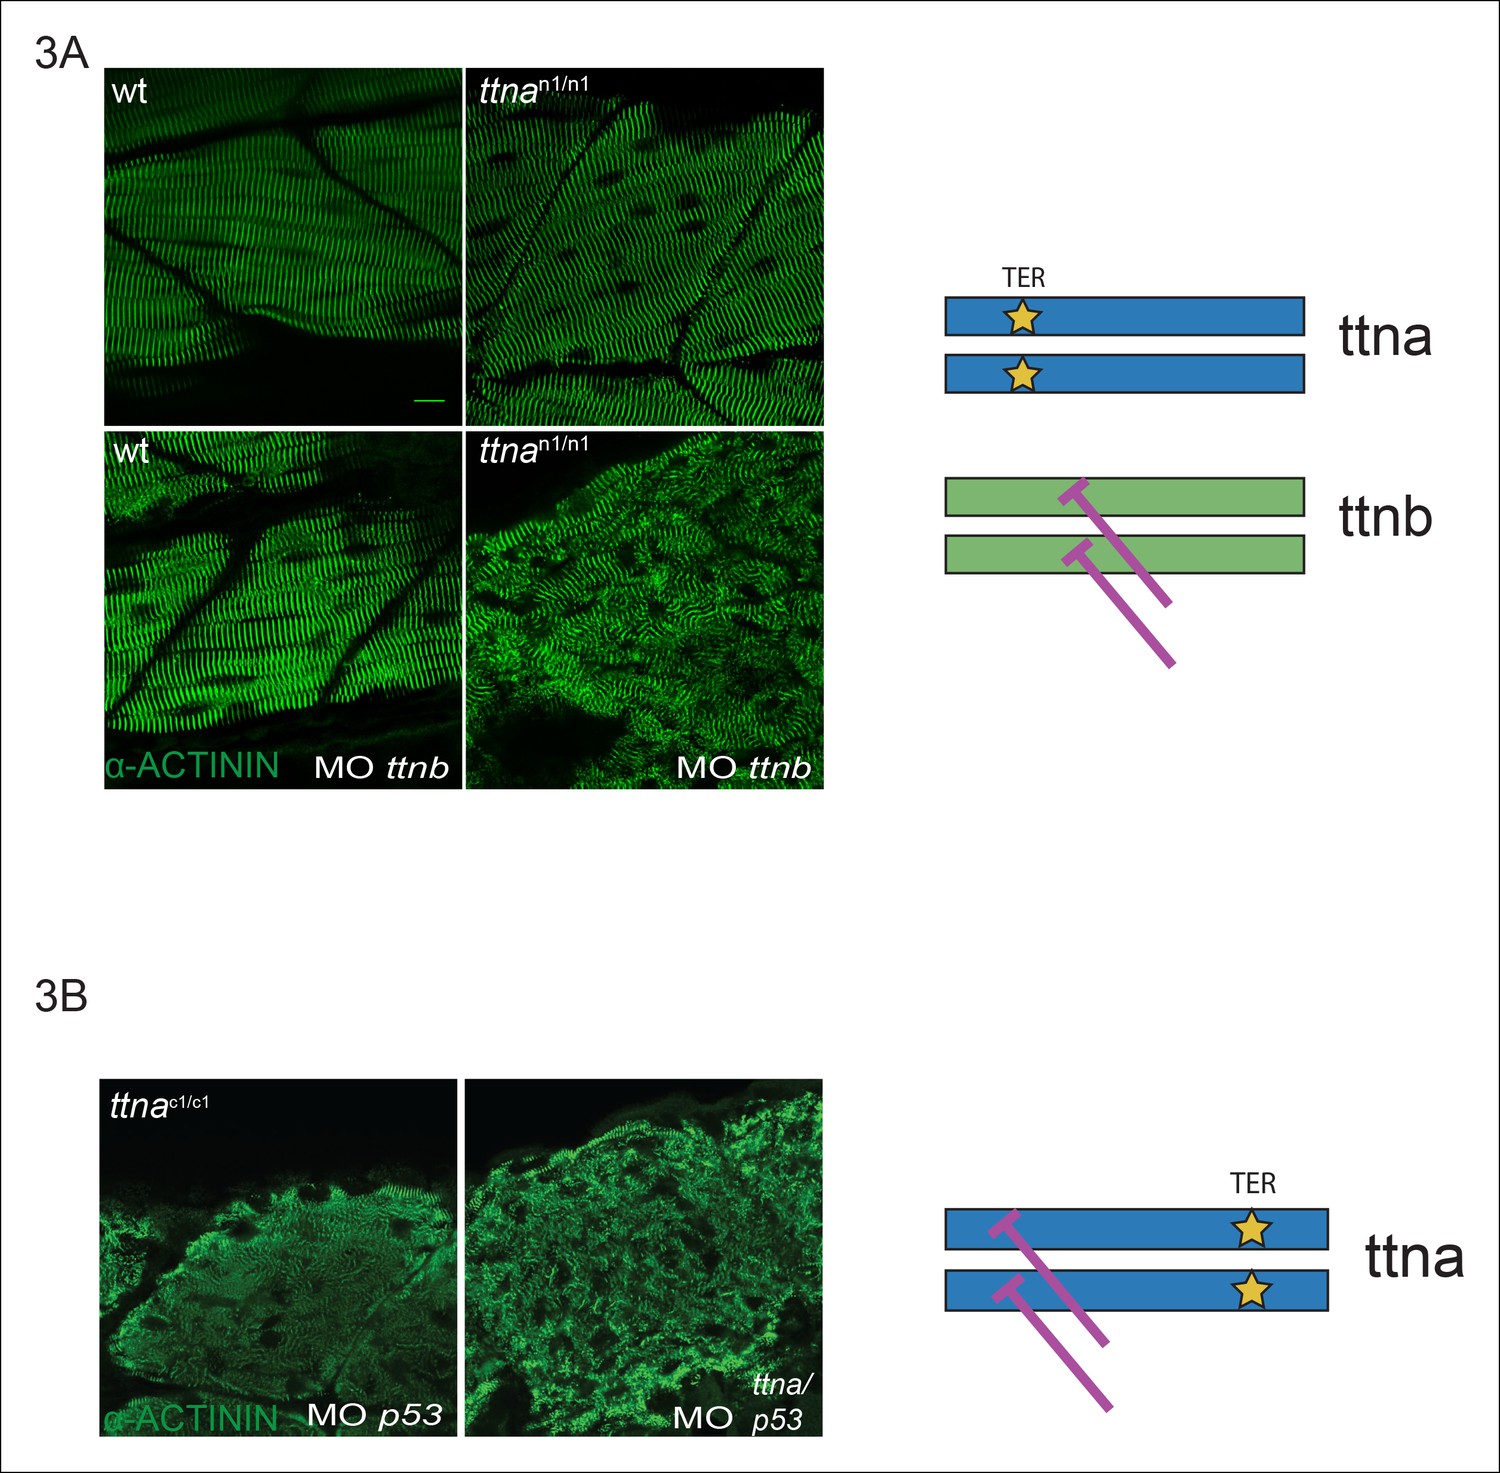
C-terminal ttna truncations do not act as dominant negatives.
(A) Knockdown of ttnb by morpholino injection worsens skeletal muscle sarcomeric architecture in ttnan/n mutants. Fixed skeletal muscle samples of 72 hpf ttnan1/n1 mutant embryos were analyzed by immunostaining for α–actinin. (right) Cartoon representation of ttna and ttnb proteins, with a premature N-terminal stop codon in ttna (gold star). The purple lines indicate morpholino disruption of the ttnb transcript. Scale bar: 10 uμm. (B) Knockdown of ttna by morpholino injection does not rescue skeletal muscle architecture in ttnac1/c1 mutants. ttnac1/c1 embyros were injected with a ttna splice-site morpholino to the exon 4-intron 4 junction at the 1–2 cell stage and embryos were examined at 72 hpf. At this morpholino dose, knockdown efficacy was estimated at close to 80% and nearly complete cessation of cardiac contraction was achieved in >90% of wild-type embryos (data not shown). Immunostaining for α–actinin revealed no improvement in skeletal muscle architecture. (right) Cartoon representation of mutant ttna proteins, with a premature C-terminal stop codon (gold star). The purple lines indicate disruption of the ttna transcript using a morpholino that is expected to introduce an N-terminal truncation upstream of the C-terminal truncation.
Figure 4 with 2 supplements
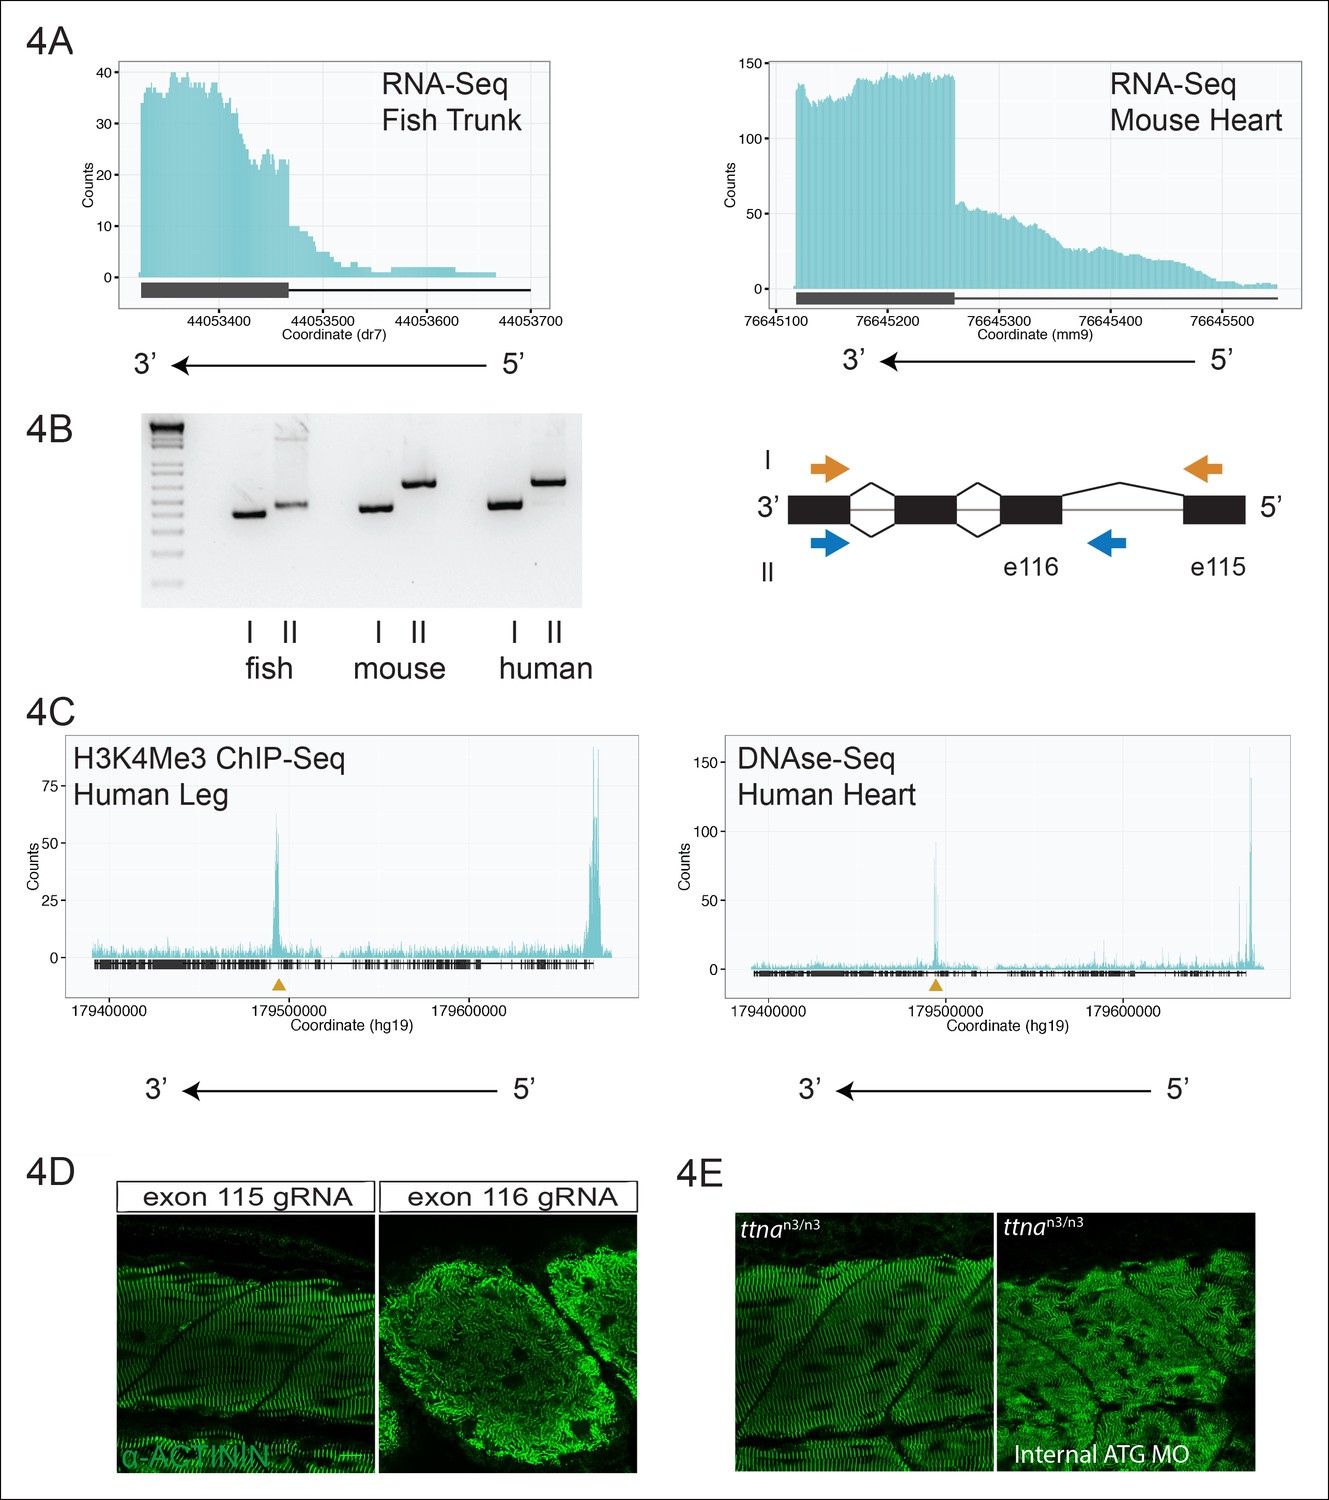
An internal promoter at the distal I-band explains phenotypic differences between N- an C-terminal ttna mutants.
(A) RNA-Seq data from 72 hpf zebrafish trunk (left) and E12.5 mouse hearts (right) depicting accumulation of reads within the intron, upstream of the orthologous exons 116 (zebrafish) and 223 (mouse). The Ttn gene is on the negative strand and so reads within the upstream intron are shown to the right of the black bar, which indicates the position of the relevant exon. (B) Transcription from an alternative Titin promoter occurs in zebrafish, mouse, and human heart. (left) PCR amplification using a primer in the upstream exon or an internal primer at or near the internal TSS (as determined by 5’-RACE) as forward primer and a shared reverse primer was performed using cDNA from zebrafish, mouse and human heart. For all three species, products of the expected size were found, supporting transcription from an internal promoter. (right) Cartoon representation of PCR amplification scheme, with exon numbering according to zebrafish transcript. The zebrafish 5’ UTR is shorter than that of mouse and human. (C) (left) H3K4me3 ChIP-Seq data from human fetal leg muscle (GEO Accession GSM1058781), indicating an active promoter overlies exon 240, which is orthologous to exon 116 in zebrafish. The peak at the far right of the figure represents the conventional human TTN promoter. (right) DNAse-Seq data from human fetal heart (GEO Accession GSM665830) indicates highly accessible chromatin overlying exon 240, which typically demarcate enhancers or promoters (Neph et al., 2013). The accessible chromatin peak at the far right is the conventional TTN promoter. The gold triangle in both panels indicates the genomic position of the human internal promoter TSS identified through 5’-RACE. (D) Phenotypic divergence in skeletal myopathy in ttna truncations occurs at the exons flanking the alternative promoter. Cas9 protein and high dose gRNAs corresponding to exon 115 or exon 116 were injected into 1 cell embryos. At 72 hpf, embryos with complete or near complete cessation of cardiac contraction were collected and immunostained for α–actinin to assess skeletal muscle architecture. (E) An ATG morpholino targeting the intronic region upstream of the novel initiator methionine is sufficient to create skeletal muscle disarray on a ttnan3/n3 background. 1–2 cell embryos from a ttnan3/wt cross were injected with an intronic morpholino and ttnan3/n3 homozygotes immunostained for α–actinin to assess sarcomere architecture in the skeletal muscle. No skeletal muscle disarray was seen in wild-type fish injected with the internal ATG morpholino (data not shown).
Figure 4—figure supplement 1
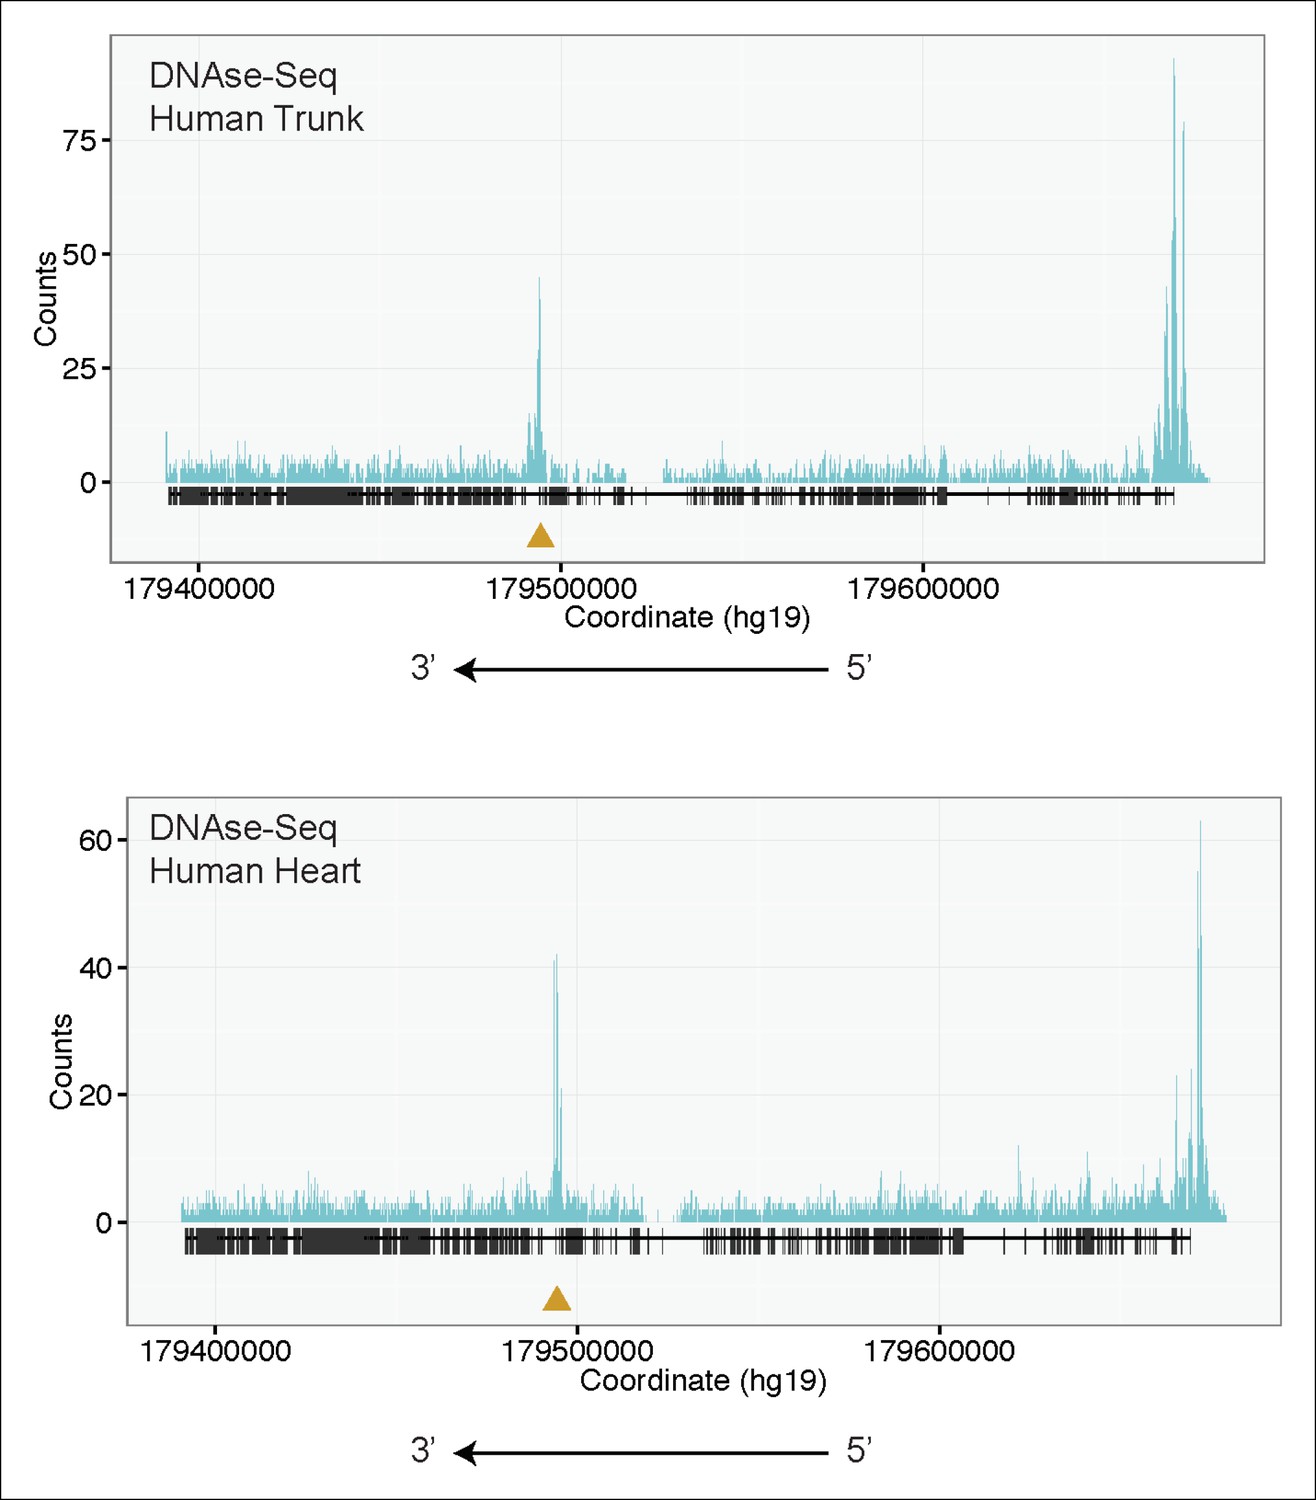
H3K4me3 Chip-Seq analysis of human fetal muscle (top, GEO Accession GSM1160200) and DNAse-Seq analysis of fetal human heart (bottom, GEO Accession GSM665817) identifies an internal chromatin accessible peak overlying the alternative TTN promoter.
A similar peak profile was seen in multiple H3K4me3 and DNAse-Seq data sets (data not shown): GEO Accessions GSM530661 (fetal heart), GSM665824 (fetal heart), GSM701533 (fetal trunk), GSM772735 (fetal heart), GSM1027322 (pediatric heart), and GSM530654 (fetal heart).
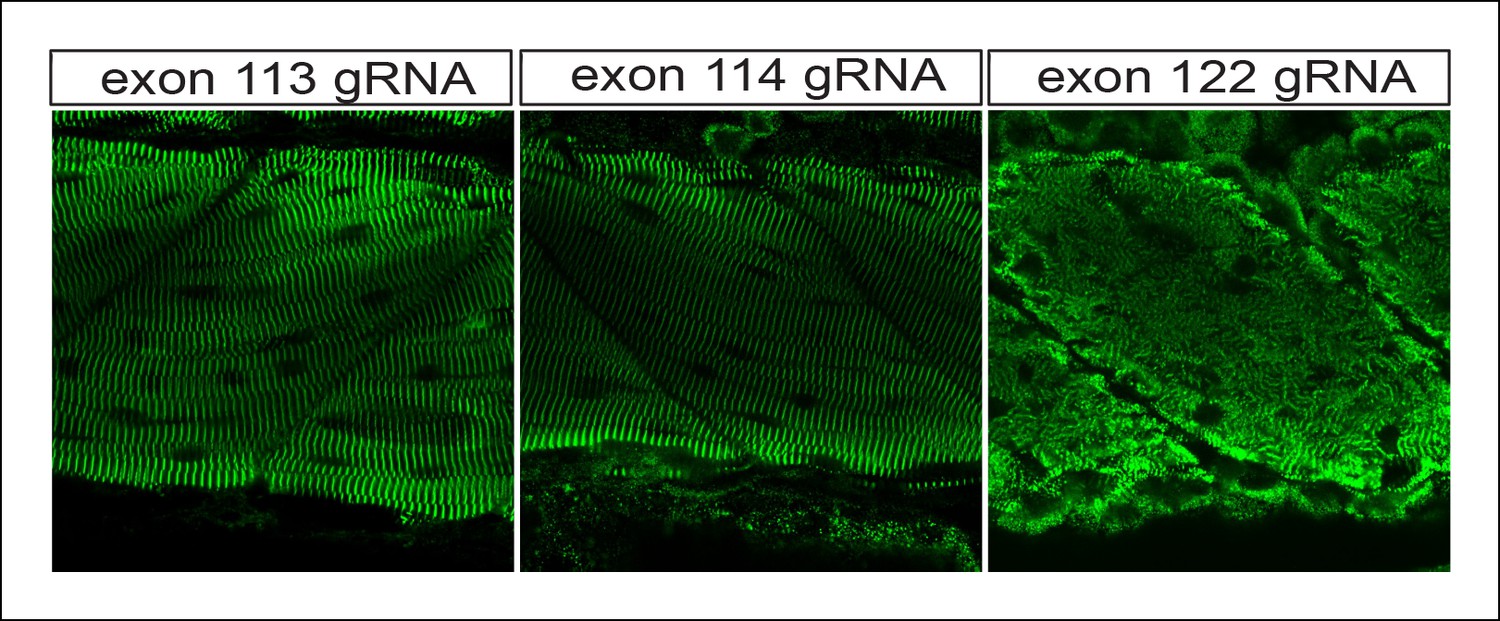
Figure 4—figure supplement 2
The transition between mild and severe skeletal phenotypes occurs at intron 115, the site of the alternative promoter.
One-cell zebrafish embyros were injected with recombinant Cas9 protein and high-dose gRNA, targeting exons 113, 114 or 122 (e115 and e116 are shown in Figure 4). Immunostaining for alpha–actinin reveals disrupted skeletal muscle architecture only for e122.
Figure 5
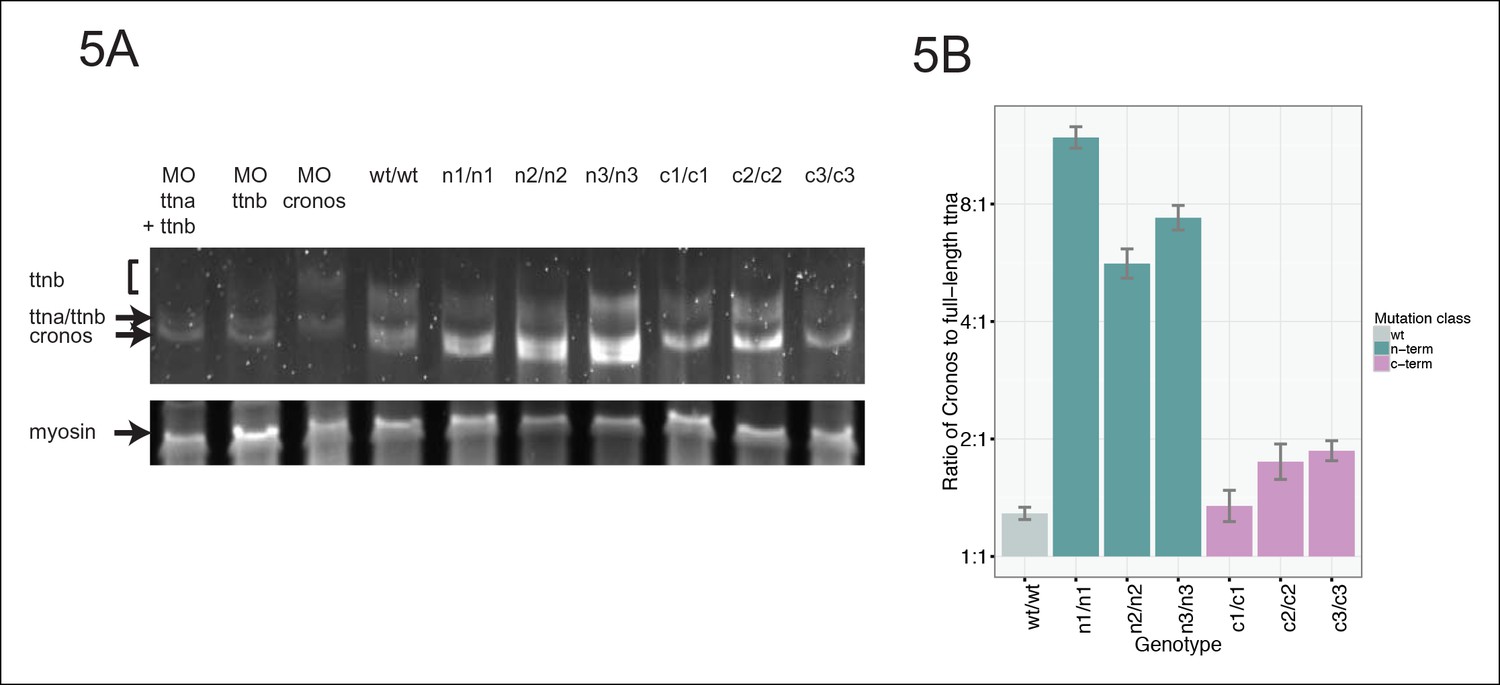
Premature termination codons in ttna differentially affect the levels of Cronos and full-length ttna depending on mutation location.
(A) 1.0% agarose gel reveals higher molecular weight bands corresponding to different splice isoforms of ttnb (all fish) and ttna (wild-type only). The arrow represents Cronos isoform of ttna, which is absent in C-terminal truncation mutants and in zebrafish treated with an ATG morpholino against this isoform. Ttna and ttnb expression results in a complex distribution of splice isoforms, whose identity and composition vary over early development (Steffen et al., 2007). (B) NMD results in a high ratio of Cronos to full-length ttna transcript levels in N-terminal but not C-terminal truncation mutants. Quantitative real-time PCR was used to estimate relative levels of the Cronos and full-length ttna trancripts for wild-type and mutant embryos. No efficiency difference was seen for the corresponding primer pairs.
Figure 6
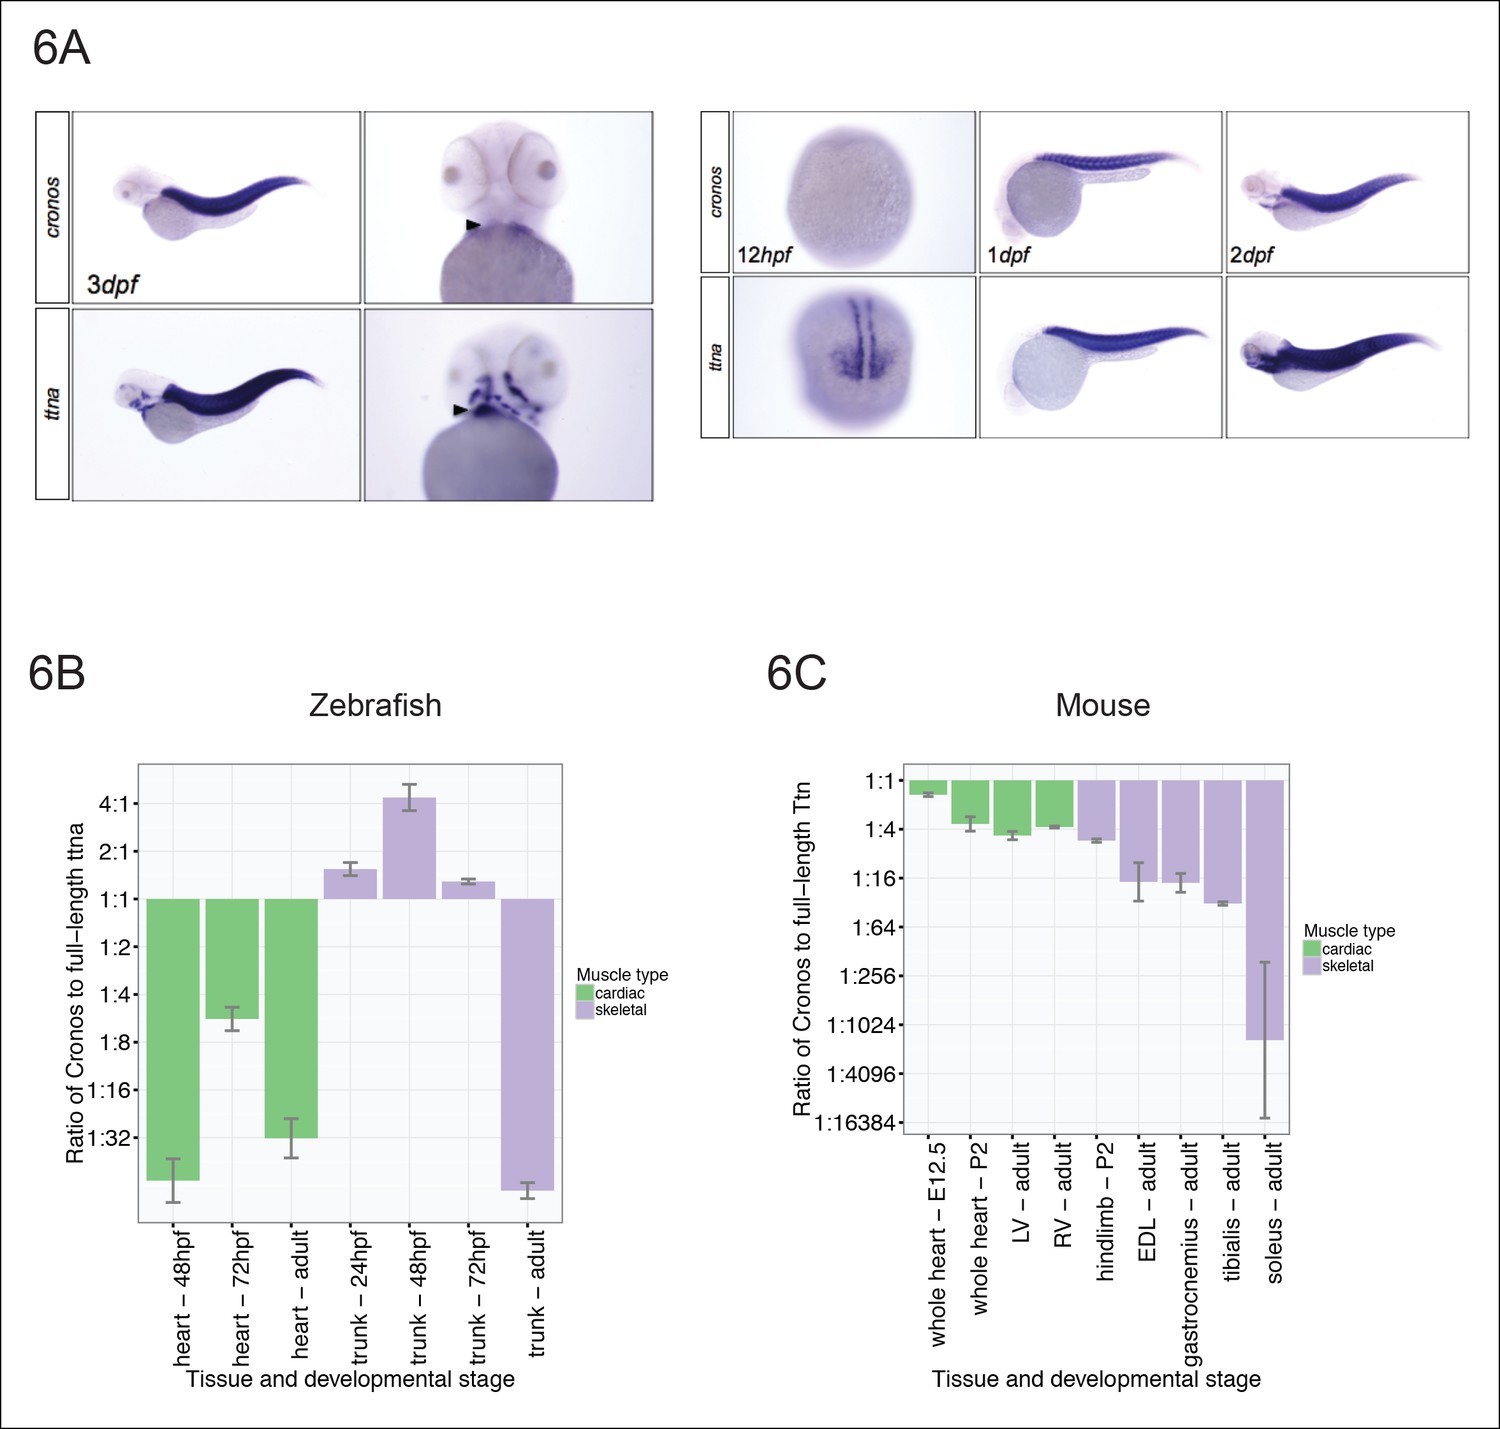
Tissue and developmental profile of Cronos and ttna expression in zebrafish and mouse heart and skeletal muscle.
(A) In situ hybridization at 72 hrpf (left) and 24 and 48 hpf (right) reveal prominent expression of both Cronos and full length ttna isoforms in zebrafish somites. In contrast, Cronos expression in developing zebrafish heart (arrow) is at low levels. (B) Quantitative PCR estimates of the ratio of Cronos to full-length ttna reveals prominent expression in developing zebrafish skeletal muscle, but markedly reduced expression in developing heart and in adult heart and skeletal muscle. (C) Quantitative PCR estimates of the ratio of Cronos to full-length Ttn reveals prominent expression in developing mouse hearts, which diminishes through development. Skeletal muscle Cronos expression is comparable in early postnatal mouse, but diminished in adulthood and varies by skeletal muscle bed. EDL = extensor digitorum longus. LV/RV = left/right ventricle.
Figure 7 with 1 supplement
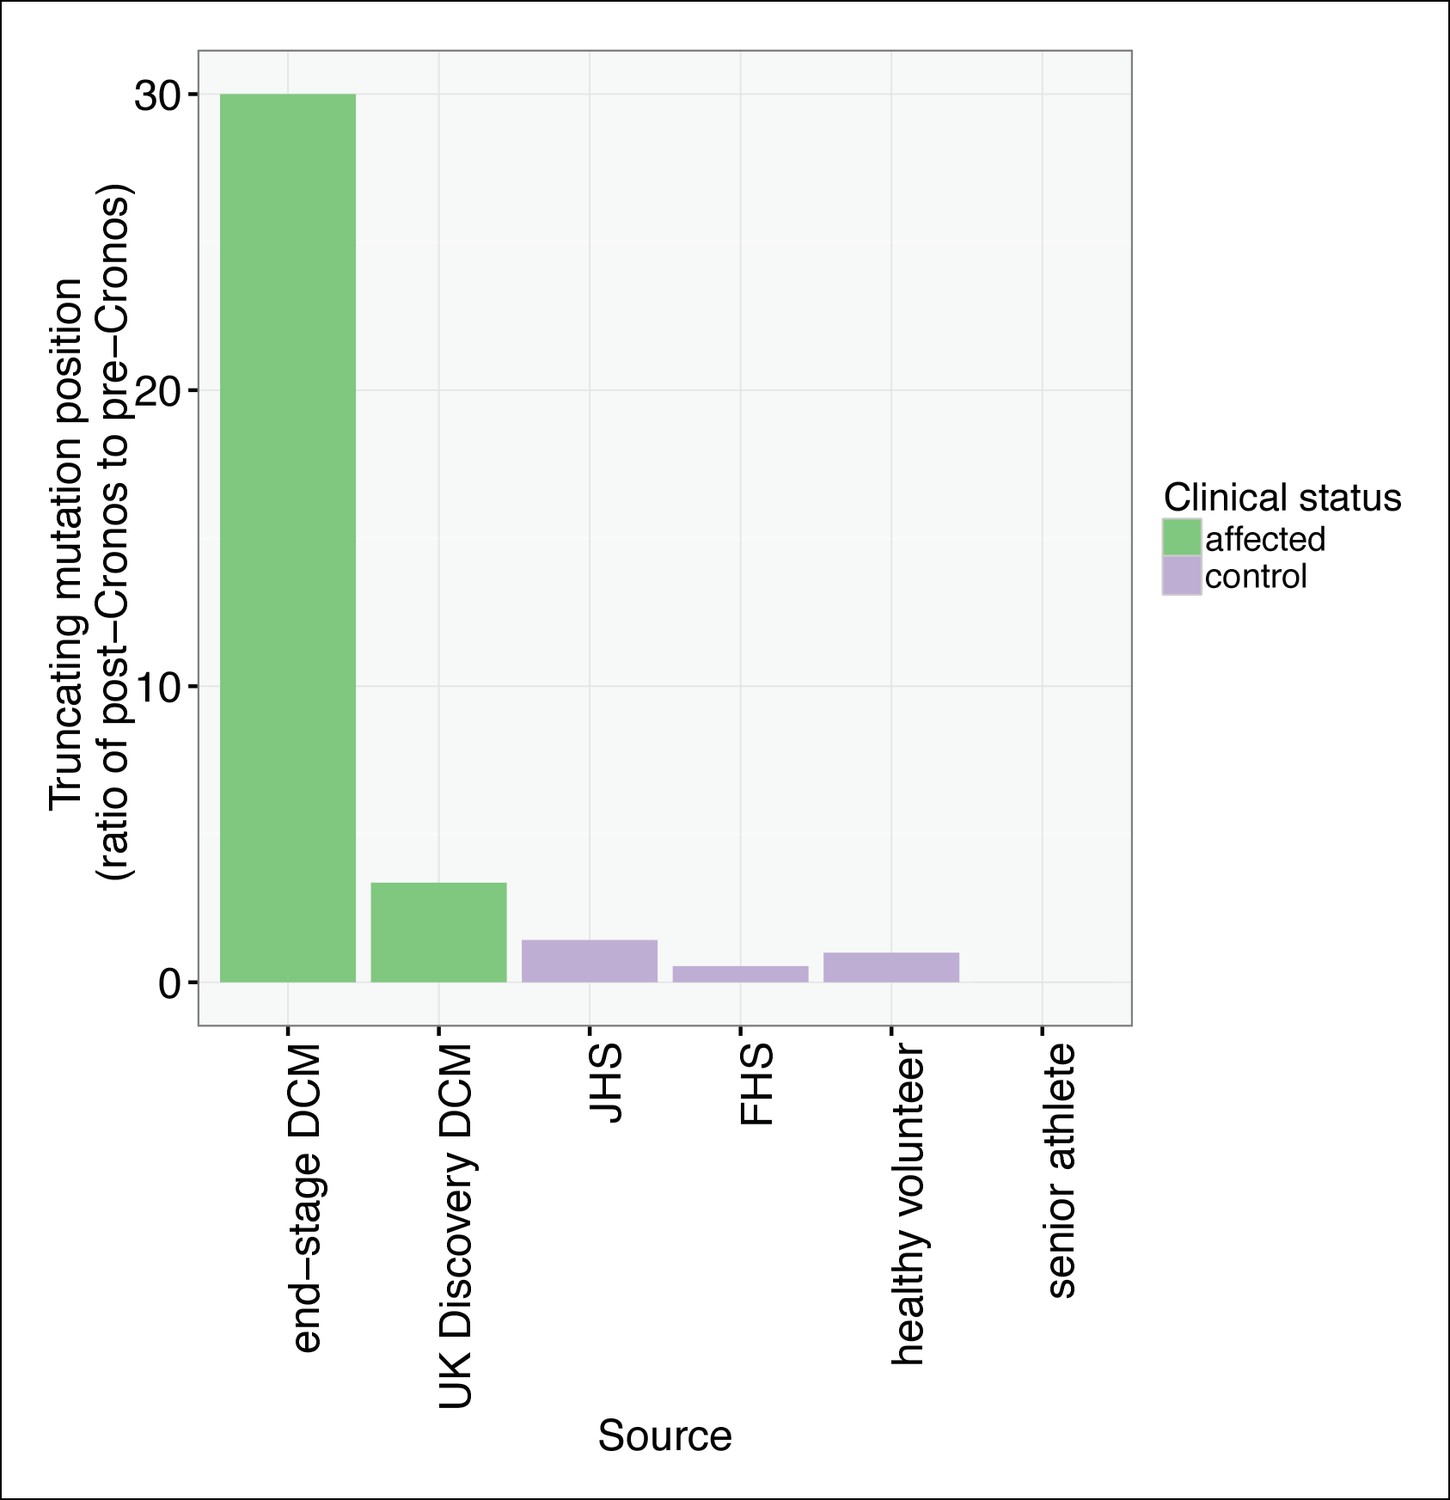
TTN truncations are found preferentially upstream of the Cronos promoter in controls but downstream of Cronos in DCM cases.
Ratio of the number of truncating mutations found C-terminal to the position of the Cronos promoter to those found N-terminal, in DCM cases and controls derived from the literature (Roberts et al., 2015) and in senior athletes.
Figure 7—figure supplement 1
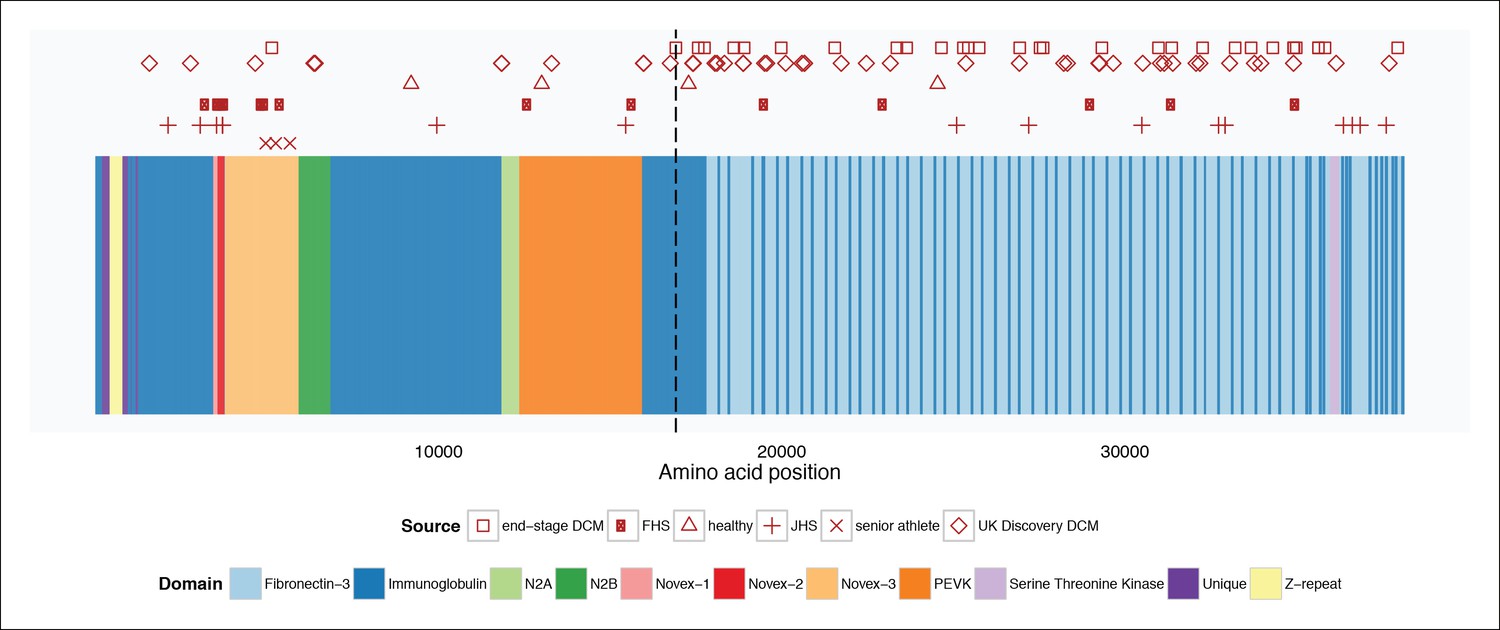
Mapping of TTN truncation mutations seen in literature cases and controls (Roberts et al., 2015) and senior athletes onto a schematic of the TTN meta-transcript.
Compared to literature controls, TTN truncations in senior athletes map at a significantly higher fraction to the Novex-3 exon (100% vs. 13%, p = 0.003). The vertical dotted line delineates the position of the first exon downstream of the Cronos promoter. FHS = Framingham Health Study. JHS = Jackson Heart Study.
Videos
Video 1
Cardiac contraction for wild-type, ttnan/n and ttnac/c mutants.
All embryos were imaged at 72 hpf.
Video 2
Motility assessment for wild-type, ttnan/n and ttnac/c mutants.
All embryos were imaged at 72 hpf.
Video 3
Motility for wild-type and ttnan/n mutants injected with internal promoter ATG morpholino
https://doi.org/10.7554/eLife.09406.014Tables
Table 1
Characteristics of six stable zebrafish truncation mutant lines. Size of insertion/deletion, PSI of corresponding exon in embryonic zebrafish heart and skeletal muscle, protein change using standard nomenclature (23), and corresponding human amino acid protein for the TTN meta-transcript are shown.
| Mutant ID | Mutation type | PSI of mutated exon (heart/skeletal muscle) | Zebrafish protein change# | Orthologous human amino acid position* |
|---|---|---|---|---|
| n1 | 7bp insertion | 1.000/1.000 | p.E1463fsX3 | 1697 |
| n2 | 1bp insertion | 1.000/1.000 | p.A2815GfsX3 | 3048 |
| n3 | 2bp deletion | 1.000/1.000 | p.Q7597GfsX8 | 9693 |
| c1 | 2bp deletion | 0.996/1.000 | p.E15193GfsX8 | 17996 |
| c2 | 4bp deletion | 1.000/0.995 | p.T18311GfsX8 | 21215 |
| c3 | 8bp insertion | 1.000/0.996 | p.A29052RfsX8 | 32003 |
-
#Amino acid numbering is relative to ENSDART00000109099. *Amino acid numbering is relative to TTN meta-transcript.
Table 2
Demographic characteristics of 199 senior athletes genotyped by capture-based targeted sequencing for this study.
| Number | 199 |
| Age | 73 (IQR 68-77) |
| Sex | 60% Male |
| Race | 97% European American |
| Sports | Track and field, volleyball, cycling, softball, marathon, … |
Additional files
-
Supplementary file 1
(A) 160 established and predicted cardiomyopathy and/or channelopathy genes whose exomes were targeted by capture-based sequencing; (B) Primers used in this study.
- https://doi.org/10.7554/eLife.09406.019
Download links
A two-part list of links to download the article, or parts of the article, in various formats.
Downloads (link to download the article as PDF)
Open citations (links to open the citations from this article in various online reference manager services)
Cite this article (links to download the citations from this article in formats compatible with various reference manager tools)
An internal promoter underlies the difference in disease severity between N- and C-terminal truncation mutations of Titin in zebrafish
eLife 4:e09406.
https://doi.org/10.7554/eLife.09406


