Misaligned feeding impairs memories
- University of California, Los Angeles, United States
Figures
Figure 1

Cartoon schematic of experimental design.
Standard mouse cages were modified to restrict access to the food chamber. Access was controlled by a motorized gate controlled by timed relay switches. Mice could only access food pellets when the gate was lifted (6 hr), and positive drive of the motor kept the gate closed for the remaining 18 hr. The scheduled feeding protocol was maintained for a minimum of 2 weeks prior to and during sample collections and behavioural tests, indicated by *. PER2::LUC, PER2-driven bioluminescence. LTP, long term potentiation. FC, fear conditioning. NOR, novel object recognition.
Figure 2
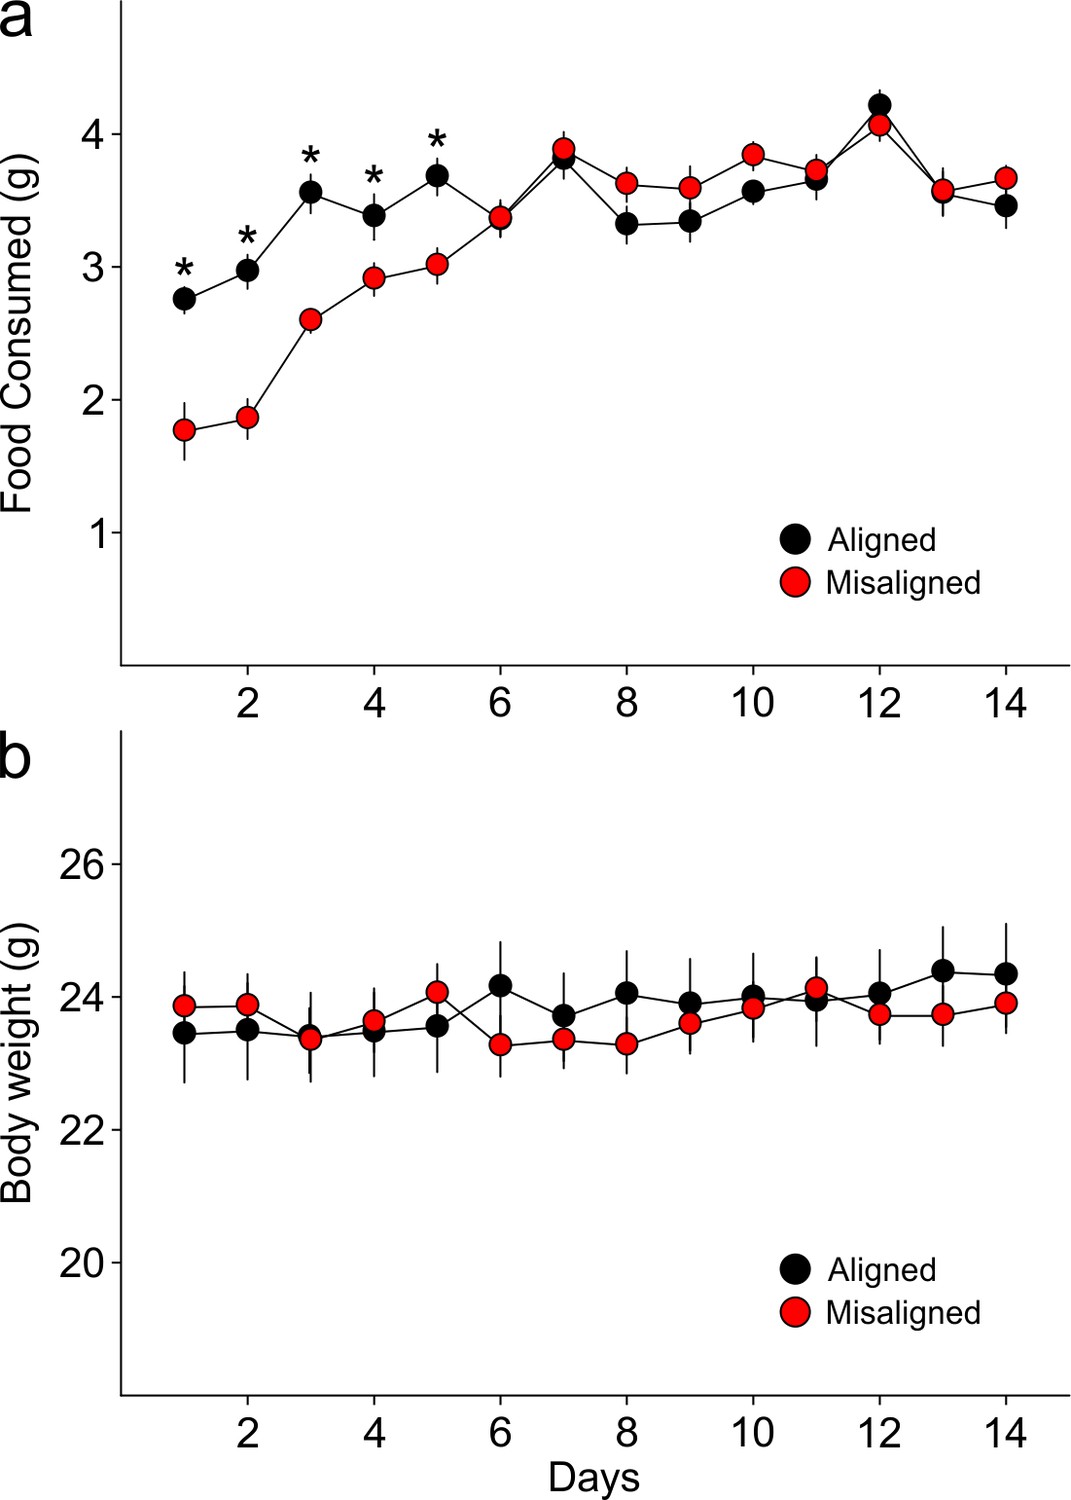
Food pellets in the automated feeding chambers were weighed daily to determine the amount of food consumed.
(a) Misaligned mice caught up with aligned mice in daily food consumption by day 6 of scheduled feeding (p = 0.9) and did not differ in food consumption subsequently (day 6–14 post hoc p > 0.2). (b) Mice were weighed daily prior to food access. Body weights between treatment groups did not differ significantly through the duration of scheduled feeding (two way ANOVA p = 0.3). Line graphs represent the mean ± SEM (n = 16 per treatment).
-
Figure 2—source data 1
Food consumption and body weights of mice subjected to aligned and misaligned feeding.
- https://doi.org/10.7554/eLife.09460.005
Figure 3 with 1 supplement
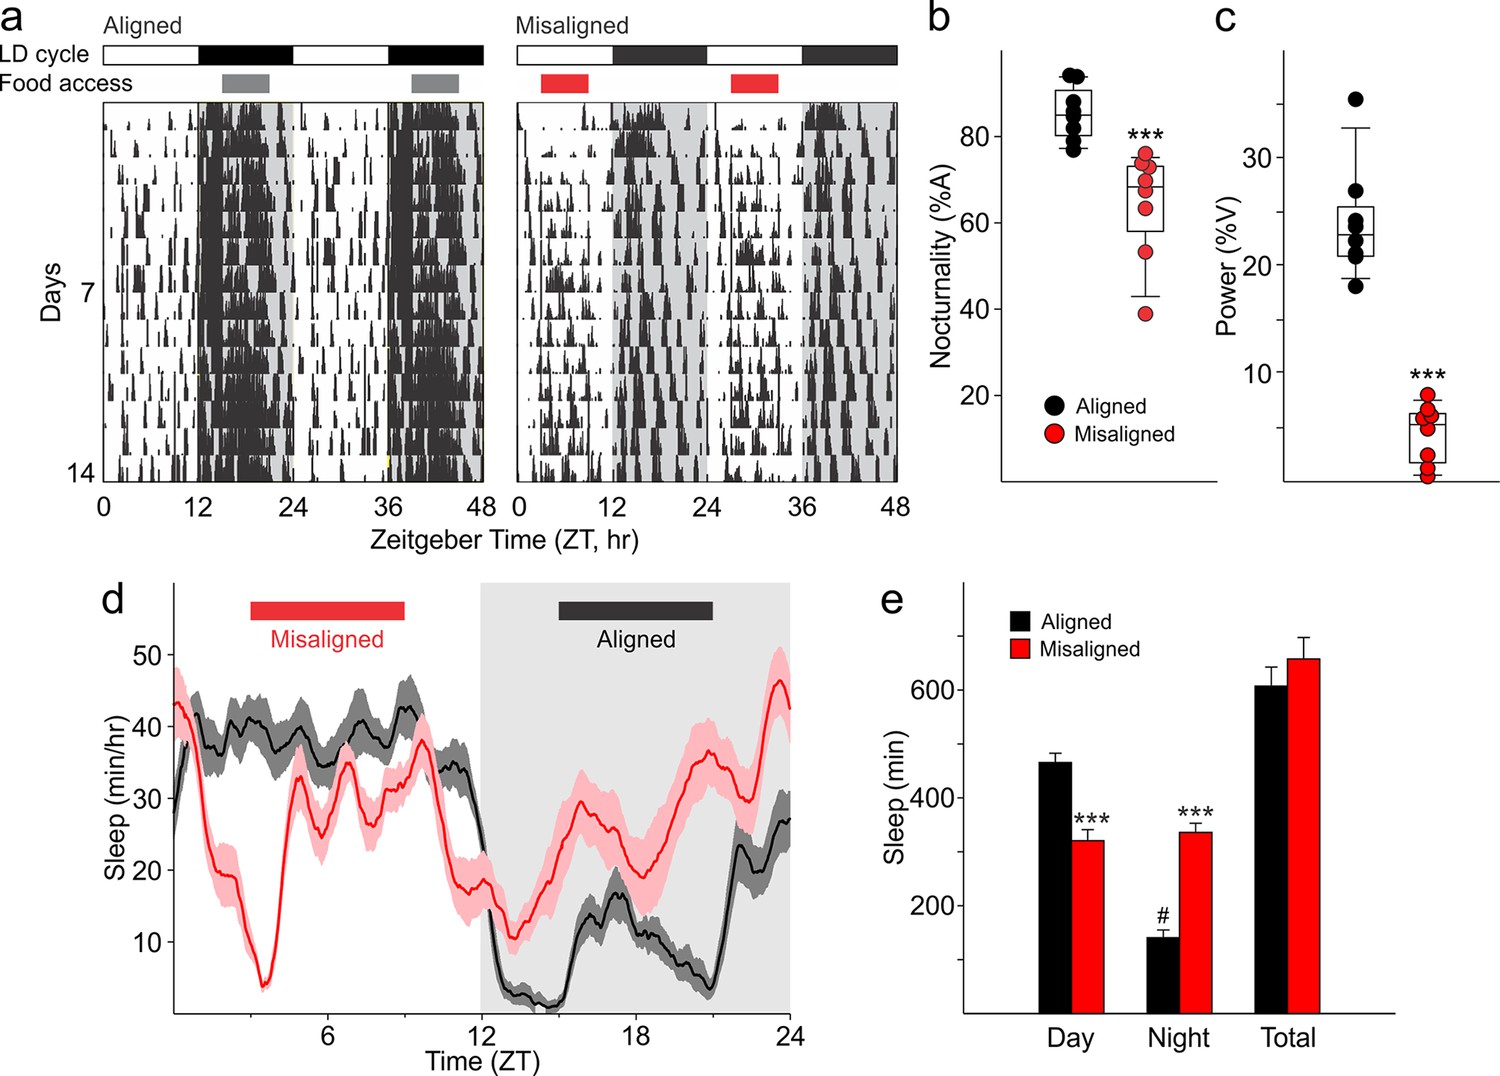
Altered temporal patterns of activity and sleep in mice subjected to misaligned feeding.
(a) Mice (n = 8 per treatment) were given 6 hr windows of food access during the middle of the night (aligned, grey) or day (misaligned, red). Representative double-plotted actograms show the increased daytime activity of the misaligned mice throughout the treatment in a 12 hr:12 hr light:dark (LD) cycle. Grey shading in the actograms indicates lights off. (b) Nocturnality (% activity in the night) is reduced in misaligned mice (***p < 0.001). (c) Rhythm strength measured by the amplitude of a chi-square periodogram (%V) is reduced in misaligned mice (**p < 0.01). Box and whisker plots display the 25th to 75th percentiles, and the 10th to 90th percentiles respectively, with the median indicated by a line. (d) Sleep was measured by video monitoring after 2 weeks of scheduled food access (n = 10 per treatment). Running averages of immobility-defined sleep are shown for mice given aligned (black) and misaligned (red) access to food. The grey shading indicates lights off in a 12:12 LD cycle. (e) Total time spent asleep during the day (12 hr), night (12 hr), or over 24 hr are shown. ***p < 0.001 as determined by t-tests of aligned vs misaligned groups; # p < 0.001 day vs night within treatment. Bar graphs represent the mean ± SEM.
-
Figure 3—source data 1
Activity and sleep rhythm parameters of mice subjected to aligned and misaligned feeding.
- https://doi.org/10.7554/eLife.09460.007
Figure 3—figure supplement 1
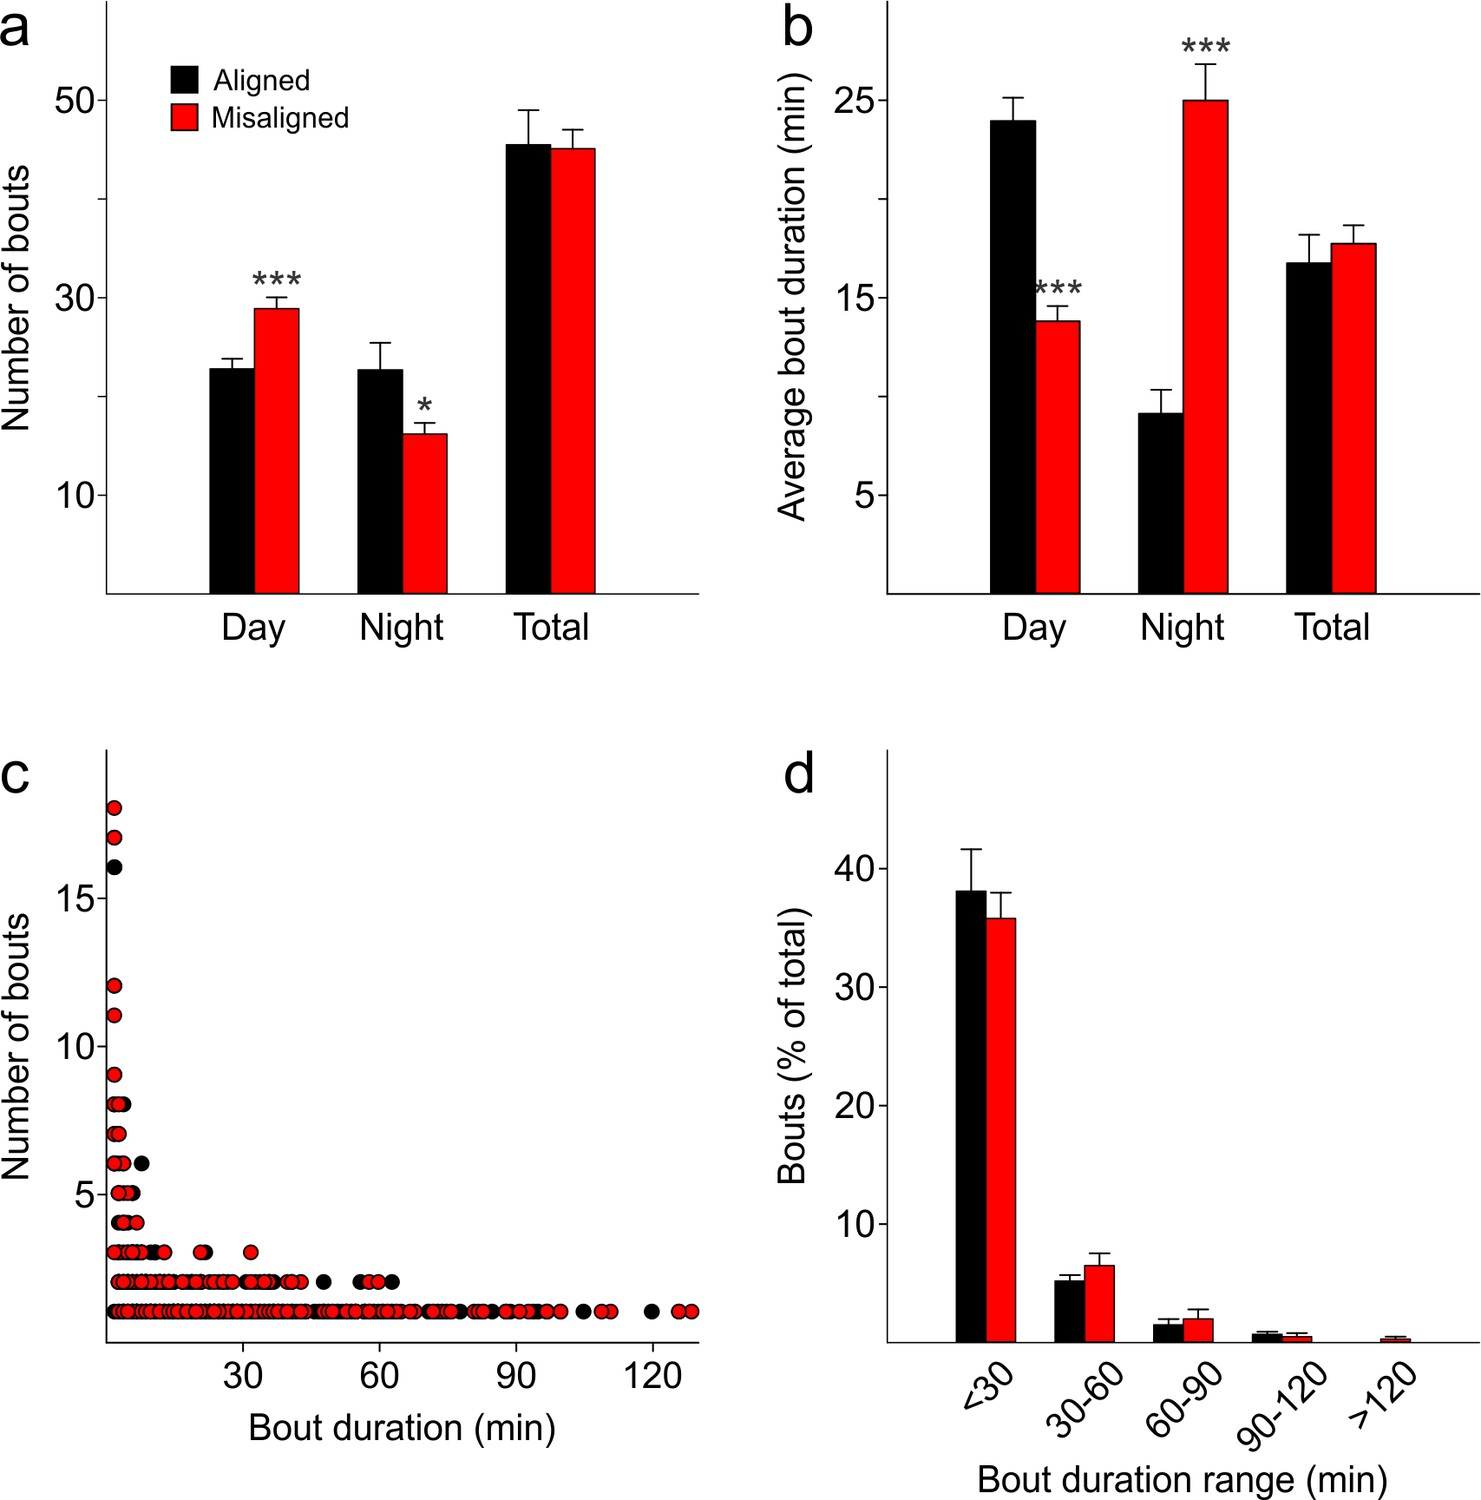
The temporal pattern of sleep fragmentation is altered by misaligned feeding without affecting overall sleep fragmentation over the 24 hr period.
(a) The number of sleep bouts during the day is increased in misaligned mice, decreased at night, and unchanged between groups when considered over 24 hr (total). (b) The average duration of a sleep bout is shorter in misaligned mice during the day, longer at night, and unchanged between groups over 24 hr (total). (c,d) The distribution of sleep bout lengths is similar between groups (p = 0.3). *p < 0.05, ***p < 0.001 as determined by t-tests of aligned vs misaligned groups. Bar graphs represent the mean ± SEM. Circles represent individual sleep bouts rounded to an integer minute.
Figure 4
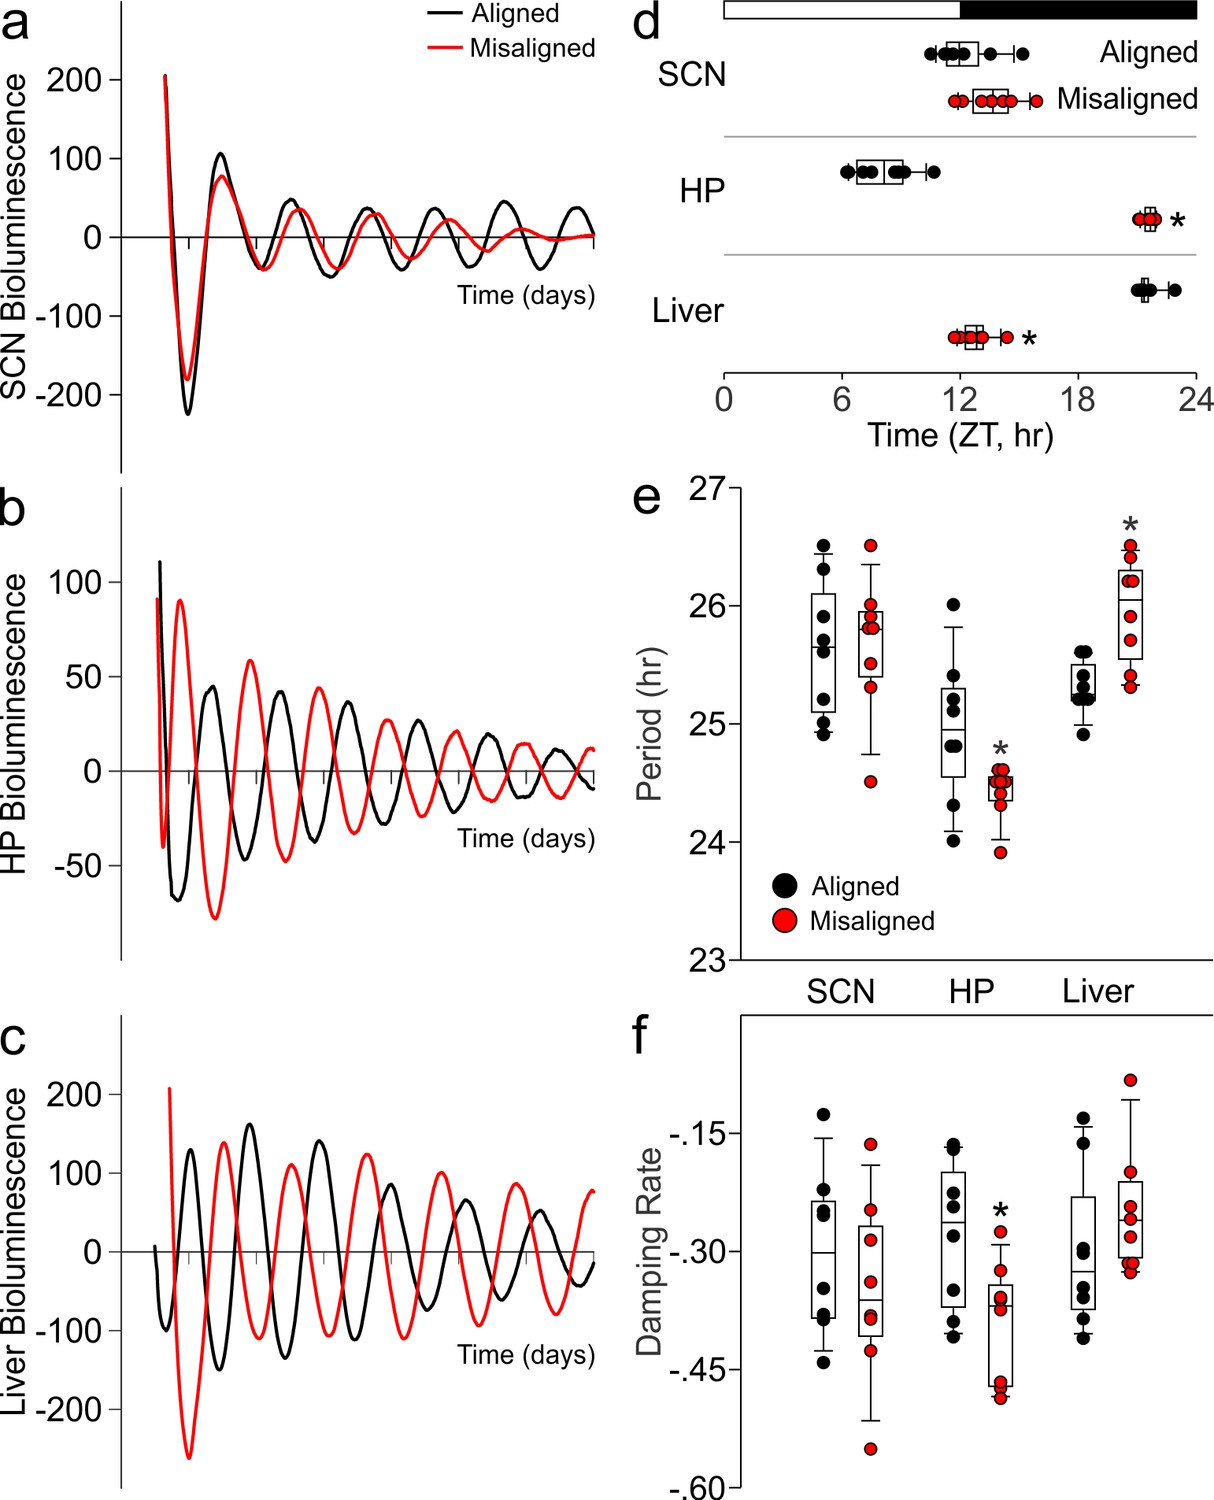
Differential impact of misaligned feeing on PER2-driven rhythms in bioluminescence of the SCN, hippocampus and liver (n = 8 per treatment).
Representative examples of baseline-subtracted traces of PER2-driven bioluminescence in the SCN (a), hippocampus (HP; b), and liver (c) explants from aligned (black) and misaligned (red) mice. (d) Phase relationship between the first calculated peaks of ex vivo bioluminescence plotted against time of the prior lighting cycle (ZT) shows a significant phase change in the HP and liver. (e) Period of bioluminescence rhythms were determined by sine wave fitting. (f) Damping rates were determined from 6 days in culture. *denotes significant differences (p < 0.05) between aligned and misaligned samples. Box and whisker plots display the median as a line, the 25th to 75th percentiles, and the 10th to 90th percentiles respectively.
-
Figure 4—source data 1
PER2-driven bioluminescence rhythms of mice subjected to aligned and misaligned feeding.
- https://doi.org/10.7554/eLife.09460.010
Figure 5 with 2 supplements
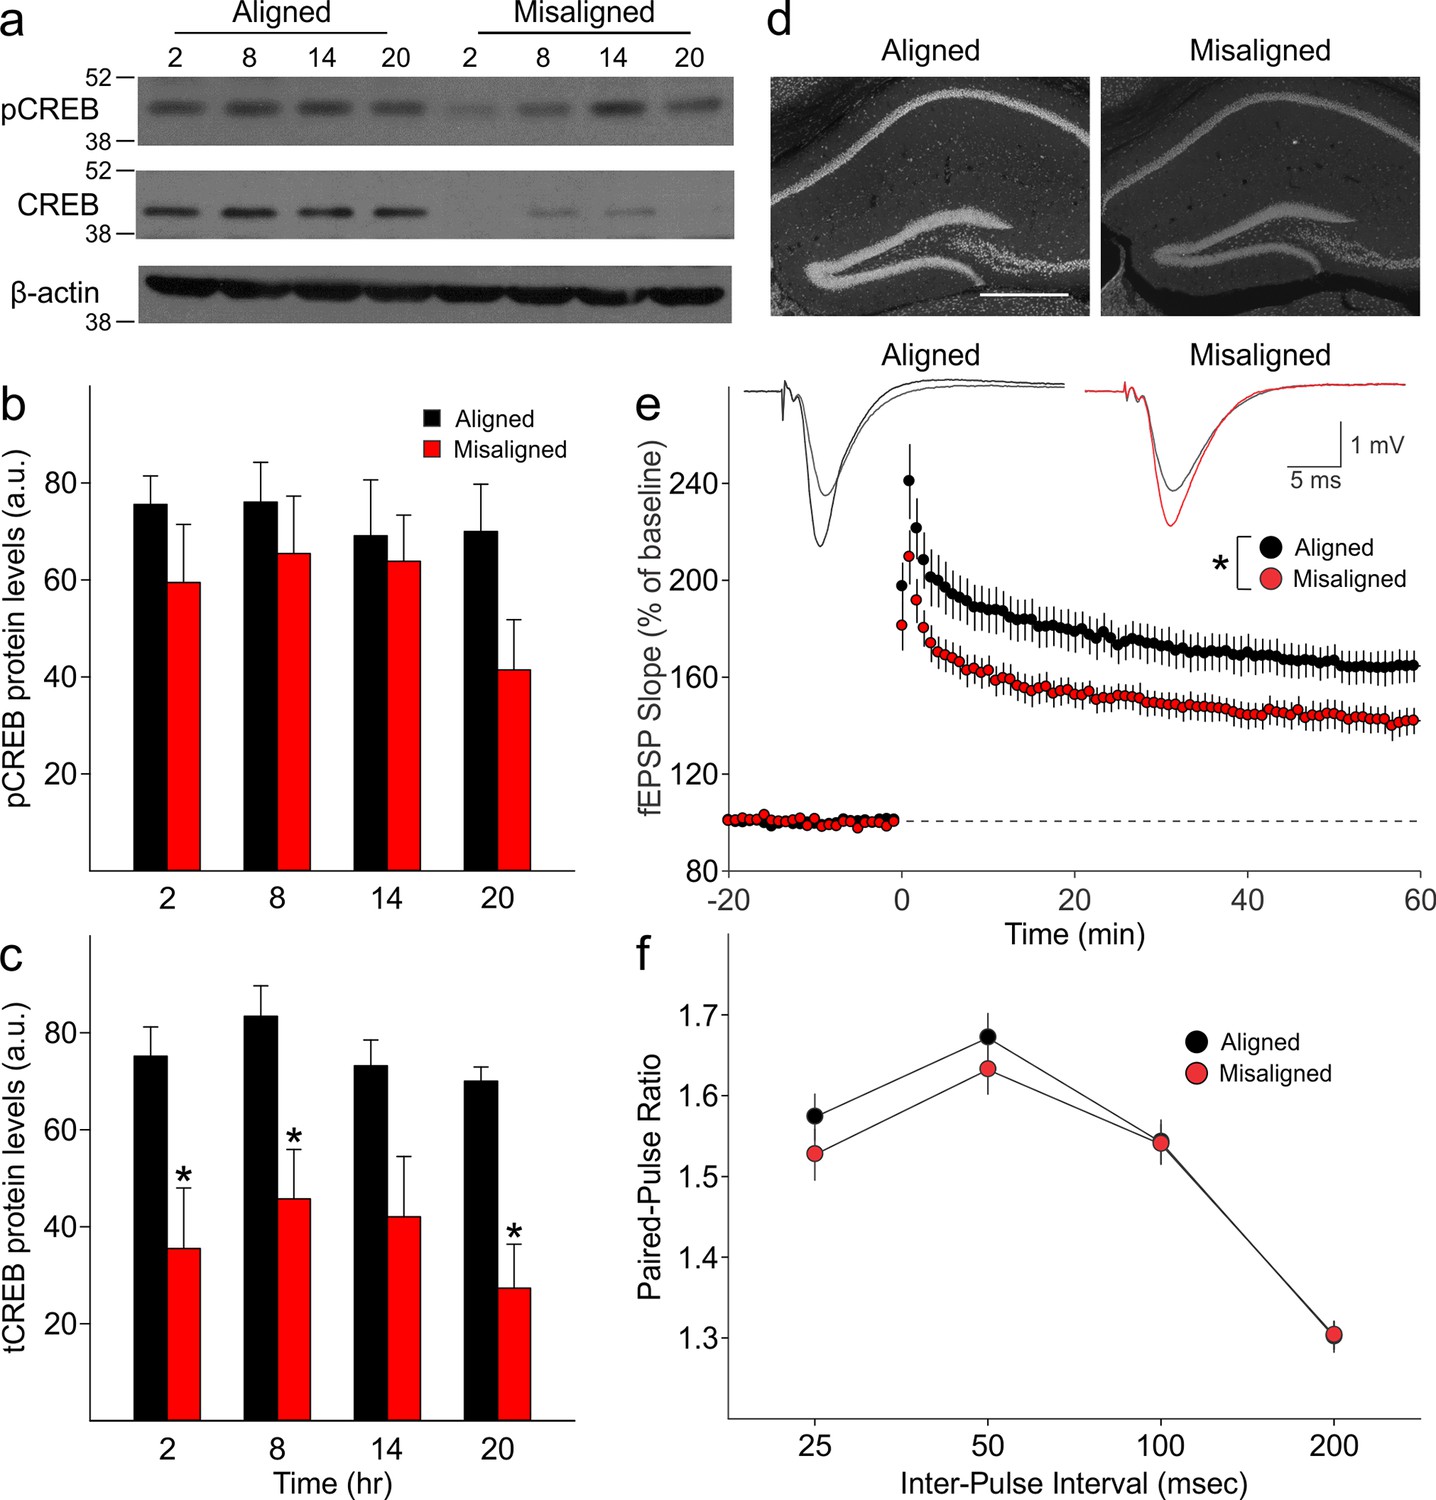
Reduced magnitude of hippocampal tCREB expression with a corresponding reduction in long term potentiation (LTP) in misaligned mice.
(a) Representative immunoblots show the decrease in tCREB expression levels in misaligned vs. aligned mice, sampled at 6 hr intervals through the daily cycle (ZT). (b) pCREB levels are not significantly altered. (c) Misaligned feeding led to significant decreased levels of tCREB (p < 0.01). * indicates significant differences between groups at each time point (post hoc p < 0.05). Protein levels are expressed as arbitrary units (a.u.). Bar graphs represent the mean ± SEM of aligned (n = 4) and misaligned (n = 5) animals per time point. (d) tCREB immunoreactivity is decreased throughout the hippocampus in misaligned mice. Scale bar = 500 µm. (e) LTP was induced by high-frequency stimulation of the Schaffer collateral fibres, 2 x 100 Hz, 1 sec duration, 10 sec inter-train interval, delivered at time = 0. Daytime LTP responses recorded from the CA1 region were significantly decreased in misaligned mice (n = 6; p < 0.05) compared to aligned mice (n = 6). The inset shows fEPSPs recorded during baseline and 55–60 min post-HFS in aligned (left) and misaligned slice (right). (f) Paired-pulse facilitation ratios changed with intervals (p < 0.001), but were not significantly different between aligned and misaligned mice (p = 0.5) and no interactions between both factors were detected (p = 0.8). Line graphs represent the mean ± SEM (n = 6 per treatment).
-
Figure 5—source data 1
Hippoca mpal CREB levels and LTP in mice subjected to aligned and misaligned feeding.
- https://doi.org/10.7554/eLife.09460.012
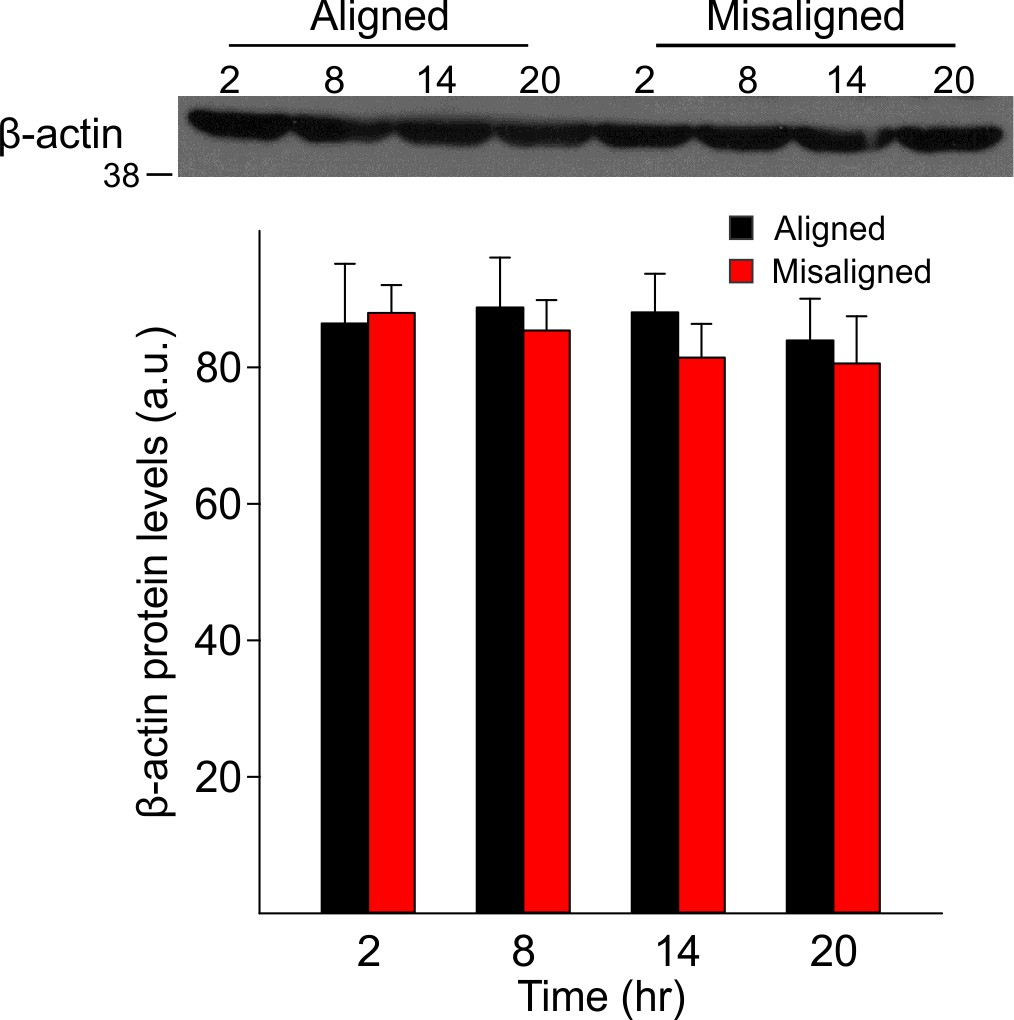
Figure 5—figure supplement 1
Expression levels of β-actin did not vary with time of day in both groups (p = 0.9), nor between aligned and misaligned mice (p = 0.9).
Bar graphs represent the mean ± SEM of aligned (n = 4) and misaligned (n = 5) animals per time point.
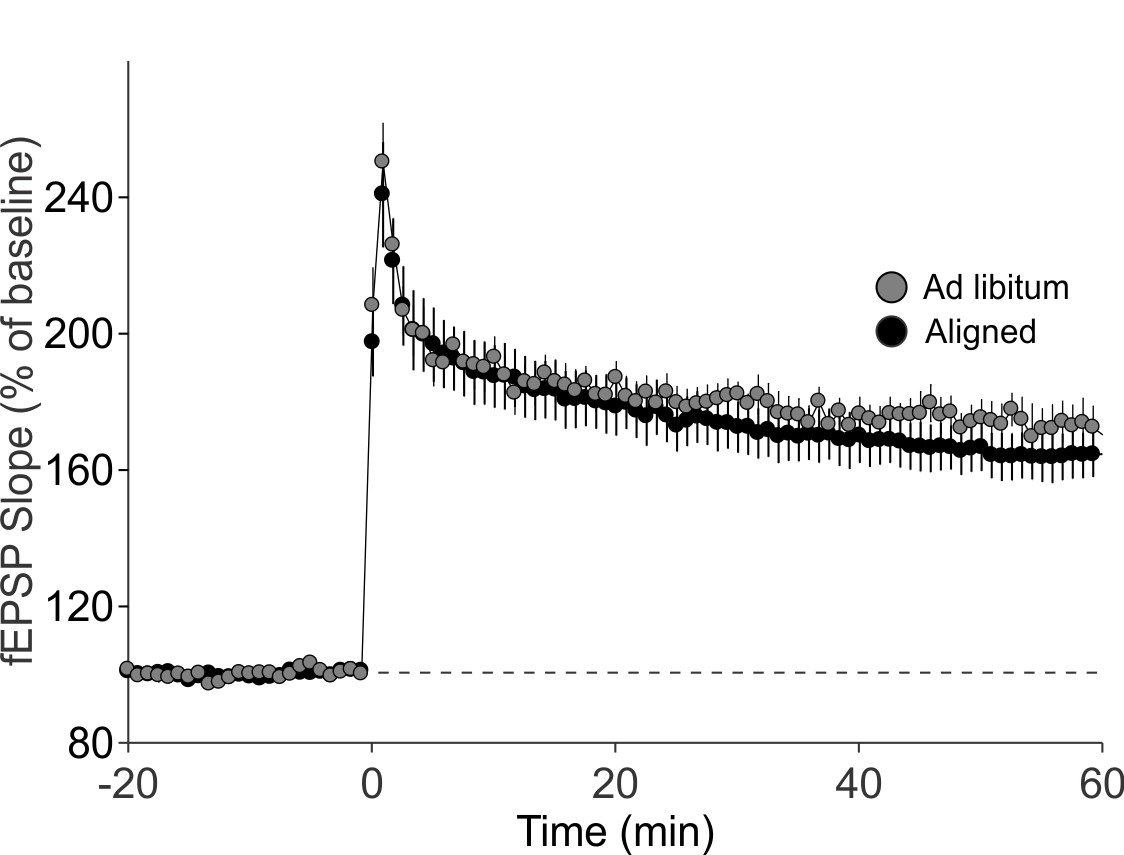
Figure 5—figure supplement 2
Aligned feeding does not significantly alter LTP magnitude compared to mice under ad libitum feeding (p = 0.4).
LTP was induced in both groups using the same protocol; data from aligned mice is the same as reported in Figure 5e.
Figure 6 with 1 supplement
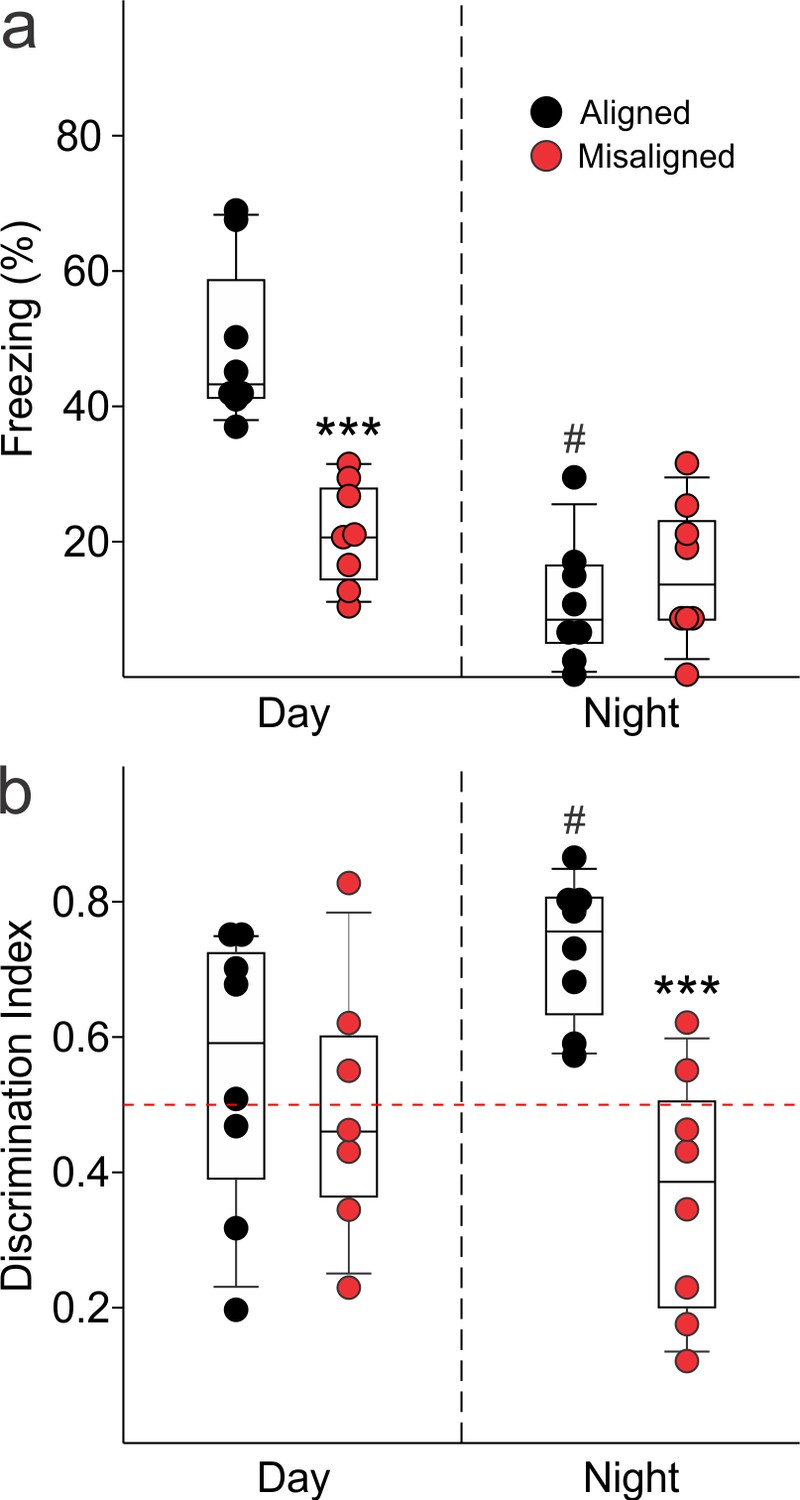
Memory deficits arise from misaligned feeding in mice.
(a) Recall of the fear conditioned (FC) context is measured by the percentage of freezing when re-exposed to the fearful context. Misaligned mice (n = 8) show significant deficits in recall of contextual (FC) compared to aligned mice (n = 8;***p < 0.001) when trained and tested during the day (ZT 2). Circadian regulation of learning and memory is demonstrated by the decreased recall in aligned mice trained and tested at night (ZT 14; n = 8; #p < 0.001). This time of day effect is lost in misaligned mice (n = 8), which perform equally poorly at both times. (b) Novel object recognition (NOR) is reported using a discrimination index of Tnovel/(Tnovel+Tfamiliar), and mice are considered to exhibit NOR at values of 0.5 and above (dotted red line). NOR is impaired in misaligned mice trained and tested at night (ZT 21; n = 8) compared to aligned mice (n = 8; ***p < 0.001). Time of day effects were also found for NOR in aligned mice (n = 8; #p < 0.01), which perform better during the night than day (ZT 9). Misaligned mice fail to show a time of day effect (n = 7), again showing equally poor performance at both times. Box and whisker plots display the median as a line, the 25th to 75th percentiles, and the 10th to 90th percentiles respectively.
-
Figure 6—source data 1
Performance on long term memory tests in mice subjected to aligned and misaligned feeding.
- https://doi.org/10.7554/eLife.09460.016
Figure 6—figure supplement 1
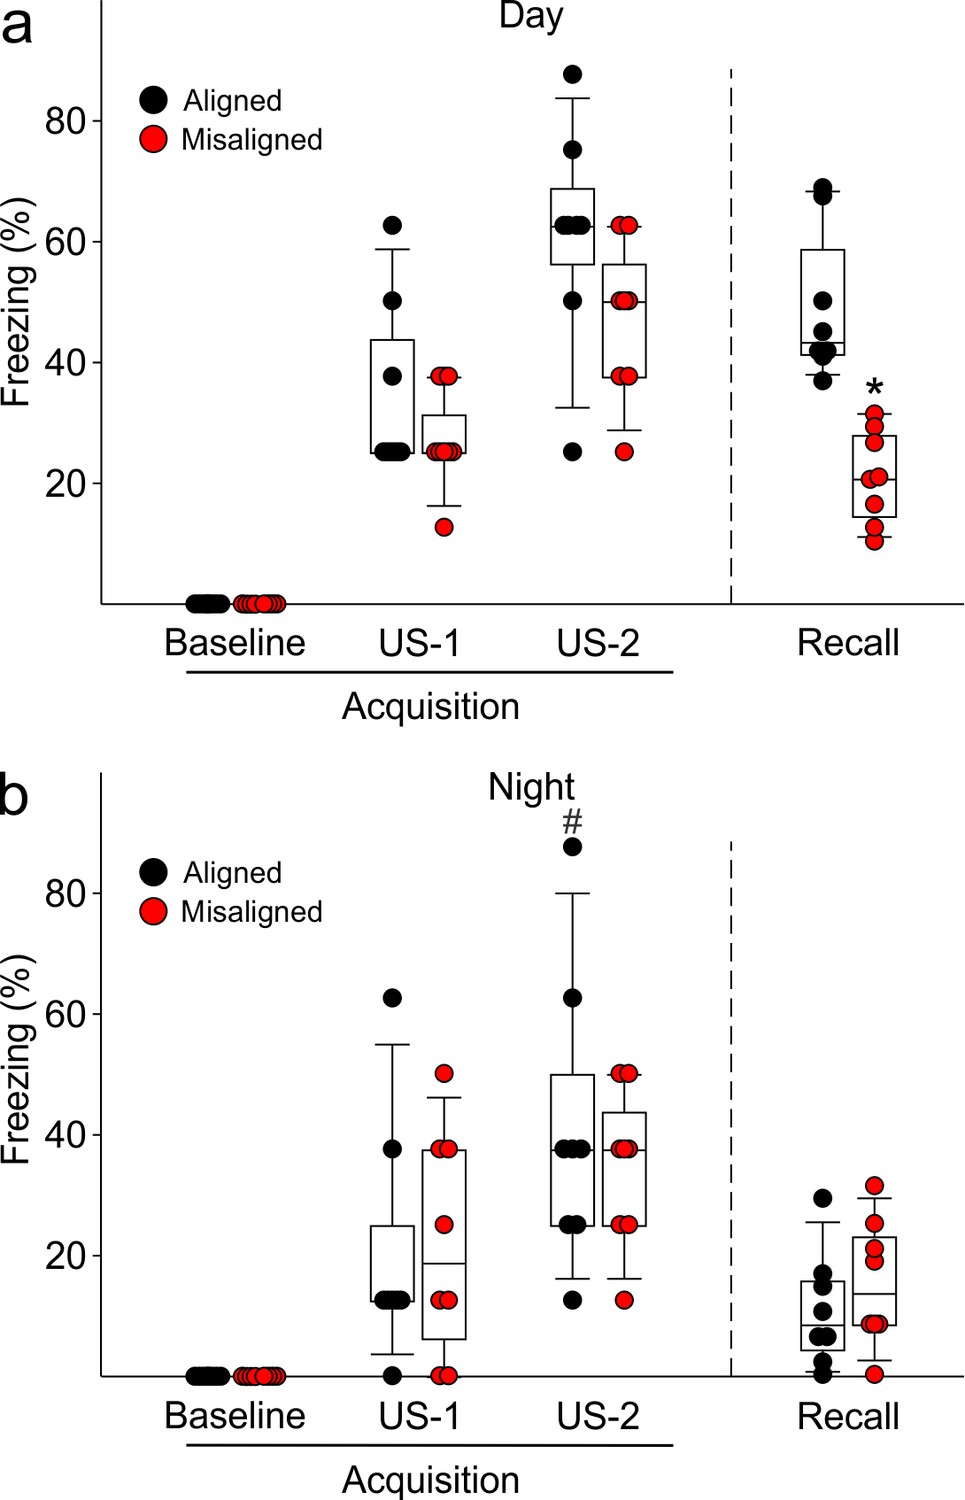
Acquisition of FC freezing in the day (ZT 2, n = 8/group) and night (ZT 14; n = 8/group) are unaltered by misaligned feeding.
(a) Misaligned mice did not show significant changes in baseline freezing (p = 0.3), freezing in response to the first foot shock (US-1; p = 0.9), or freezing in response to the second foot shock (US-2; p = 0.1). Recall was significantly reduced in misaligned mice as reported in the main text and Figure 6. (b) Misaligned feeding did not cause differences in baseline freezing (p = 1.0), nor in acquisition of freezing in response to US-1 (p = 0.9) and US-2 (p = 0.5). There was a time of day effect on freezing in response to US-2 (#p < 0.05), as previously reported (2).
Download links
A two-part list of links to download the article, or parts of the article, in various formats.
Downloads (link to download the article as PDF)
Open citations (links to open the citations from this article in various online reference manager services)
Cite this article (links to download the citations from this article in formats compatible with various reference manager tools)
Misaligned feeding impairs memories
eLife 4:e09460.
https://doi.org/10.7554/eLife.09460


