Super-resolution kinetochore tracking reveals the mechanisms of human sister kinetochore directional switching
- University of Warwick, United Kingdom
Figures
Figure 1
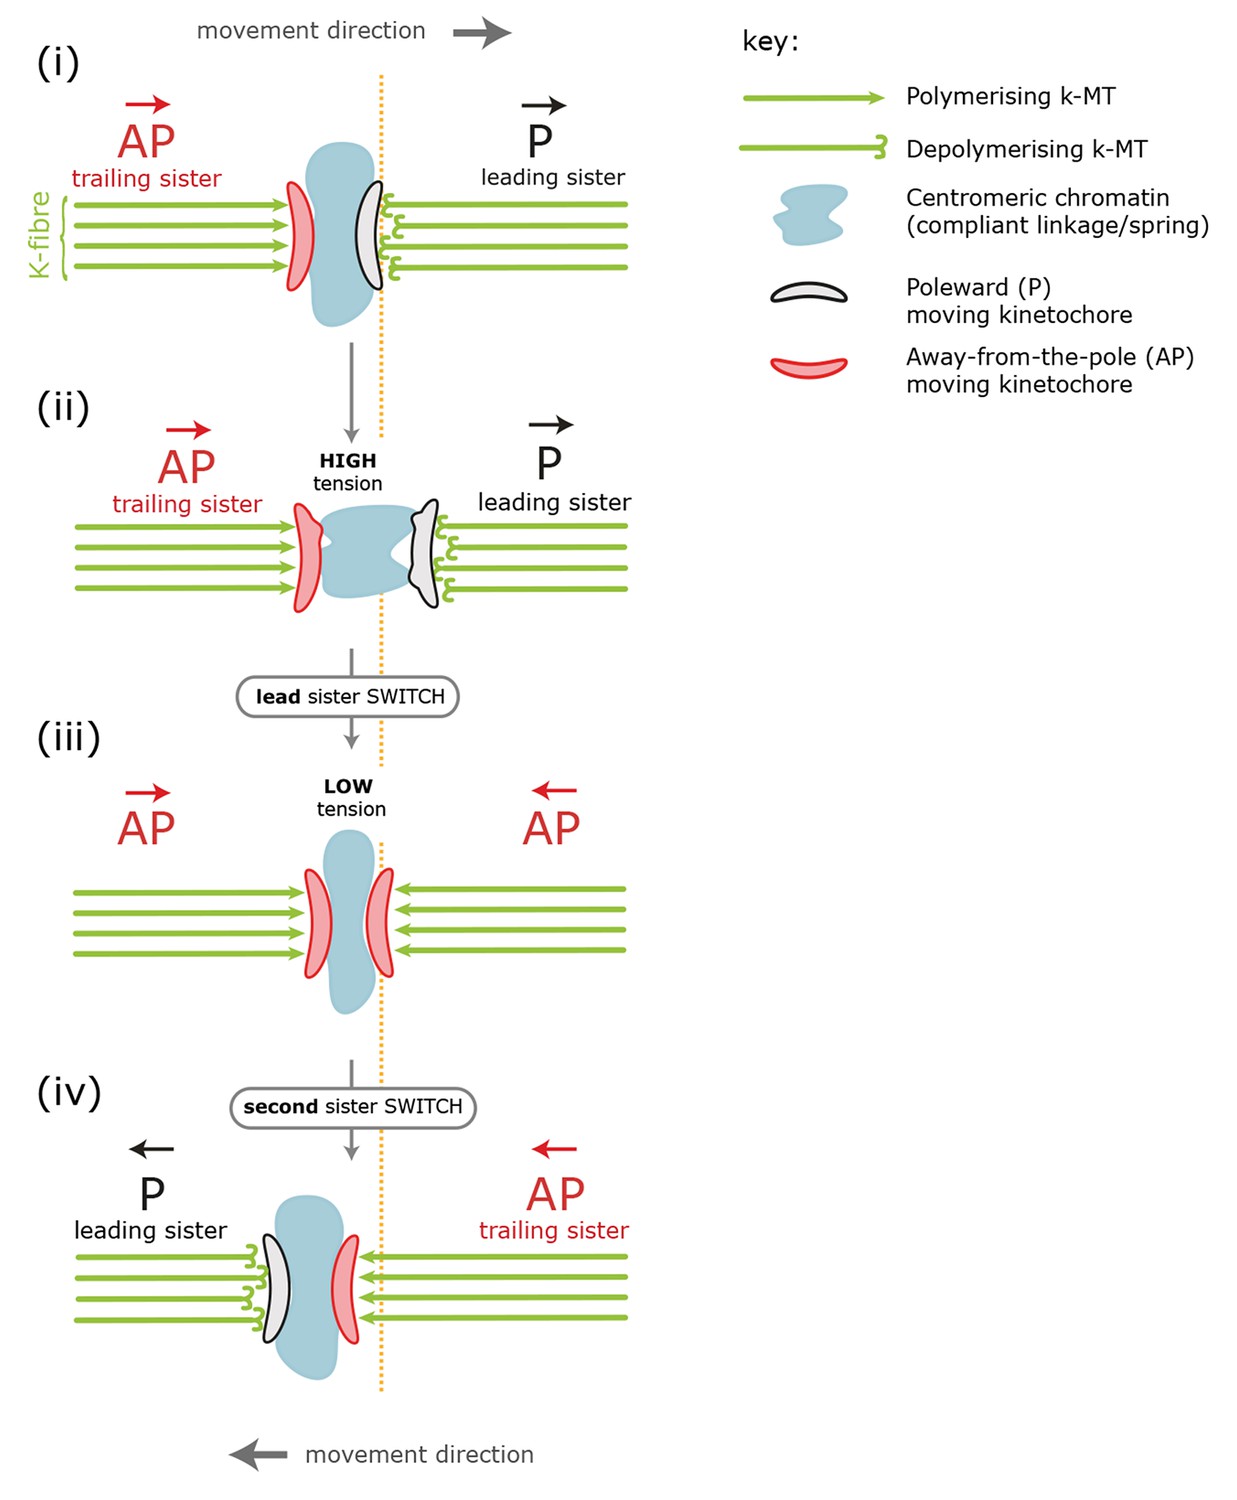
Standard model for kinetochore directional switching.
Schematic outlining the prevailing model for how sister kinetochores coordinate directional switches. As the leading, poleward-moving, kinetochore (P; black) moves to the right, the centromeric chromatin (blue) – which functions as a compliant linkage between sisters – becomes progressively more stretched (steps i, ii). Stretching occurs because the trailing, away-from-the-pole, kinetochore (AP; red) is moving more slowly than the lead. Once sisters are at maximum stretch, the tension in the chromatin is thought to trigger the lead sister kinetochore to switch into an AP state. This results in a rapid loss of tension as both sisters are then in an AP state and moving towards each other (step iii). This relaxation is thought to trigger switching of the initially trailing sister into a P-moving state (step iv). Adapted from Wan et al., 2012.
Figure 2 with 1 supplement
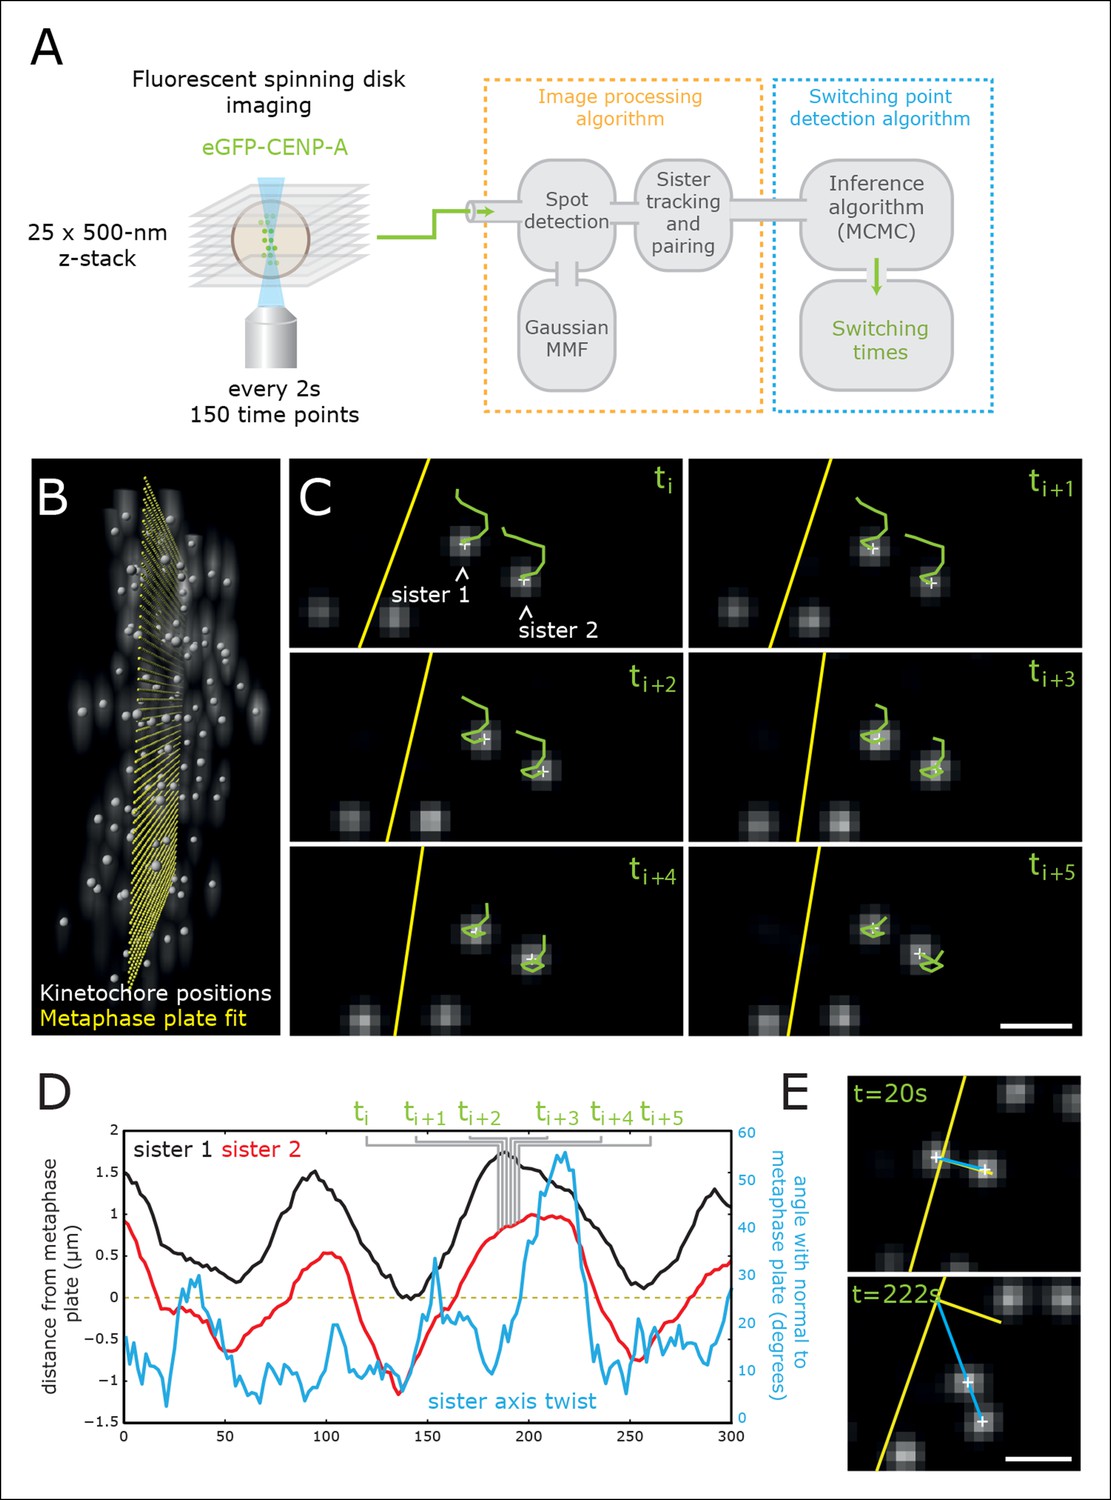
High-throughput tracking of kinetochores with sub-pixel spatial resolution.
(A) Imaging and analysis flow chart summarising the steps of image sequence acquisition, image processing and statistical trajectory analysis. MMF- mixture model fitting, MCMC- Markov chain Monte Carlo algorithm. (B) 3D view of kinetochores (eGFP-CENP-A – spot location marked by white spheres) relative to the metaphase plate (yellow spheres). (C) 2D images (single Z plane) of a sister kinetochore pair over six frames. Green tails represent kinetochore trajectories over the previous six frames (12 s). Yellow line indicates the metaphase plate intersection with the image plane. Sub-pixel kinetochore positions marked with white crosses. Scale bar = 1 µm. (D) Full sister pair trajectory showing the (normal) distance from the metaphase plate of the two sisters (black and red), and the sister axis twist angle relative to the metaphase plate normal (blue). Frames indicated in green correspond to the image slices shown in (C). (E) 2D images (single Z plane) of the sister kinetochore pair in (C/D) at the minimum and maximum twist. Sister axis shown in blue, metaphase plate and its normal in yellow. Scale bar = 1 µm.
Figure 2—figure supplement 1
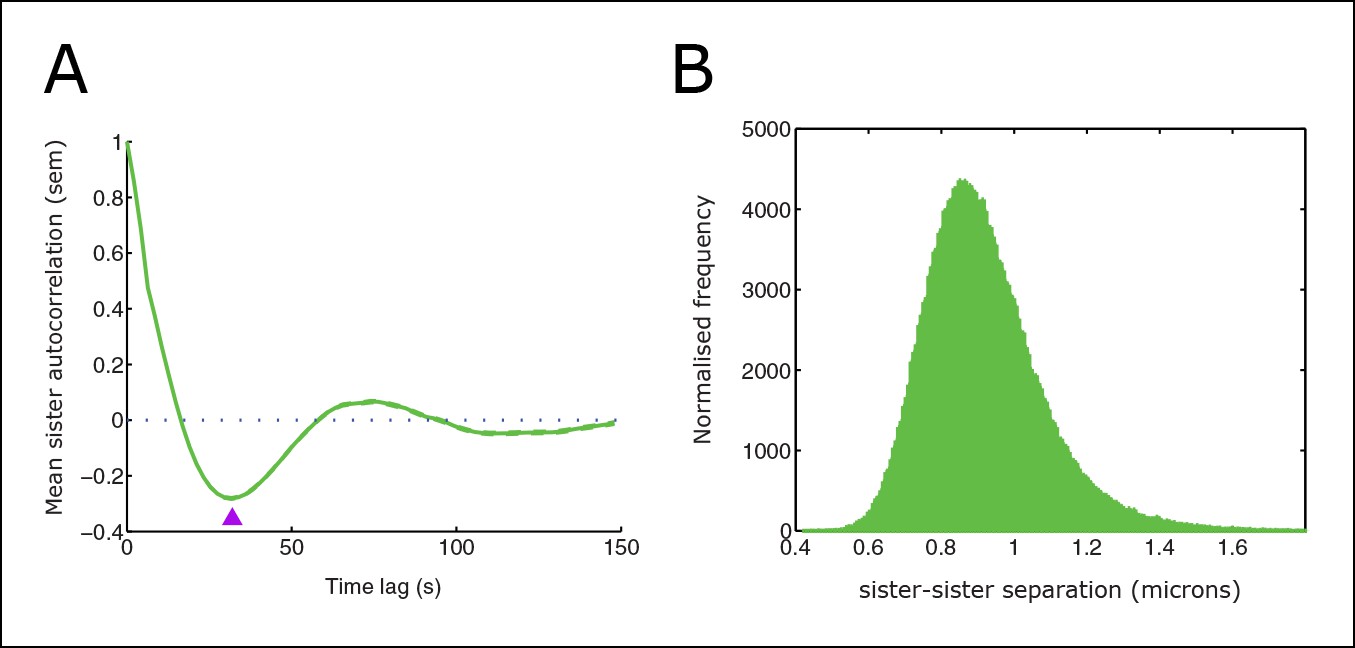
Sister distance autocorrelation and distribution.
(A) Autocorrelation of sister centre displacements (∆x) over four frames (8 s) normal to the metaphase plate. Purple arrow indicates the half-period of oscillations. (B) Histogram of sister–sister separations. Data from 55 cells, 1529 trajectories, eGFP-CENP-A cell line.
Figure 3 with 1 supplement
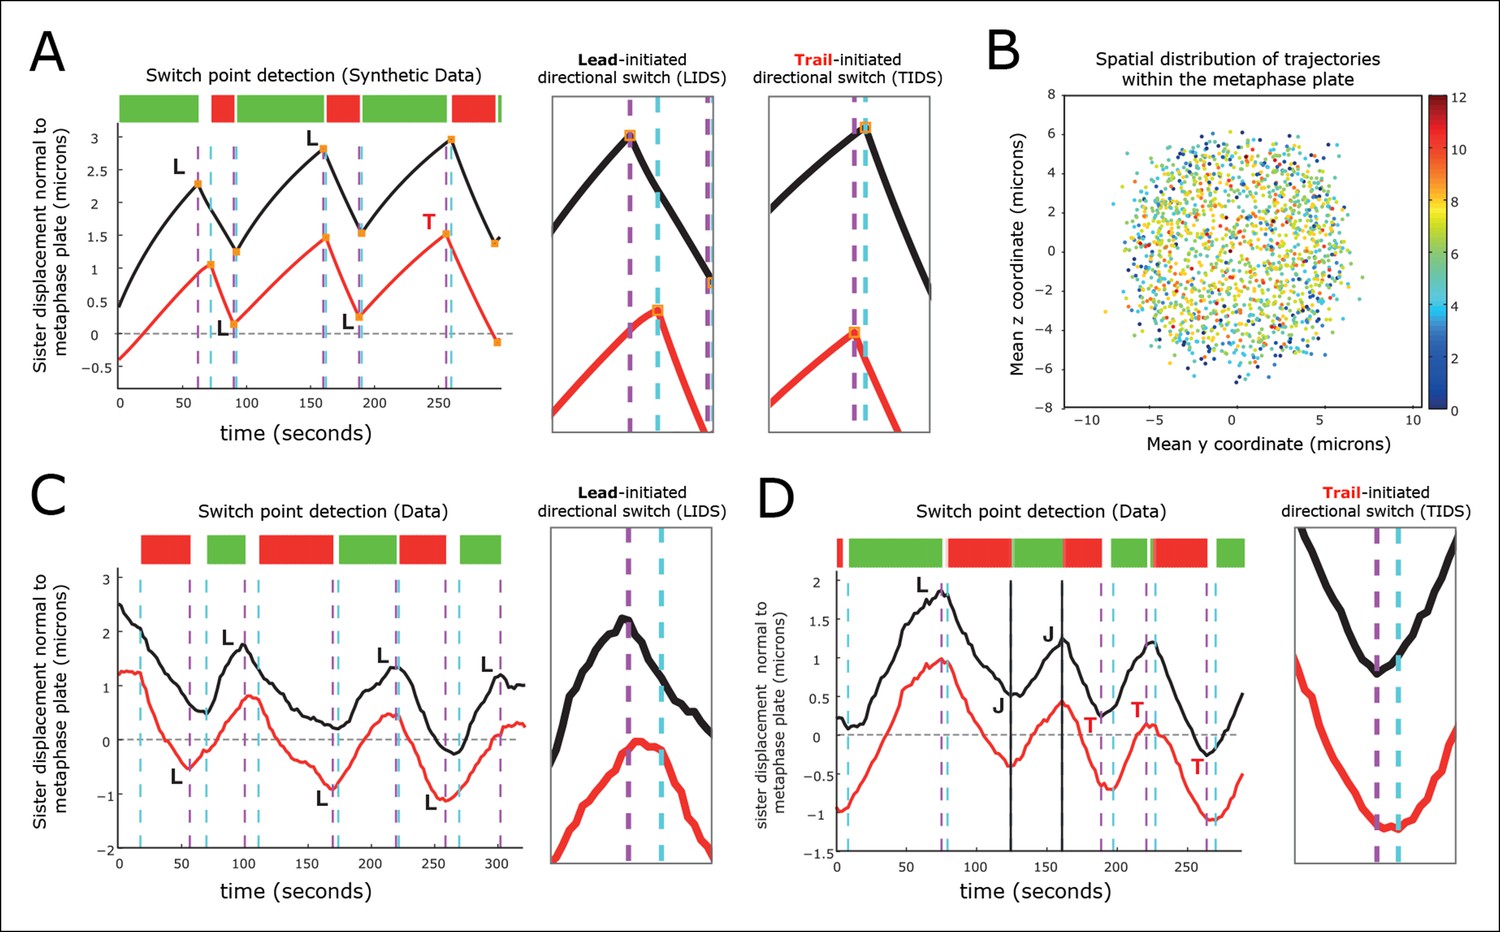
Kinetochore switching dynamics.
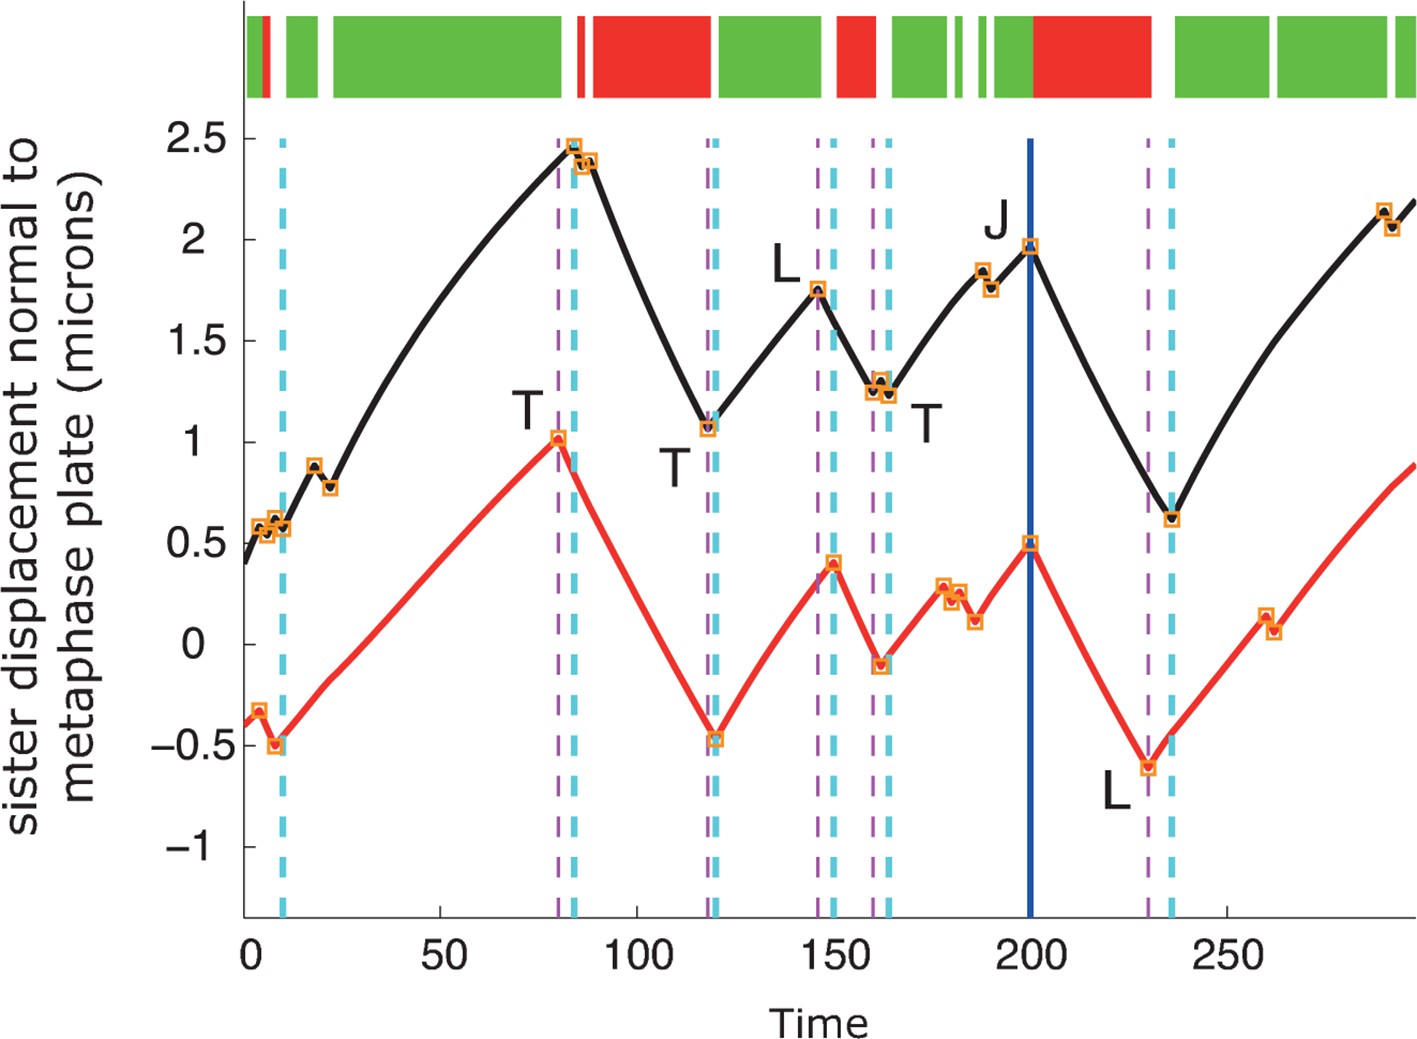
(A) Event detection on a synthetic data set with idealised oscillation of two sisters (for parameters, see ‘Materials and methods’). True switchings are shown as orange squares with true coherent state shown at the top of the figure. Green shows depolymerising/polymerising sister state (-/+), and red shows polymerising/depolymerising sister state (+/-), sister 1/sister 2, respectively. Detected switching events shown as vertical dashed lines: coherent run initiation/end shown in cyan/purple, respectively. The sister that initiates a directional switch is indicated: lead (L) initiated directional switch (LIDS), trail (T) initiated directional switch (TIDS) and joint (J) directional switch (JDS). Horizontal grey line indicates position of spindle equator. Enlargements of LIDS and TIDS events. (B) Trajectory positions within the metaphase plate viewed along the spindle axis (y,z). Colour indicates the number of events detected in the trajectory that end a coherent run, n=1529 trajectories from 55 cells. (C, D) Example trajectories from live cells showing detection of switching, colours as in (A) except inferred coherent state is shown at the top and joint switching events shown as vertical solid black lines.
Figure 3—figure supplement 1
Autoregressive model simulation produces qualitatively realistic oscillations.
A simulation of the autoregressive statistical model underlying the switch point detection algorithm with corresponding event detection using the switch point algorithm. True switchings are shown as orange squares with coherent state shown at the top of the figure (green sisters state -/+, red +/-). Detected switching events are shown as vertical dashed lines: coherent run initiation/end shown in purple and cyan, respectively. The sister detected to initiate the directional switch is indicated: lead (L) initiated directional switch (LIDS), trail (T) initiated directional switching (TIDS) and joint (J) directional switching (JDS). All directional switching events are correct assignments. For simulation parameters, see ‘Materials and methods’.
Figure 4 with 2 supplements
Directional switching event signature in the inter-sister distance.
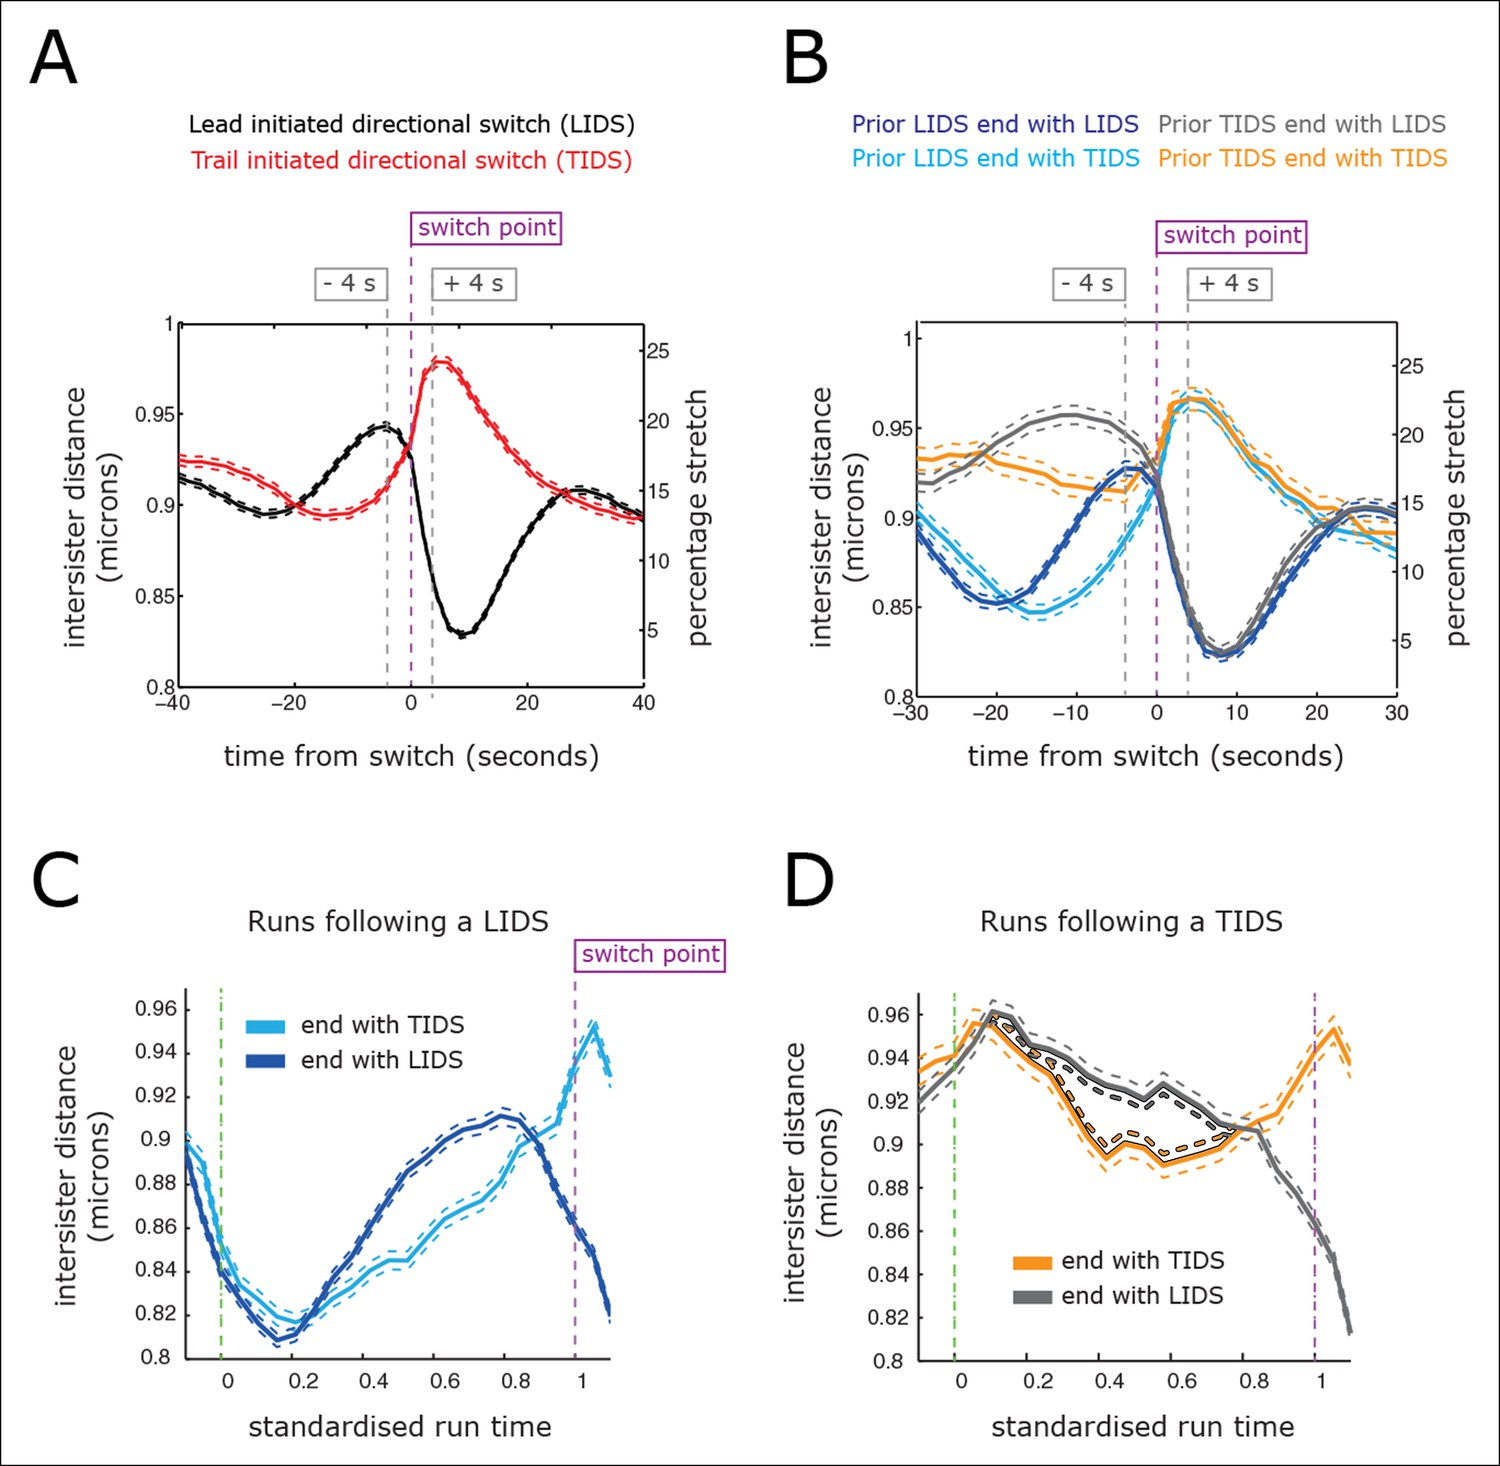
(A) Time profiles across the first switching event of a directional switch according to type (lead initiated directional switch [LIDS], trail initiated directional switch [TIDS]). Events from trajectories where the lead (LIDS, n=4900; red) or trail (TIDS, n=3143; black) kinetochore switched first were aligned at their modal switching time (time origin, vertical dashed purple line). Solid lines indicate mean values over time, dashed lines ± 1 SEM, smaller than the line thickness where not visible. (B) Time profiles across the first sister switch according to type (LIDS, TIDS) separated by prior event (prior LIDS, subsequent LIDS, TIDS n=1536 [dark blue], 936 [pale blue] respectively, prior TIDS and subsequent LIDS, TIDS n=986 [grey], 628 [orange), respectively]). In (A, B), the percentage stretch relative to the relaxed spring length (determined under nocodazole treatment) is shown on the right axis. Vertical dashed grey lines show 4 s before and 4 s after switch event. (C) Inter-sister distance over a standardised average coherent run after a LIDS event categorising runs that exhibit a subsequent LIDS (dark blue) or TIDS (light blue). (D) Inter-sister distance after a TIDS categorising runs that exhibit a subsequent LIDS (grey) or TIDS (orange). In (C, D), run length is limited to be 6–20 frames inclusive (12–40 s) and rescaled to a standard length of 1 (proportion of run). Sample sizes as (B). Dashed lines indicate ± 1 SEM. Vertical green and purple dashed lines indicate the start and end of the coherent run.
Figure 4—figure supplement 1
Variability in switching times across coherent runs.
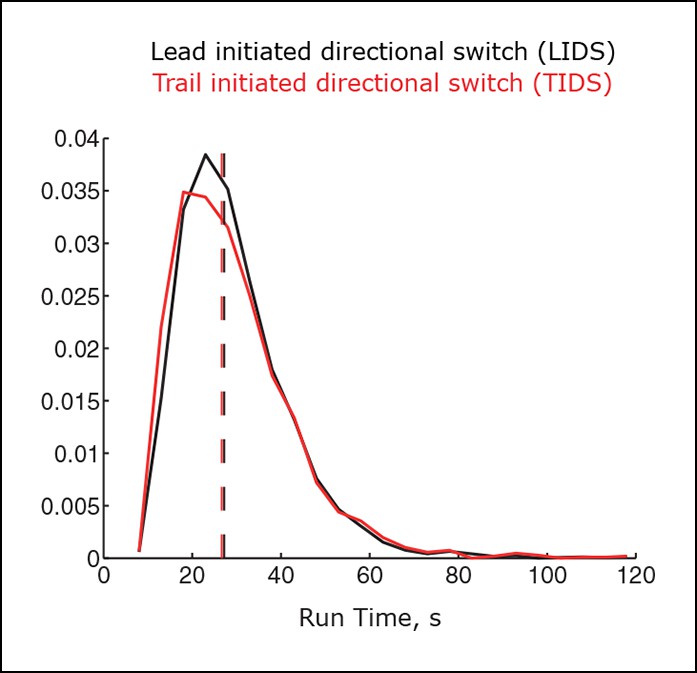
Distributions for the length of coherent runs ending in a lead initiated directional switch (LIDS) (black), trail initiated directional switch (TIDS) (red) event (n=3396 and 2139, respectively). Mann–Whitney test for identical medians, p=0.025. Distribution medians shown as dashed lines (LIDS 27.2 s, TIDS 26.6 s).
Figure 4—figure supplement 2
Variability in inter-sister distance across switching events.
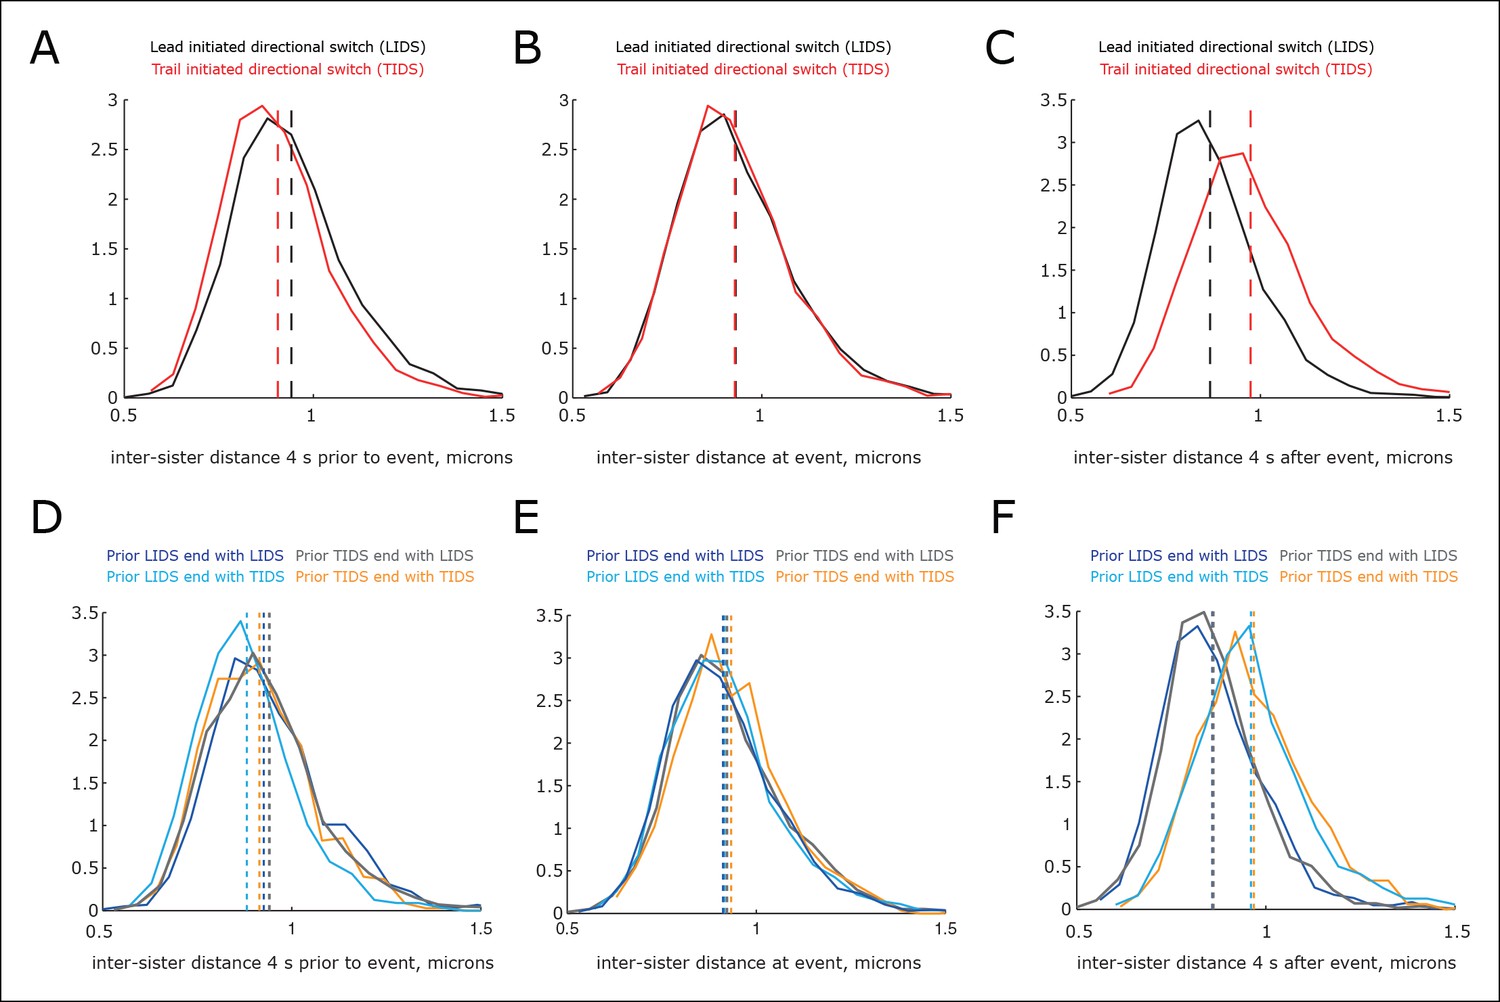
(A–C) Distribution of the inter-sister distance at specified times: (A) 4 s prior to event, (B) at switching event and (C) 4 s after the switching event (times are marked in Figure 4A). Events separated into lead initiated directional switch (LIDS) (black, n=4900) and trail initiated directional switch (TIDS) (red, n=3143). Separation of medians (shown as dashed lines) is 36, 2 and–107 nm, respectively (LIDS – TIDS inter-sister distance), corresponding to 23, 1.5 and 70% of the distribution SD. (D–F). Distribution of the inter-sister distance at specified times: (D) 4 s prior to event, (E) at event and (F) 4 s after event conditioned on previous event type (times marked in Figure 4B). Note median time order changes as time series in Figure 4B. Coherent runs are restricted to 12–40 s, sample sizes as (B). Kruskal–Wallis test on homogeneity is p=2.9 × 10⁻¹⁹, 0.0057, 1.4 × 10–113 for 4 s prior to event, at event and 4 s after event, respectively.
Figure 5
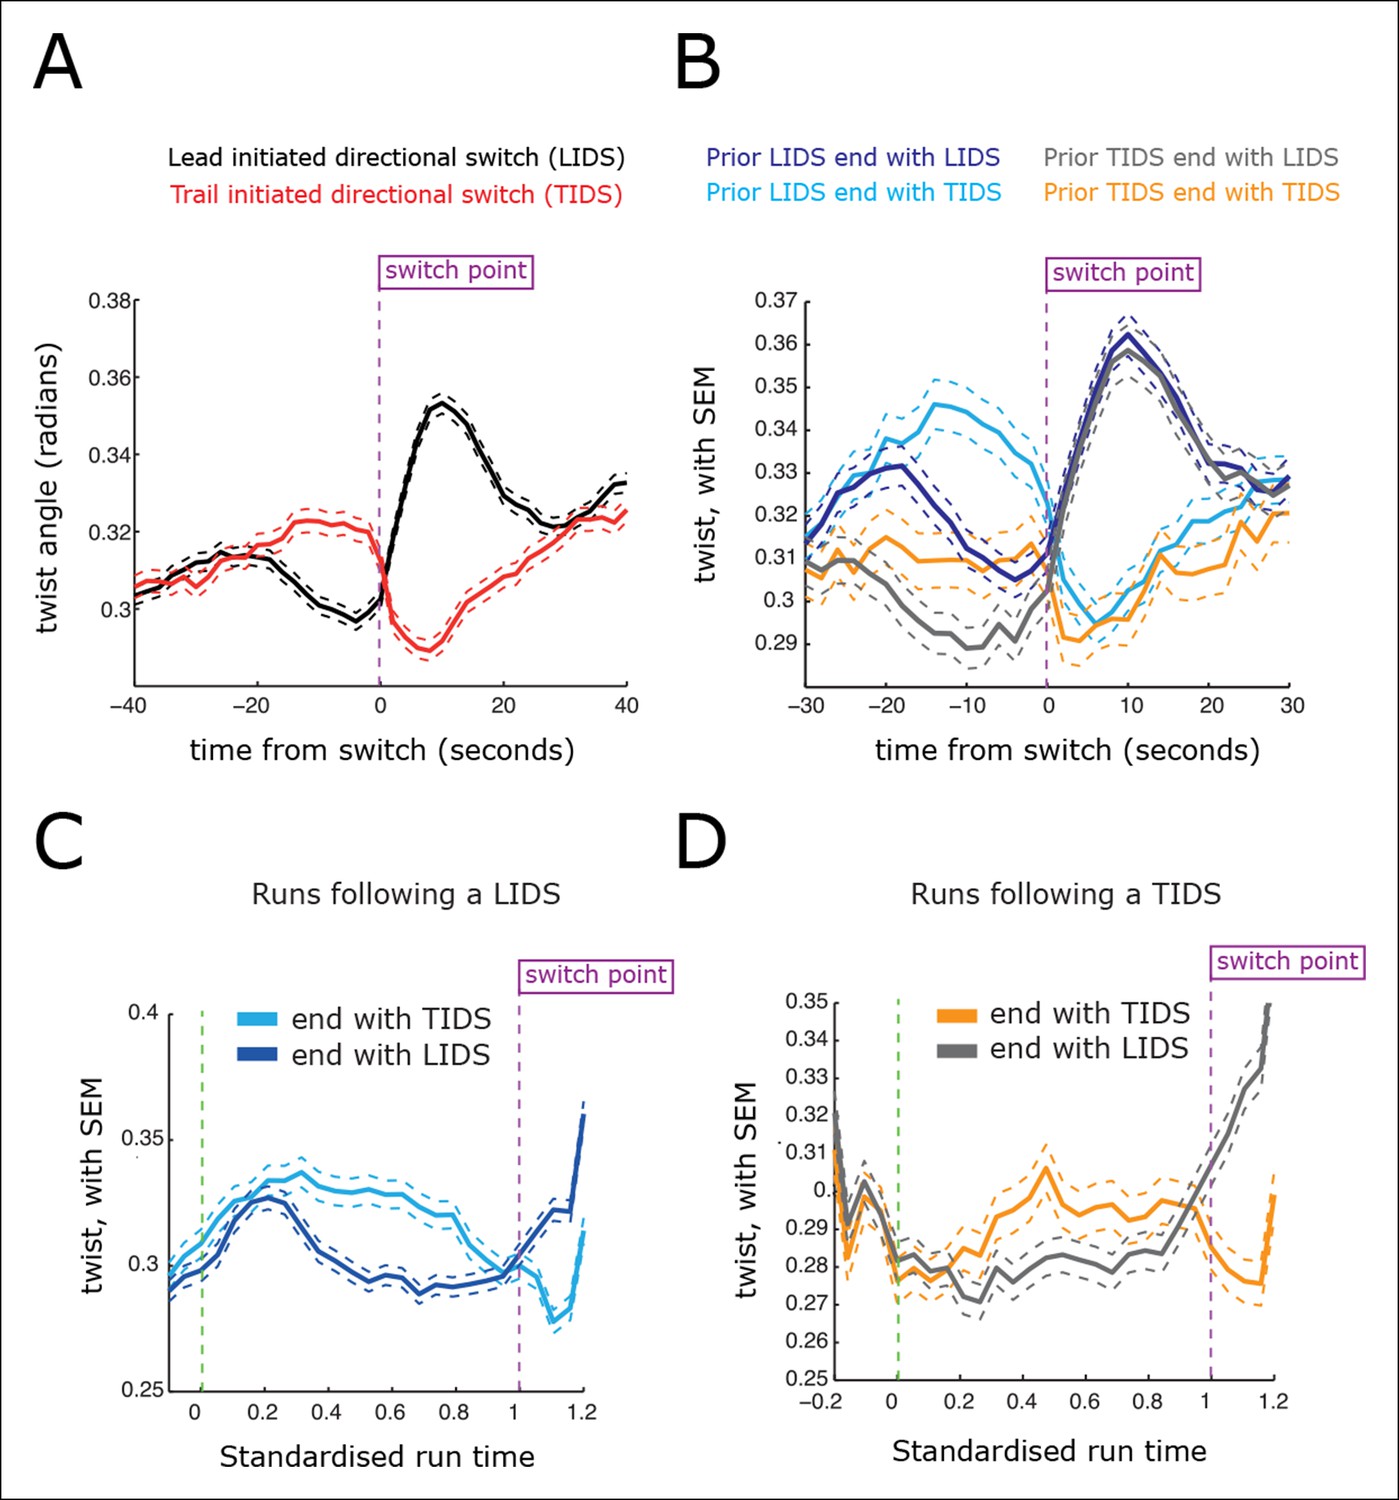
Directional switching event signatures in the sister kinetochore twist (angle of the sister axis to the metaphase plate normal).
(A) Time profiles across the first switching event of a directional switch according to type (lead initiated directional switch [LIDS], trail initiated directional switch [TIDS]). Events from trajectories where the lead (LIDS, n=4900; red) or trail (TIDS, n=3143; black) kinetochore switched first were aligned at their modal switching time (time origin, vertical dotted purple line). Solid lines indicate mean values over time, dashed lines ± 1 SEM, smaller than the line thickness where not visible. (B) Time profiles across the first sister switch according to type (LIDS, TIDS) separated by prior event (prior LIDS, subsequent LIDS, TIDS, n=1536 and 936, respectively, prior TIDS and subsequent LIDS, TIDS n=986 and 628, respectively). (C) Twist after a LIDS event categorising runs that exhibit a subsequent LIDS (dark blue) or TIDS (light blue). (D) Twist after a TIDS categorising runs that exhibit a subsequent LIDS (grey) or TIDS (orange). In (C, D), run length is limited to be 6–20 frames inclusive (12–40 s) and rescaled to a standard length of 1 (proportion of run). Sample sizes as (B). Dashed lines indicate ± 1 SEM. Vertical green and purple dashed lines indicate the start and end of the run.
Figure 6
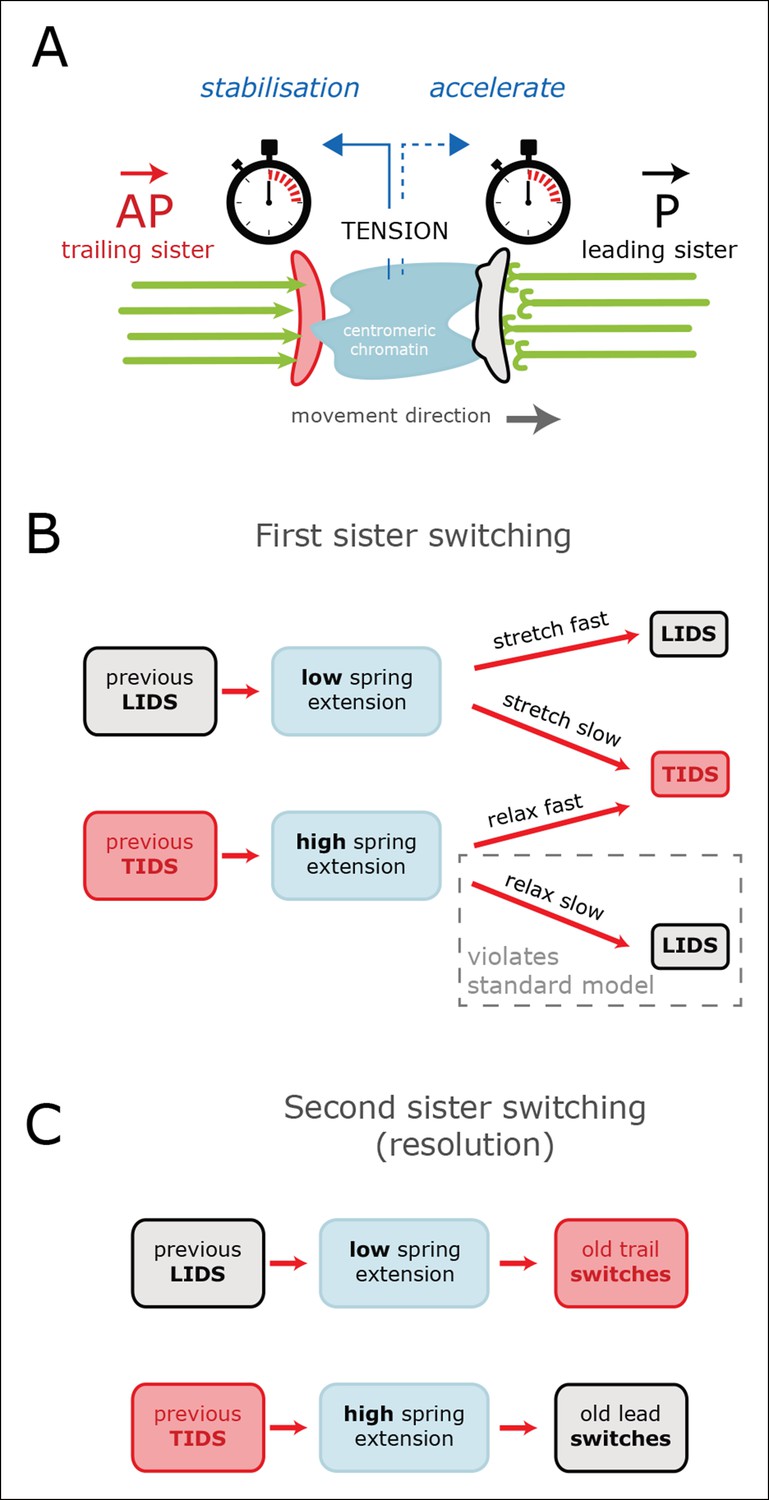
Tension-clock model for sister kinetochore directional switching.
(A) Schematic outline of regulatory mechanisms that control sister kinetochore directional switching. Our data are consistent with the presence of a clock on both the leading (black) and trailing (red) sister kinetochores that sets the time at which a directional switch will occur. We propose that the molecular mechanism for the clock is the rescue/catastrophe frequency of the microtubules (green) within the K-fibre. We note that the kinetics of microtubule dynamic instability in vitro cannot alone explain the timing of events (oscillation period); hence, regulation of the dynamics from the kinetochore/K-fibre structure is key. The clock on the trailing sister kinetochore is force-sensitive, such that tension from stretching the centromeric chromatin results in a slow down, thereby reducing the probability that the K-fibre will drive a trail initiated directional switch (TIDS). (B) This mechanism can explain the observed relationship between tension dynamics (in centromeric chromatin) and sequences of lead and/or trail initiated directional switches. Following a LIDS (upper half), the spring extension is low and then stretches over the following run. If tension increases quickly enough, then the trailing K-fibre is stabilised (the clock slows down) and the lead kinetochore switches as the clock runs down. If tension does not build up sufficiently, then the trailing K-fibre will not be stabilised and it will therefore switch because of its clock. Following a TIDS, (lower half), the spring extension is high. The run thus starts with high tension which stabilises the trailing K-fibre. Spring tension relaxes over the run, and if it drops sufficiently, trailing K-fibre stabilisation is lost and the trailing sister switches (TIDS). If tension remains sufficiently high, then the clock on the leading kinetochore initiates the switching event (LIDS). Thus, lead sister initiated switches can occur with falling tension ruling out the standard model (see Figure 1). (C) This model can also account for why the second sister switches: following a LIDS, both sisters are in an AP state, reducing the spring tension to a near-zero tension state. This rapidly destabilises the previously trailing sister leading to a switch (AP to P). We suspect that the new lead sister does not switch in this situation because its clock has been re-set (i.e. the K-fibre is new). When a TIDS occurs, we propose that the very high tension generated during the directional switch accelerates the clock on the sister attached to the older K-fibre (previously the lead sister) causing the second sister to switch.
Videos
Video 1
Length: 5 s; Real Time: 300 s; Frame Rate: 30 fps.
HeLa-K eGFP–CENP-A, eGFP– Centrin1. Z-projection through 12 μm. (Deconvolved) Movie of a metaphase cell (captured at 2 s per frame). Movie rendered used MATLAB and ImageJ. Please also refer to Figure 2.
Video 2
Length: 16 s; Real Time: 300 s; Frame Rate: 30 fps.
eGFP–CENP-A, eGFP–Centrin1. (Deconvolved) Movie of a metaphase cell rendered in 3D. Movie rendered used MATLAB and IMARIS. Please also refer to Figure 2.
Video 3
Length: 16 s; Real Time: 300 s; Frame Rate: 30 fps.
eGFP–CENP-A, eGFP–Centrin1. (Deconvolved) Movie of a metaphase cell rendered in 3D overlaid with spot locations (silver spheres) as determined by the kinetochore-tracking assay. Movie rendered used MATLAB and IMARIS. Please also refer to Figure 2.
Video 4
Length: 16 s; Real Time: 300 s; Frame Rate: 30 fps.
eGFP–CENP-A, eGFP–Centrin1. (Deconvolved) Movie of a metaphase cell rendered in 3D overlaid with spot locations (green spheres) and frame-to-frame displacements (green tracks) as determined by the kinetochore-tracking assay. Movie rendered used MATLAB and IMARIS. Please also refer to Figure 2.
Video 5
Length: 7.02 s; Real Time: 300 s; Frame Rate: 30 fps.
eGFP–CENP-A, eGFP–Centrin1. (Deconvolved) Movie of a metaphase cell rendered in 3D overlaid with: aligned kinetochore locations (silver spheres); metaphase plate fit (small yellow spheres); spindle poles (blue spheres); spindle pole frame-to-frame displacements (blue tracks); spindle axis and spindle mid-plane (small blue spheres) as determined by the kinetochore-tracking assay. Movie rendered used MATLAB and IMARIS. Please also refer to Figure 2.
Download links
A two-part list of links to download the article, or parts of the article, in various formats.
Downloads (link to download the article as PDF)
Open citations (links to open the citations from this article in various online reference manager services)
Cite this article (links to download the citations from this article in formats compatible with various reference manager tools)
Super-resolution kinetochore tracking reveals the mechanisms of human sister kinetochore directional switching
eLife 4:e09500.
https://doi.org/10.7554/eLife.09500


