Residue proximity information and protein model discrimination using saturation-suppressor mutagenesis
- Indian Institute of Science, India
- Jawaharlal Nehru Center for Advanced Scientific Research, India
Figures
Figure 1 with 3 supplements
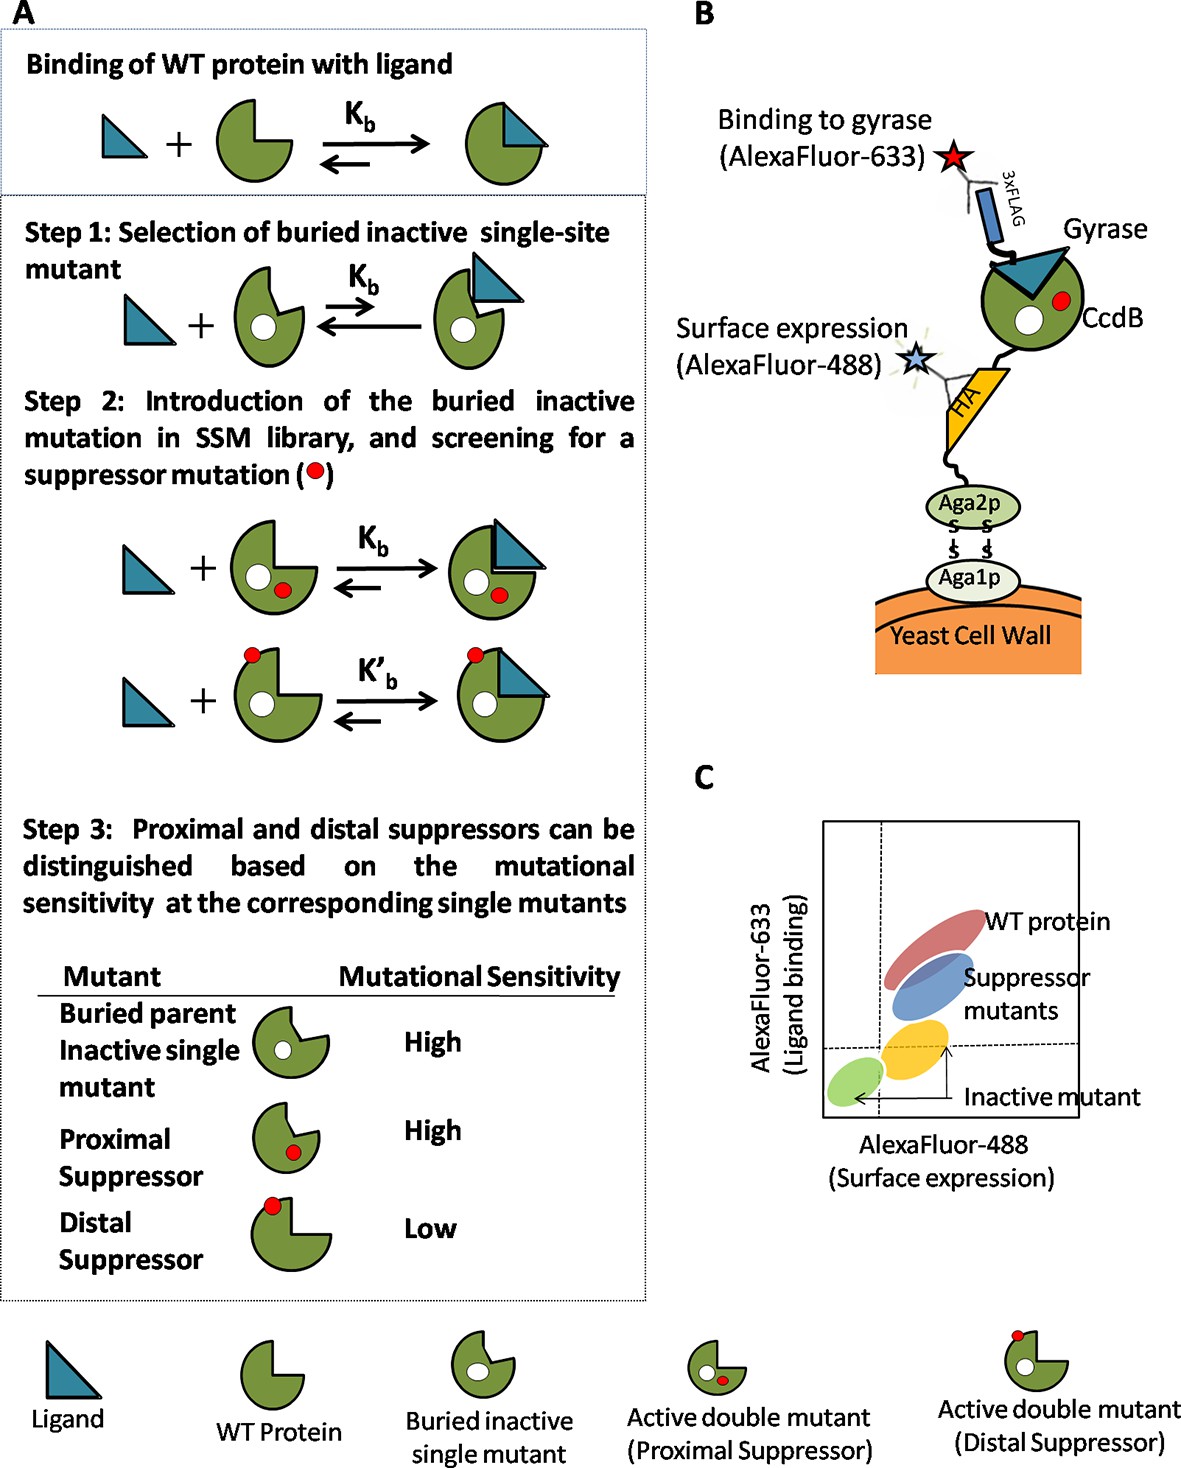
Strategy adopted to determine proximal residue pairs.
(A) Parent inactive mutant binds cognate ligand with lower apparent affinity than Wild-Type protein (WT). (Parent inactive mutant, Suppressor mutant) pair binds ligand with higher affinity than the parent inactive mutant. Refer to Figure 1—figure supplement 3 for the PCR strategy to introduce a parent inactive mutant into the single-site saturation mutagenesis (SSM) library of CcdB. Proximal and distal suppressors can be discriminated based on the mutational sensitivity of the corresponding single mutants. (B) Yeast Surface Display is used as the screening system in case of CcdB. (C) Suppressor mutants are identified using Fluorescence Activated Cell Sorting (FACS) of the mutant library using yeast surface display. Active-site residues can be distinguished from buried ones based on the pattern of mutational sensitivity (MSseq). Putative active-site, buried and exposed residue positions were identified from the MSseq data. Representative plots are shown in Figure 1—figure supplement 1. Possible mechanisms responsible for reduced activity of a mutant protein are described in Figure 1—figure supplement 2.
Figure 1—figure supplement 1
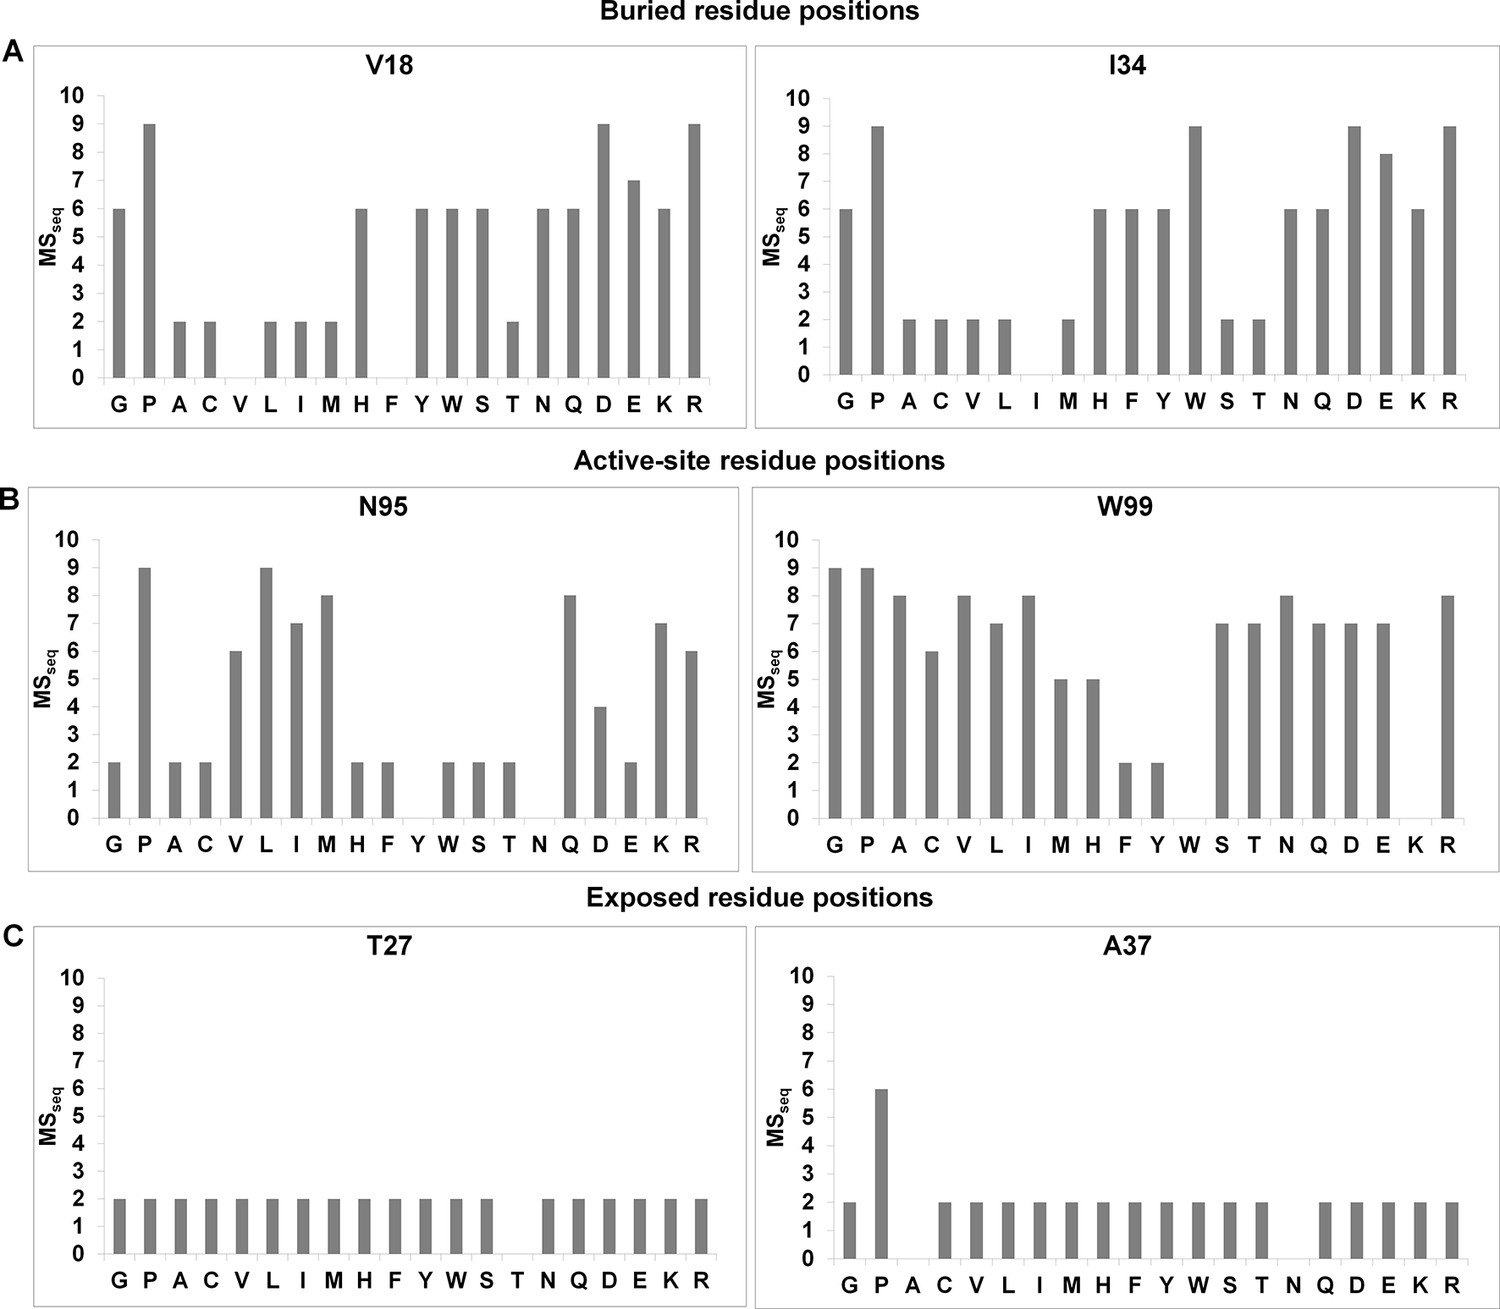
Barplots depicting mutational sensitivity (MSseq) values of all available mutants at representative positions of CcdB.
A value of zero indicates that the mutant was not obtained in the library. (A) MSseq values at two buried positions. At buried positions, typically most aliphatic substitutions are tolerated (low MSseq). Polar and charged substitutions are poorly tolerated (high MSseq). (B) MSseq values at two active-site positions. Very few substitutions are tolerated at active-site positions. Aliphatic residues are also poorly tolerated (high MSseq). (C) MSseq values at two exposed, non-active site positions. At exposed non-active site positions, almost all substitutions are tolerated and have low MSseq values with the possible exceptions of G and P.
Figure 1—figure supplement 2
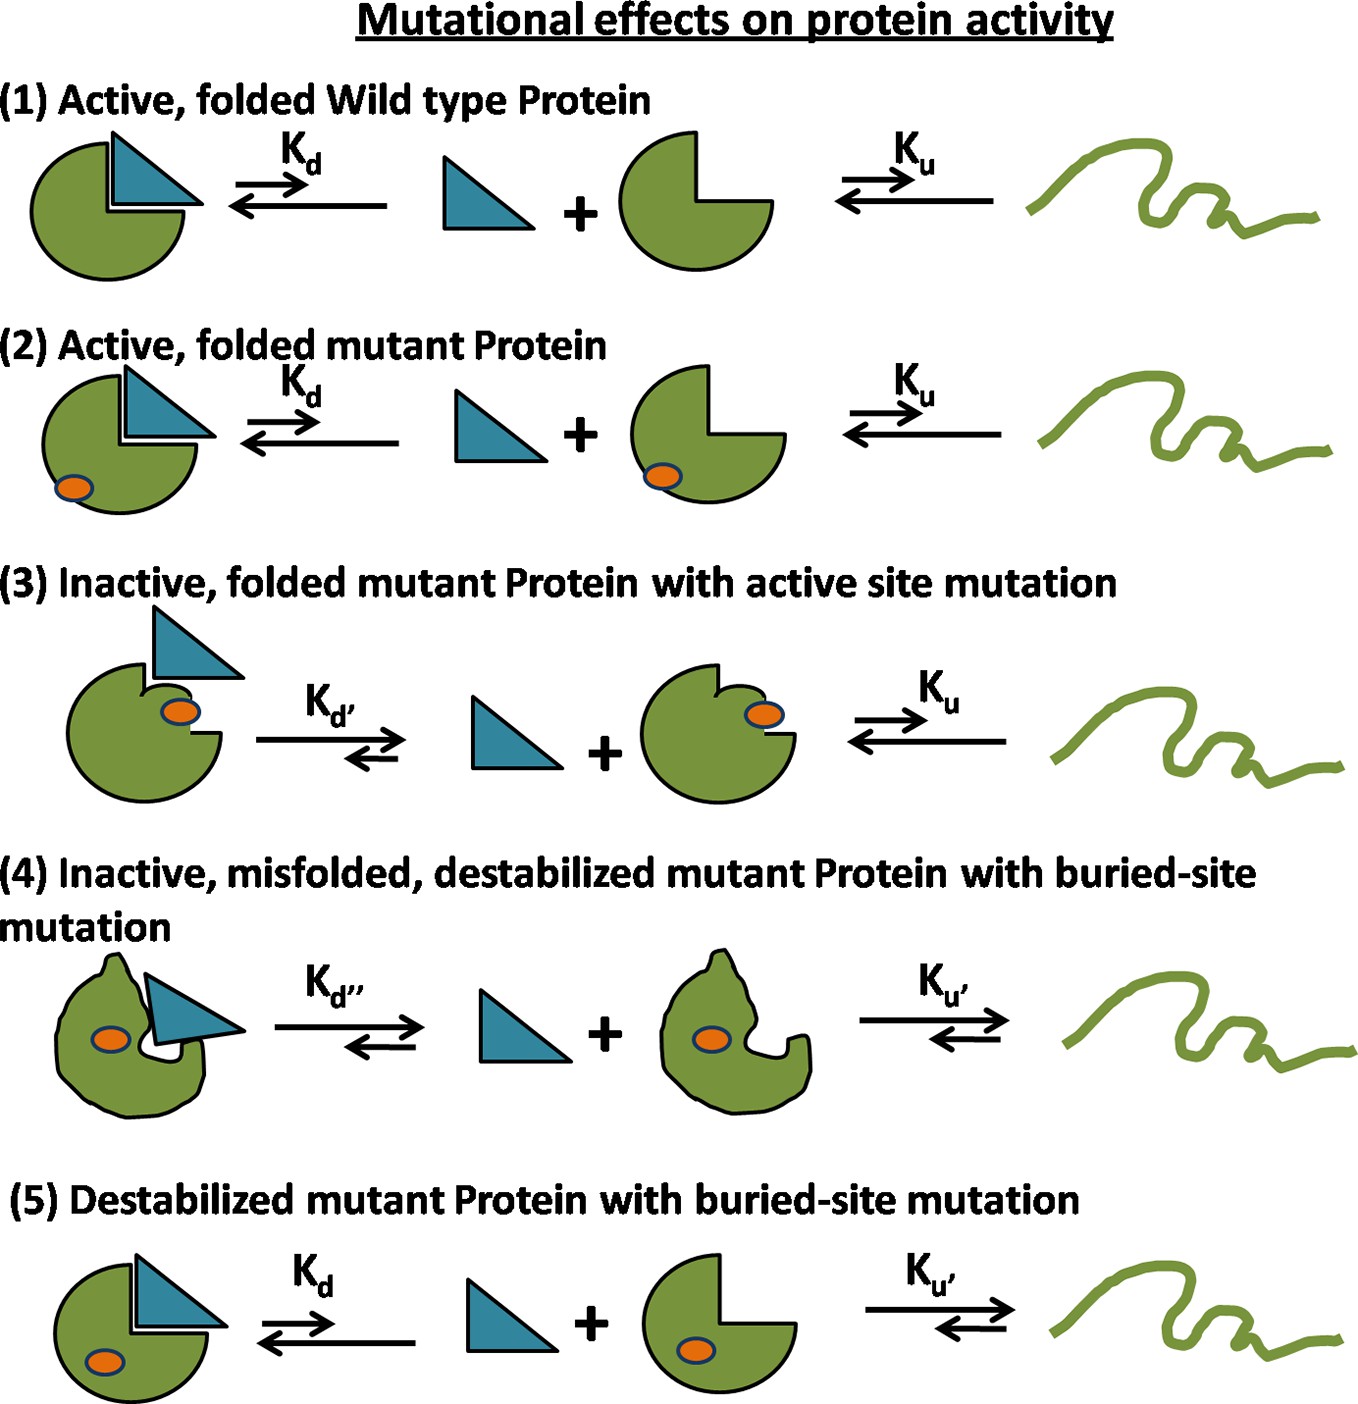
Possible mechanisms for reduced activity of a mutant protein.
(1) Folding and binding equilibrium for the Wild-Type (WT) protein which has low values of equilibrium dissociation constant Kd and equilibrium unfolding constant Ku. (2) Some mutations do not affect the folding or activity. (3) If the mutation is present at the ligand binding site, then the protein is rendered inactive because of an increase in Kd while Ku is unchanged. (4) If the mutation at a buried site leads to the formation of a misfolded protein, then both Kd and Ku increase. (5) In case of a destabilizing mutation that does not perturb the native structure, Kd is unchanged but Ku increases. In both (4) and (5), an increase in Ku results in an increase in the population of the unfolded state which is prone to aggregation and degradation, thereby resulting in a decrease in the level of folded, functional protein in vivo.
Figure 1—figure supplement 3
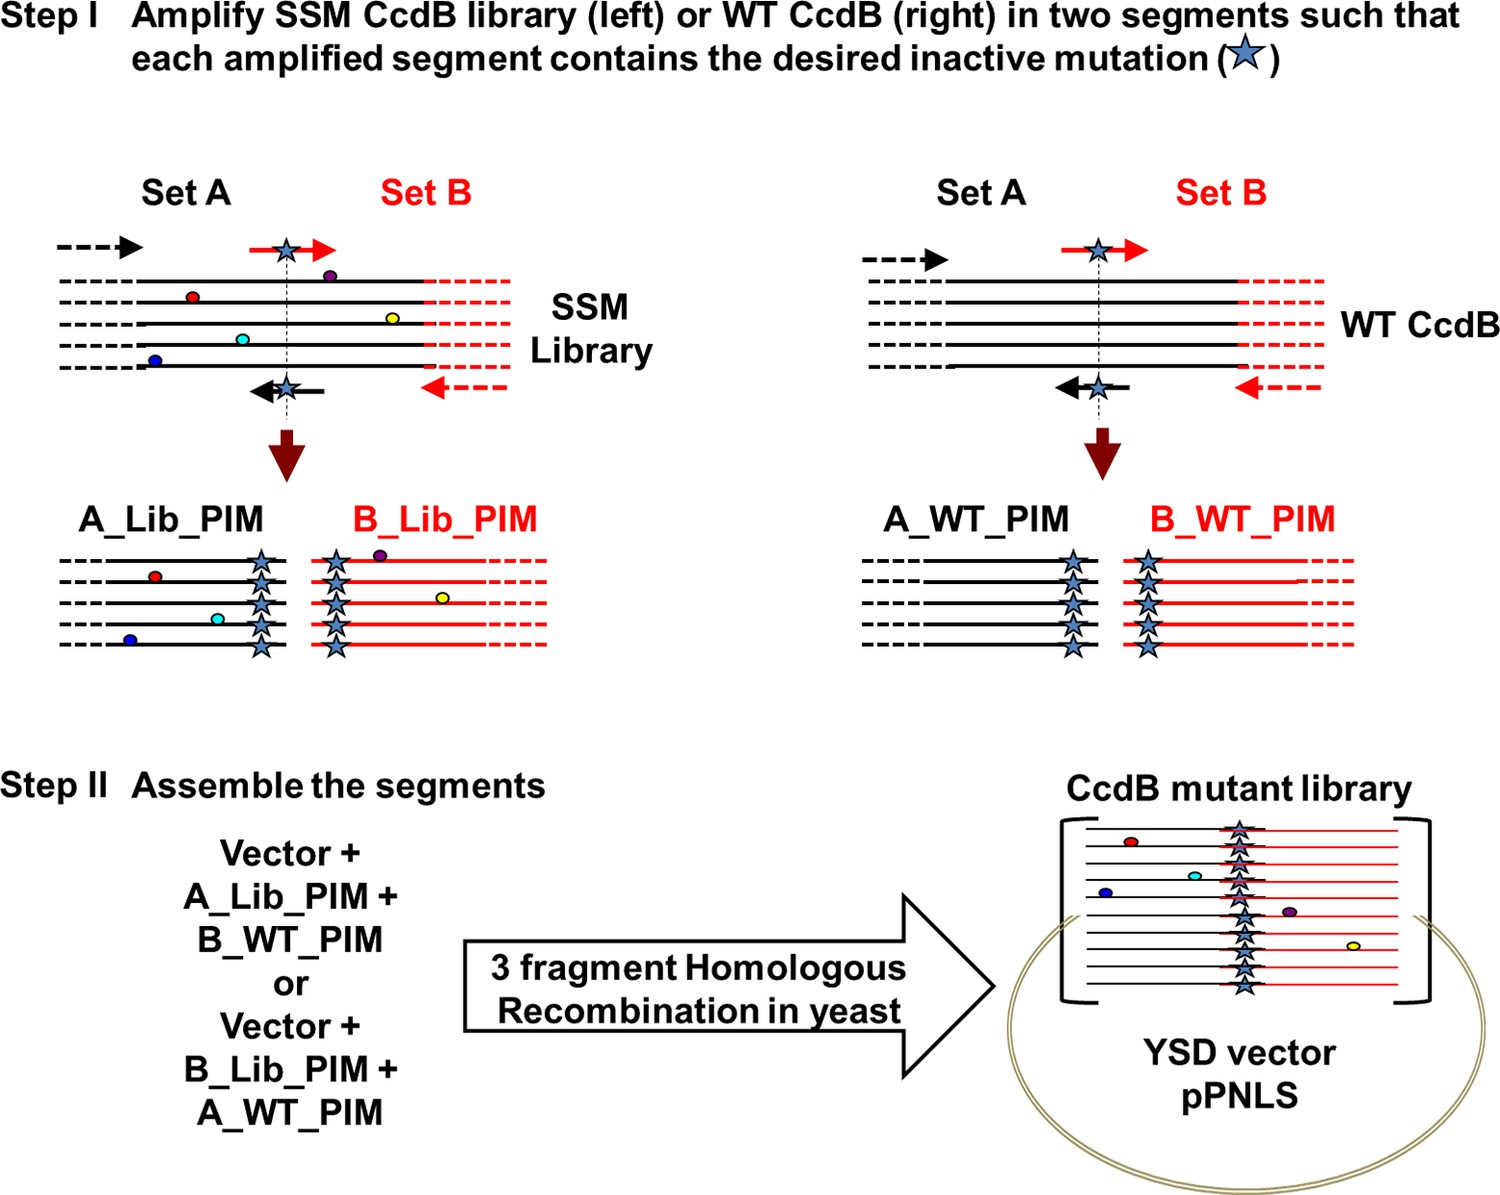
Strategy to introduce an inactive mutant into all members of a Single-site Saturation Mutagenesis (SSM) library of CcdB cloned in a yeast surface display (YSD) vector (pPNLS).
Step I. CcdB gene cloned in the yeast surface display vector (pPNLS) is amplified in two segments (Set A and Set B) at the position of introduction of parent inactive mutation (PIM), using two sets of primers (arrows shown in black and red). The forward primer of Set B (arrow in red) and reverse primer of Set A (arrow in black) contain the inactive mutant codon in the middle of the primer sequence and are complementary to each other. The regions of the vector (shown in dashed black and red lines) complementary to the outside primers (dashed black and red arrows) are shown. These outside primers bind the vector >200 bases upstream and downstream of the ccdb gene and result in amplicons (A_Lib_PIM or B_Lib_PIM or A_WT_PIM or B_WT_PIM) of reasonable size (>200 bases), irrespective of the point of introduction of parent inactive mutant. Single-site saturation mutagenesis library (left) and WT CcdB (right) cloned in pPNLS vector are used as template (1–5 pg). Step II. (A_Lib_PIM and B_WT_PIM) or (A_WT_PIM and B_Lib_PIM) are recombined with the linearized vector by three fragment homologous recombination in Saccharomyces cerevisiae EBY100 at regions complementary to each other that is Vector – (Amplicon from Set A) – (Amplicon from Set B) – Vector, to assemble the CcdB mutant library. 50% of the members of the assembled library have the parent inactive mutant only, while the rest of the members carry parent inactive mutant and a single mutant (obtained from single-site saturation mutagenesis library used as template).
Figure 2
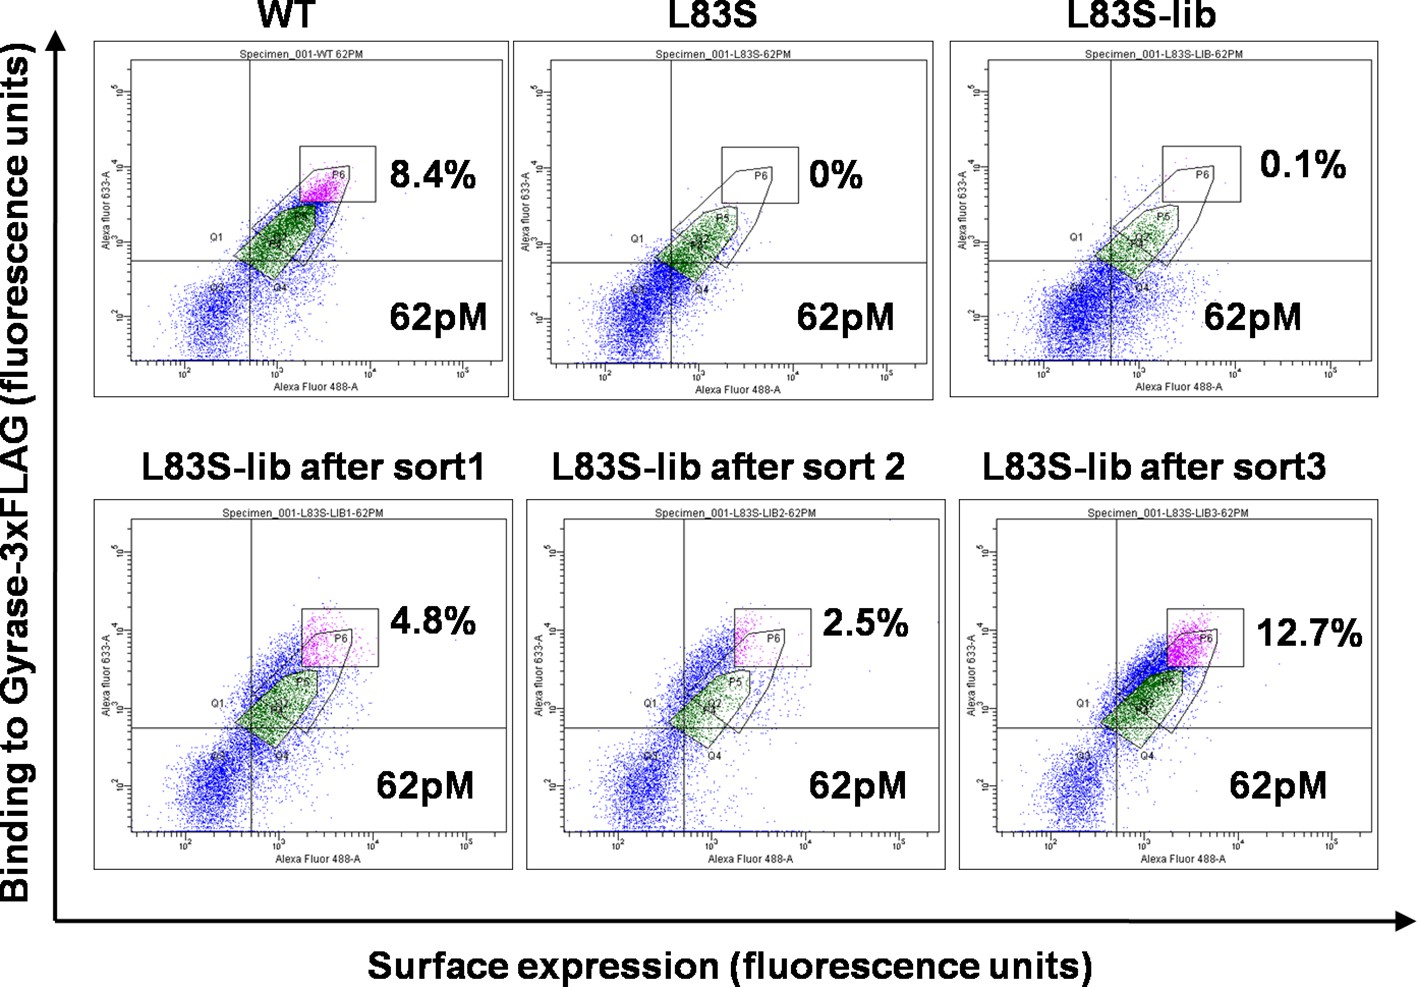
Enrichment of second-site suppressor population for L83S CcdB inactive mutant following multiple rounds of Fluorescence Activated Cell Sorting (FACS).
62 pM of Gyrase-3xFLAG was used in all cases for analysis. 4 nM, 1 nM and 0.25 nM Gyrase-3xFLAG was used for the three rounds of sort respectively. The population gated in green shows the parent inactive mutant L83S, while that in magenta shows the sorted population which has higher surface expression and tighter binding to the ligand than L83S. Sort details for different libraries of CcdB are summarized in Supplementary file 1.
Figure 3
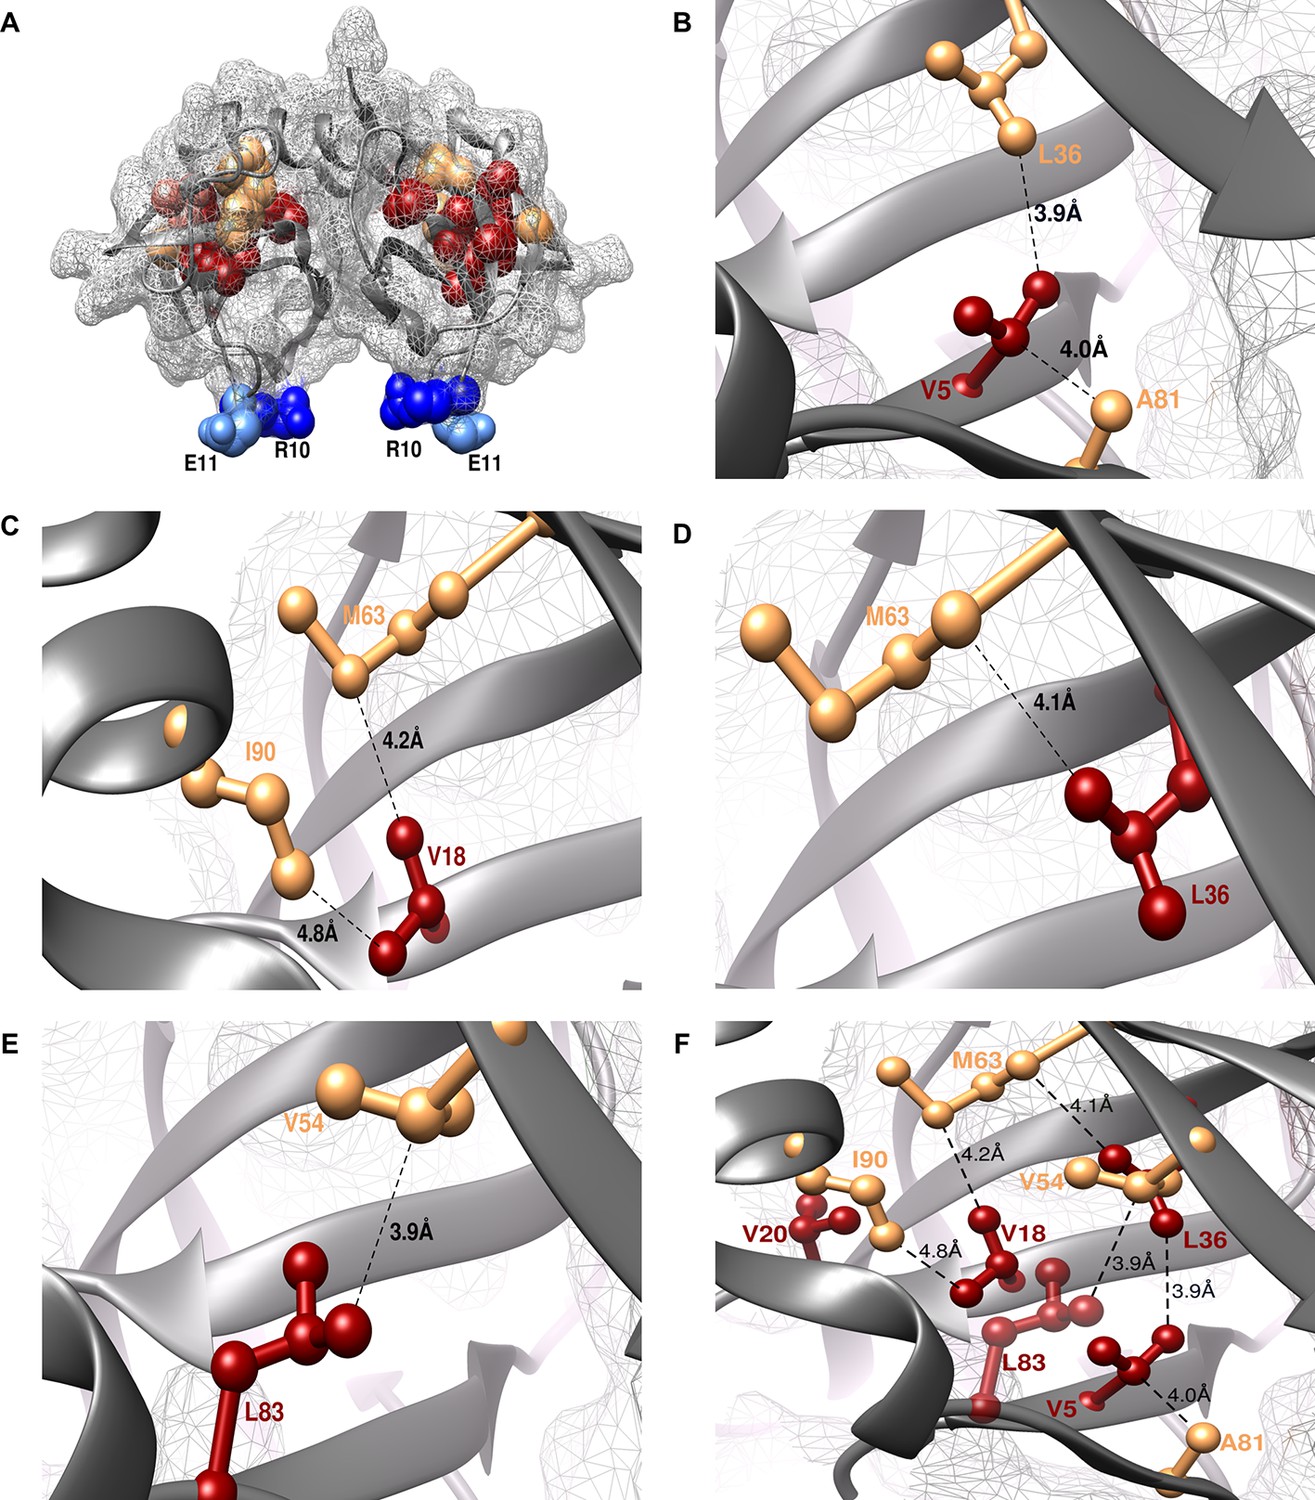
Experimentally obtained (Parent inactive mutant, suppressor) pairs mapped onto the crystal structure of CcdB (PDB id 3VUB [Loris et al., 1999]).
Only the Wild-Type (WT) residues of each member of the pair are shown as structures of the mutants are not available. (A) The two monomers of the dimeric CcdB protein are shown in ribbon (dark grey) with the distal suppressors (R10 (dark blue) and E11 (light blue) mapped on an exposed loop region while the proximal suppressors (light brown) and parent inactive mutants (dark red) are present in the core of the protein. One of the monomers of the dimeric CcdB protein has been shown in B-F for ease of visualization of the mapped parent inactive mutants and corresponding proximal suppressors. (B) Parent inactive mutant V5 and its proximal suppressors L36 and A81, (C) Parent inactive mutant V18 and its proximal suppressors M63 and I90, (D) Parent inactive mutant L36 and its proximal suppressor M63, (E) Parent inactive mutant L83 and its proximal suppressor V54 are shown. Dotted lines indicate the shortest distance between the two residues in each pair. (F) (Parent inactive mutant, proximal suppressor) pairs are clustered in the core of the protein forming an interconnected network, with side chains facing towards each other. Residues common to multiple (Parent inactive mutant, suppressor) pairs, for example L36 and M63, provide additional information about the network of interactions. The figure has been prepared using the UCSF Chimera package (developed by Resource for Biocomputing, Visualization, and Informatics at the University of California, San Francisco [Pettersen et al., 2004]).
Figure 4 with 2 supplements
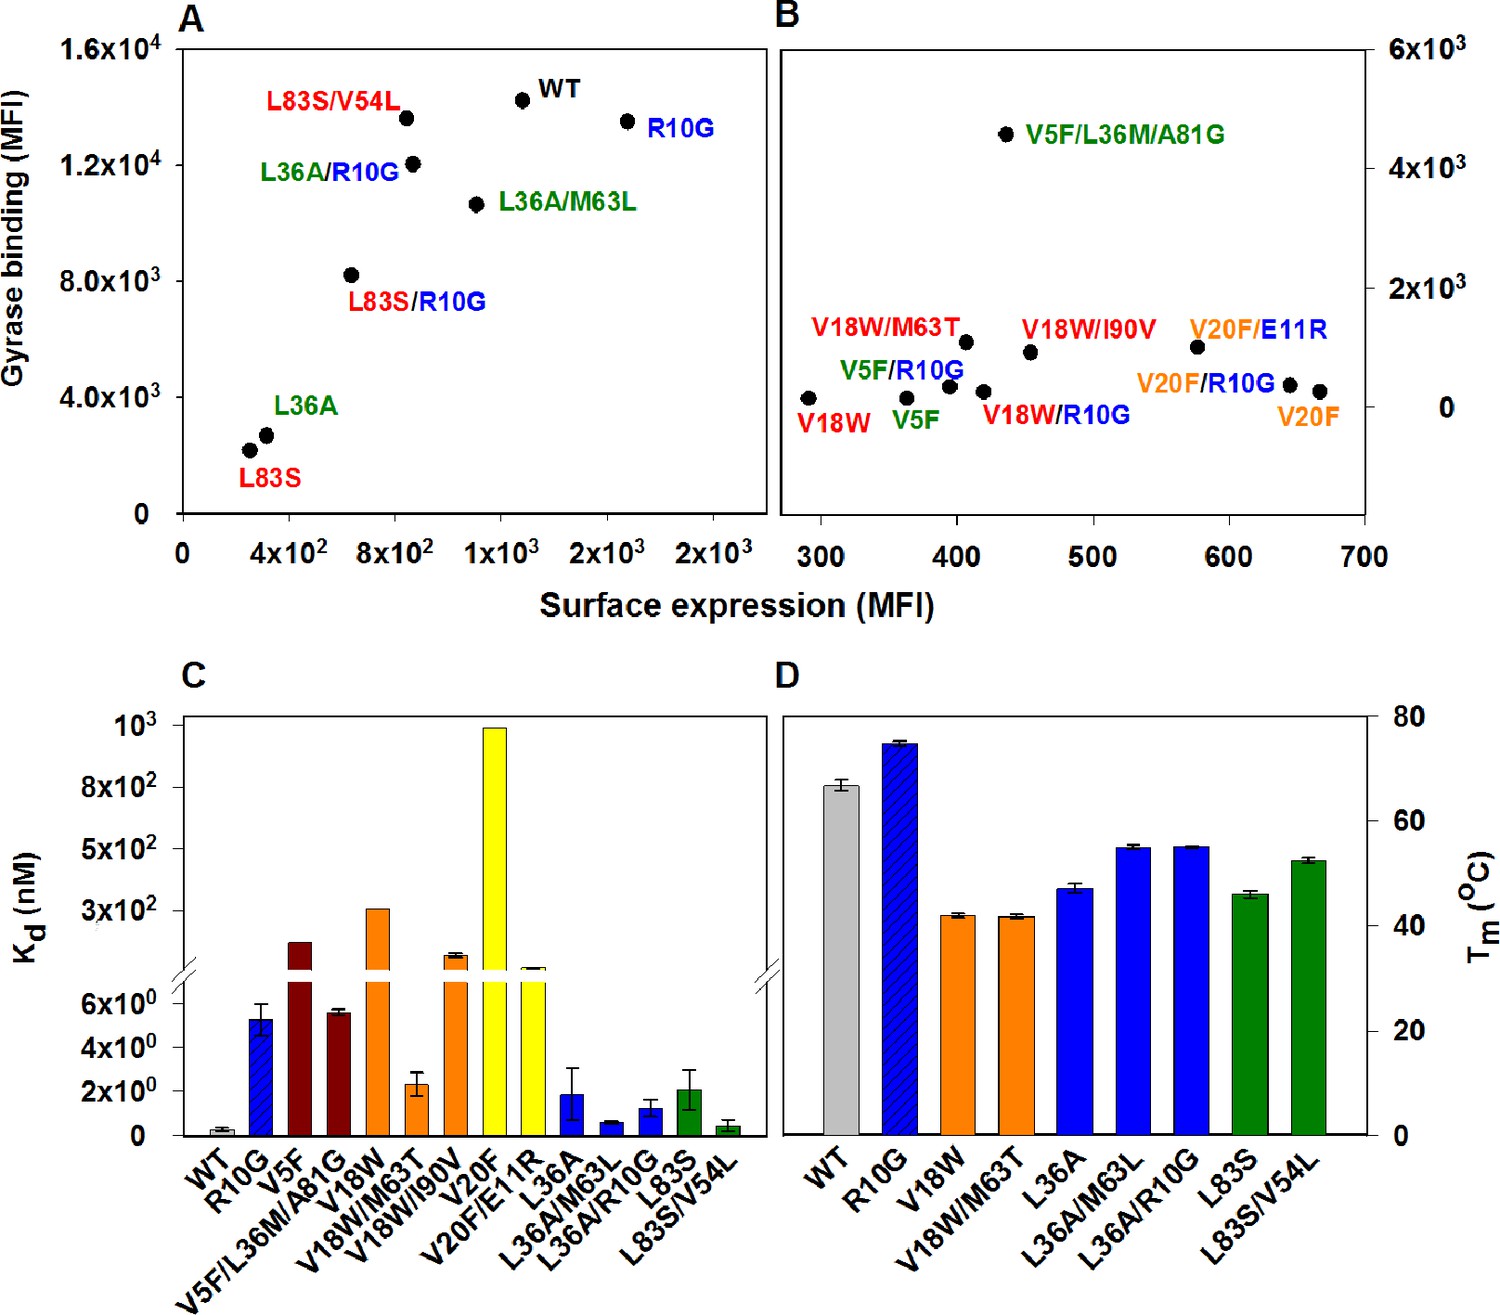
Restoration of defects in CcdB parent inactive mutants by suppressors.
Proteins displayed on the yeast surface were monitored by their surface expression (abscissa) and Gyrase binding (ordinate) signals in terms of Mean Fluorescence Intensity (MFI) by Fluorescence Activated Cell Sorting (FACS). In order to express the mutant of interest prior to sorting/analysis, yeast cells were induced at (A) 30°C for more stable parent inactive mutants and their suppressor pairs or (B) at 20°C for less stable parent inactive mutants and corresponding suppressor pairs. Suppressor mutations result in enhanced ligand binding and surface expression. In each (Parent inactive mutant, suppressor) pair, parent inactive mutants and corresponding proximal suppressors are denoted with the same color. Distal suppressors R10G and E11R are colored in blue in (A) and (B). MFI values averaged over two independent experiments are shown. Suppressor mutations result in increased (C) ligand affinity and (D) thermal stability. (C) Kd for Gyrase measured using yeast surface display titrations. Refer to Figure 4—figure supplement 1 for yeast surface display titrations of parent inactive mutants and (Parent inactive mutant, suppressor) pairs. (D) Thermal melting temperatures (Tm) for parent inactive mutants in the absence and presence of second-site suppressor mutations measured using a thermal shift assay (see Materials and methods) with purified proteins. Refer to Figure 4—figure supplement 2 for the thermal unfolding profiles of parent inactive mutants and (Parent inactive mutant, suppressor) pairs. Error bars represent standard deviation from at least two independent experiments. The results have been summarized in Supplementary file 2.
Figure 4—figure supplement 1
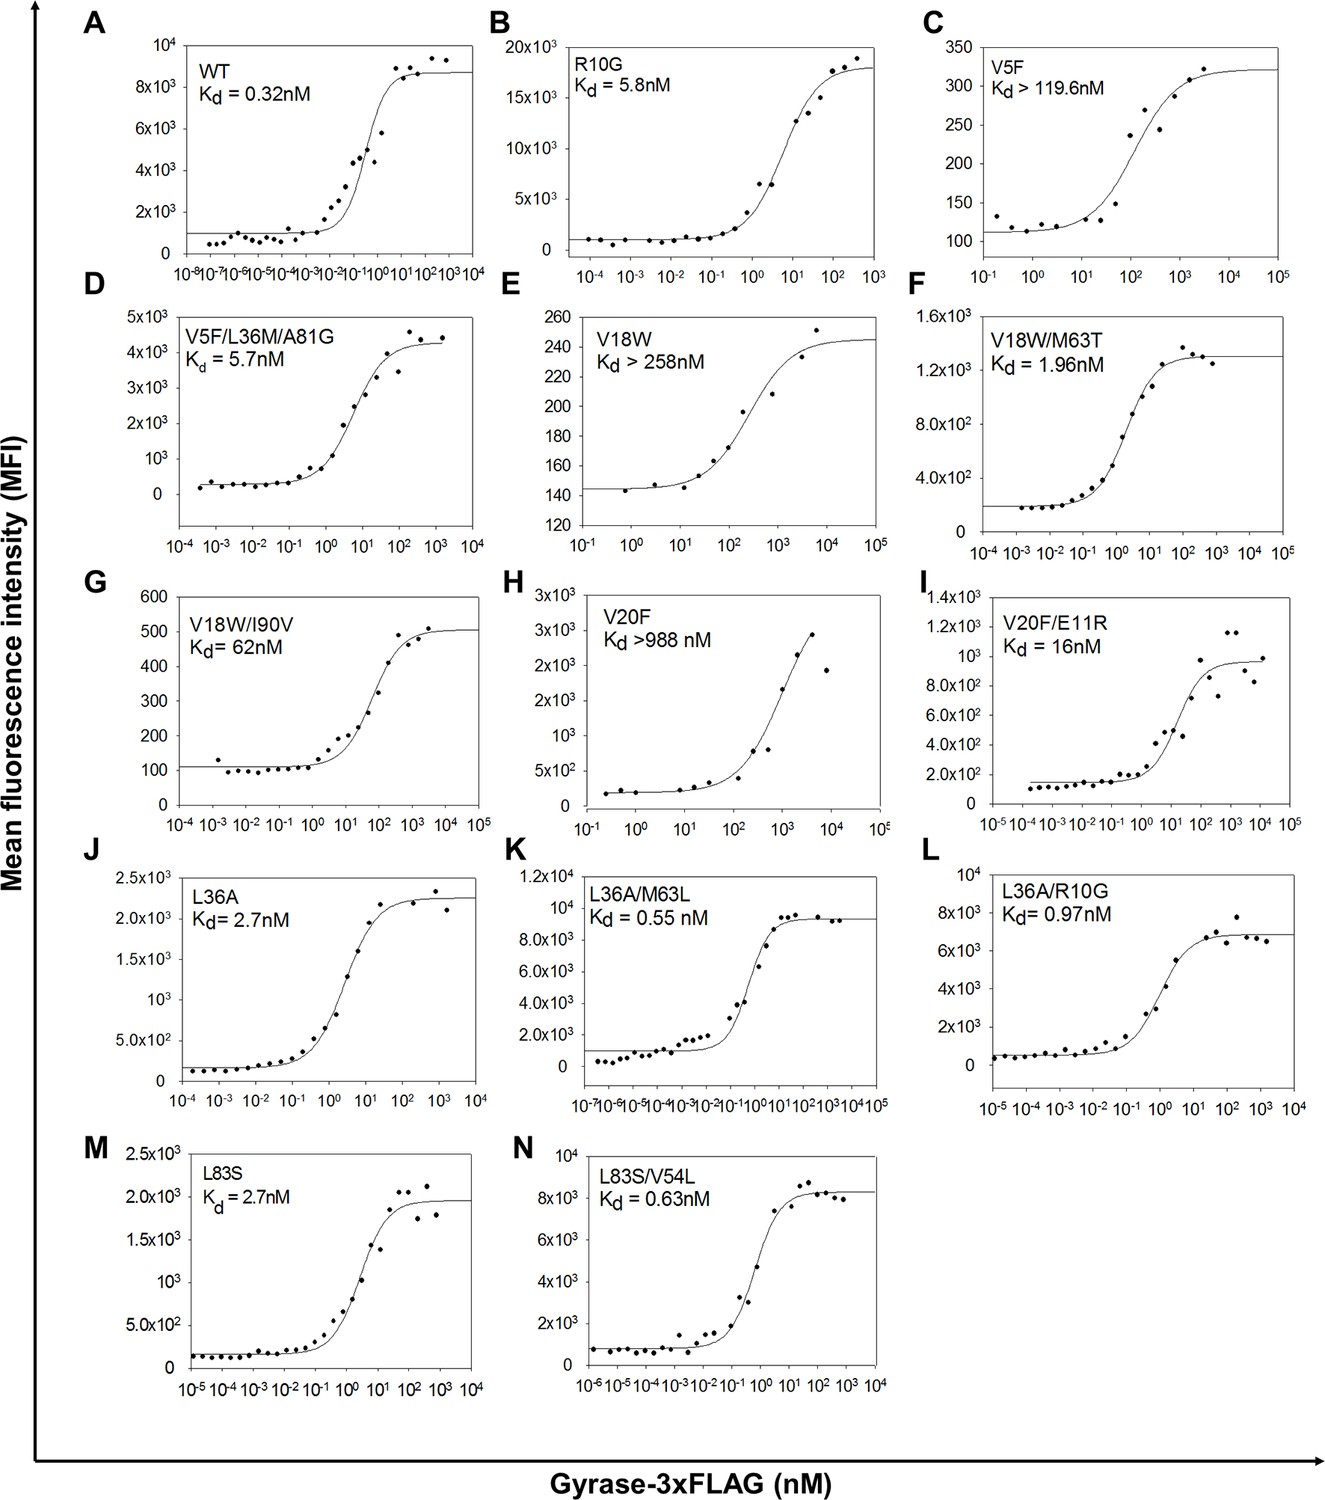
Yeast surface display titrations of parent inactive mutants and (Parent inactive mutant, suppressor) pairs to determine Kd (dissociation constant between CcdB displayed on the yeast surface and purified Gyrase).
Yeast surface display titrations of (A) Wild Type (WT), (B) R10G, (C) V5F, (D) V5F/L36M/A81G, (E) V18W, (F) V18W/M63T, (G) V18W/I90V, (H) V20F, (I) V20F/E11R, (J) L36A, (K) L36A/M63L, (L) L36A/R10G, (M) L83S, (N) L83S/V54L are shown. Kd values are mentioned in each sub-plot.
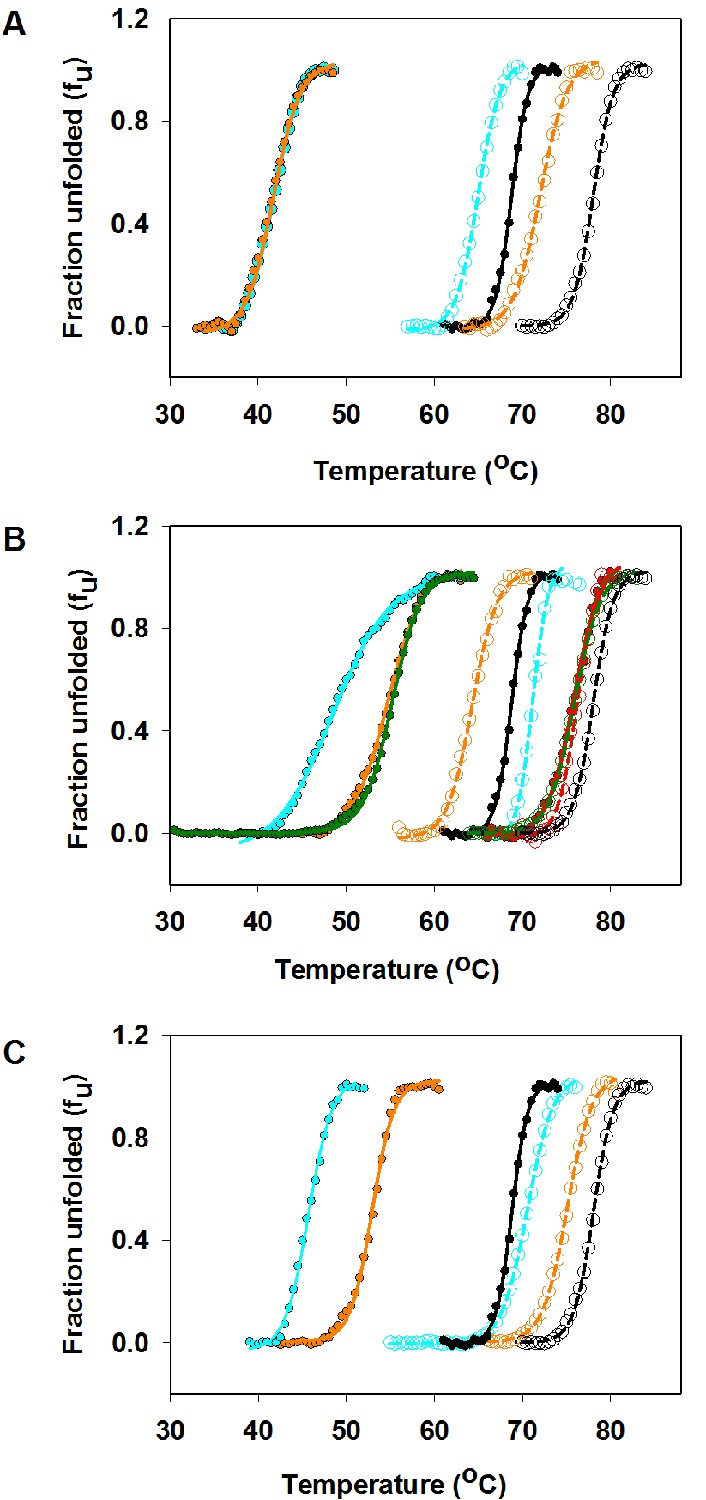
Figure 4—figure supplement 2
Thermal stabilities of purified CcdB Wild Type (WT), R10G, parent inactive mutants and (Parent inactive mutant, suppressor) pairs measured by thermal shift assay (TSA).
Thermal unfolding profiles of 4 µM of purified WT and mutant proteins have been shown in absence (filled circles showing the melt data and smooth line of the same color showing the fitted melt data) and in presence (open circles showing the melt data and dashed line of the same color showing the fitted melt data) of the CcdA peptide ligand (residues 46–72) (20 µM) (described in Materials and methods). The thermal unfolding profiles for the same mutant in absence and presence of CcdA peptide (residues 46–72) are shown in the same color. Thermal unfolding curves of (A) WT (in black), V18W (in cyan) and V18W/M63T (in orange), (B) WT (in black), R10G (in red), L36A (in cyan), L36A/M63L (in green) and L36A/R10G (in orange), (C) WT (in black), L83S (in cyan) and L83S/V54L (in orange) are shown. Values of thermal melting temperatures (Tm in °C) for the mutants are shown in Supplementary file 2 and Figure 3. The (V18W, M63T) pair shows enhanced stability relative to the parent inactive mutant V18W only in the presence of CcdA. However the remaining pairs show enhanced stability relative to the parent inactive mutant both in the presence and absence of CcdA.
Figure 5 with 2 supplements
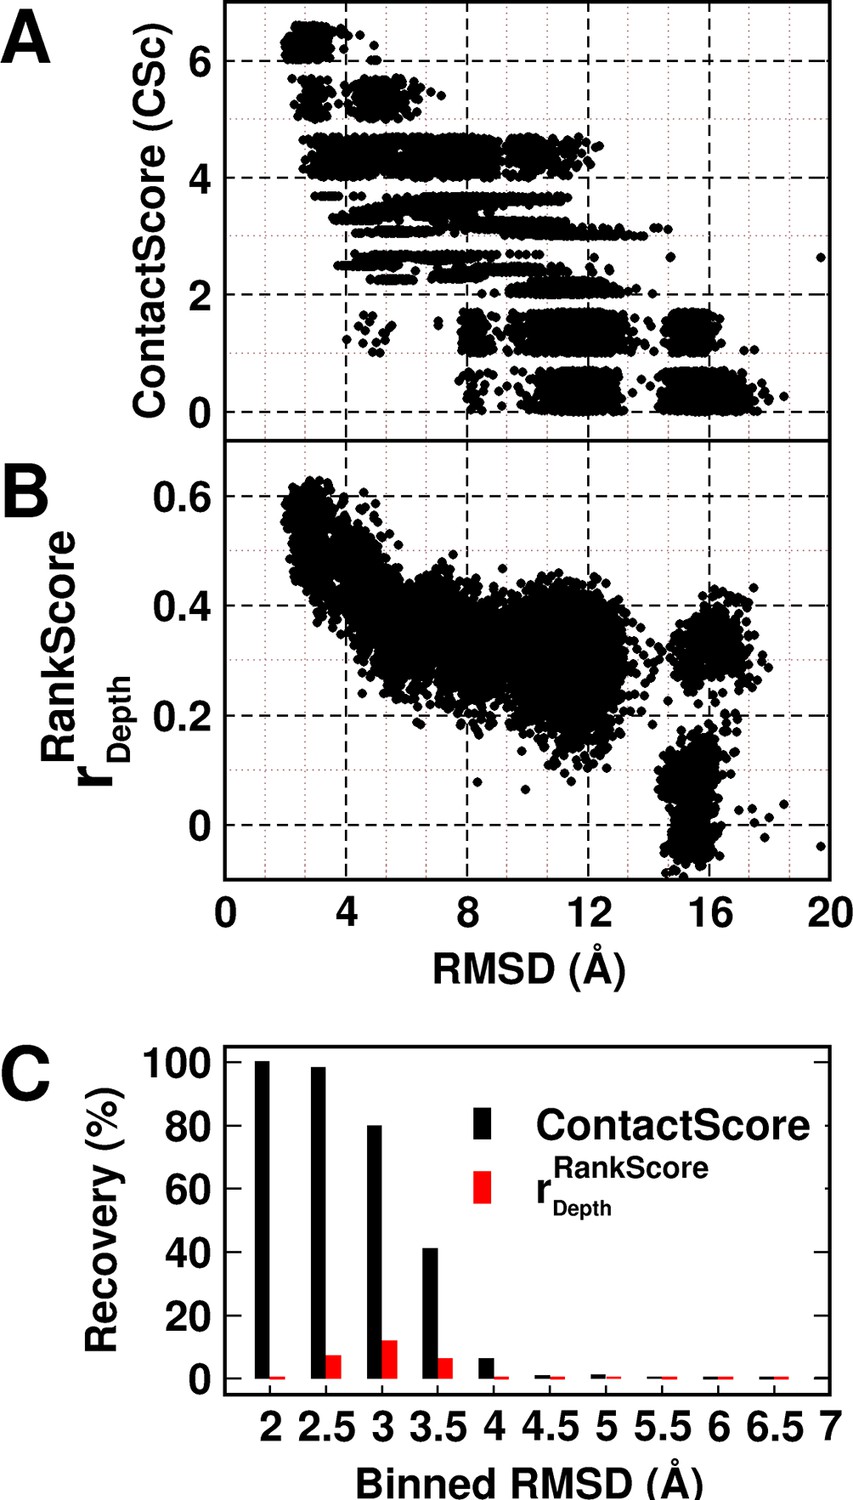
Experimentally determined 'ContactScore' and (Adkar et al., 2012) as model discriminators.
Distribution of (A) ContactScore (CSc) and (B) as a function of backbone RMSD with respect to the crystal structure for 10,659 models of CcdB. CSc values are integers ranging from 0 to 6. Thus, models with different RMSD values (abscissa) can have the same CSc (ordinate). The Csc values for such points are randomly incremented by upto 0.7 units from their actual integral CSc value for clearer visualization. (C) Black and red bars represent recovery for CSc and respectively. CSc performs significantly better than , recovering a much higher fraction of low RMSD models. The total RMSD range was divided into 0.5Å bins. Cutoff values of CSc and used were 6 and 0.6 respectively. Refer to Figure 5—figure supplement 1 for recovery of CcdB models using Csc=6 shown for various choices of cut-off distances used to define contact. Refer to Figure 5—figure supplement 2 for recovery of CcdB models as a function of different Csc values. These two plots demonstrate that a distance of <7 Å and Csc=6 are optimal for model recovery in this system.
Figure 5—figure supplement 1
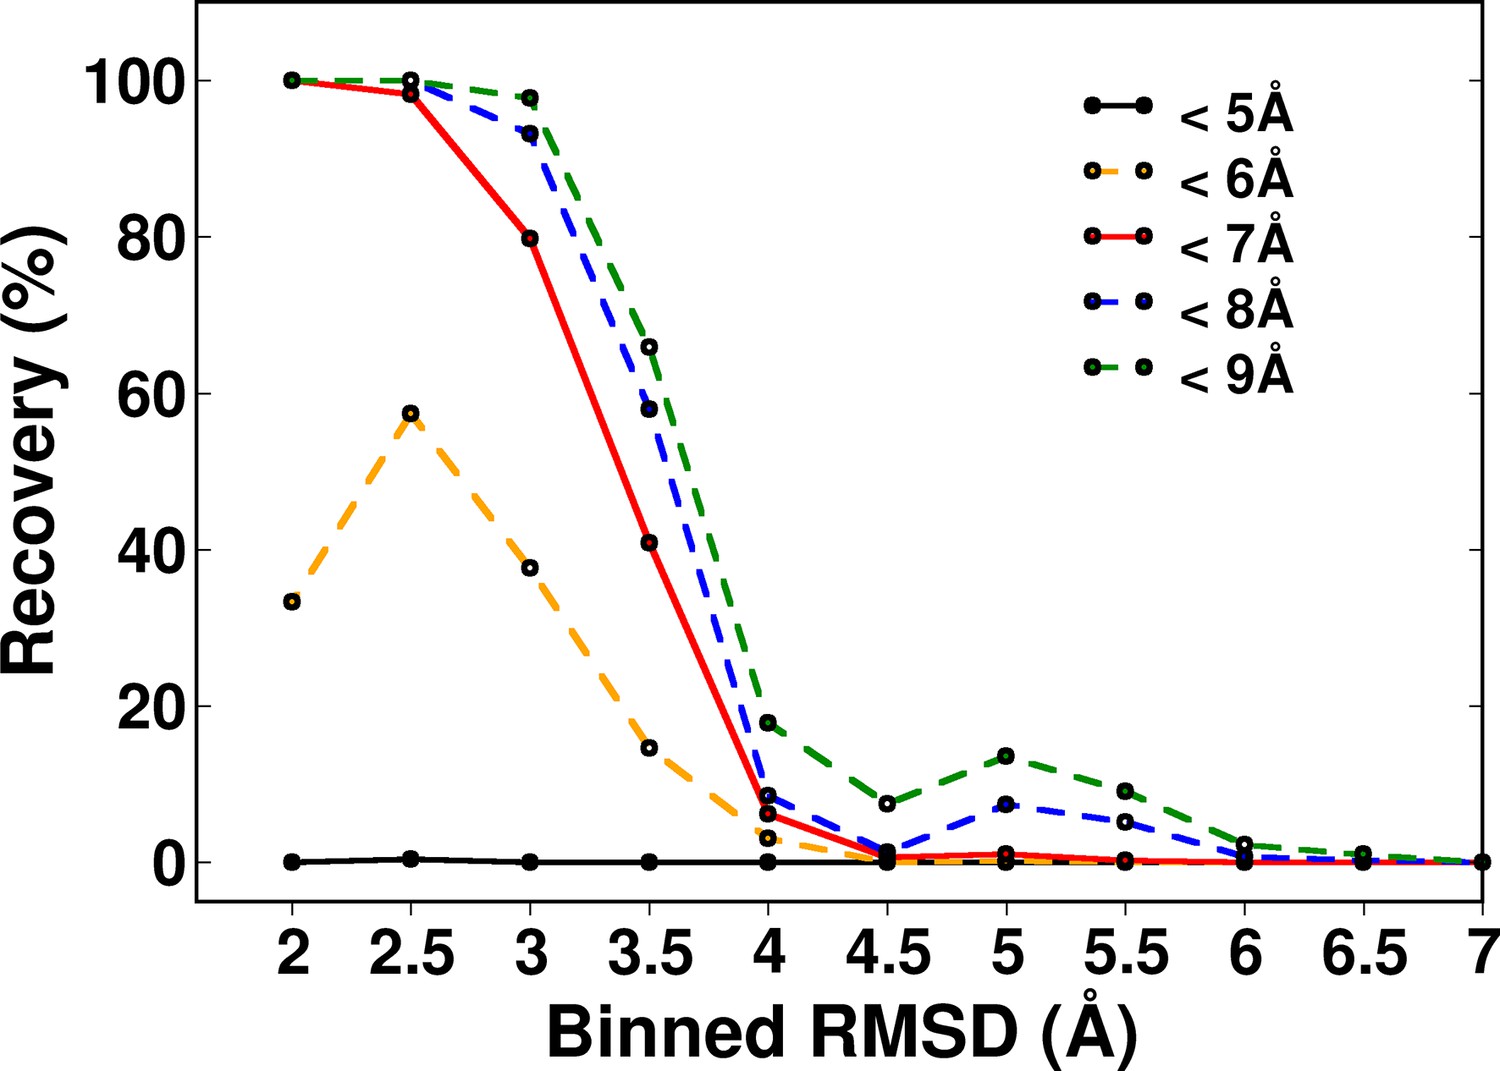
Recovery of CcdB models using a ContactScore (CSc) value of Csc=6 shown for various choices of cut-off distances used to define contact.
RMSD bin size=0.5 Å. Upper limit of each bin is shown.
Figure 5—figure supplement 2
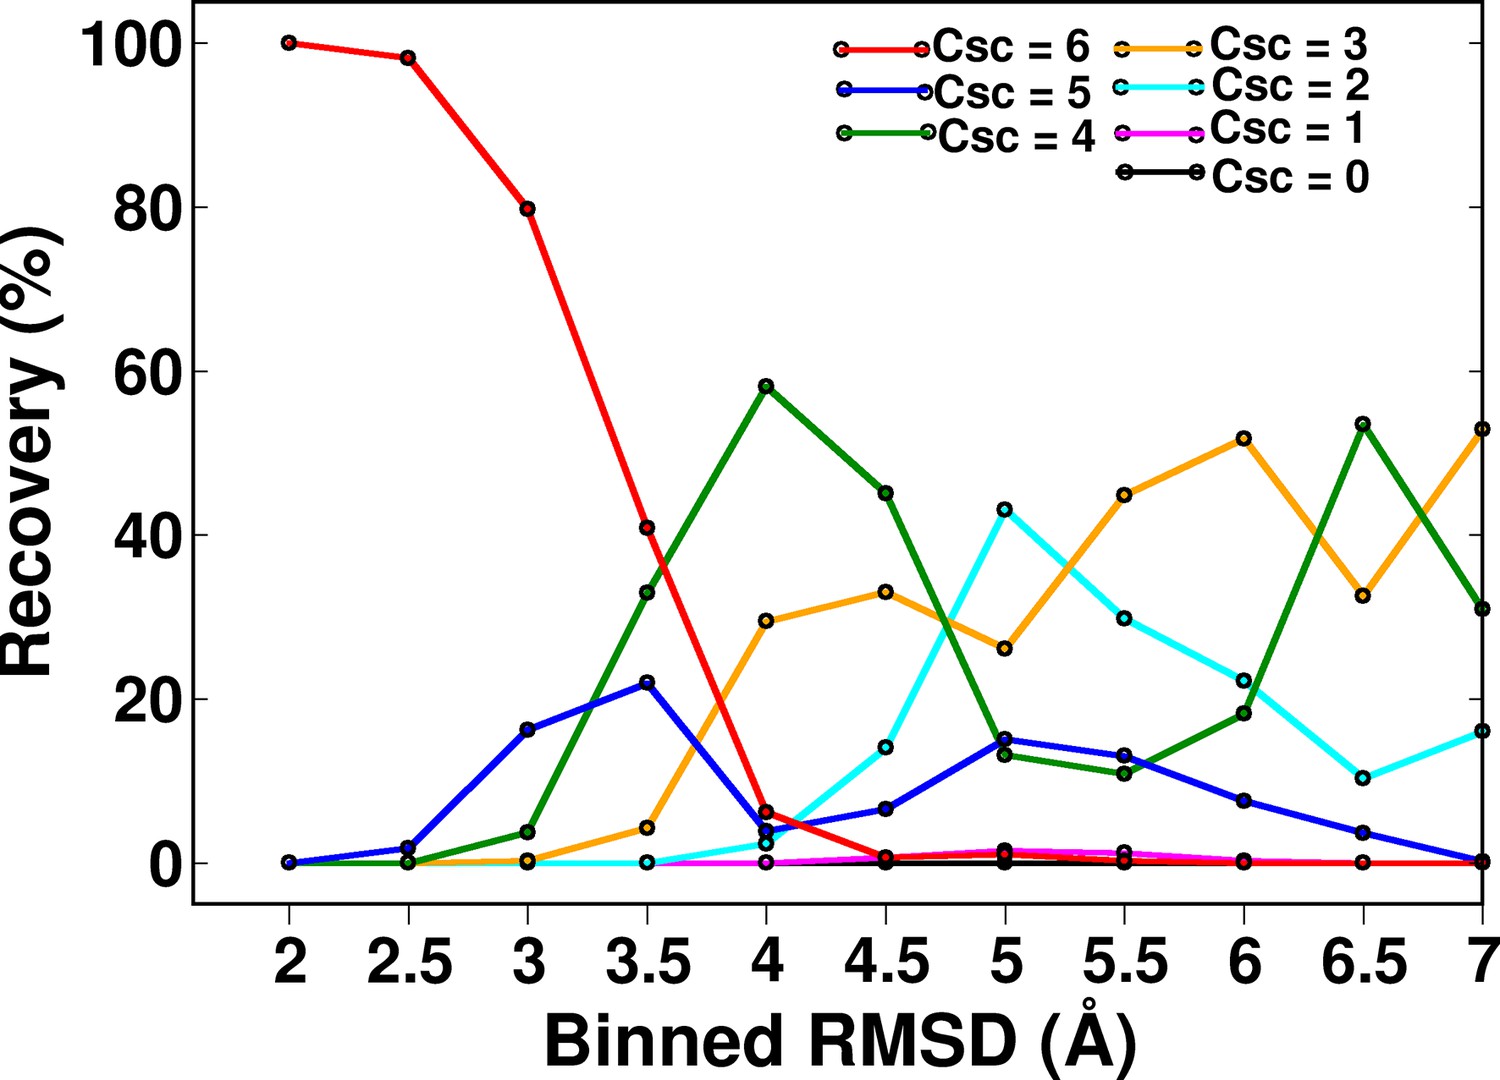
Recovery of CcdB models as a function of different ContactScore (Csc) values using a fixed cut-off contact distance value of <7 Å.
High Csc values recover only low RMSD models. With decreasing CSc values, the fraction of low RMSD models decreases. RMSD bin size is 0.5 Å. Upper limit of each RMSD bin is shown.
Figure 6 with 2 supplements
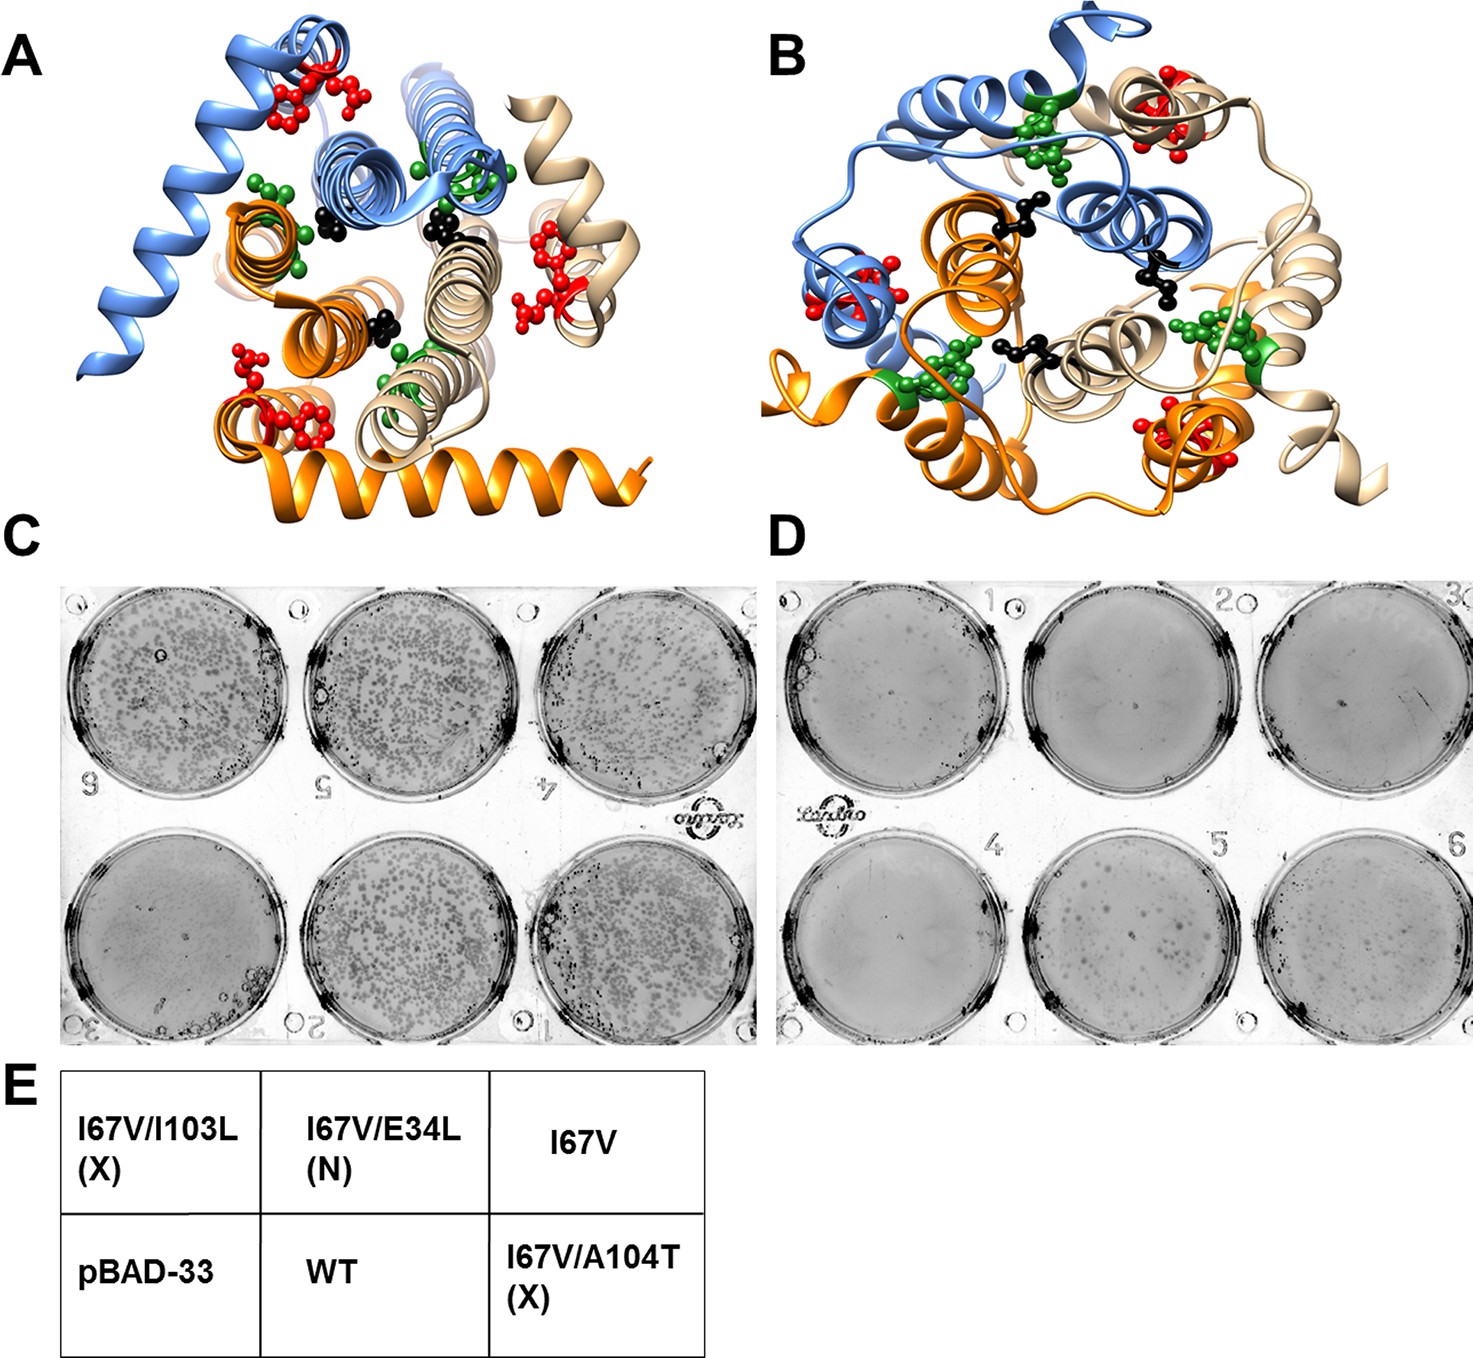
Screening of suppressors for the parent inactive mutant I67V DgkA.
I67 (ball and stick in black) and inter-helical residues in contact with it in either (A) crystal (PDB id 3ZE5 [Li et al., 2013]) or (B) NMR (PDB id 2KDC [Van Horn et al., 2009]) structures of the homotrimeric DgkA are shown. Each monomer of the trimer is shown in a different color. The residues in proximity to I67 in a specific structure are shown in green, while the ones in contact in the alternate structure are highlighted in red. Differential contact pairs for other parent inactive mutants of DgkA have been shown in Figure 6—figure supplement 1. The figure has been prepared using the UCSF Chimera package (developed by Resource for Biocomputing, Visualization, and Informatics at the University of California, San Francisco [Pettersen et al., 2004]). Second-site suppressor libraries of the parent inactive mutant were constructed by randomizing each of the residue partners present in either of the two structures of the protein. Active mutants were screened on selective media at decreasing NaCl concentrations in an E. coli strain knocked out for dgkA. (C) and (D) show the phenotype of the putative suppressors isolated from the libraries at (C) 0.15% NaCl and 0.01% arabinose and (D) 0% NaCl and 0.01% arabinose. Phenotypes of suppressors corresponding to other parent inactive mutants have been shown in Figure 6—figure supplement 2. (E) A representative plate showing the location of the variants and the controls. '(X)' and '(N)' indicate the structure from which the residue partner has been chosen that is either X-ray or NMR structure, respectively. Parent inactive mutant I67V, WT DgkA and the empty vector pBAD-33 act as reference, positive and negative controls, respectively. The true suppressors are anticipated to grow on the plate with low salt concentration while the parent inactive mutant and (Parent inactive mutant, non-suppressor) pairs fail to grow. Suppressors (I67V, I103L) and (I67V, A104T), which are in spatial proximity in the crystal structure restore the growth defect of the parent inactive mutant I67V, whereas the (I67V, E34L) pair which is in proximity only in the NMR structure, fails to restore the growth defect.
Figure 6—figure supplement 1
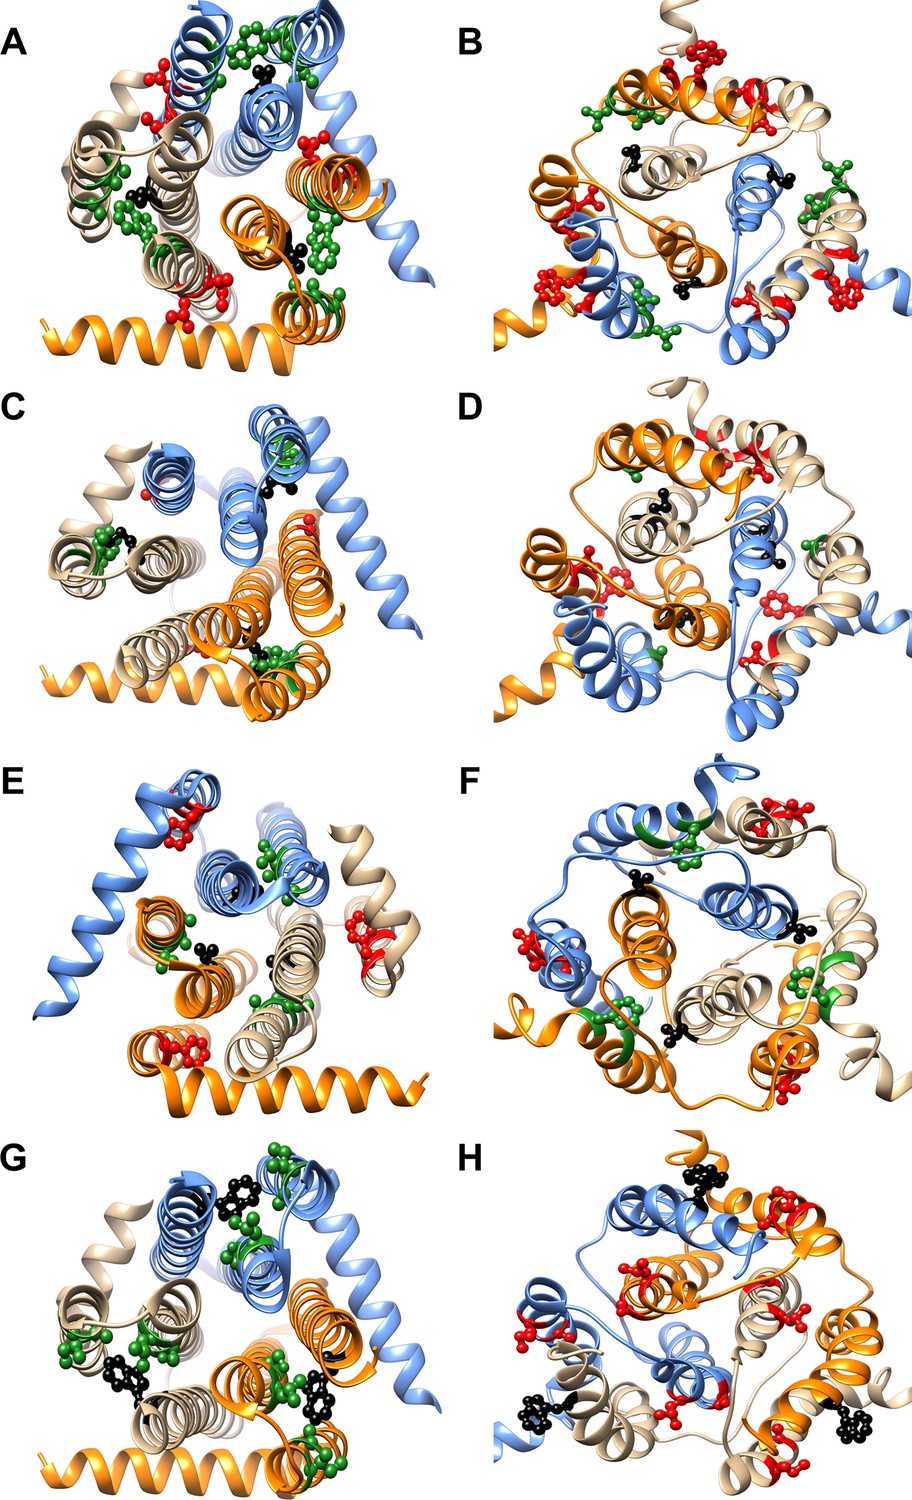
Differential contact residue pairs mapped onto the structures of DgkA.
Parent inactive mutant positions V62 (A, B), M66 (C, D), V68 (E, F) and W112 (G, H) (shown in ball and stick in black) and their corresponding inter-helical contacting partners in the crystal and NMR structures have been mapped onto the (A, C, E, G) X-ray (PDB id 3ZE5 [Li et al., 2013]) and (B, D, F, H) NMR (PDB id 2KDC [Van Horn et al., 2009]) structures of the homotrimeric DgkA protein (shown in ribbon with the three monomers in three different colors). The residues in proximity of the parent inactive mutants in a specific structure are shown in green, while the ones in contact in the alternate structure are highlighted in red. The figure has been prepared using the UCSF Chimera package (developed by Resource for Biocomputing, Visualization, and Informatics at the University of California, San Francisco [Pettersen et al., 2004]).
Figure 6—figure supplement 2
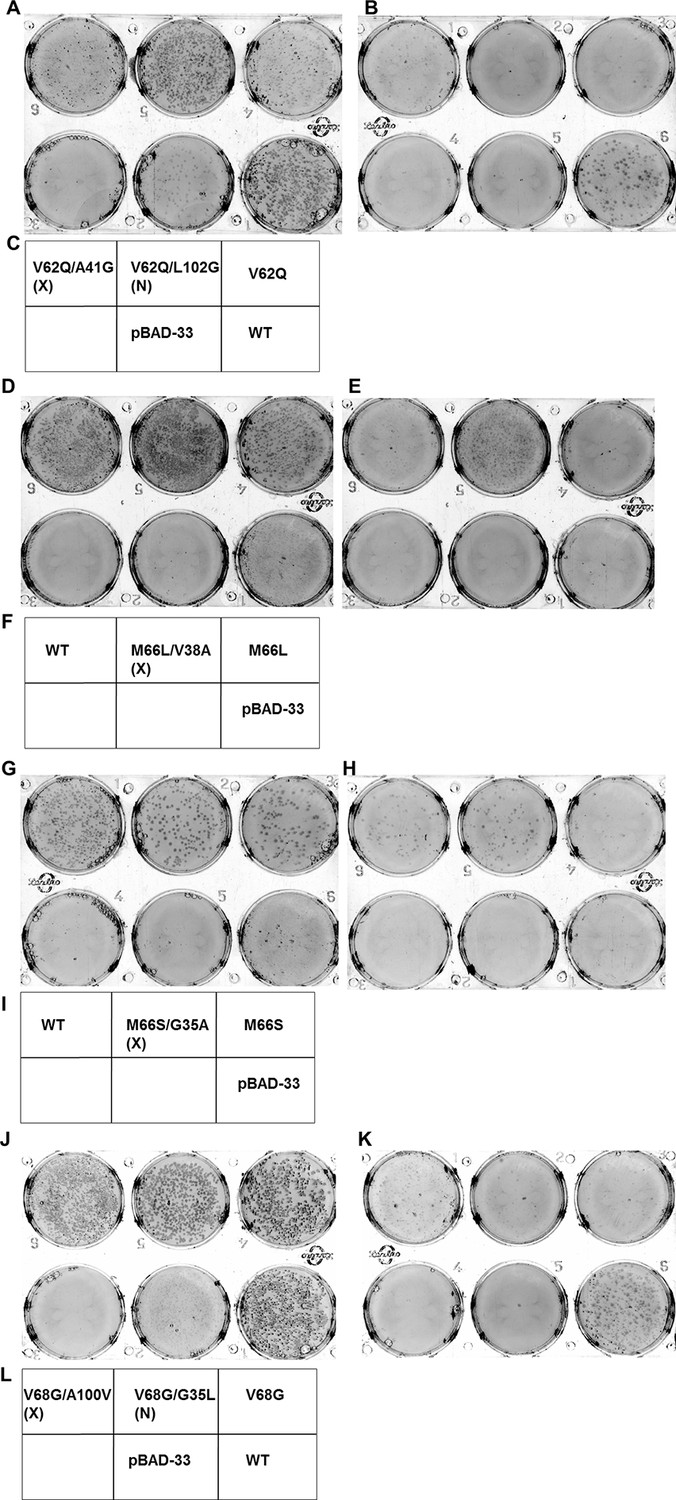
Screening for suppressors of parent inactive mutants of DgkA.
Second-site suppressor libraries of the parent inactive mutants V62Q, M66L, M66S and V68G were constructed by individually randomizing each of the partners in both the NMR and X-ray structures of the protein. Suppressors were identified by screening on selective media at decreasing NaCl concentrations in an E. coli strain deleted for dgkA. (A,B), (D,E), (G,H) and (J,K) show the phenotype of the suppressors isolated from the libraries of V62Q, M66L, M66S and V68G, respectively at (A, D, G, J) 0.15% NaCl, 0.01% arabinose, (B,K) 0%NaCl, 0.01% arabinose and (E, H) 0.03% NaCl, 0.01% arabinose. (C, F, I, L) Representative plate photograph showing the location of the variants and the controls for the screening of suppressors of the parent inactive mutants V62Q (A,B), M66L (D,E), M66S (G,H) and V68G (J,K), respectively. '(X)' and '(N)' indicate the structure from which the residue partner has been chosen that is either X-ray or NMR structure, respectively. Parent inactive mutant, Wild-Type (WT) DgkA and the empty vector pBAD-33 act as reference, positive and negative controls, respectively. The true suppressors are anticipated to appear before the parent inactive mutant on the plate when grown in low salt conditions. Suppressors (V62Q, A41G), (M66L, V38A), (M66S, G35A), (V68G, A100V), which are in spatial proximity in the crystal structure restore the growth defect of the parent inactive mutants. A similar analysis for the parent inactive mutant I67V has been shown in Figure 6C–E. Overall, suppressors were only found at positions proximal to the parent inactive mutant in the X-ray structure of DgkA.
Figure 7 with 1 supplement
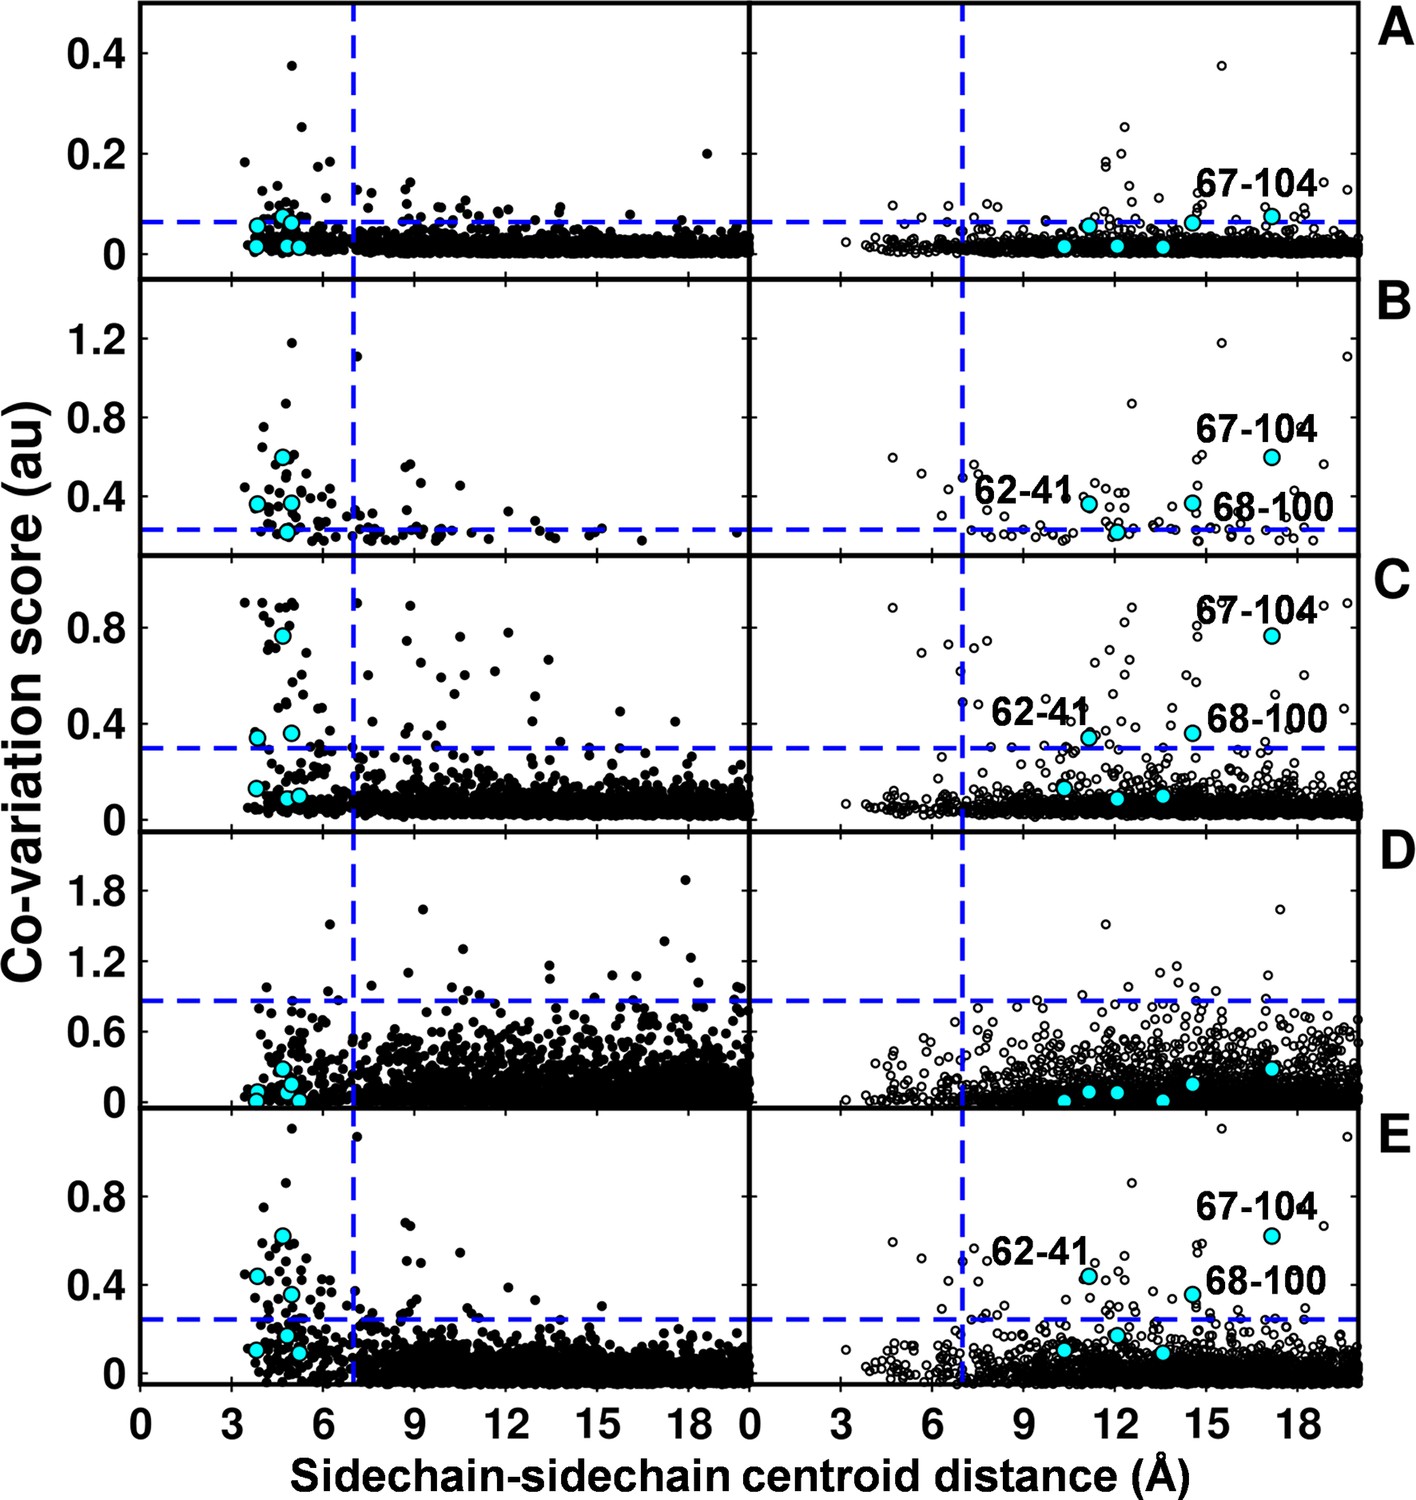
Computational analyses of co-varying residues for DgkA and comparison with experimentally determined contact residue pairs.
Co-variation analyses using (A) DCA, (B) GREMLIN, (C) PSICOV, (D) SCA and (E) EVfold are shown. Residue pair side-chain centroid distances calculated from DgkA crystal (PDB id 3ZE5) and the NMR 1st pose structure (PDB id 2KDC) are shown in left (filled circles) and right (open circles) panels respectively. 'au' denotes arbitrary units. Blue lines parallel to the X-axis indicate the co-variation score of the L/2th residue pair (when arranged in descending order of the score), where L is the length of the protein (L=121 for DgkA). Blue lines parallel to the Y-axis indicate a sidechain–sidechain centroid distance of 7 Å between the predicted co-varying residue pairs in the corresponding structure. Experimentally determined spatially proximal (Parent inactive mutant, suppressor) contact pairs are shown in cyan. Although several computationally predicted contact pairs in the top L/2 predictions (top panel) are proximal to each other in the crystal structure, there are several predicted pairs which are far apart. Computational analyses of co-varying residues for DgkA and comparison with experimentally determined contact residue pairs using Cα-Cα distances instead of sidechain-sidechain centroid distances are shown in Figure 7—figure supplement 1.
Figure 7—figure supplement 1
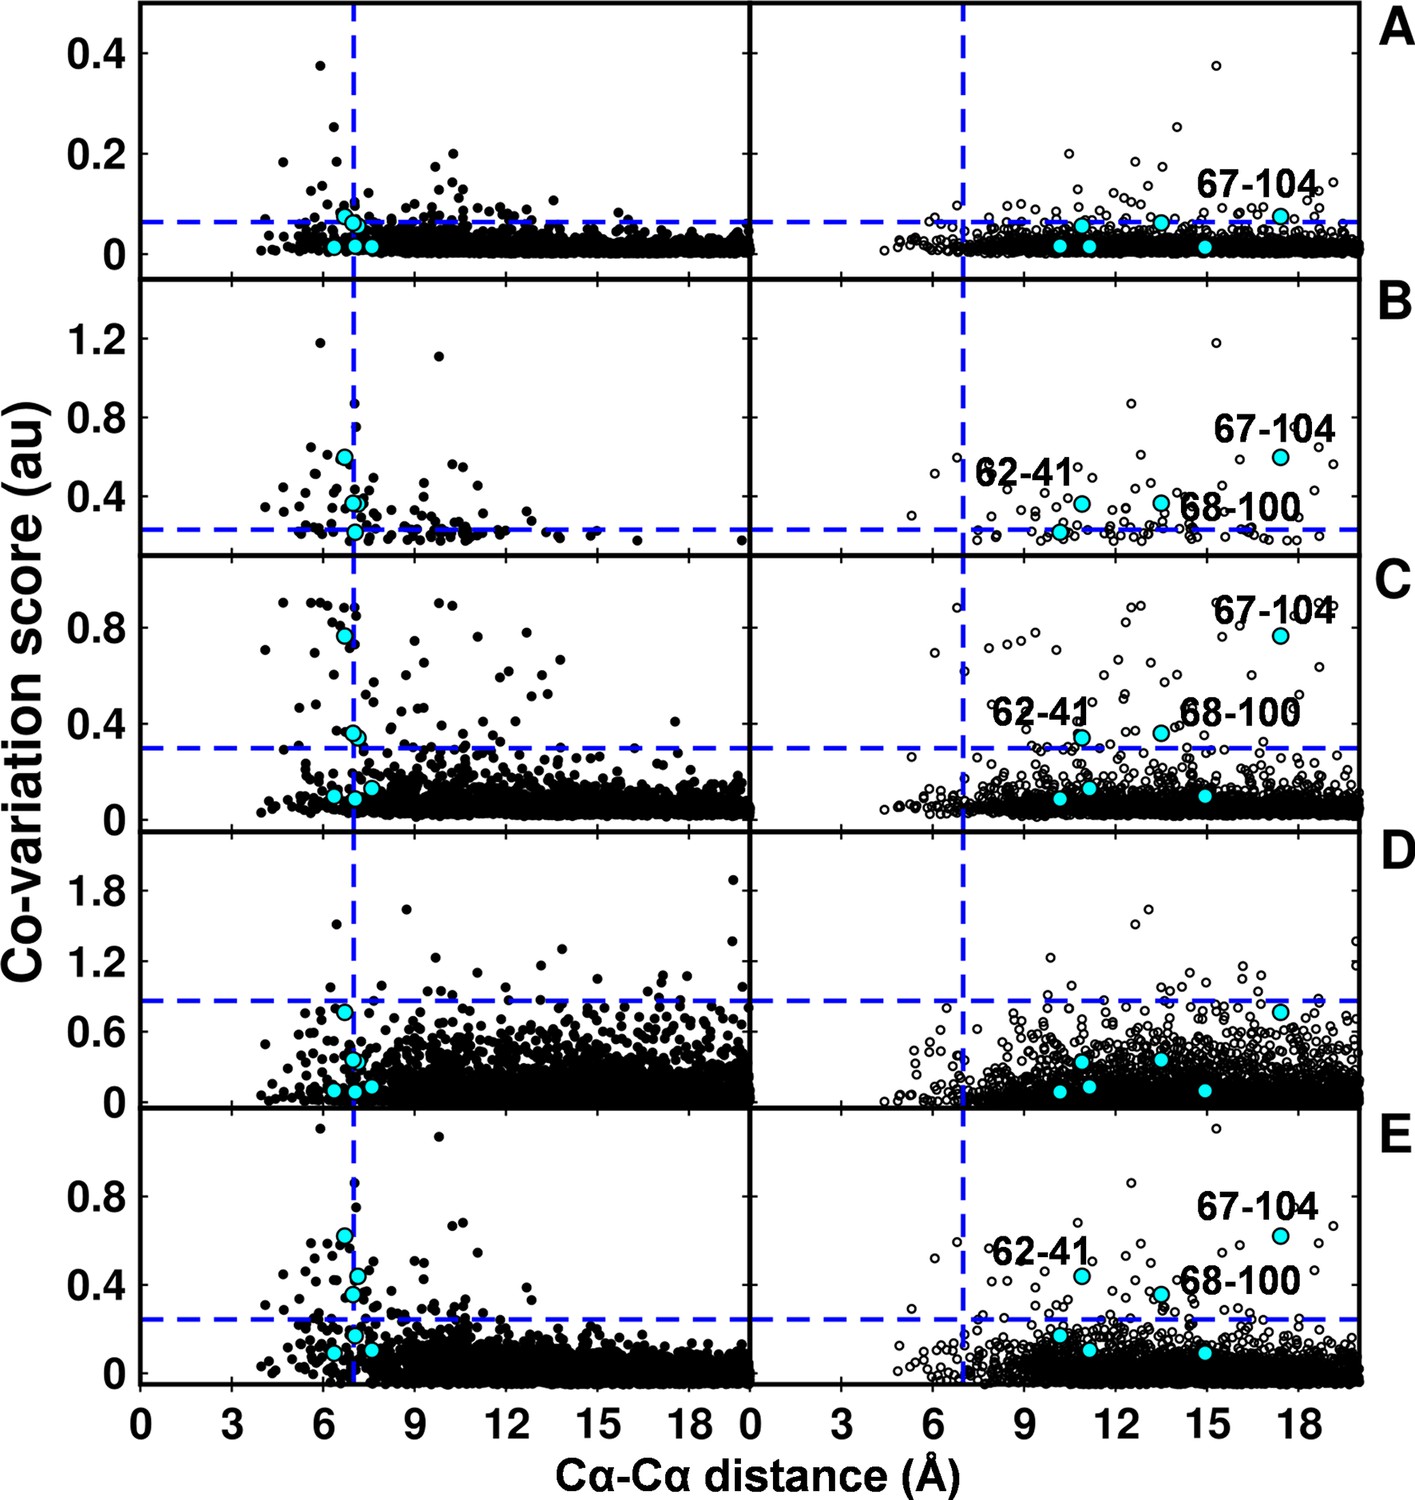
Computational analyses of co-varying residues for DgkA and comparison with experimentally determined contact residue pairs using Cα-Cα distances instead of sidechain-sidechain centroid distances.
Co-variation analyses using (A) DCA, (B) GREMLIN, (C) PSICOV, (D) SCA and (E) EVfold are shown. Residue pair Cα distances calculated from DgkA crystal (PDB id 3ZE5) and NMR 1st pose structure (PDB id 2KDC) are shown in left (filled circles) and right (open circles) panels respectively. 'au' denotes arbitrary units. Blue lines parallel to the X-axis indicate the co-variation score of the L/2th residue pair (when arranged in descending order of the score), where L is the length of the protein (L=121 for DgkA). Blue lines parallel to the Y-axis indicate a distance of 7 Å between the predicted co-varying residue pairs in the corresponding structure. Experimentally determined spatially proximal (Parent inactive mutant, suppressor) contact pairs are shown in cyan.
Figure 8 with 1 supplement
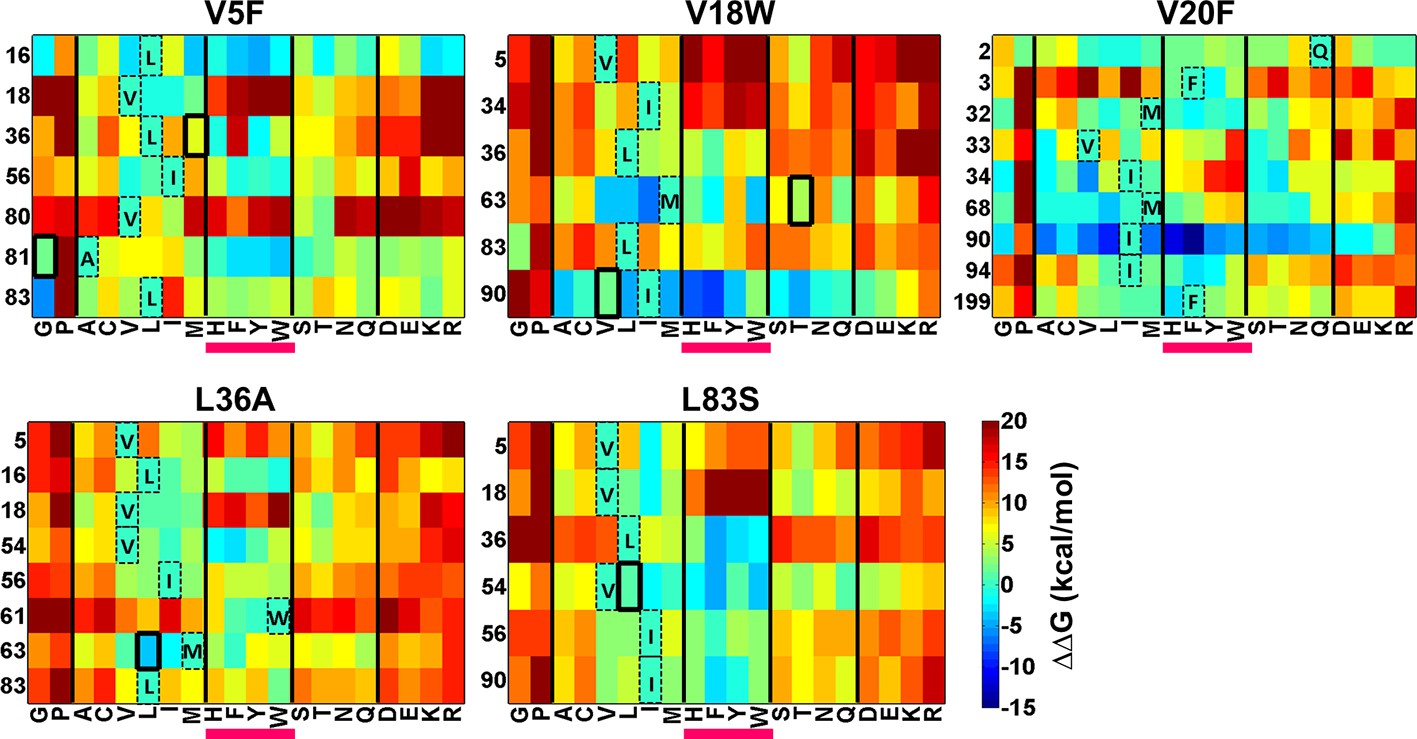
Heatmaps showing calculated values of ∆∆Gfolding using Rosetta for double mutants of CcdB.
All 19 mutations (X-axes) were made at positions (Y-axes) whose side chain centroids are within 7 Å of the side chain centroid of the corresponding parent inactive mutant. The parent inactive mutants are indicated in bold on the top of each heatmap. For example, the bottom left corner of the first panel represents the ∆∆G value for the (V5F, L83G) (Parent inactive mutant, suppressor) pair. Position 199 (98+101) in the V20F heatmap refers to residue 98 of the other protomer. Wild type residues are shown in dashed boxes in single letter code. Experimentally obtained suppressors are indicated by thick black boxes. Double mutants showing negative values of ∆∆Gfolding (blue shades) are ones where the putative suppressor mutation is predicted to have a stabilizing effect on the inactive mutant. Aromatic substitutions are underlined in magenta. Residues on X-axis are grouped into the following classes, separated by thick vertical lines: (G,P), aliphatic (A,C,V,L,I,M), aromatic (H,F,Y,W), polar (S,T,N,Q) and charged (D,E,K,R).Similar analysis was performed using FoldX (Figure 8—figure supplement 1).
Figure 8—figure supplement 1
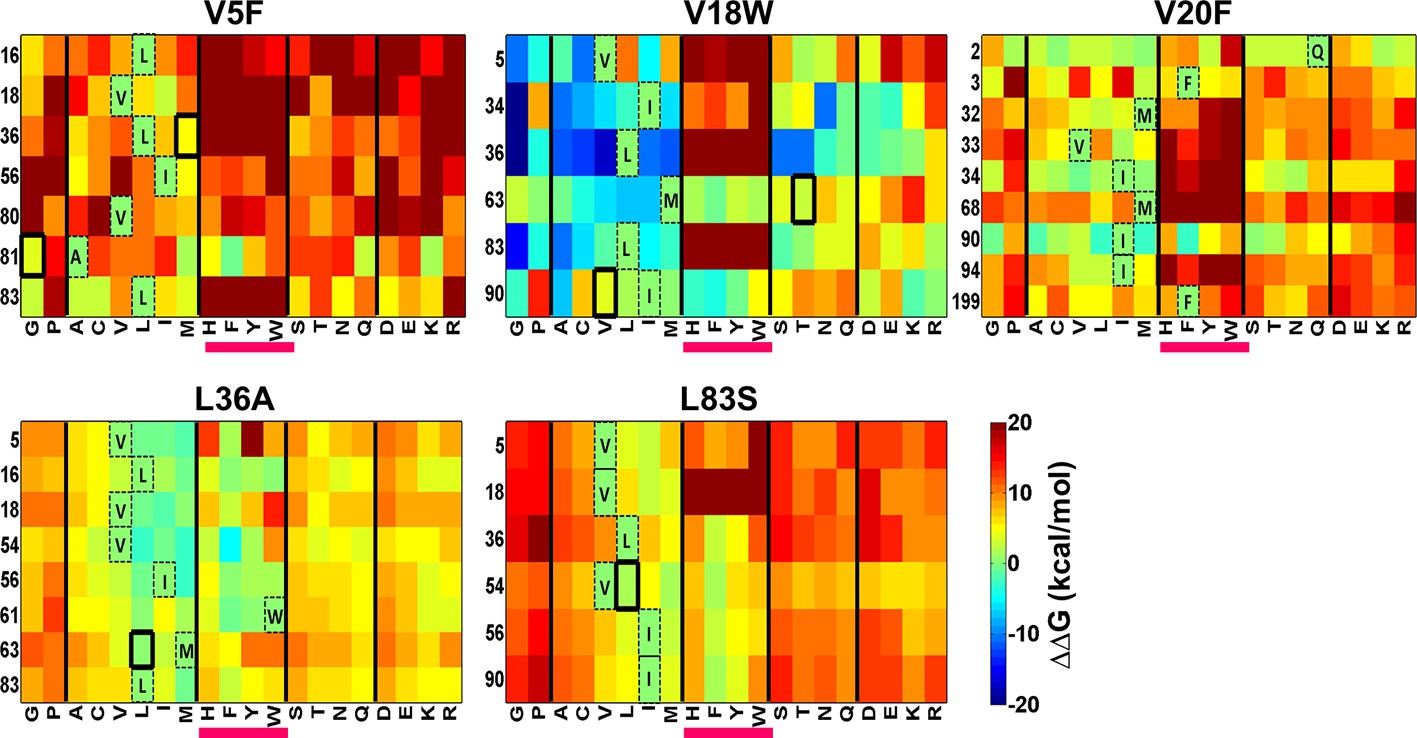
Heatmaps showing calculated values of ∆∆Gfolding using FoldX for double mutants of CcdB.
All 19 mutations (X-axes) were made at positions (Y-axes) whose side chain centroids are within 7 Å of the side chain centroid of the corresponding parent inactive mutant. The parent inactive mutants are indicated in bold on the top of each heatmap. Position 199 (98+101) in the V20F heatmap refers to residue 98 of the other protomer. Wild type residues are shown in dashed boxes in single letter code. Experimentally obtained contact pairs are indicated by thick black boxes. Double mutants showing negative values of ∆∆Gfolding (blue shades) are ones where the putative suppressor mutation is predicted to have a stabilizing effect on the inactive mutant. Aromatic substitutions are underlined in magenta. Residues on the X-axis are grouped into the following classes, separated by thick vertical lines: (G,P), aliphatic (A,C,V,L,I,M), aromatic (H,F,Y,W), polar (S,T,N,Q) and charged (D,E,K,R).
Author response image 1
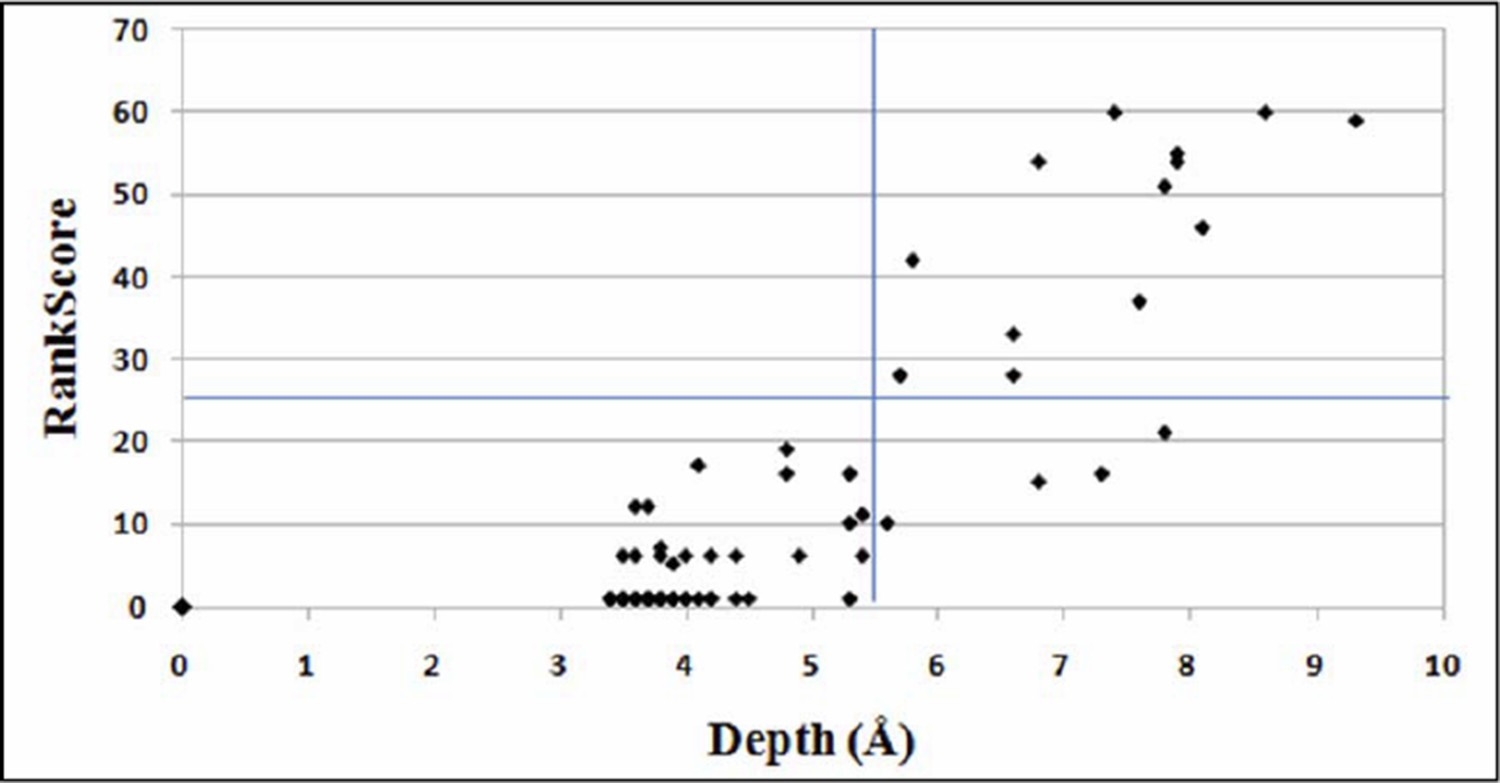
Plot for variation of RankScore with respect to the residue depth.
An average depth of ≥ 5.5Å corresponds to an average accessibility of ≤5% (Tan et al., 2014). The line parallel to X-axis indicates RankScore cutoff of 25 and the line parallel to Y-axis indicates depth of 5.5Å.
Author response image 2
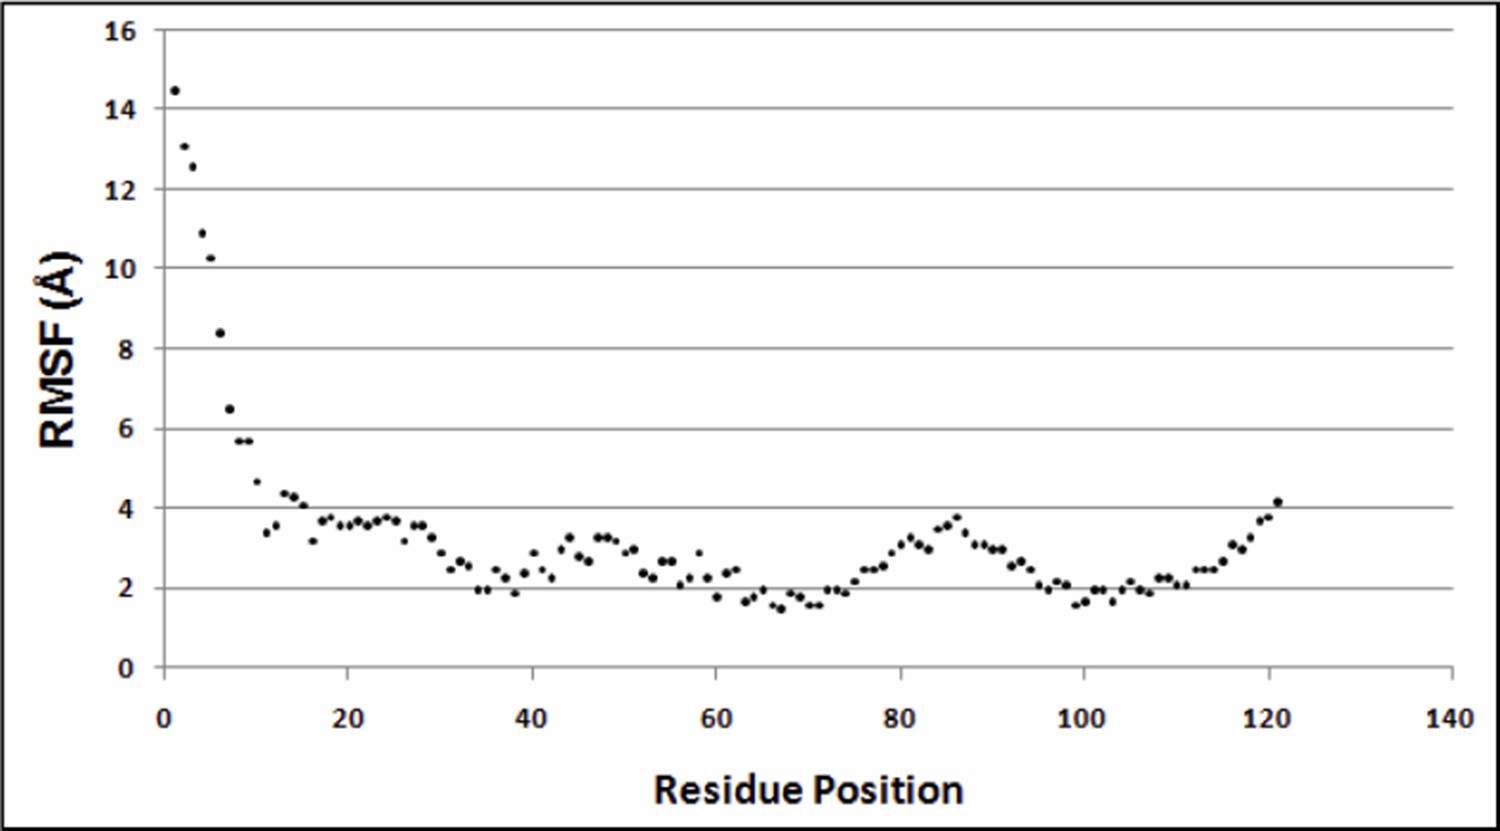
Variation of RMSF w.r.t. residue positions.
https://doi.org/10.7554/eLife.09532.030
Author response image 3
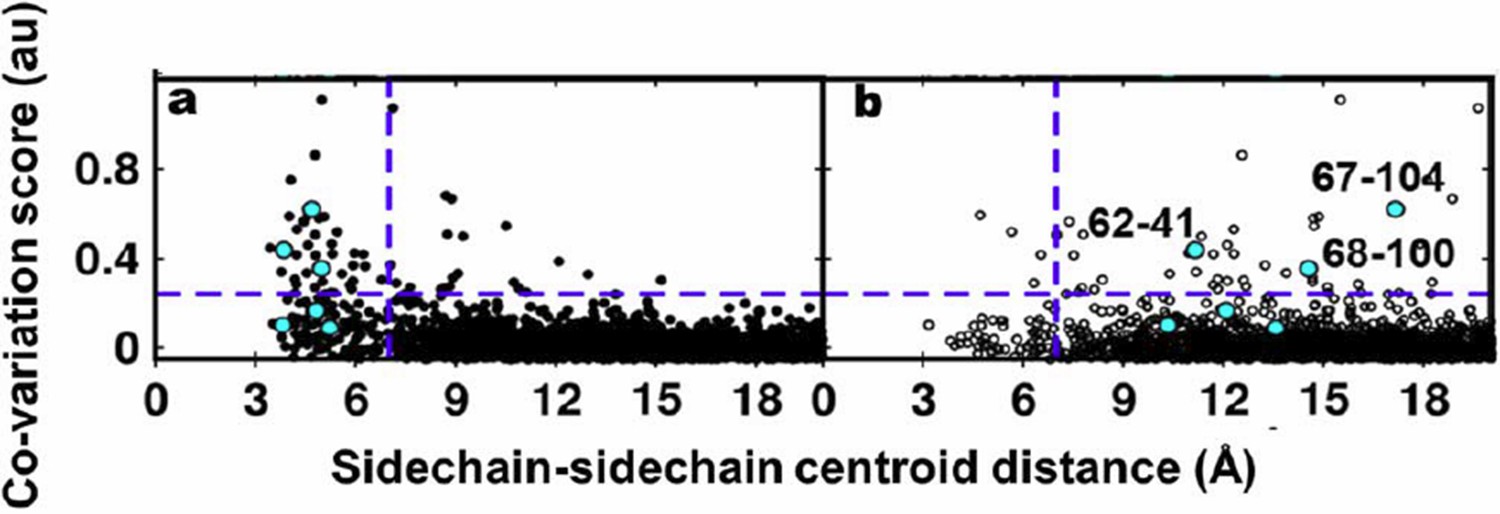
Residue coupling score obtained from EVfold is plotted against the sidechain-sidechain centroid distances calculated from a) the X-ray and b) the NMR structures.
Blue lines parallel to the X-axis indicate the co-variation score of the L/2th residue pair (when arranged in descending order of the score), where L is the length of the protein (L=121 for DgkA). Blue lines parallel to the Y-axis indicate a sidechain–sidechain centroid distance of 7Å which was used as the cutoff to define residue contacts. Experimentally determined spatially proximal (PIM, suppressor) contact pairs are shown in cyan.
Author response image 4
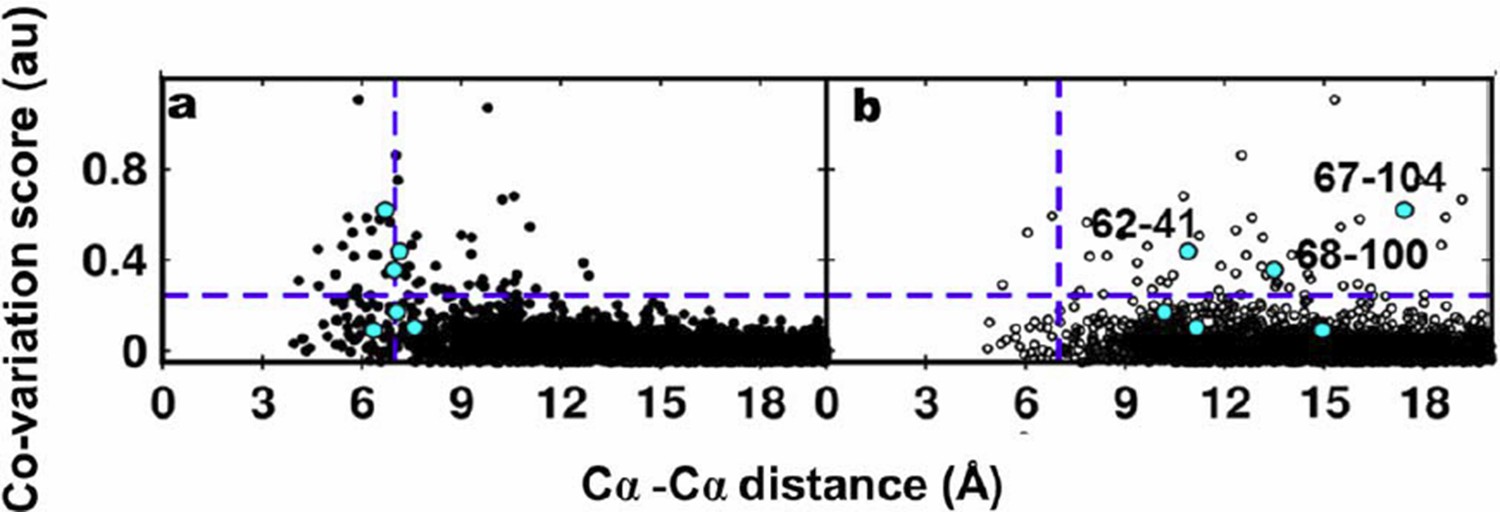
Residue coupling score obtained from EVfold is plotted against the Cα-Cα distances calculated from a) the X-ray and b) the NMR structures.
Blue lines parallel to the X-axis indicate the co-variation score of the L/2th residue pair (when arranged in descending order of the score), where L is the length of the protein (L=121 for DgkA). Blue lines parallel to the Y- axis indicate the distance of 7Å which was used as the cutoff to define residue contacts. Experimentally determined spatially proximal (PIM, suppressor) contact pairs are shown in cyan.
Author response image 5
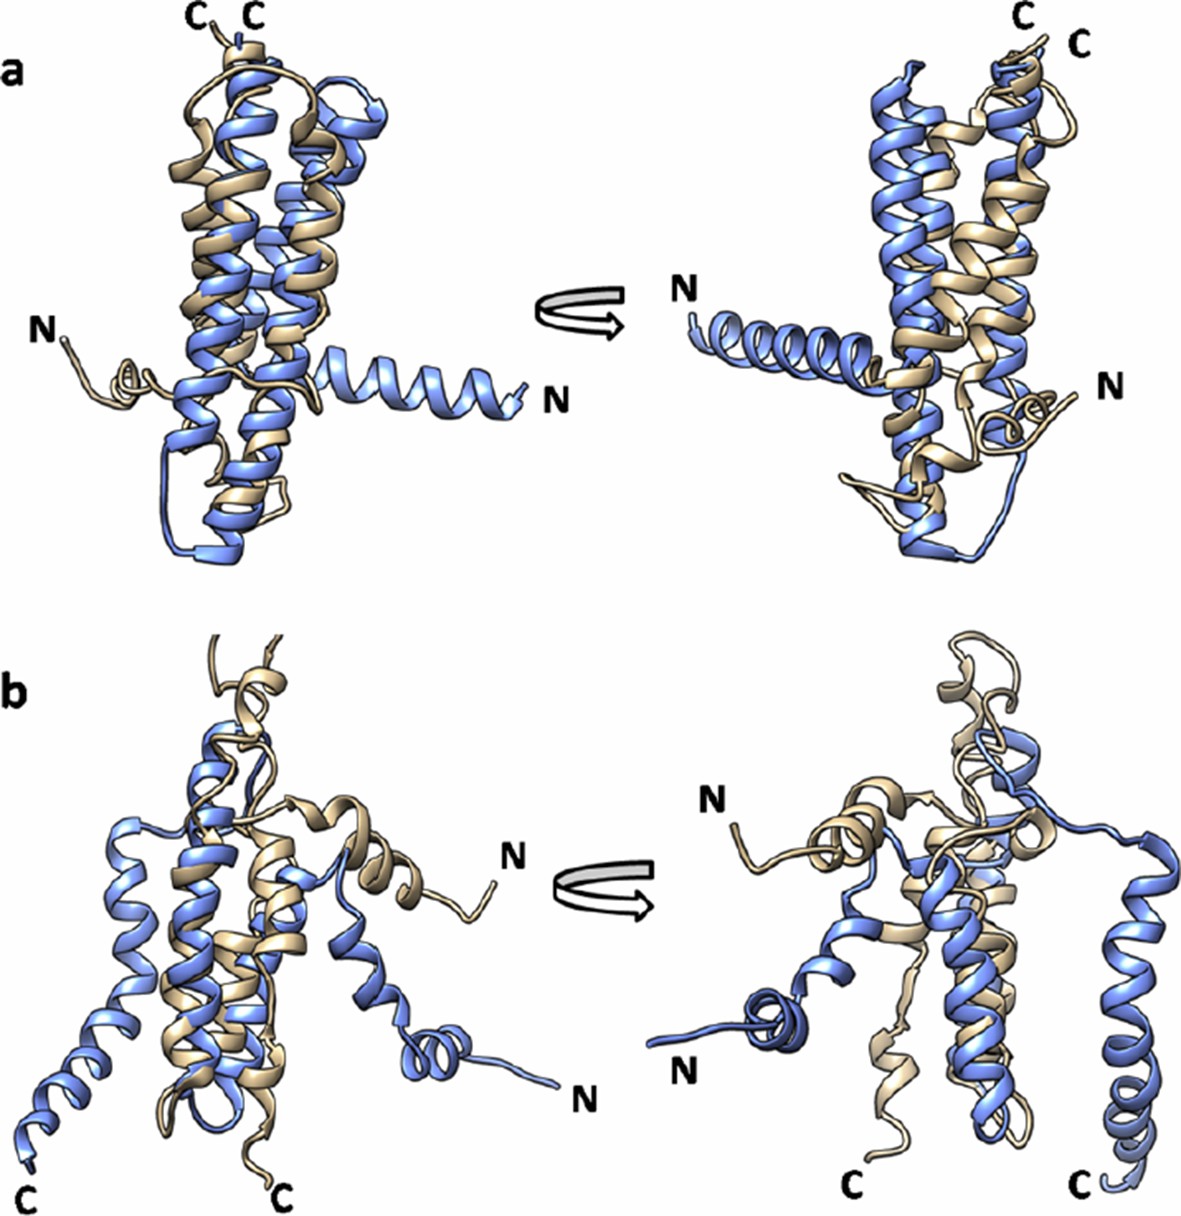
Superimposition of EVfold model onto the (a) X-ray structure (PDB id: 3ZE5) and (b) the NMR structure of DgkA (PDB id: 2KDC).
EVfold model is shown in tan and the X-ray and NMR structures are shown in light blue.
Videos
Video 1
Experimentally obtained (Parent inactive mutant, suppressor) pairs mapped onto the crystal structure of CcdB (PDB id 3VUB), related to Figure 3. Parent inactive mutant is abbreviated as PIM in the video.
https://doi.org/10.7554/eLife.09532.010
Video 2
Experimentally obtained (Parent inactive mutant, suppressor) pairs mapped onto the two structures of DgkA (NMR PDB id 2KDC and X-ray PDB id 3ZE5) exhibit spatial proximity only in the corresponding crystal structure. Parent inactive mutant is abbreviated as PIM in the video.
https://doi.org/10.7554/eLife.09532.021Tables
Table 1
Experimentally determined (Parent inactive mutant, suppressor) pairs for CcdB occur at both spatially proximal and distal residues.
| Parent inactive mutant (X) | Suppressor Mutant (Y) | ASA (%) | Depth (Å) | RankScorea | Shortest distanceb (Å) | Centroid-centroid distancec (Å) |
|---|---|---|---|---|---|---|
| V5Fd | 0 | 6.8 | 54 | |||
| L36Md,e | 0 | 7.3 | 83 | 3.9 | 5.5 | |
| A81Gd,e | 32.4 | 3.9 | 26 | 2.8 | 4.2 | |
| V18W | 0 | 9.3 | 59 | |||
| M63Te | 0.1 | 8.1 | 46 | 4.2 | 5.8 | |
| I90Ve | 0.1 | 7.4 | 60 | 4.8 | 5.9 | |
| V20F | 0 | 8.6 | 60 | |||
| E11Rf | 112.7 | 3.4 | 1 | 18.4 | 22.4 | |
| E11Kf | 112.7 | 3.4 | 1 | 18.4 | 22.4 | |
| L36A | 0 | 7.3 | 83 | |||
| M63Le | 0.1 | 8.1 | 46 | 3.8 | 6.4 | |
| R10Gf | 76.6 | 3.6 | 1 | 11.6 | 18.1 | |
| E11Pf | 112.7 | 3.4 | 1 | 11.7 | 16.8 | |
| L83S | 1.5 | 5.8 | 42 | |||
| V54Le | 0.4 | 5.7 | 28 | 3.9 | 4.5 |
-
aRankScore for residues X or Y estimated from phenotypic screening of single-site saturation mutagenesis library of CcdB and deep sequencing (Adkar et al., 2012)
-
bShortest distance between residues X and Y
-
cDistance between side chain centroids of residues X and Y
-
dThe suppressors (Y) were identified as a triple mutant with the parent inactive mutant (X) V5F, that is V5F/L36M/A81G
-
eSuppressor residues spatially proximal to parent inactive mutant
-
fSuppressor residues distal from the parent inactive mutant
-
Heavy atoms of the residues are considered for calculating distances using the crystal structure of CcdB, PDB id 3VUB (Loris et al., 1999).
Table 2
Experimentally determined (Parent inactive mutant, Suppressor) pairs for DgkA are spatially close only in the corresponding crystal structure.
| Parent inactive mutant position | Contact partnersa in X-ray structureb | Contact partnersa in NMR structurec | Experimentally identified (Parent inactive mutant, Suppressor) pairs |
|---|---|---|---|
| V62 | A41, 108, W112 | L102, I103 | (V62Q, A41G) |
| M66 | F31, G35, V38 | A99 | (M66L, V38A) (M66S, G35A) |
| I67 | A100, I103, A104 | F31, E34 | (I67V, I103L) (I67V, A104T) |
| V68 | A100,V101, A104 | F31, G35 | (V68G, A100V) |
| W112 | A41, I44, L58,S61 | - | d |
-
aInter-helical contact pairs (see Materials and methods for details)
-
bX-ray structure of DgkA (PDB id 3ZE5 [Li et al., 2013])
-
cNMR structure of DgkA (PDB id 2KDC [Van Horn et al., 2009])
-
dNo suppressors for this parent inactive mutant could be isolated, probably because the large volume change in the parent inactive mutant (W112V) is difficult to compensate by a single suppressor mutation.
-
-No inter-helical contacts
Additional files
-
Supplementary File 1
Summary of sort details for different libraries of CcdB
- https://doi.org/10.7554/eLife.09532.026
-
Supplementary File 2
Relative expression, binding and stabilities of parent inactive mutants and their suppressors in the case of CcdB
- https://doi.org/10.7554/eLife.09532.027
-
Supplementary File 3
Sidechain-sidechain centroid distances and shortest distances between the listed residue pairs for putative differential contacts between DgkA X-ray and NMR structures.
Experimentally observed (Parent inactive mutant, suppressor) pairs are indicated in bold. Main chain atoms and hydrogen atoms are not considered in the calculations.
- https://doi.org/10.7554/eLife.09532.028
Download links
A two-part list of links to download the article, or parts of the article, in various formats.
Downloads (link to download the article as PDF)
Open citations (links to open the citations from this article in various online reference manager services)
Cite this article (links to download the citations from this article in formats compatible with various reference manager tools)
Residue proximity information and protein model discrimination using saturation-suppressor mutagenesis
eLife 4:e09532.
https://doi.org/10.7554/eLife.09532


